1. Introduction
Maspin is a protease inhibitor of the serpin family, known to have tumor suppressor activity. First identified in 1994 [
1], maspin was called a multifaced protein, because it interacts with diverse groups of intercellular and extracellular proteins, and regulates cell adhesion, motility, apoptosis, and angiogenesis [
2]. Some human cancers, such as breast carcinoma and squamous cell carcinoma, had a prognostic related to maspin expression [
3]. The loss of the maspin gene expression is correlated with an increasing invasiveness and the spreading of metastatic cells in vivo and in vitro [
4]. Recently, some progress was recorded in proving that maspin can be used as biomarker for diagnosis and prognosis of tumors; it can also suggest tumor suppression and there are some cancer interventions which are maspin-based [
5]. A very important pathological feature is the inverse correlation of microvessel density and p53 which indicates a regulatory effect on maspin and also the anti-angiogenesis effect associated with maspin [
5]. Maspin also proved to be a prognostic marker for early stage colorectal cancer with microsatellite instability [
6], as well as a biomarker for early recurrence in primary stage III and IV of colorectal cancer [
7]. Umekita found that expression of maspin may be correlated with the aggressiveness of colorectal adenocarcinomas; its expression tends to decrease during the development of colon cancer from adenoma of early colon cancer, adenocarcinoma and then to metastatic tumor [
8]. Its quantification using reliable methods is essential [
7,
8]. Studies dedicated to deciphering the metabolic mechanism indicated that the nuclear localization of maspin in cancer cells is essential for its tumor suppression activity and that if maspin is localized in the nucleus, it binds to chromatin to prevent cell division. Regarding the intracellular and extranuclear distribution, maspin is predominantly cytoplasmic, but can also be located in other cellular compartments from where it is subsequently secreted. The secreted maspin binds to the components of the extracellular matrix. A plausible hypothesis is that maspin exerts its role only in the nucleus at the level of gene or chromatin regulation and in this way, it indirectly affects the interaction between the cell and the matrix, being released as a consequence of cell damage/necrosis [
9,
10,
11,
12].
This paper proposed, based on the determination of the concentration of maspin in whole blood, saliva, urine, and tumoral tissue using reliable stochastic sensors [
13], to correlate these concentrations with location, maximum diameter, and pN values from TNM staging system (using tissular maspin), budding, mucinous compound, and macroscopic features (using salivary maspin), and pT values from TNM staging system, budding, and molecular subtype (using urinary maspin). These correlations may have, as a feature, a fast diagnostic of colon cancer, with the possibility of a personalized treatment based on the determination of maspin concentration using a cost-effective method using stochastic microsensors.
2. Patients and Methods
2.1. Patient Description
A total of 31 patients confirmed with colorectal cancer, selected from the database of the project GRAPHSENSGASTROINTES, were considered for this study. The including criterion is based on a random selection of patients by the date of when the surgical intervention occurred; thus, patients which came over a span of 2 months were chosen. Informed consent was received from each of the patients before collecting the biological samples. The following samples were collected, screened, and used in the study: 31 whole blood samples, 30 tumor samples, 23 urine samples, and 22 saliva samples. All the samples were collected immediately after the diagnosis with colon cancer and before any type of treatment was provided. Protocol used for the collection of the samples was in accordance with with the Ethics Committee’s approval, nr. 32647/2018, awarded by the County Emergency Hospital from Targu-Mures. The parameters and patients’ pathological features were chosen from the database of County Emergency Hospital from Targu-Mures, where the pathologists and geneticists evaluated each case and completed the database. The access to these data was granted by the project number PN-III-P4-ID-PCCF-2016-0006 within PNCDI III.
2.2. Materials and Reagents
All chemicals used were of analytical grade. Maspin extract was purchased from Sigma Aldrich (St. Louis, MO, USA) and paraffin oil (d420, 0.86 g/cm
3) from Fluka. The stochastic sensors were designed and characterized as described earlier [
13].
2.3. Device Used in Research
All the measurements were performed using an Autolab PGSTAT 302 (Metrohm, Herisau, Switzerland) connected to a computer equipped with the GPES software. The electrochemical cell included the stochastic microsensor, the reference electrode (Ag/AgCl) and the auxiliary electrode (Pt). The construction of the stochastic microsensor comprised the following steps [
13]: the NS co-doped graphene powder was mixed with paraffin oil to form a homogeneous paste; this paste was mixed with a solution of maltodextrine (1 × 10
−3 mol L
−1)—to 100 mg paste were added 100 μL from the maltodextrin solution—to form the modified paste; each modified paste was placed in non-conducting plastic tubes with inner diameter of 150 μm, and a length of 5 mm; silver wire served as contact between the paste and the external circuit. The stochastic microsensors were washed with deionized water and dried between measurements. When not in use, they were kept in a dry place.
2.4. Stochastic Method
The stochastic method was used for identification and quantification of maspin in the biological samples.
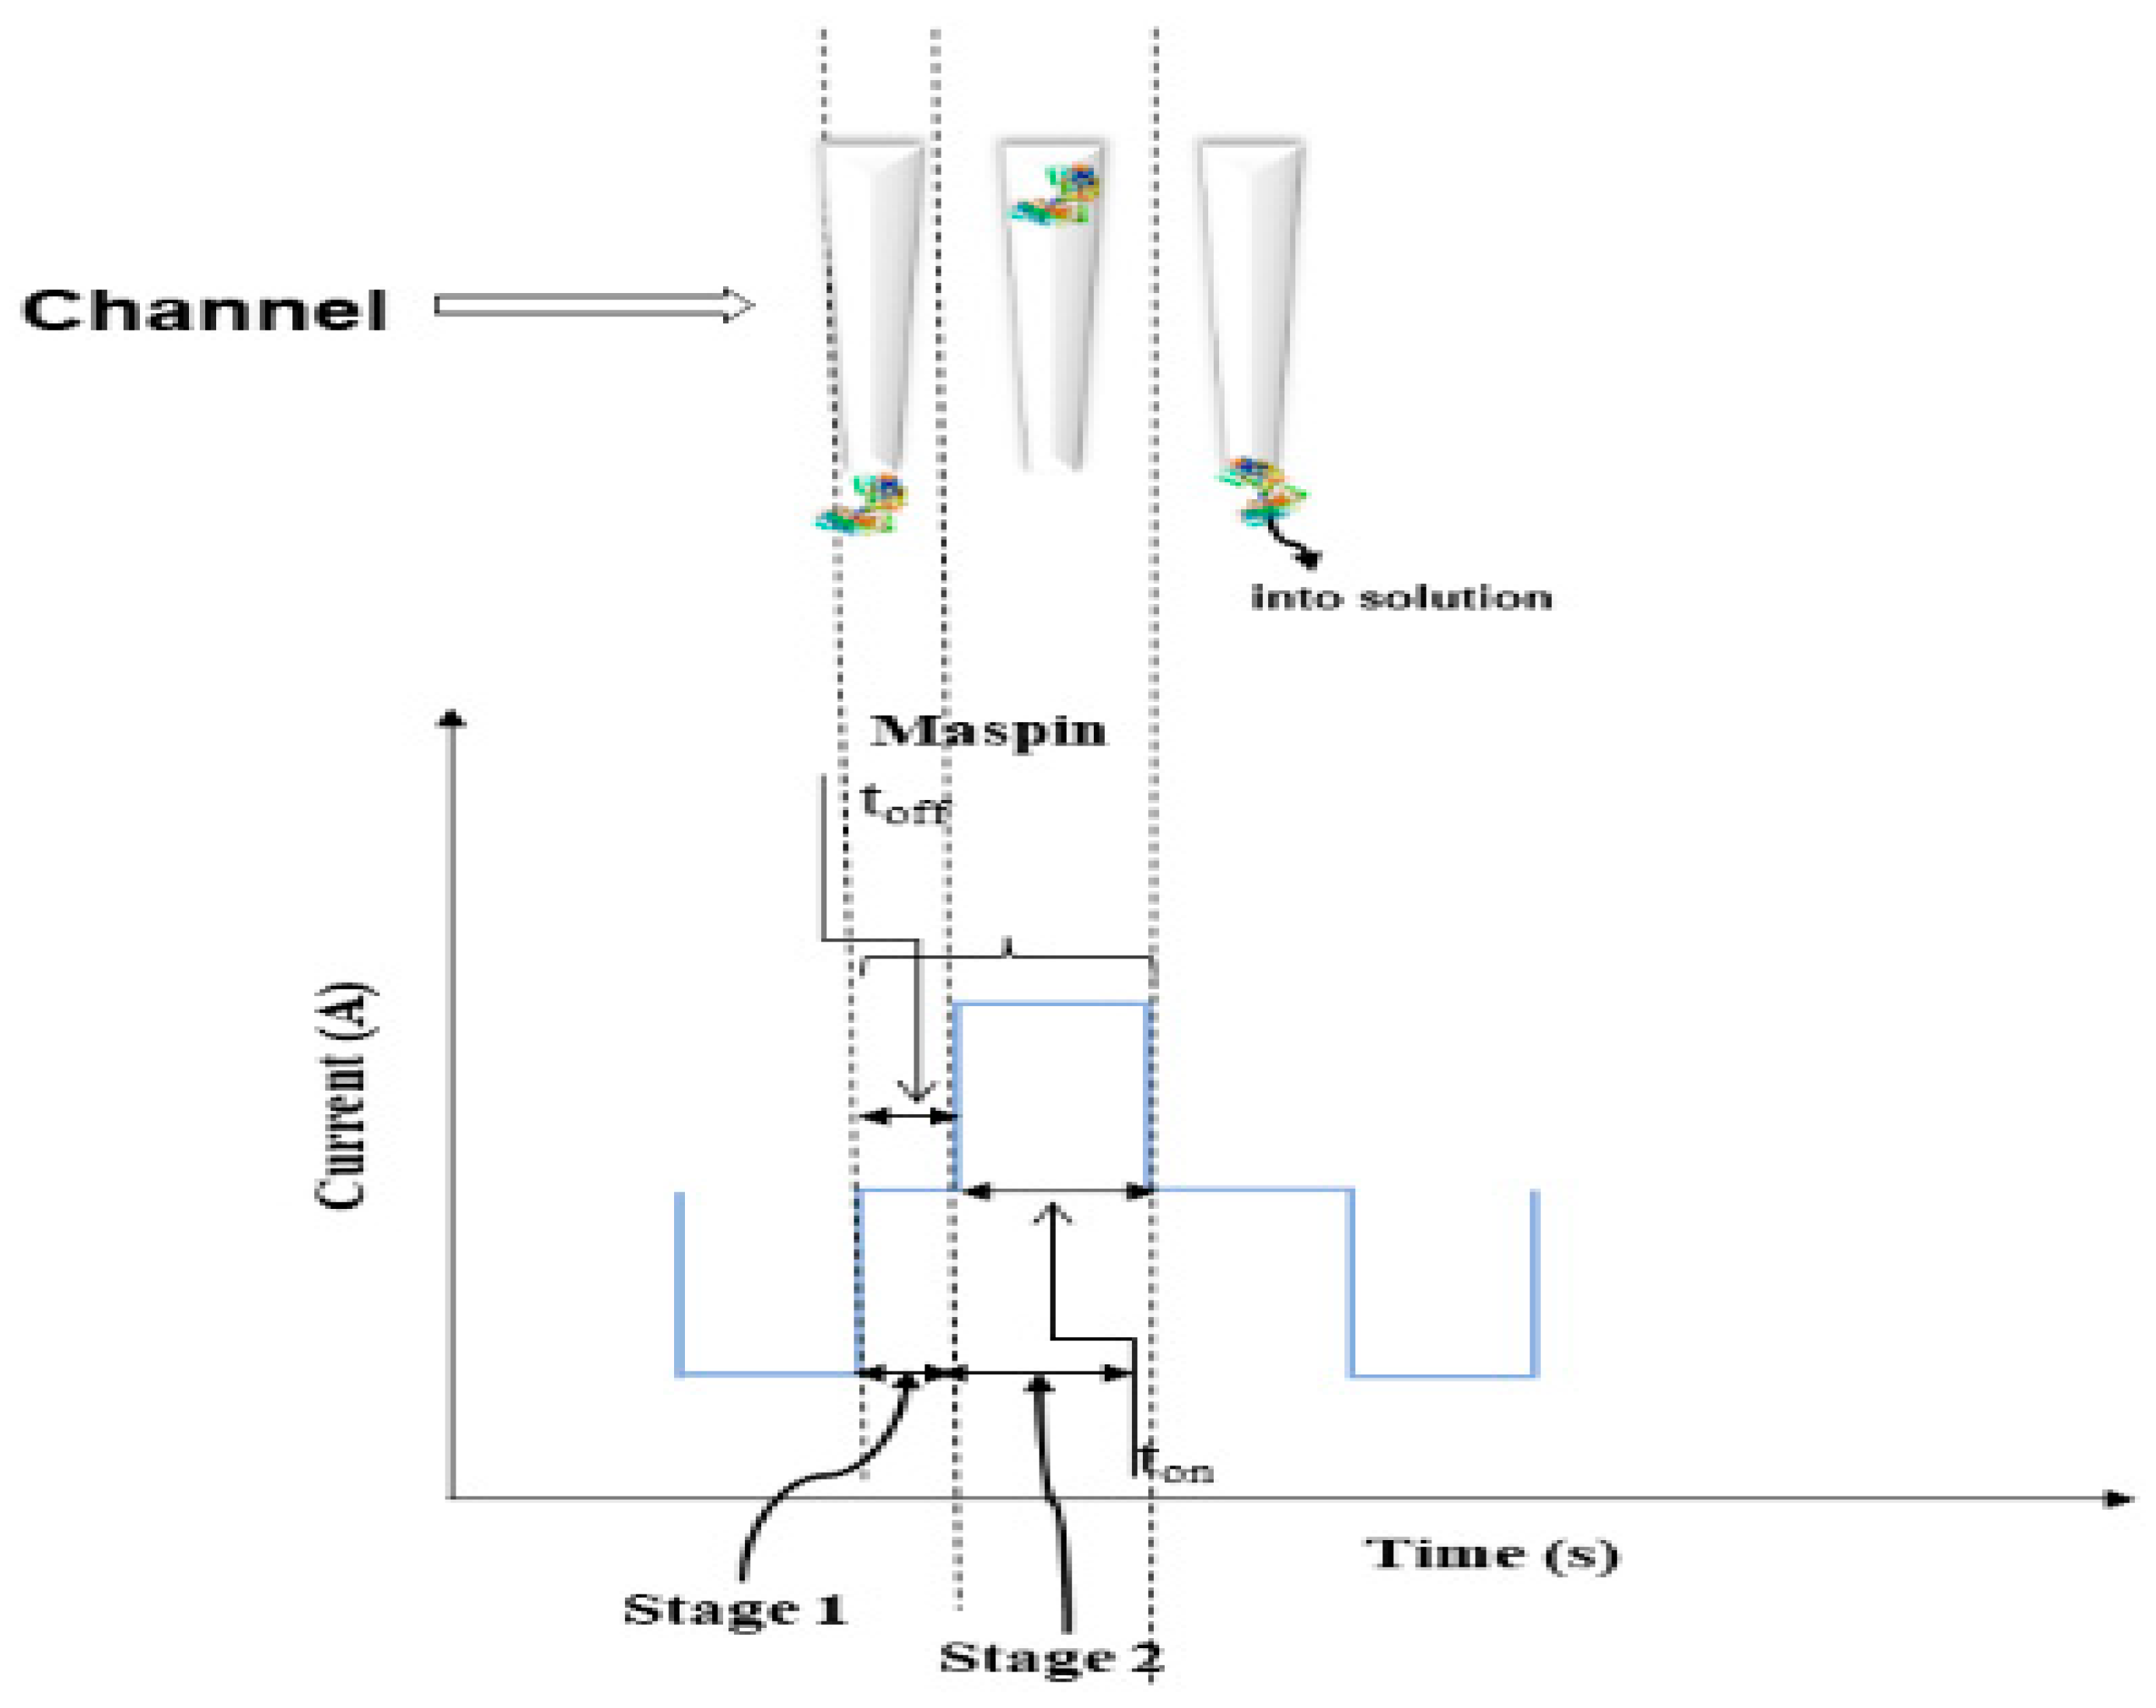
The current development in stochastic sensors is based on channel conductivity: when the biomarker is entering the channel, the current value is dropping to zero value until the molecule in inside the channel—the time needed for the molecule to enter the channel is known as t
off (the signature of the biomaker); this step is followed by the quantification step when the molecule (inside the channel) is taking part to binding and redox processes—this step is characterized by the t
on value, and this value can be found in the diagrams in between two consecutive t
off values (signatures). The choice of the stochastic microsensors was based on the following reasons: they can identify maspin in any biological sample, despite its complexity, because the recognition of maspin is based on its signature (t
off value), which depends only on the characteristics of the channel used for the sensor design, and it is not dependent of the complexity/composition of the biological sample from where it is determined (
Scheme 1).
In addition, the stochastic microsensor can give valuable quantitative information about the concentration of maspin, this being correlated with the value of 1/t
on (
Scheme 1). Stochastic sensors and microsensors used to date for biomedical analysis proved high reliability when used for assay of biomarkers in different biological samples [
13,
14,
15,
16,
17].
The measurements of the maspin solutions and the biological samples were performed connecting a personal computer which had the GPES software to an AUTOLAB/PGSTAT 302 N (Methrom). All measurements were carried out at 25 °C. The biological samples were used as collected from the patients; no processing of samples was performed. A chronoamperometric technique was used for the measurements of ton and toff (signature of maspin) values, at a constant potential (125 mV vs. Ag/AgCl). The signature of maspin served for its identification in the diagrams obtained after the screening of the biological samples. Due to differences of pH between the urine samples and whole blood, saliva, and tumoral tissue, the calibration of the stochastic microsensors was carried out at two pH values: 3.00 (for urine samples) and 7.40 (for whole blood, saliva, and tumoral tissue).
The stochastic microsensors, the reference electrode Ag/AgCl, and the Pt wire were immersed into the biological samples. After a measurement of 6 min, a diagram was obtained. The signatures of maspin were: 3.6 s when the measurements were carried out at pH7.4, and of 3.4 s when the measurements were carried out at pH 3.00. After the identification of maspin in the diagram, in between the two t
off values, the t
on value (needed for the quantification of maspin was read). The calibration equations for maspin were obtained using the linear regression method. The unknown concentration of maspin was determined using these equations of calibration [
13]:
At pH = 7.40, the working concentration range of the microsensor was between 41 fg mL−1 and 2 µg mL−1, with a limit of quantification of 41 fg mL−1.
At pH = 3.00, the working concentration range of the microsensor was between 1 pg mL−1 and 0.8 µg mL−1, with a limit of quantification of 1 pg mL−1.
4. Discussion
It was recently established that maspin is epigenetically regulated at the tissue level with variations depending on each histological type [
9,
10,
11,
12]. Epigenetic changes in maspin expression involve: cytosine (de)methylation; deacetylation of histones; decreased chromatin accessibility, causing loss of gene function. In this sense, it was shown that: overexpression of maspin in gastric, pancreatic, and ovarian cancers results from demethylation of the CpG promoter (CpG promoter refers to a promoter region of a gene that contains a high frequency of CpG sites, while CpG islands are regions of DNA where a cytosine nucleotide is followed by a guanine nucleotide in the linear sequence of bases along its 5′ → 3′ direction); both methylation and demethylation of the maspin promoter could regulate the expression of the maspin gene and could guide the interpretation of up/down-regulation associated with a negative prognosis. Maspin gene promoter methylation is involved in several cancers such as breast, thyroid, skin, and colon cancers and it was admitted that this is one of the most common mechanisms that causes loss of gene function. It is noteworthy that in somatic tissues, most CpG regions are methylated and tumor cells show global hypomethylation of DNA compared to their normal counterparts [
9,
10,
11,
12]. Hypomethylation is involved in the progression from premalignant to malignant and leads to the activation of genes involved in the development of cancer [
9,
10,
11,
12].
The Kaplan–Meier analysis did not demonstrate any significant relationship between maspin expression and survival time of patients with adenocarcinoma (
p > 0.05). Low maspin expression is associated with liver metastases of colorectal adenocarcinoma (CRA) possibly by degradation of the extracellular matrix (tenascein) to increase the mobility of adenocarcinoma-related cells [
9,
10,
11,
12]. Another study was conducted in Japan, where there was a significant increase in the incidence of colorectal cancer. Pathological and genetic research showed that colorectal adenoma is a precursor to most colorectal adenocarcinomas and that it can suffer from malignant degeneration in adenocarcinoma if not treated. However, at present, the biomolecular mechanisms underlying colorectal carcinogenesis and CRA progression are still incompletely elucidated [
9,
10,
11,
12]. The genetic study showed that the Maspin gene is associated with the human chromosome 18q21.3-q23 (in the same region as the plasminogen-2 activator inhibitor gene (PAI-2), the DCC (colorectal cancer suppressor) tumor suppressor gene and the BCL-2 gene), whose cDNA consists of 2584 nucleotides and encodes a 42 kDa polypeptide [
9,
10,
11,
12].
Maspin has significant homology to the family of serine protease inhibitors such as plasminogen activation inhibitors 1 and 2 (PAI-1 and PAI-2) and α1-antitrypsin, which are responsible for extracellular matrix degradation (ECM) [
9,
10,
11,
12]. Maspin was shown to inhibit the motility and invasion of tumor cells in in vitro breast/prostate cancer cell lines and it reduces the capacity for tumor development and metastasis of cancer cell lines in animal models [
9,
10,
11,
12]. Maspin was shown to suppress angiogenesis, induce cell apoptosis, and promote cell adhesion to the basement membrane and the ECM (extracellular matrix). Although loss of maspin expression was reported to correlate with increased aggression in advanced breast and prostate cancers, classifying maspin as a potent tumor suppressor, some in vivo studies characterized it as an important oncogene, as its overexpression was reported in cases of cancer of: pancreas, ovary, thyroid, lungs, and bladder [
9,
10,
11,
12]. Moreover, overexpression was also correlated with lymph node metastases of gastric cancer and poor prognosis of lung cancer.
It was established that maspin has different functions depending on: tissue histological type, stage, and intracellular localization. It was also established that protein interactions may be the cause of controversial results. The biological function of serpin B5 was assigned to the central reactive loop (RCL) and is involved in protein interactions and cell cohesion. In addition, there are some components of the extracellular matrix (glutathione S-transferase and interferon regulatory factor) that may interact with serpin B5 to perform its biological functions.
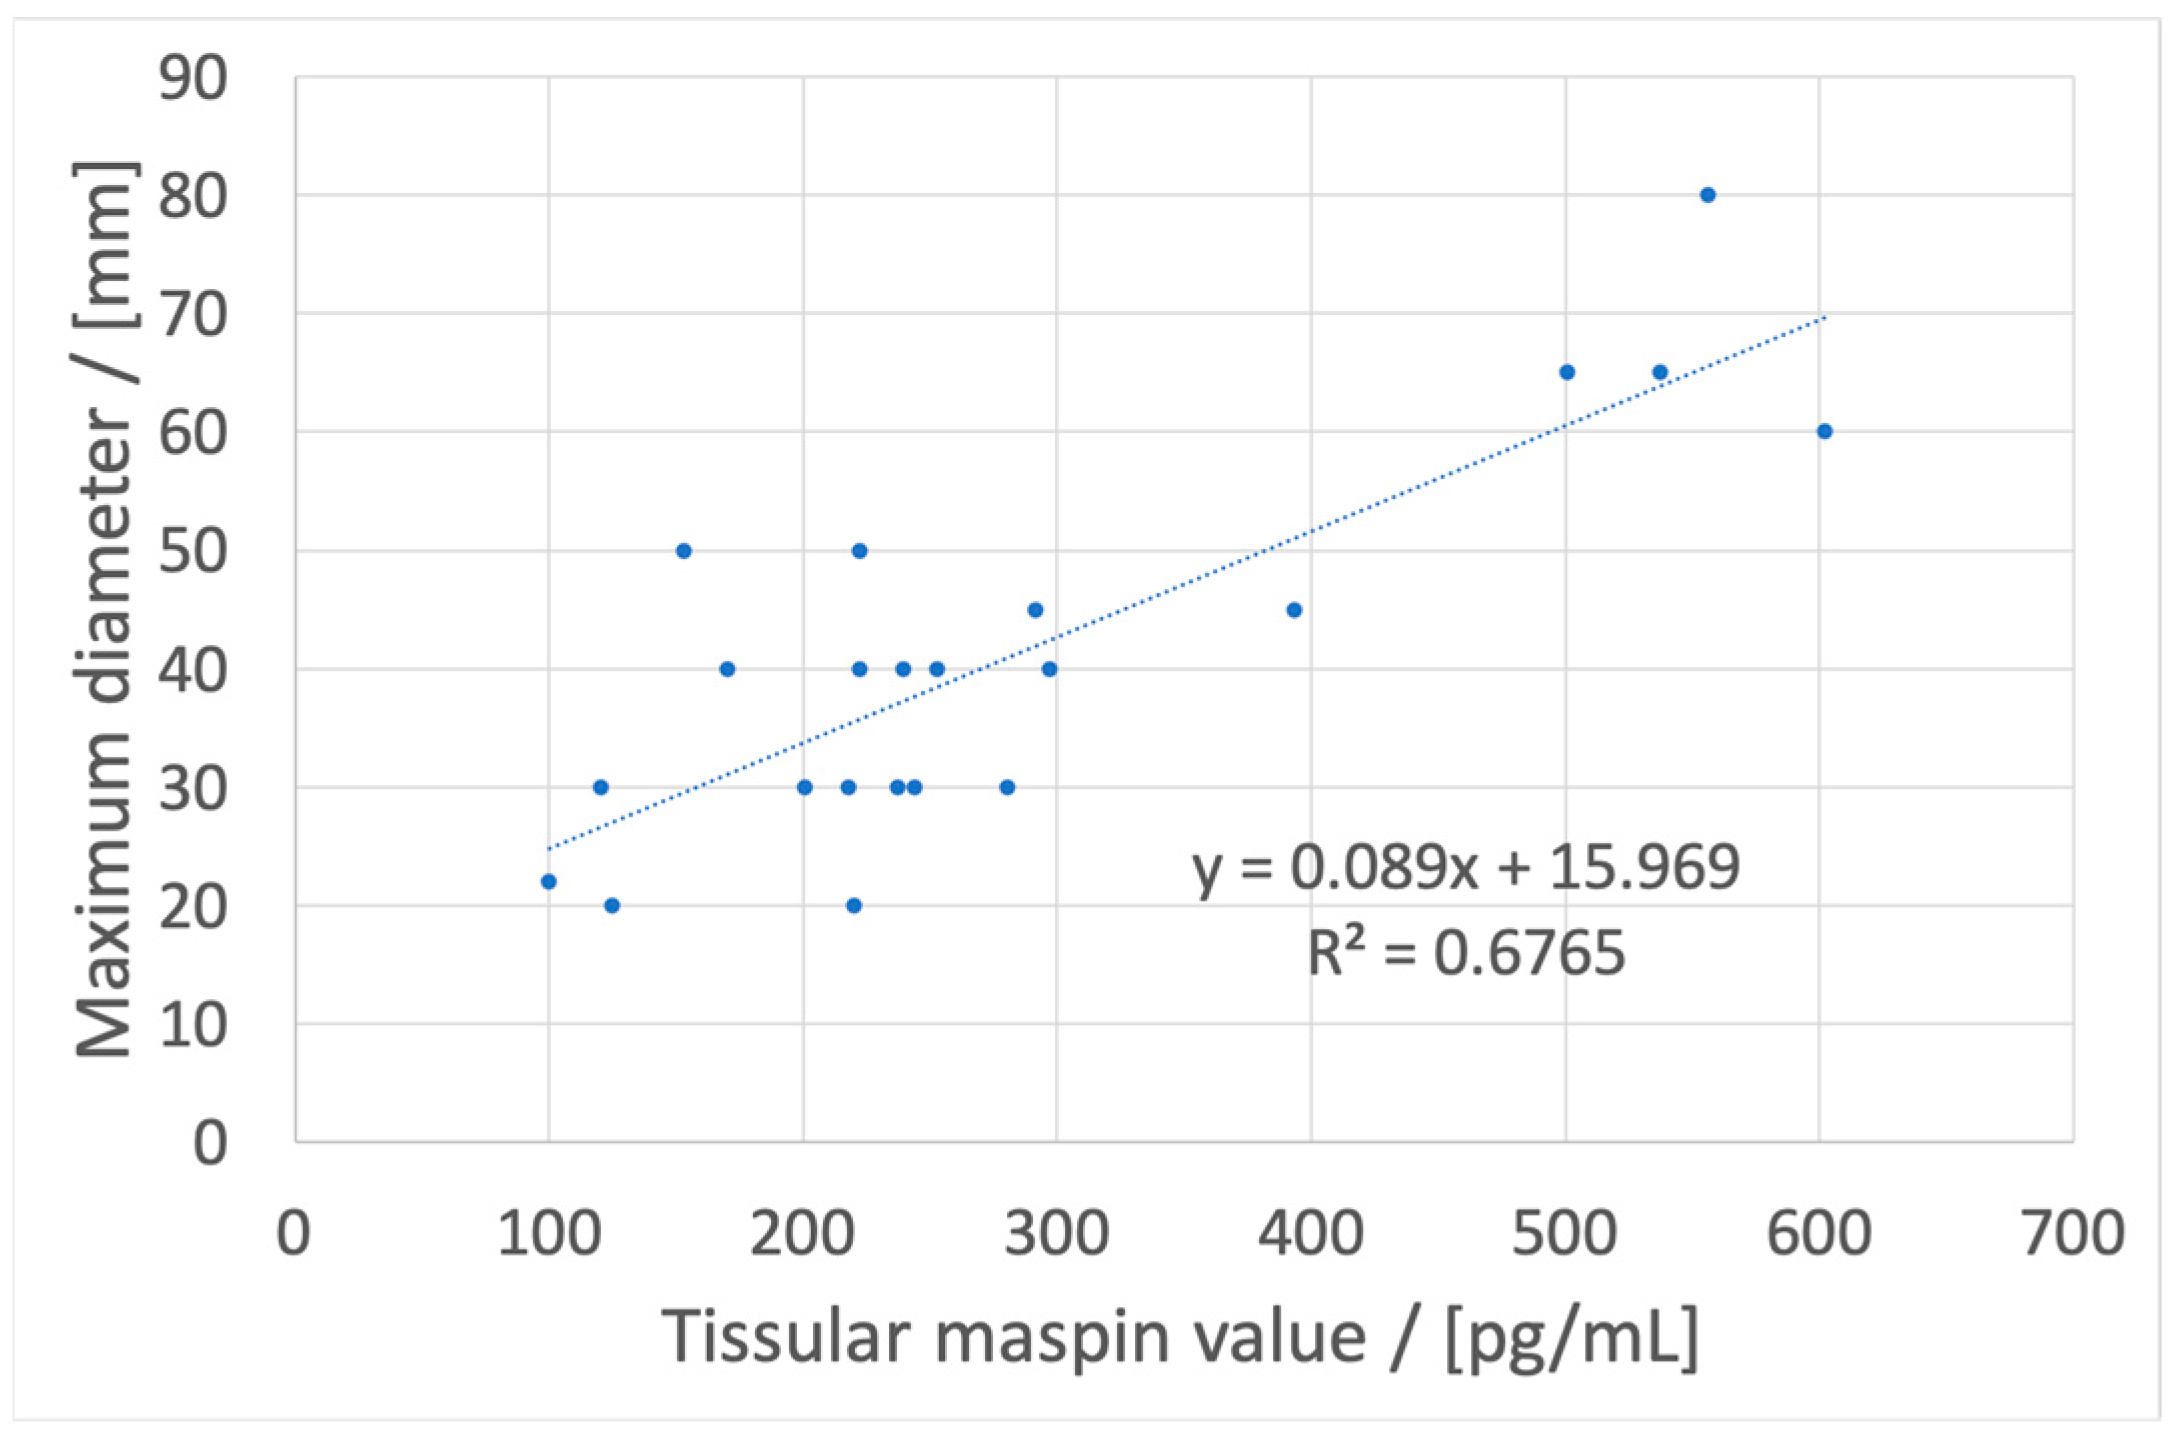
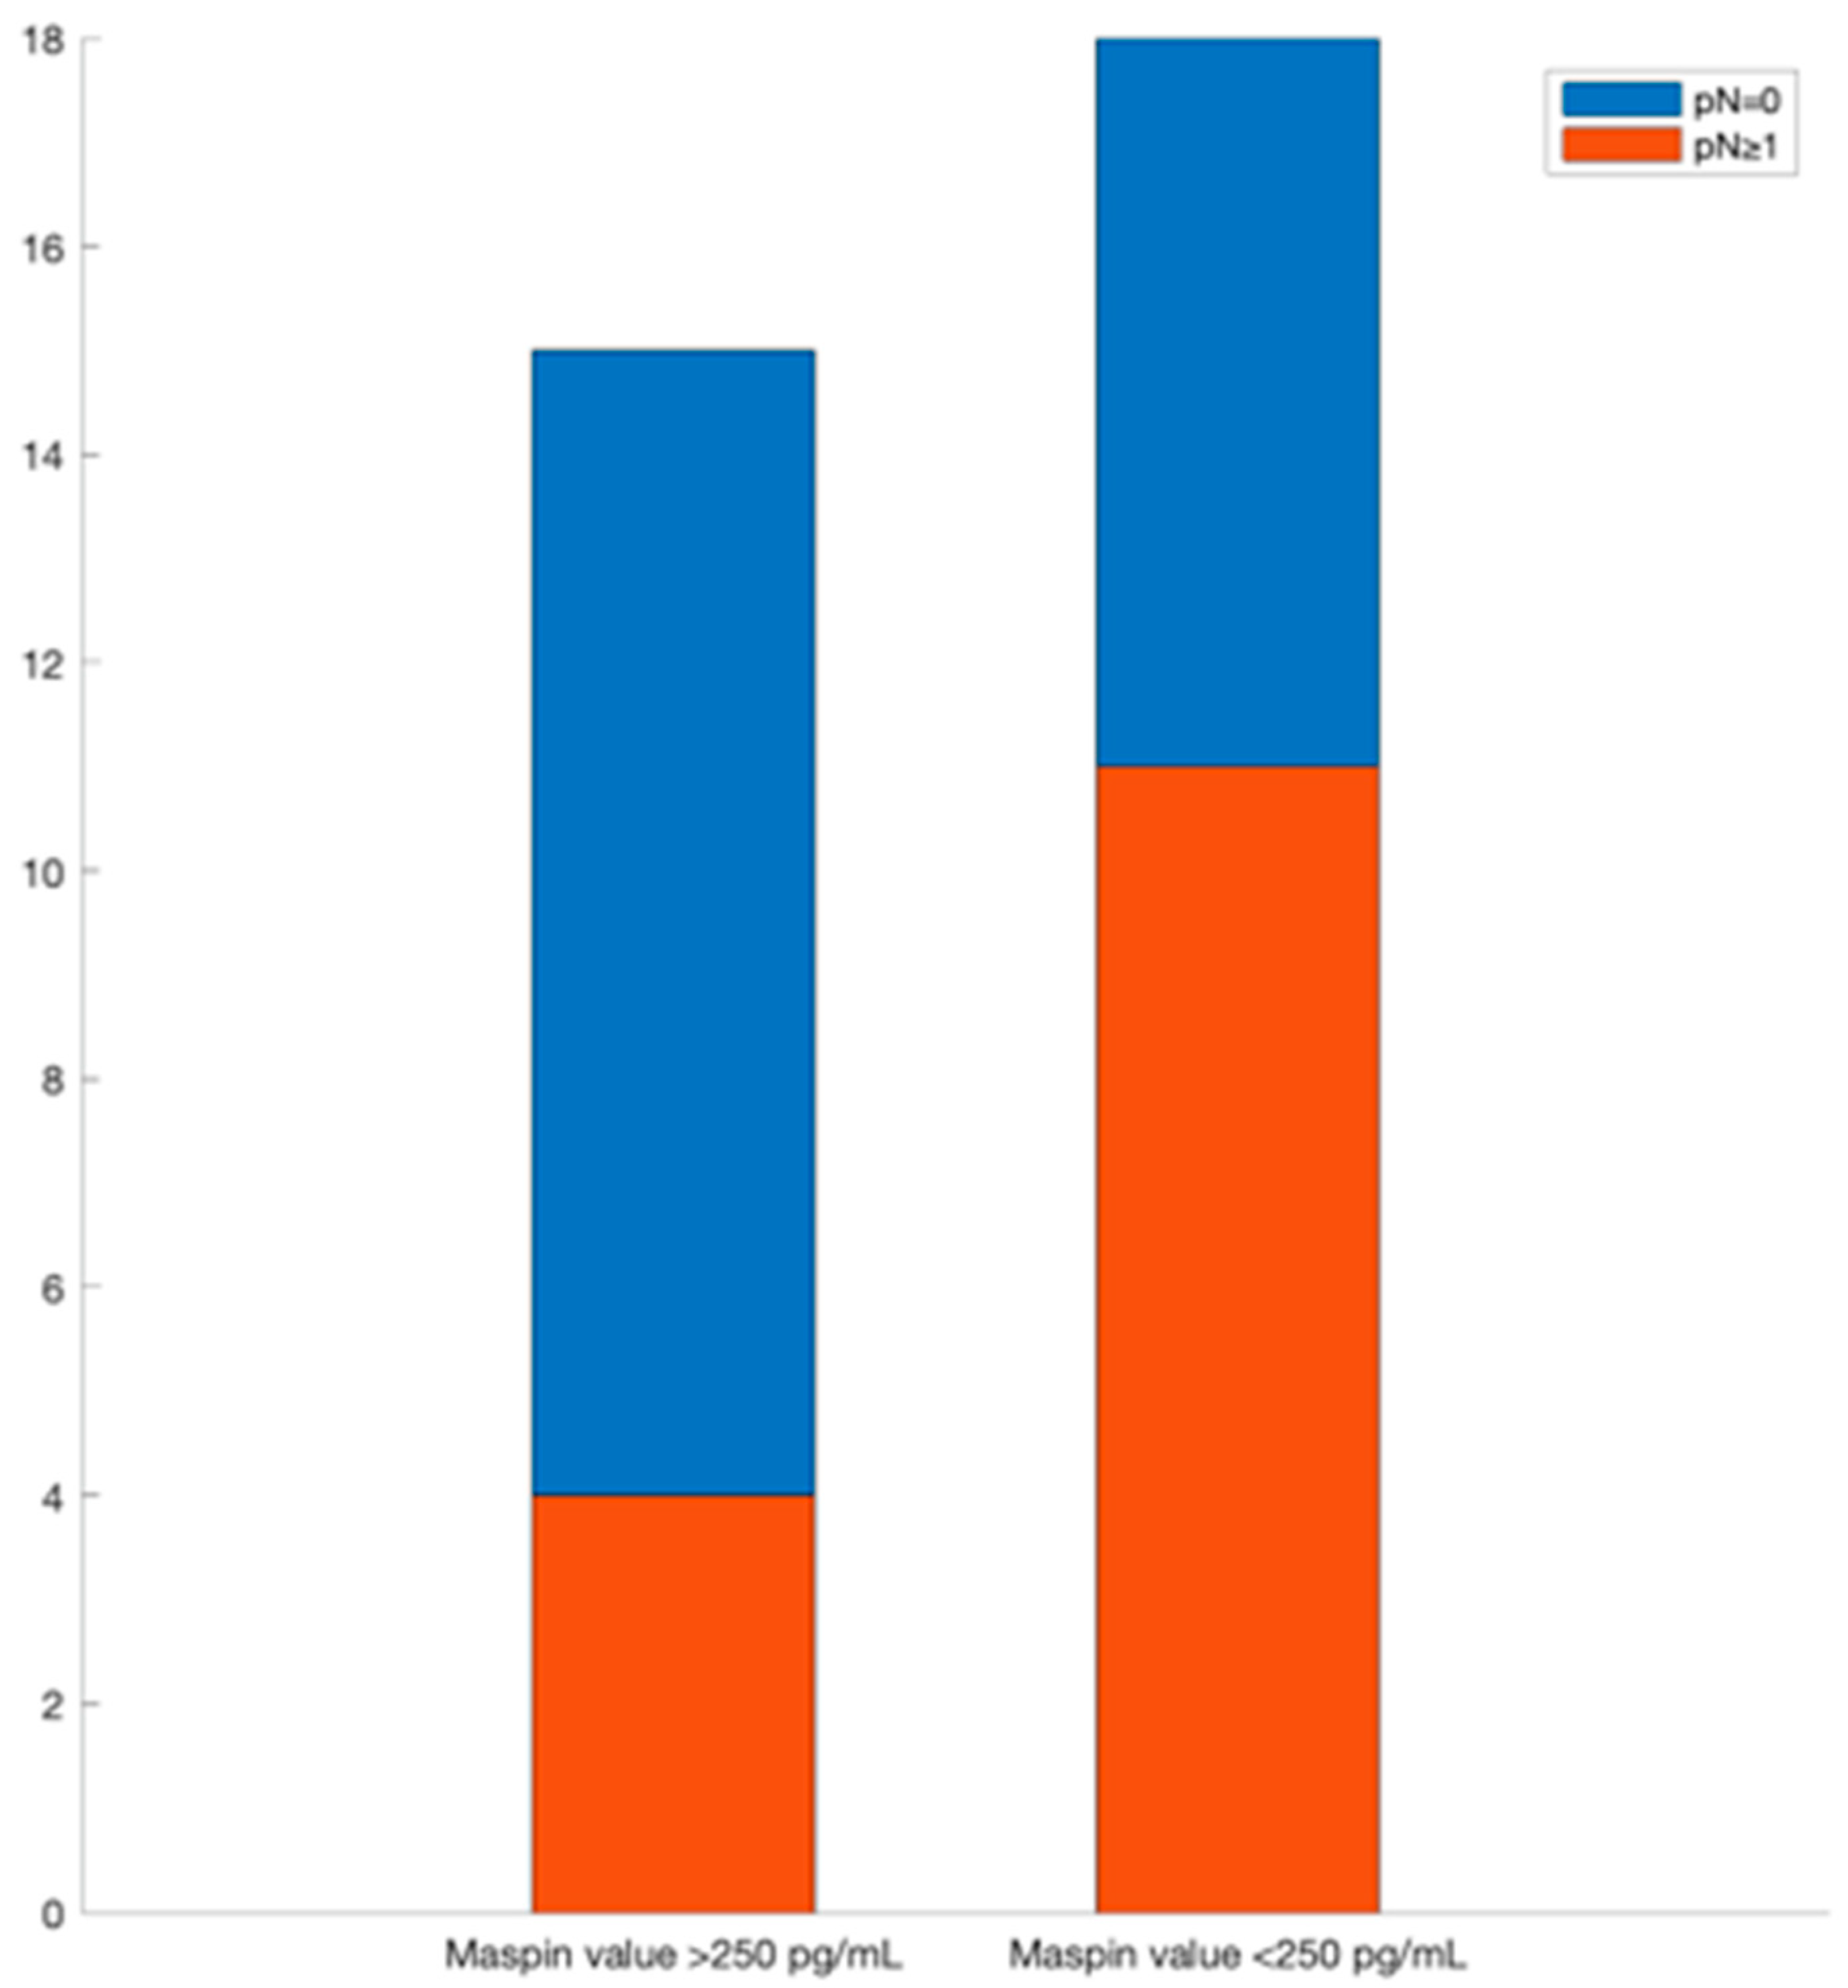
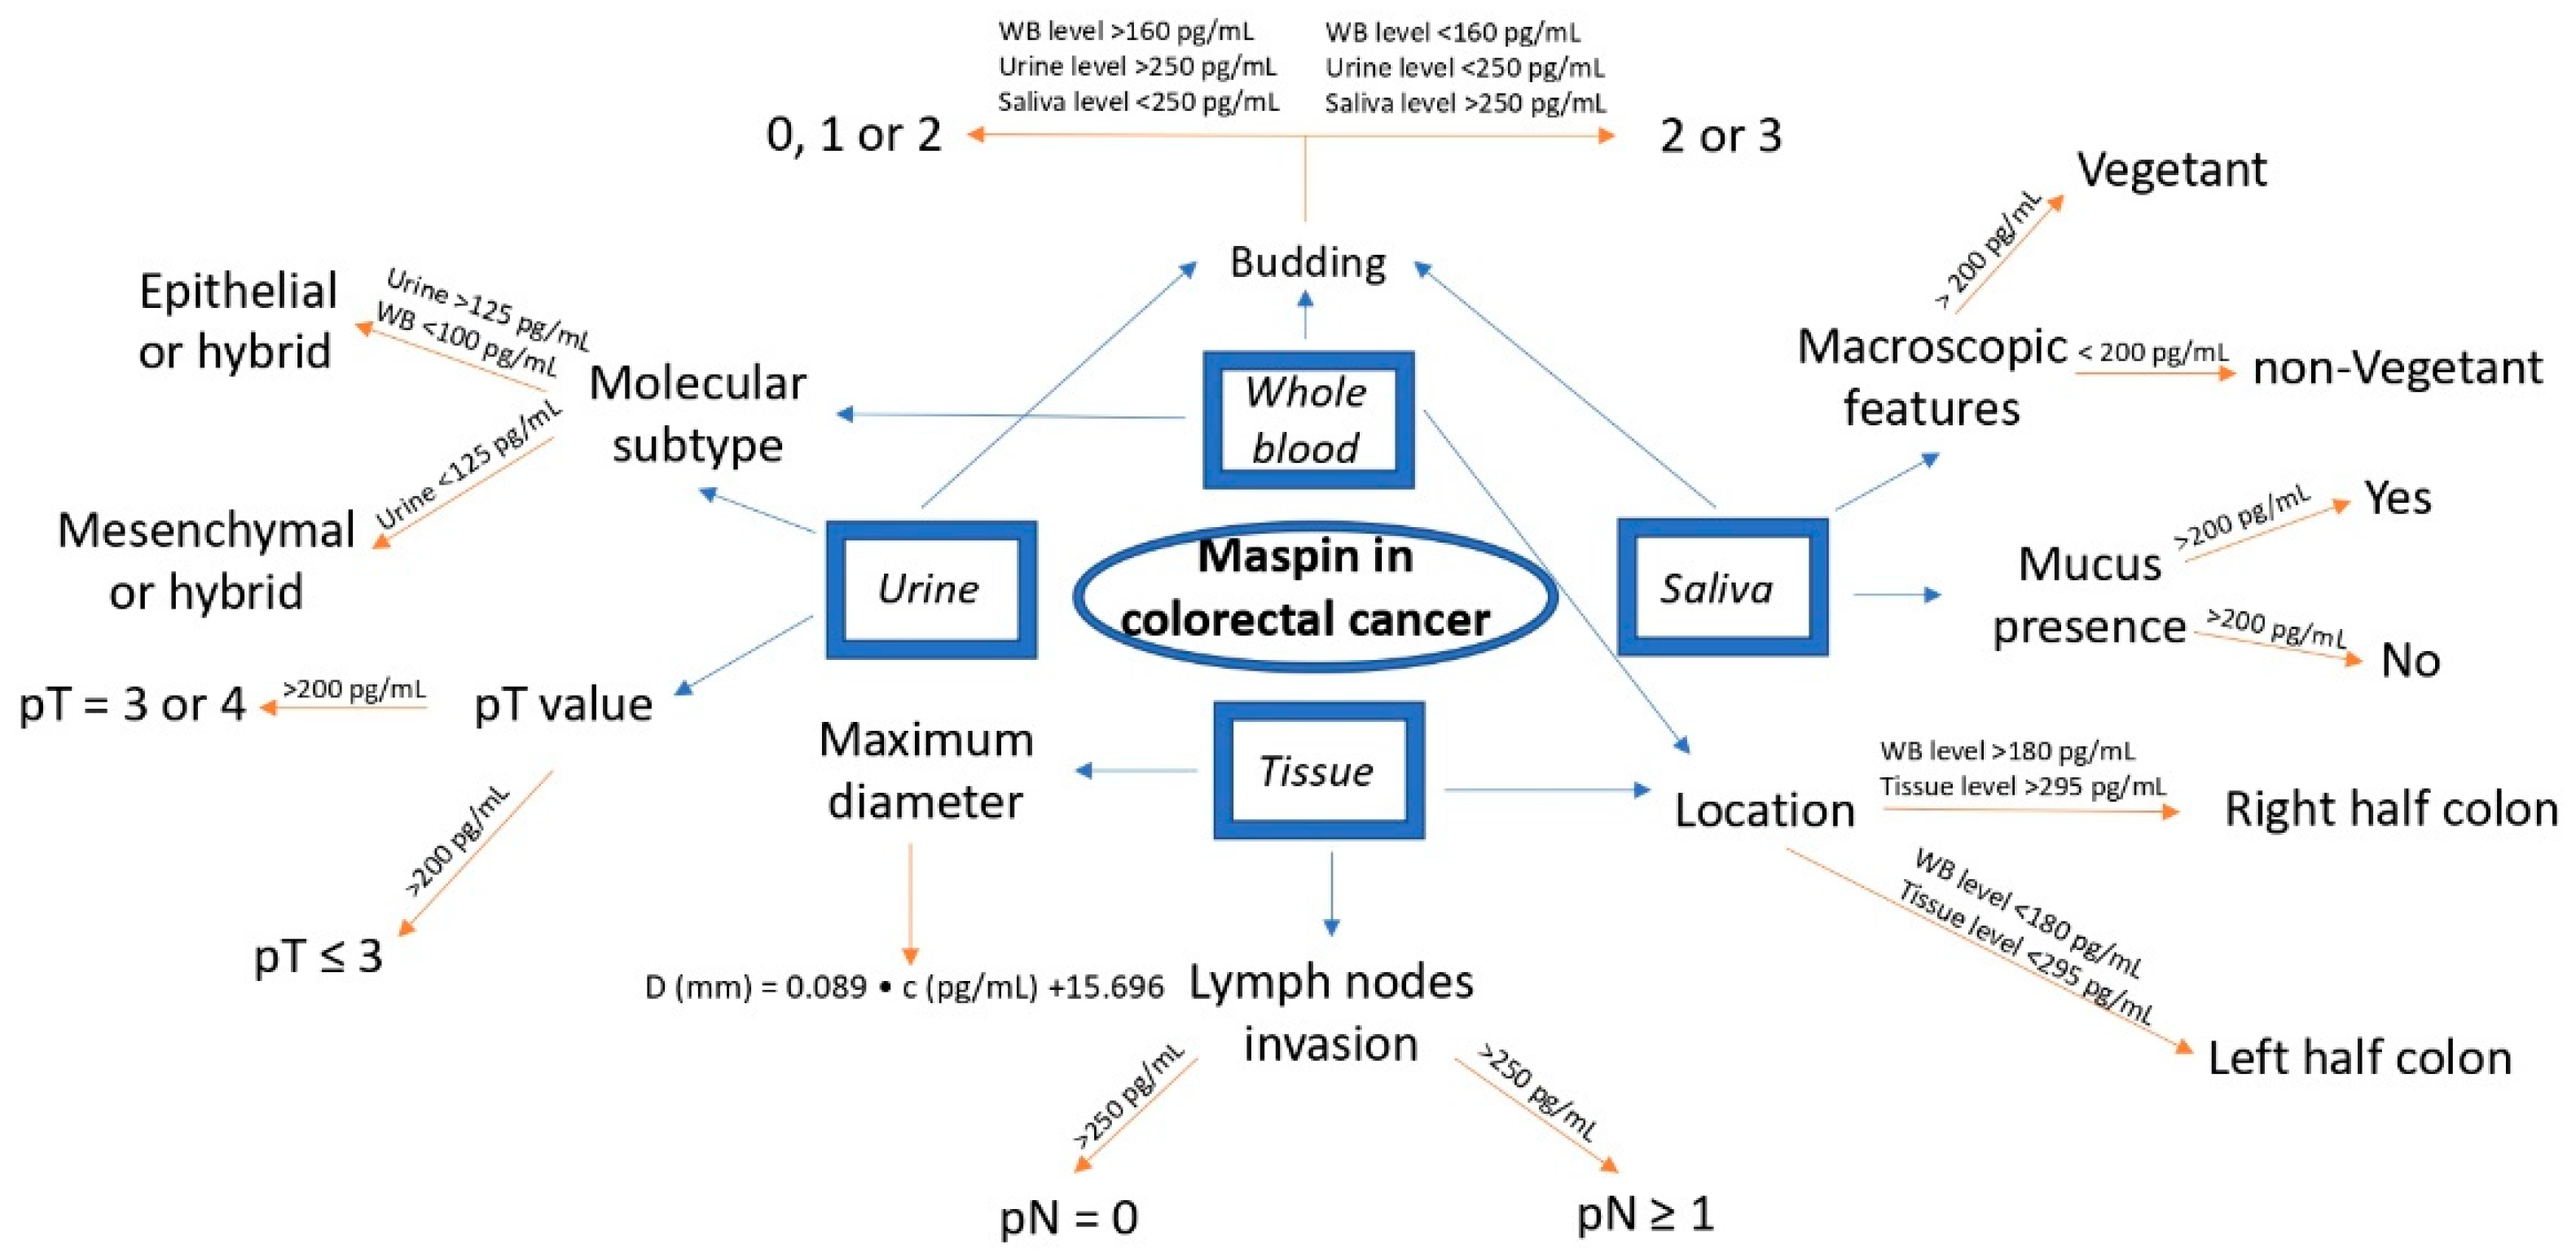
If a metastasis from a colon tumor is suspected, the whole blood maspin concentration can be used. If its value is under 180 pg/mL, the location is probably in the left colon and a colonoscopy can be used for obtaining a biopsy and further tissular results which will give data about the maximum diameter of the tumor and invasions in lymphatic nodes.
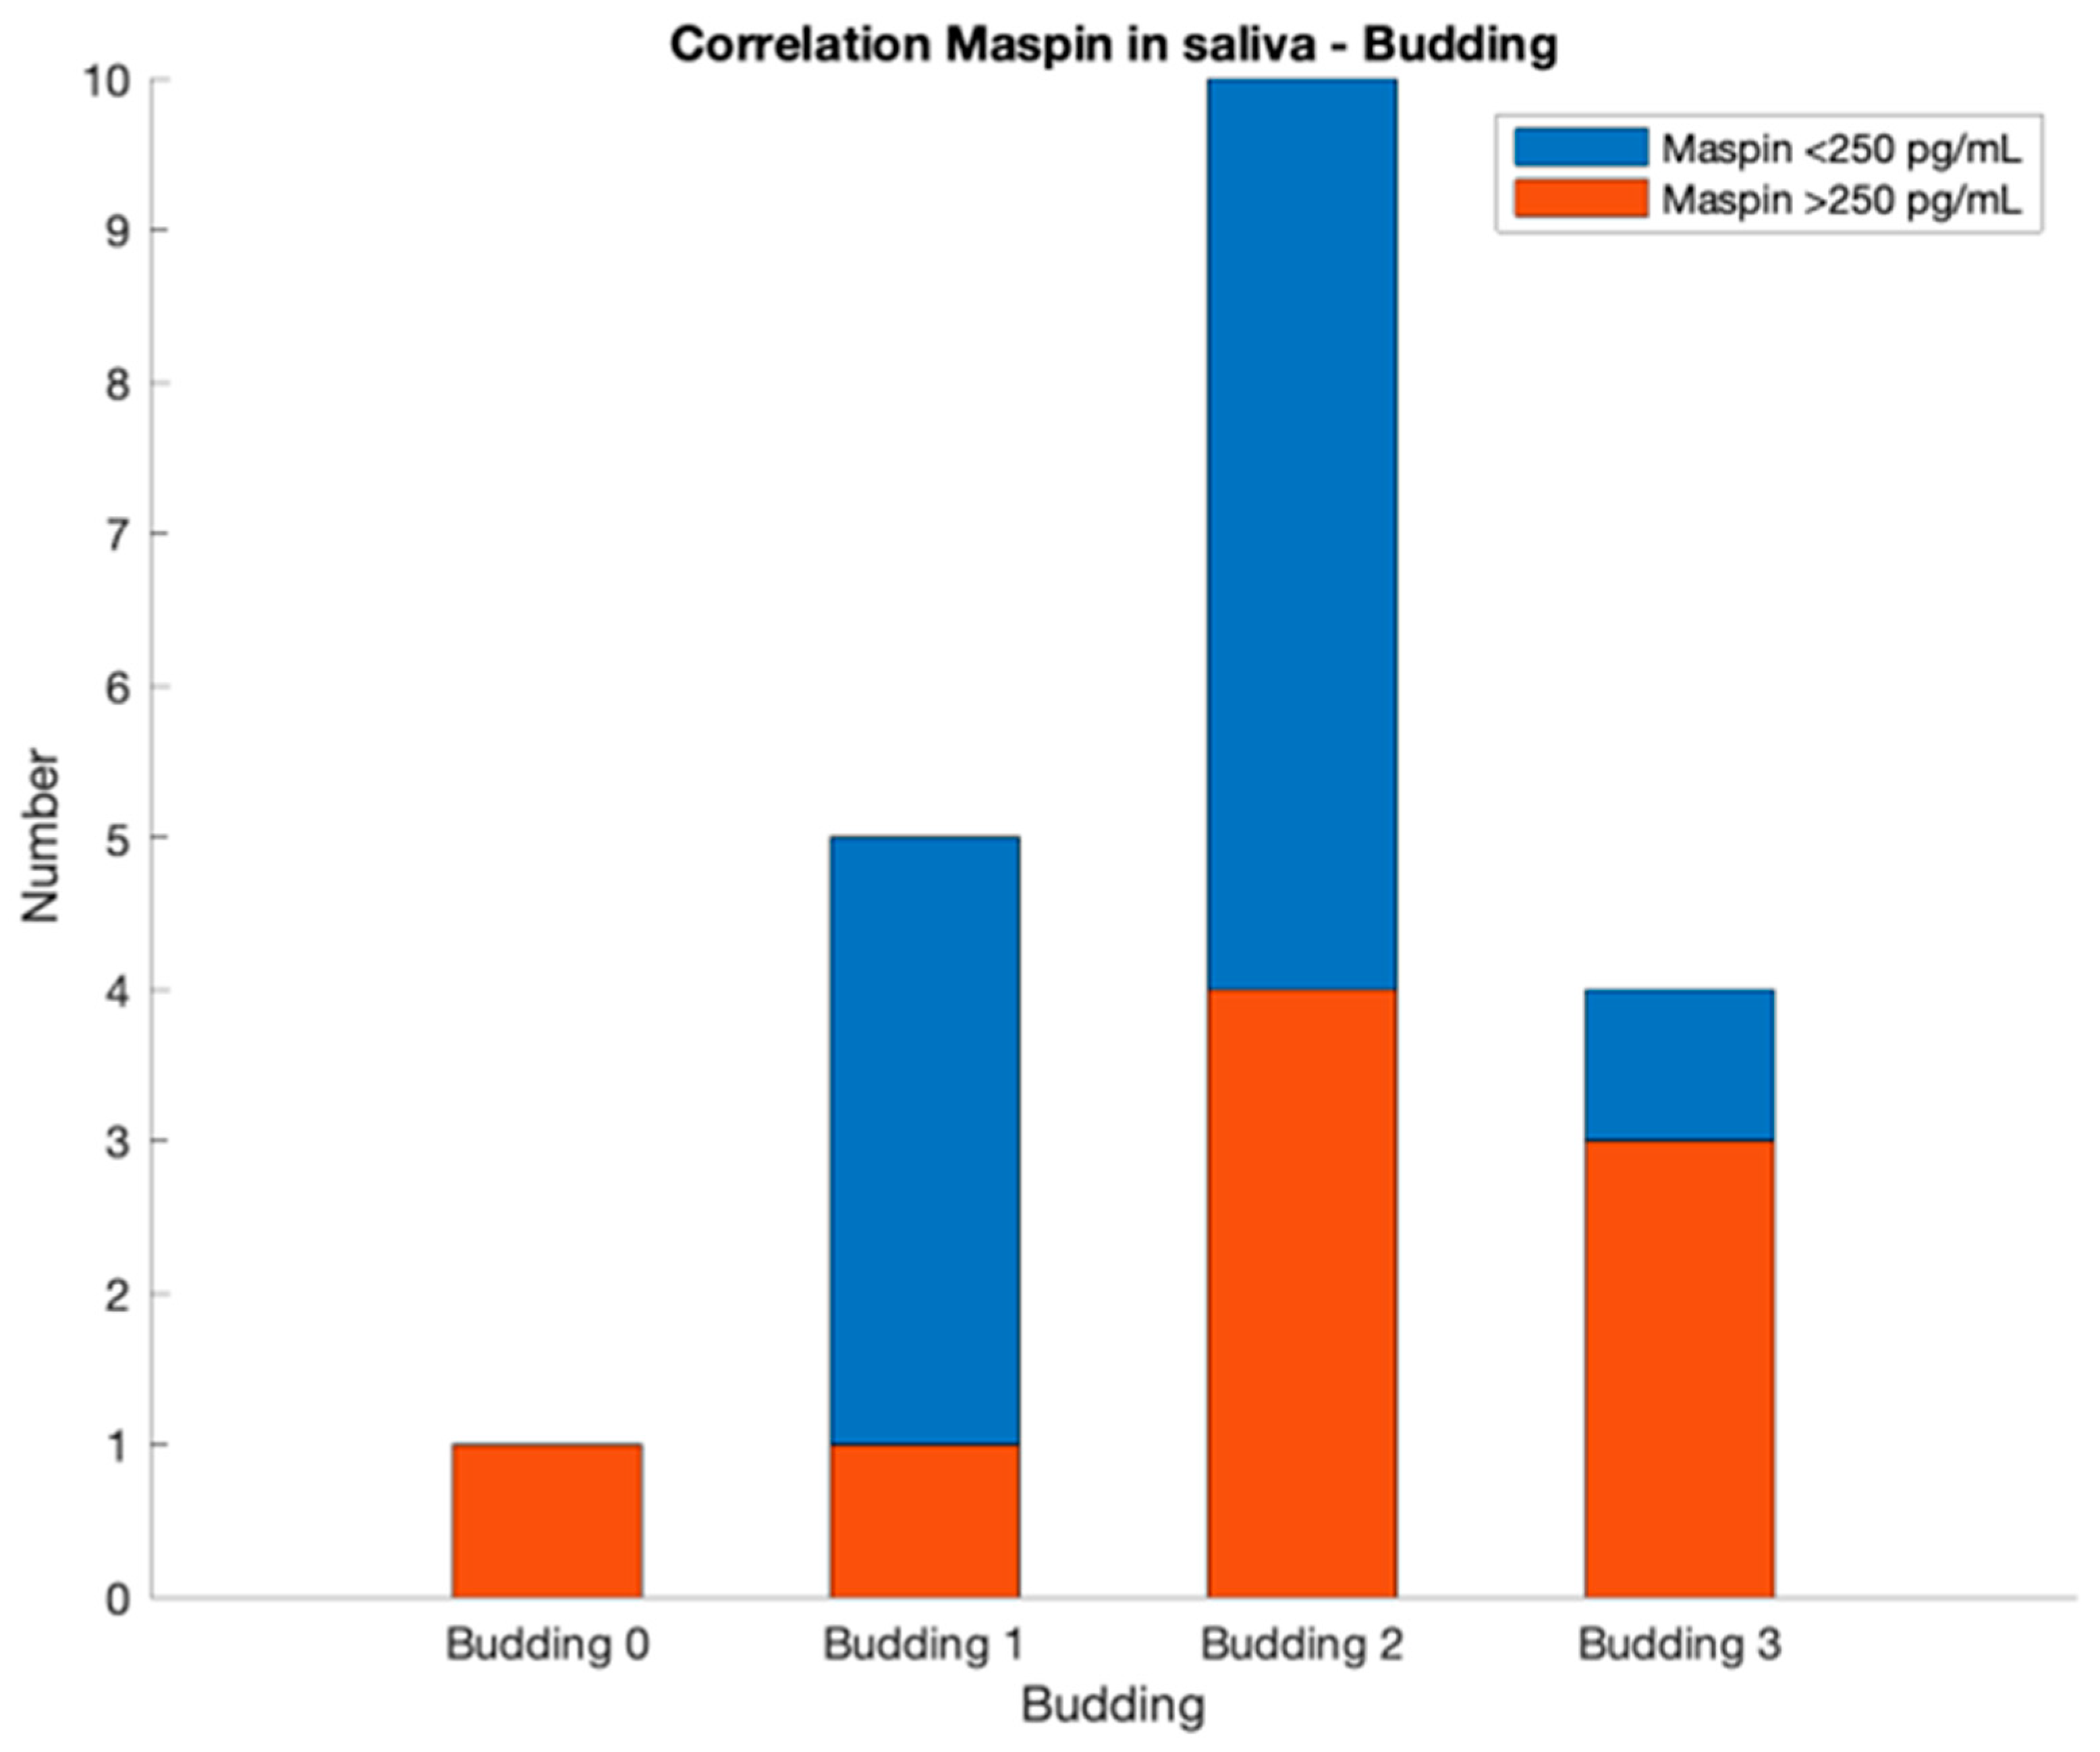
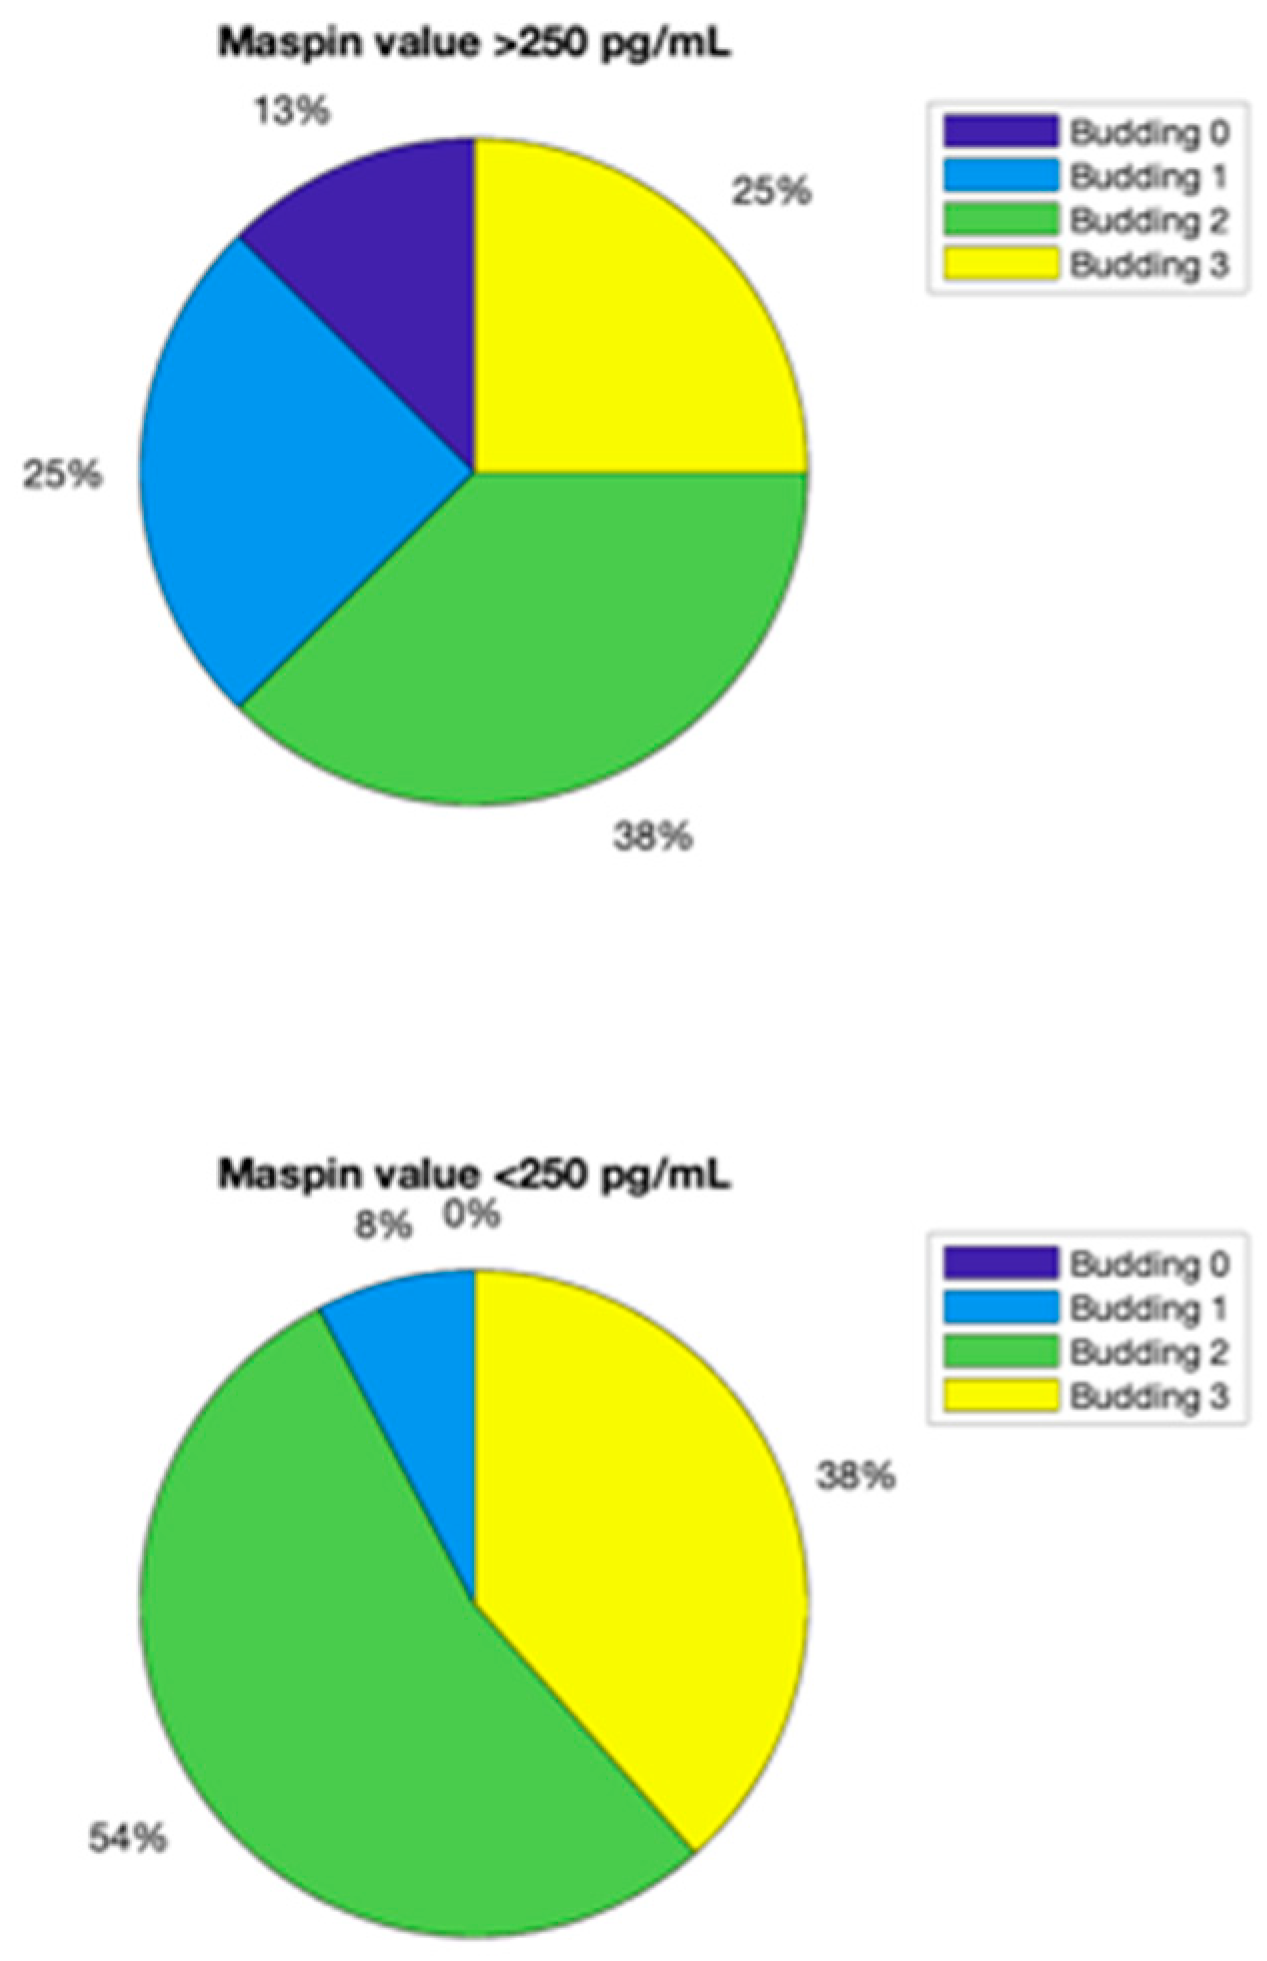
Another important parameter is the budding value. It can be obtained primarily from blood, urine and saliva analyses. For example, a value of 2 for budding is given by the next two combinations:
Whole blood maspin concentration lower than 160 pg/mL, urinary maspin concentration lower than 250 pg/mL and salivary maspin concentration between 150 and 250 pg/mL;
Whole blood maspin concentration lower than 160 pg/mL, urinary maspin concentration higher than 250 pg/mL and salivary maspin concentration lower than 300 pg/mL.
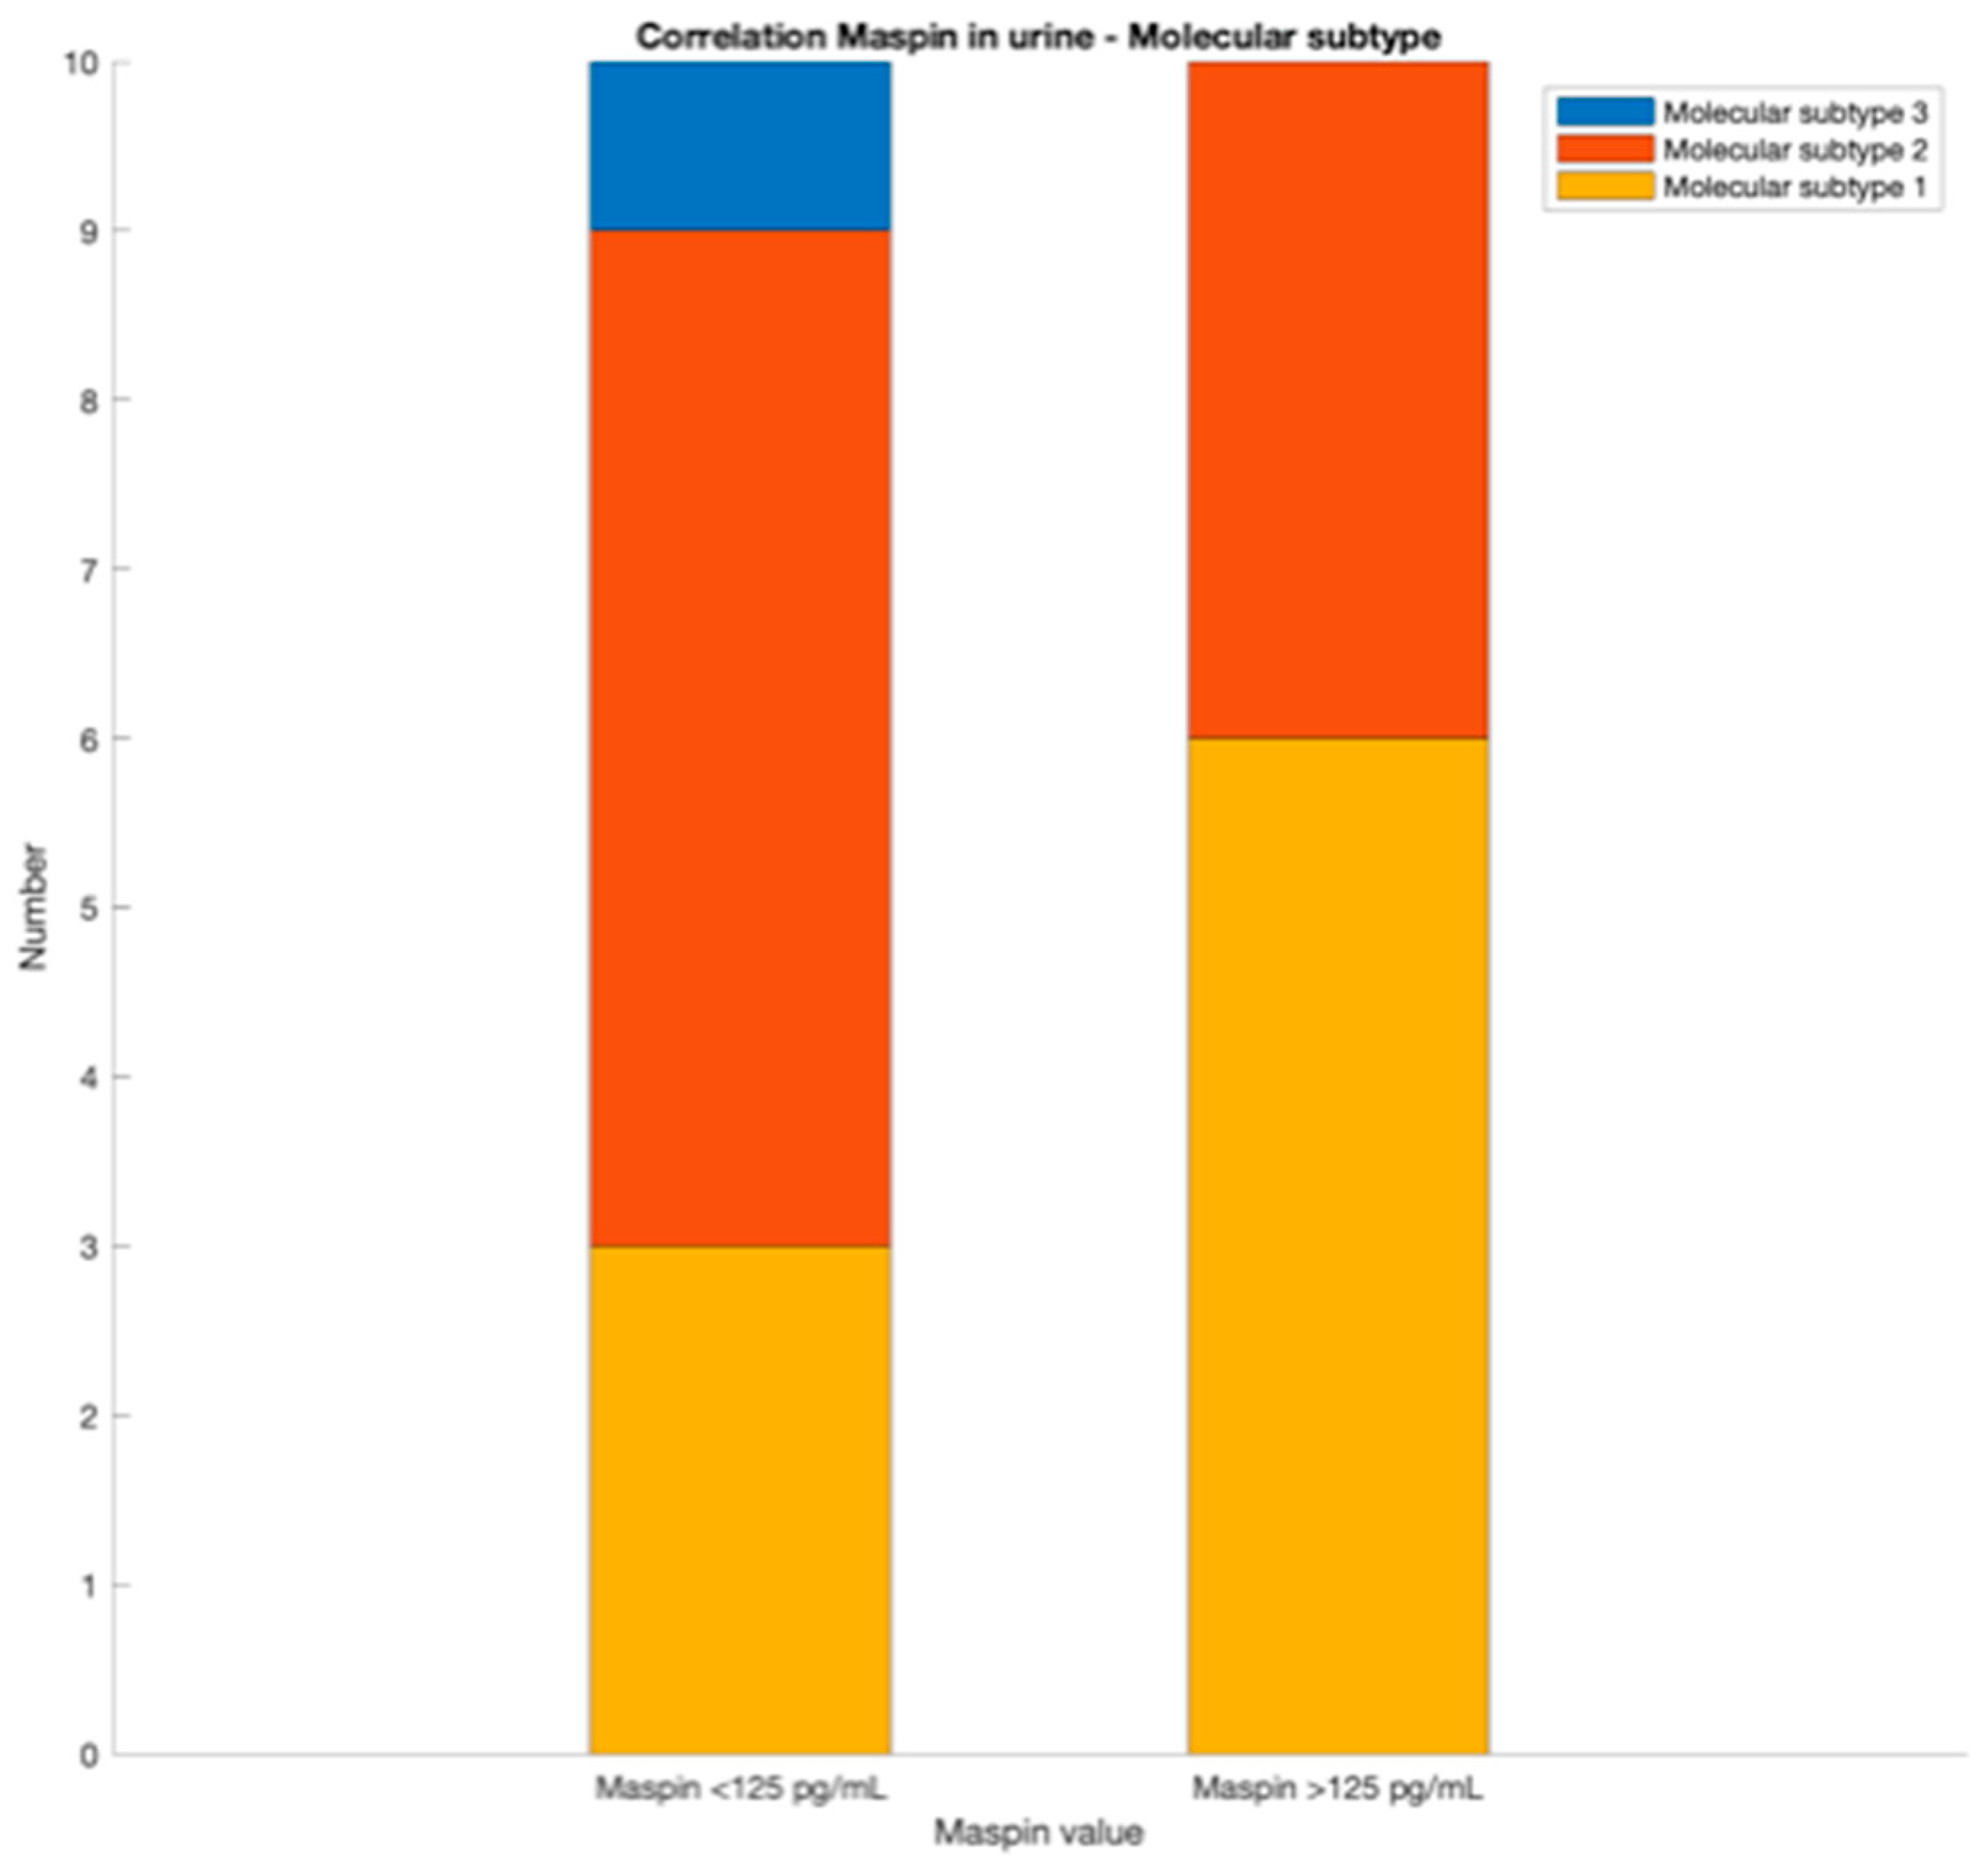
For the molecular subtype, blood and urine maspin values can be primarily used. A value of whole blood maspin concentration lower than 100 pg/mL indicates an epithelial subtype. If the value of whole blood maspin concentration is higher than 100 pg/mL and urinary maspin concentration value is lower than 125 pg/mL, a mesenchymal compound is probably implied. For a whole blood maspin concentration value higher than 100 pg/mL and a urinary maspin concentration value higher than 125 pg/mL, the tissular maspin concentration value from biopsy is necessary. If the tissular maspin concentration value is lower than 240 pg/mL, a mesenchymal compound is probably implied; also, the molecular subtype is probably an epithelial one.
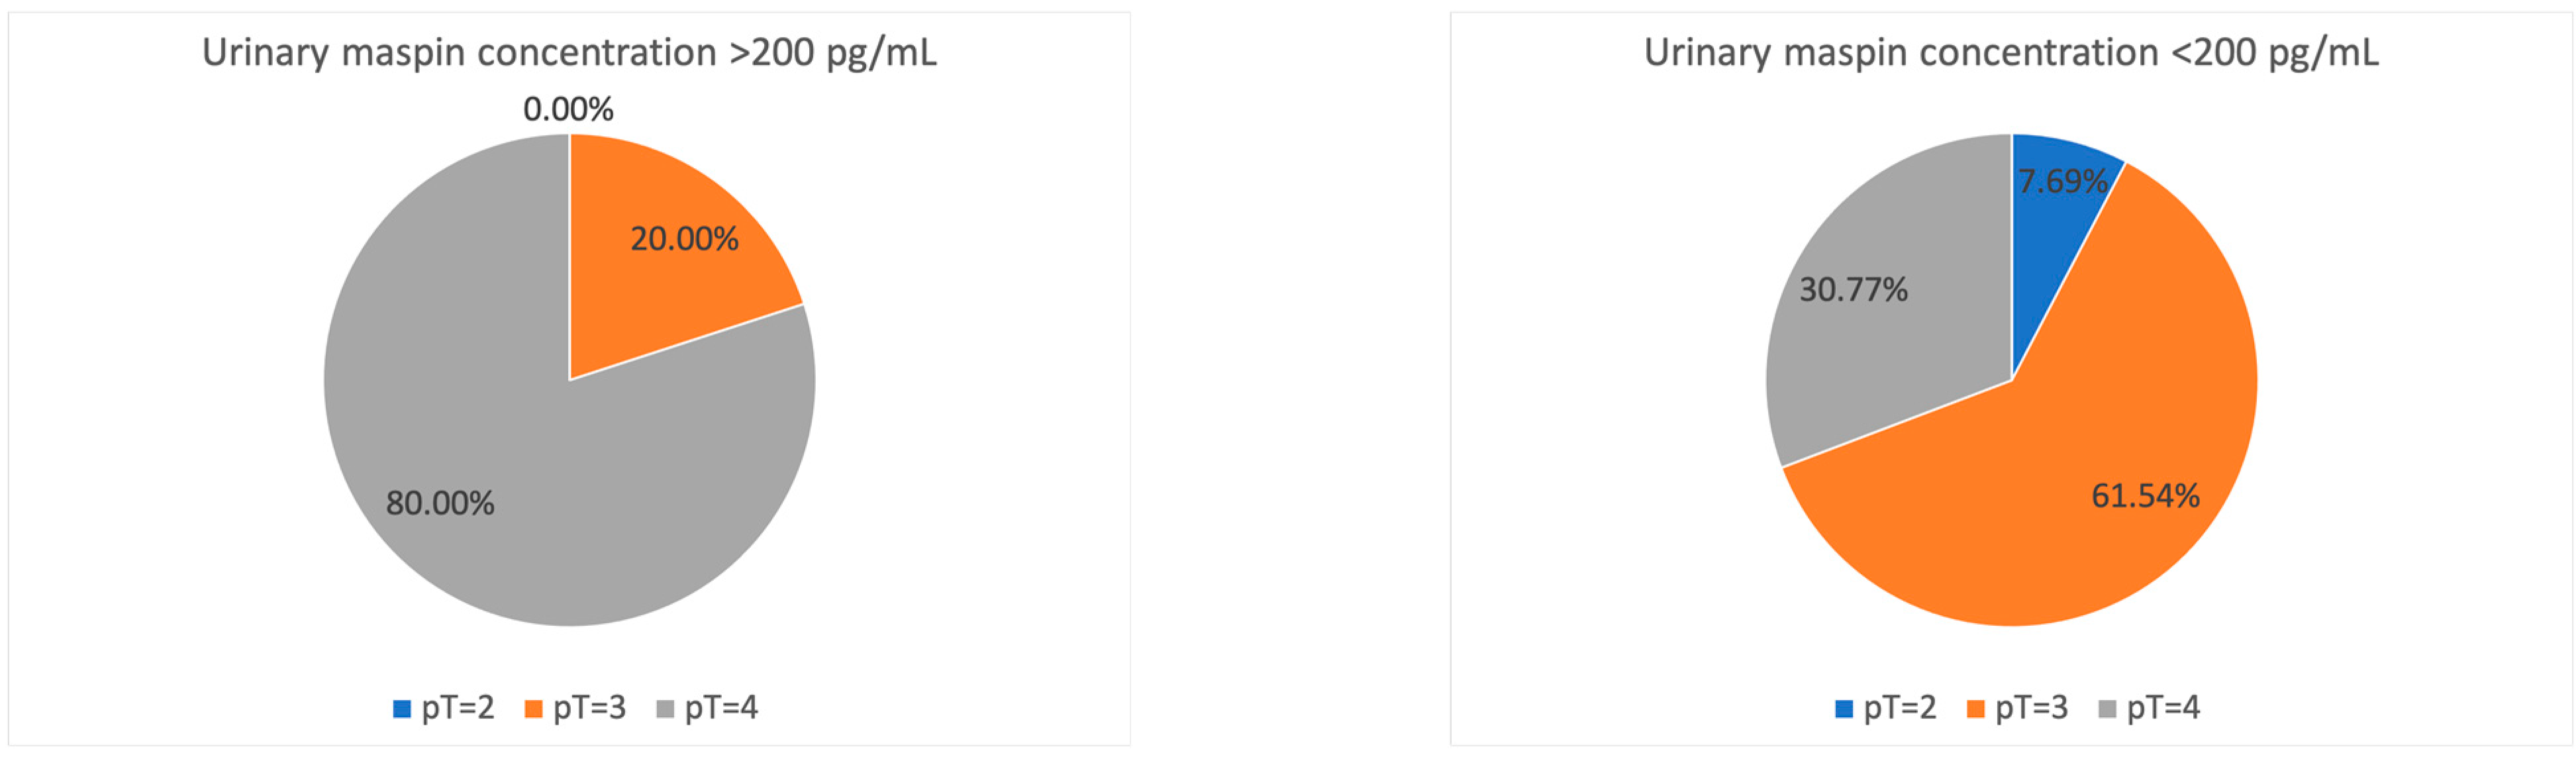
For TNM staging, a urinary maspin concentration value lower than 200 pg/mL suggest a pT value of 2 or 3, while a higher concentration of urinary maspin than 200 pg/mL suggest a pT = 4; for gross features, the salivary maspin concentration value higher than 200 pg/mL increase the probability of a vegetant tumor, while a salivary maspin concentration value lower than 200 pg/mL can exclude a mucinous compound.
To summarize the discussions, a workflow was drawn, for the application of the findings (
Figure 8):


