Unbiased Quantitative Single-Cell Morphometric Analysis to Identify Microglia Reactivity in Developmental Brain Injury
Abstract
:1. Introduction
2. Materials and Methods
2.1. Animals and Experimental Design
2.1.1. Intrauterine Growth Restriction Model (IUGR)
2.1.2. Chorioamnionitis Model (Chorio)
2.1.3. Neonatal Hypoxic–Ischemic Model (HI)
2.2. Tissue Preparation
2.3. Floating Immunofluorescent Immunohistochemistry
2.4. Image Acquisition
2.5. Step-by-Step Protocol for Image Processing Using Imaris Software x64 v9.8.0
2.5.1. Imaris File Converter Software (Supplemental Figure S1)
- Import files using the ‘Add files’ button in the left upper quadrant of the screen. Note: remove metadata files (.queue) from the folder prior to conversion (Supplemental Figure S1A). Set output destination (Supplemental Figure S1A2).
- Users may need to set the correct voxel size for pixel classification to prevent image stretching or distortion before proceeding with the conversion.
- Select Start All; open Imaris software once finished (Supplemental Figure S1A3).
2.5.2. Using Imaris x64 v9.8.0
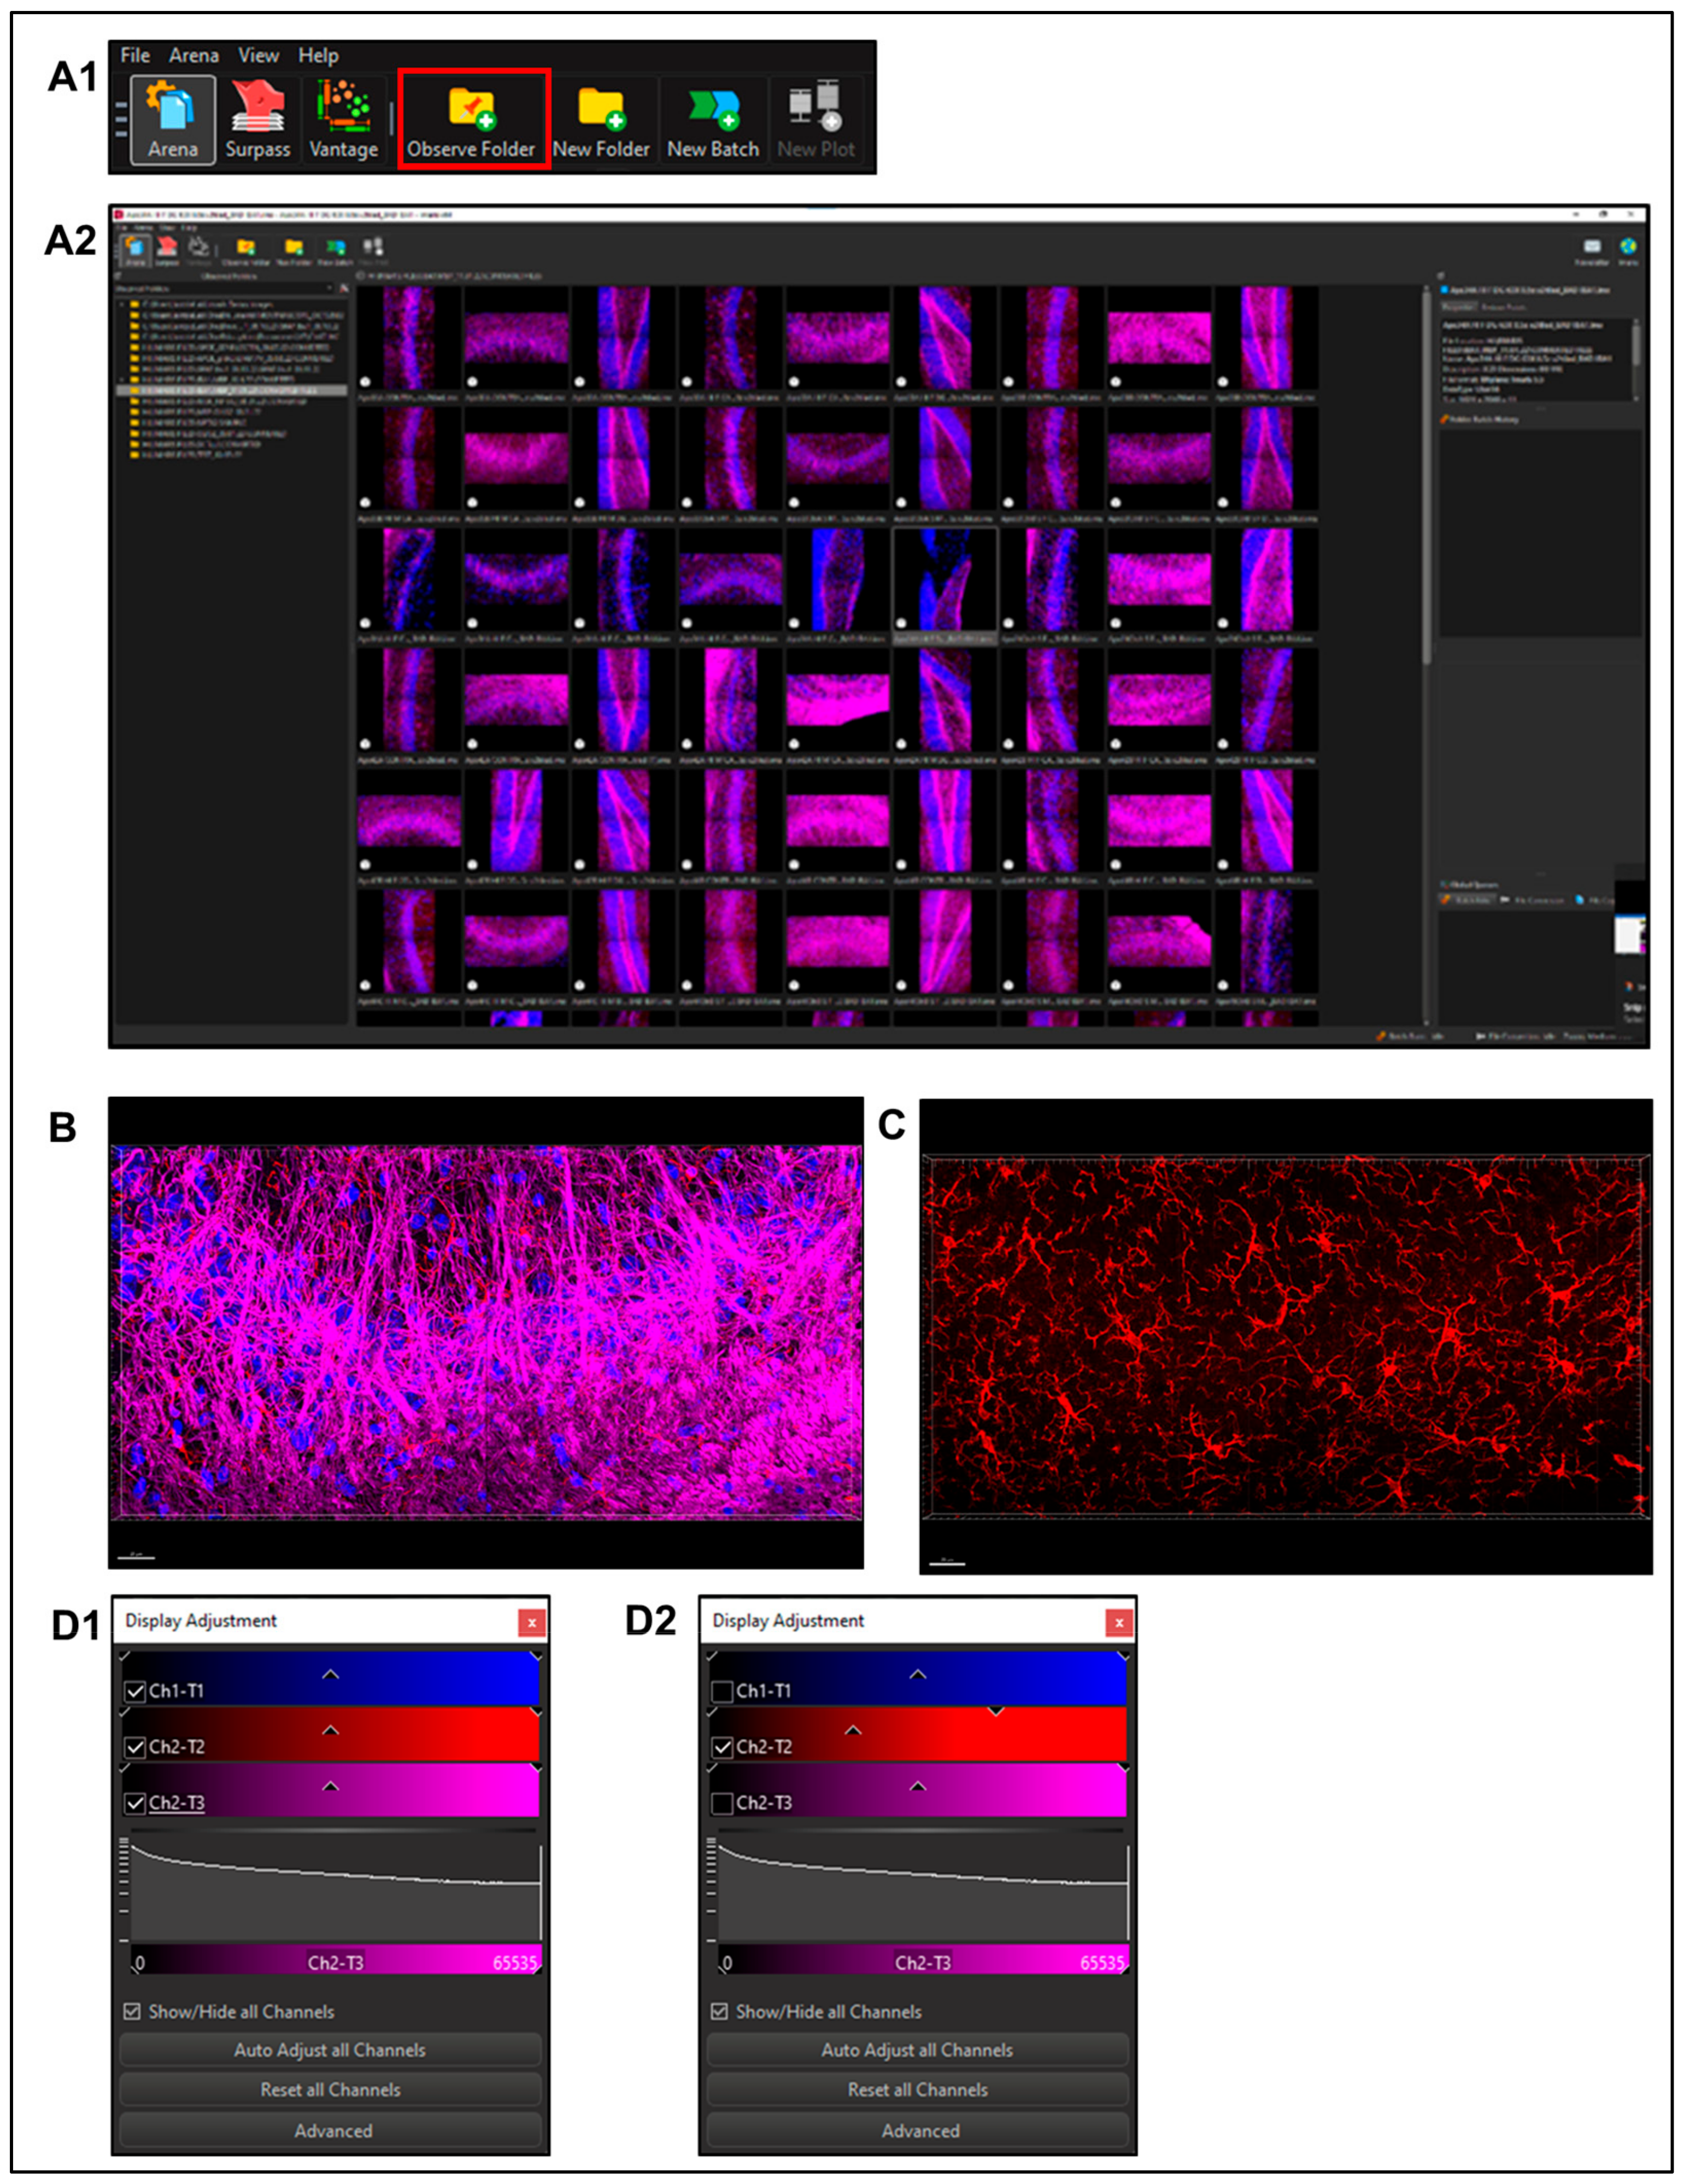
- Select a file to enter ‘Surpass Mode’ in order to begin image analysis. (Figure 3B)
2.5.3. Filament Creation
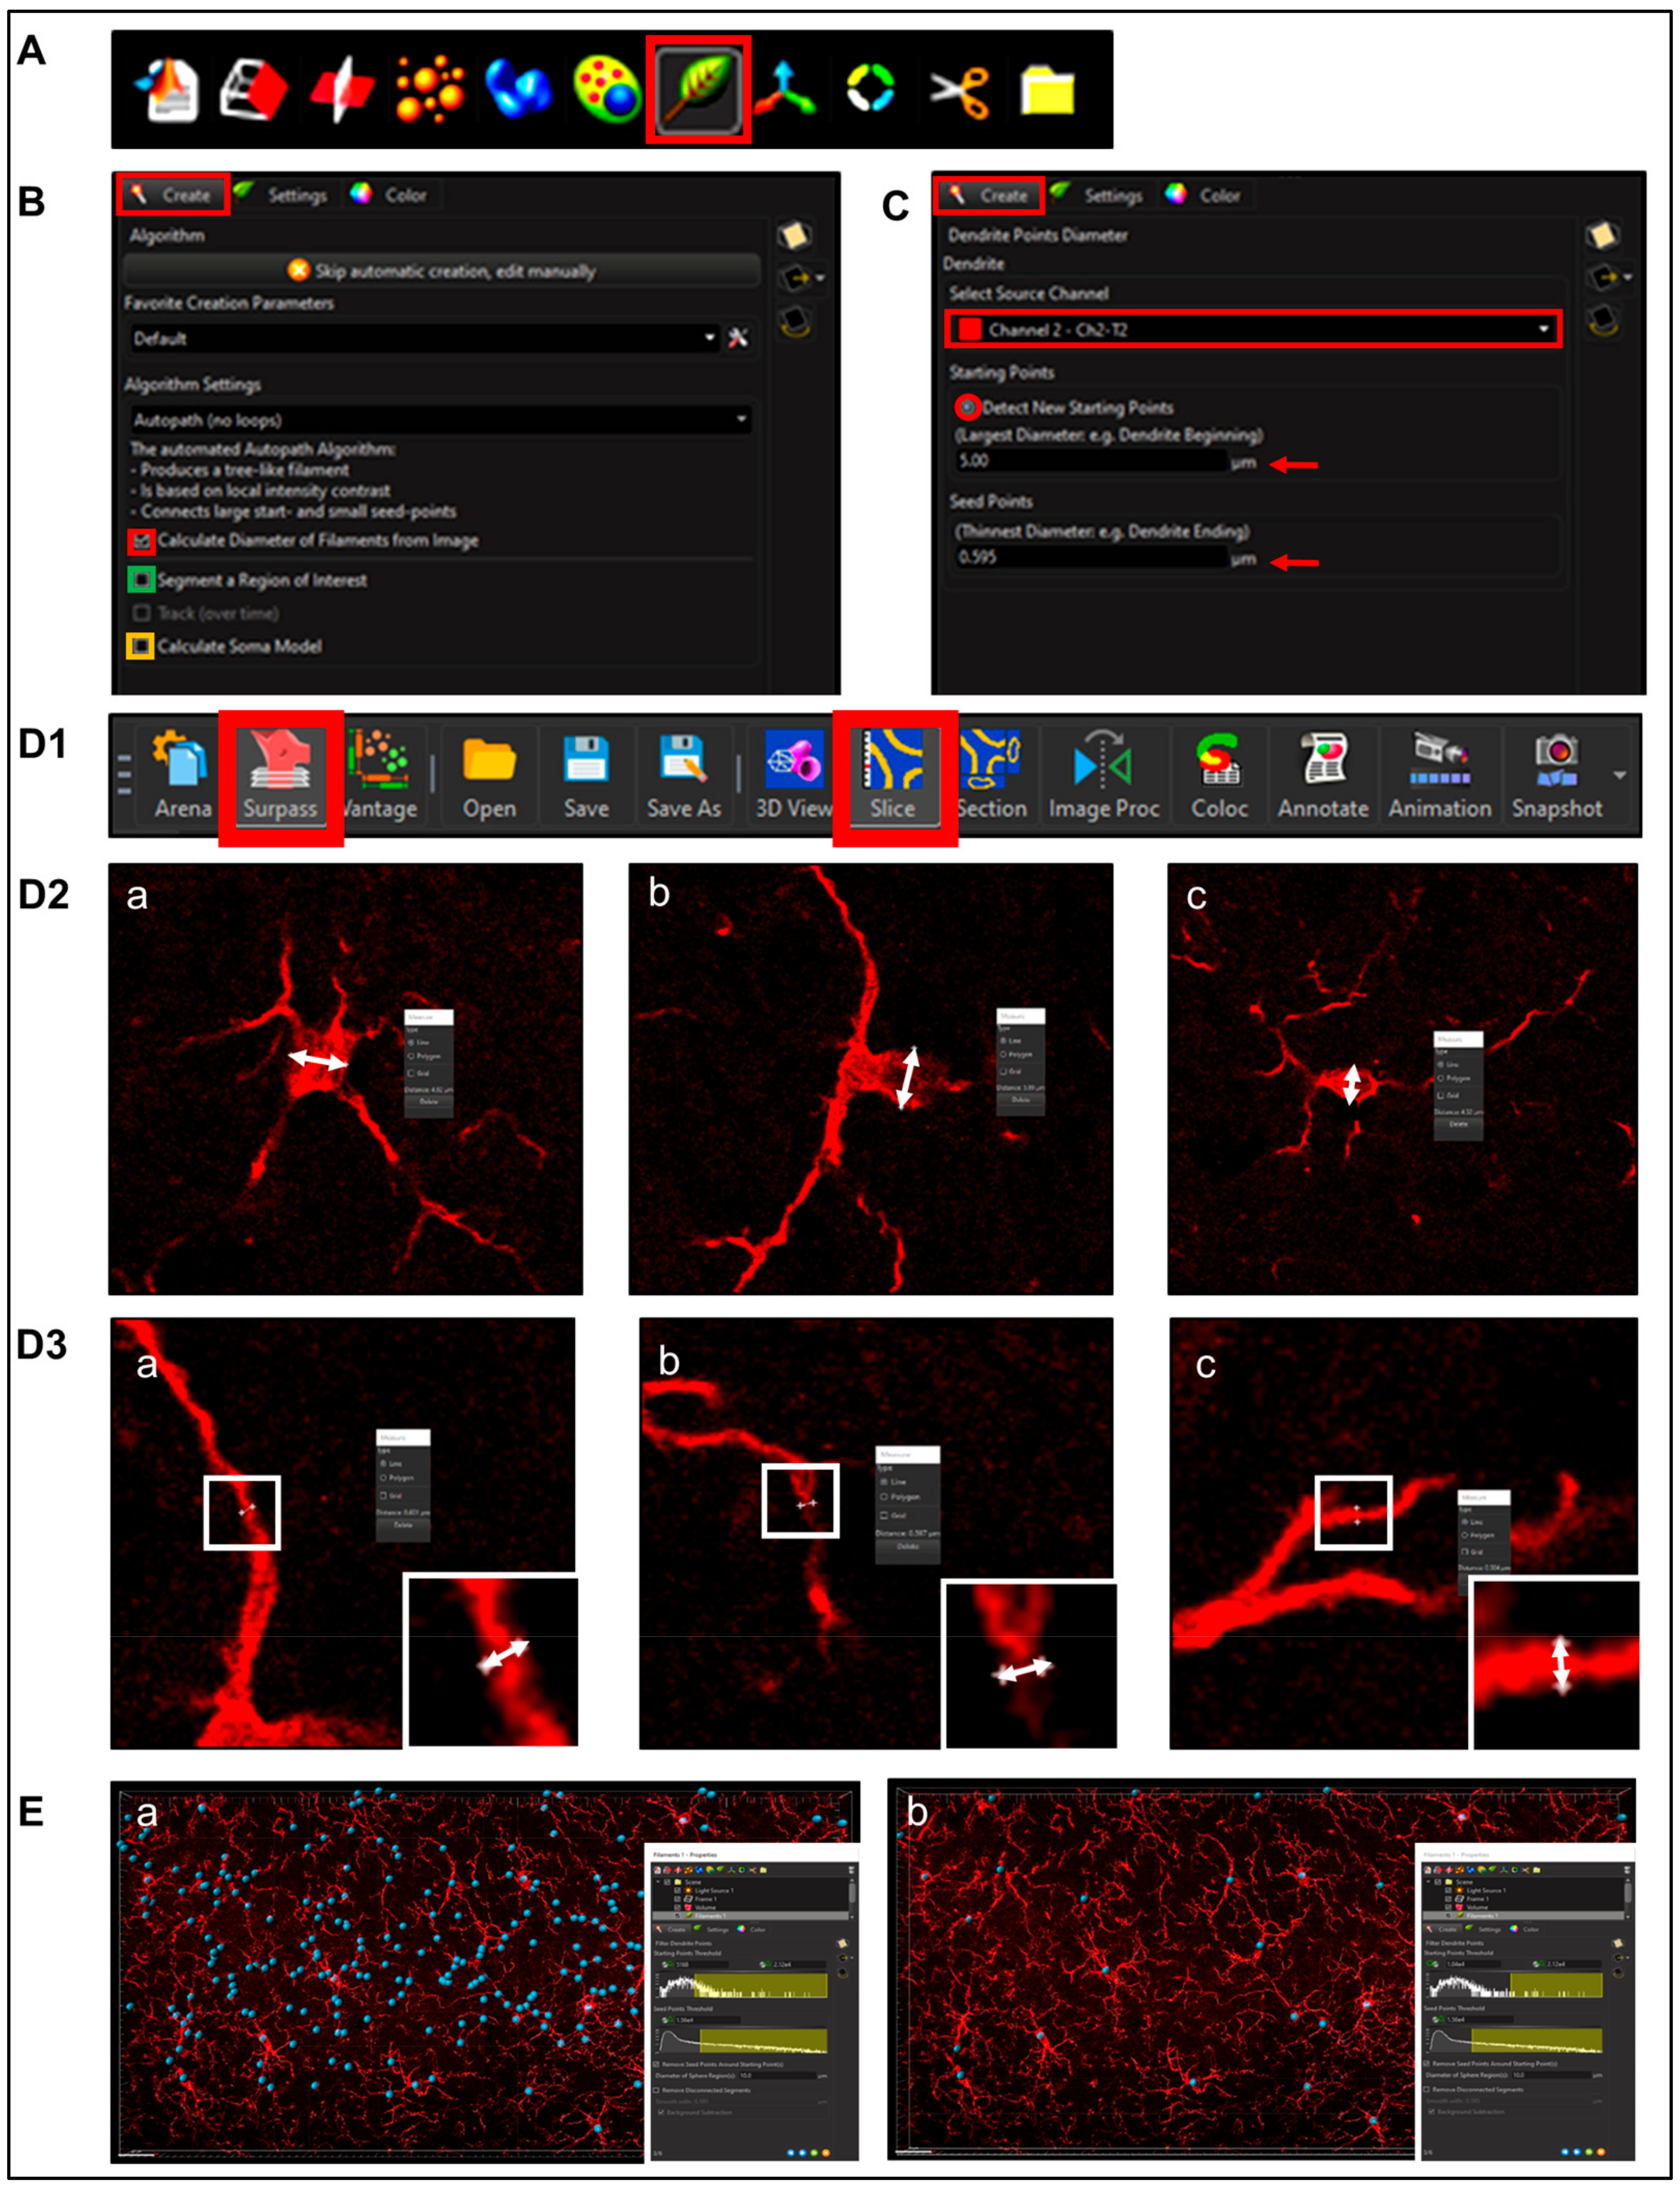
- Step 1. Setting Preliminary Creation Parameters (Figure 4B)
- Click to ‘calculate diameter of filaments from image’ (Figure 4B, red square). If the entire field will not be used, check off the ‘Region of Interest’ (ROI) box, where the field of view can be cropped on the x, y or z axis (Figure 4B, green square). Note: another option is that a surface render can be made where automatic creation is skipped and edited manually; a specific ROI can be contoured in drawing mode, copied to different slice positions to create that custom surface and masked to add another channel. This ensures that only specific cells or layers within the custom-contoured region can be rendered and quantified without interference from background noise or measurements from regions of interest (i.e., custom pyramidal cell layer within the CA1).
- After a render is created, create a protocol by saving the object characteristics using the ‘Magic Wand’ icon (Supplemental Figure S2); tab to access the saved ‘Favorite Creation Parameters’ (Figure 4B) is useful to quickly process subsequent files in the same manner.
- Selecting the ‘Soma Model’ checkbox attempts to create an object the actual size and shape of the soma in order to use it as a starting point that is more representative of the cellular volume and area (Figure 4B, yellow square). Limitations with this function are outlined below.
- Step 2.Determining Process ‘Point Diameters’ (Figure 4C; note: in the software is named ‘Dendrite Points Diameters’). Select the relevant source channel and input ‘starting’ and ‘seed point’ diameters.
- 1.
- Determining Starting Point Diameter
- 2.
- Determining ‘Seed Point Diameter’
- Step 3. Filtering Process Start Points.
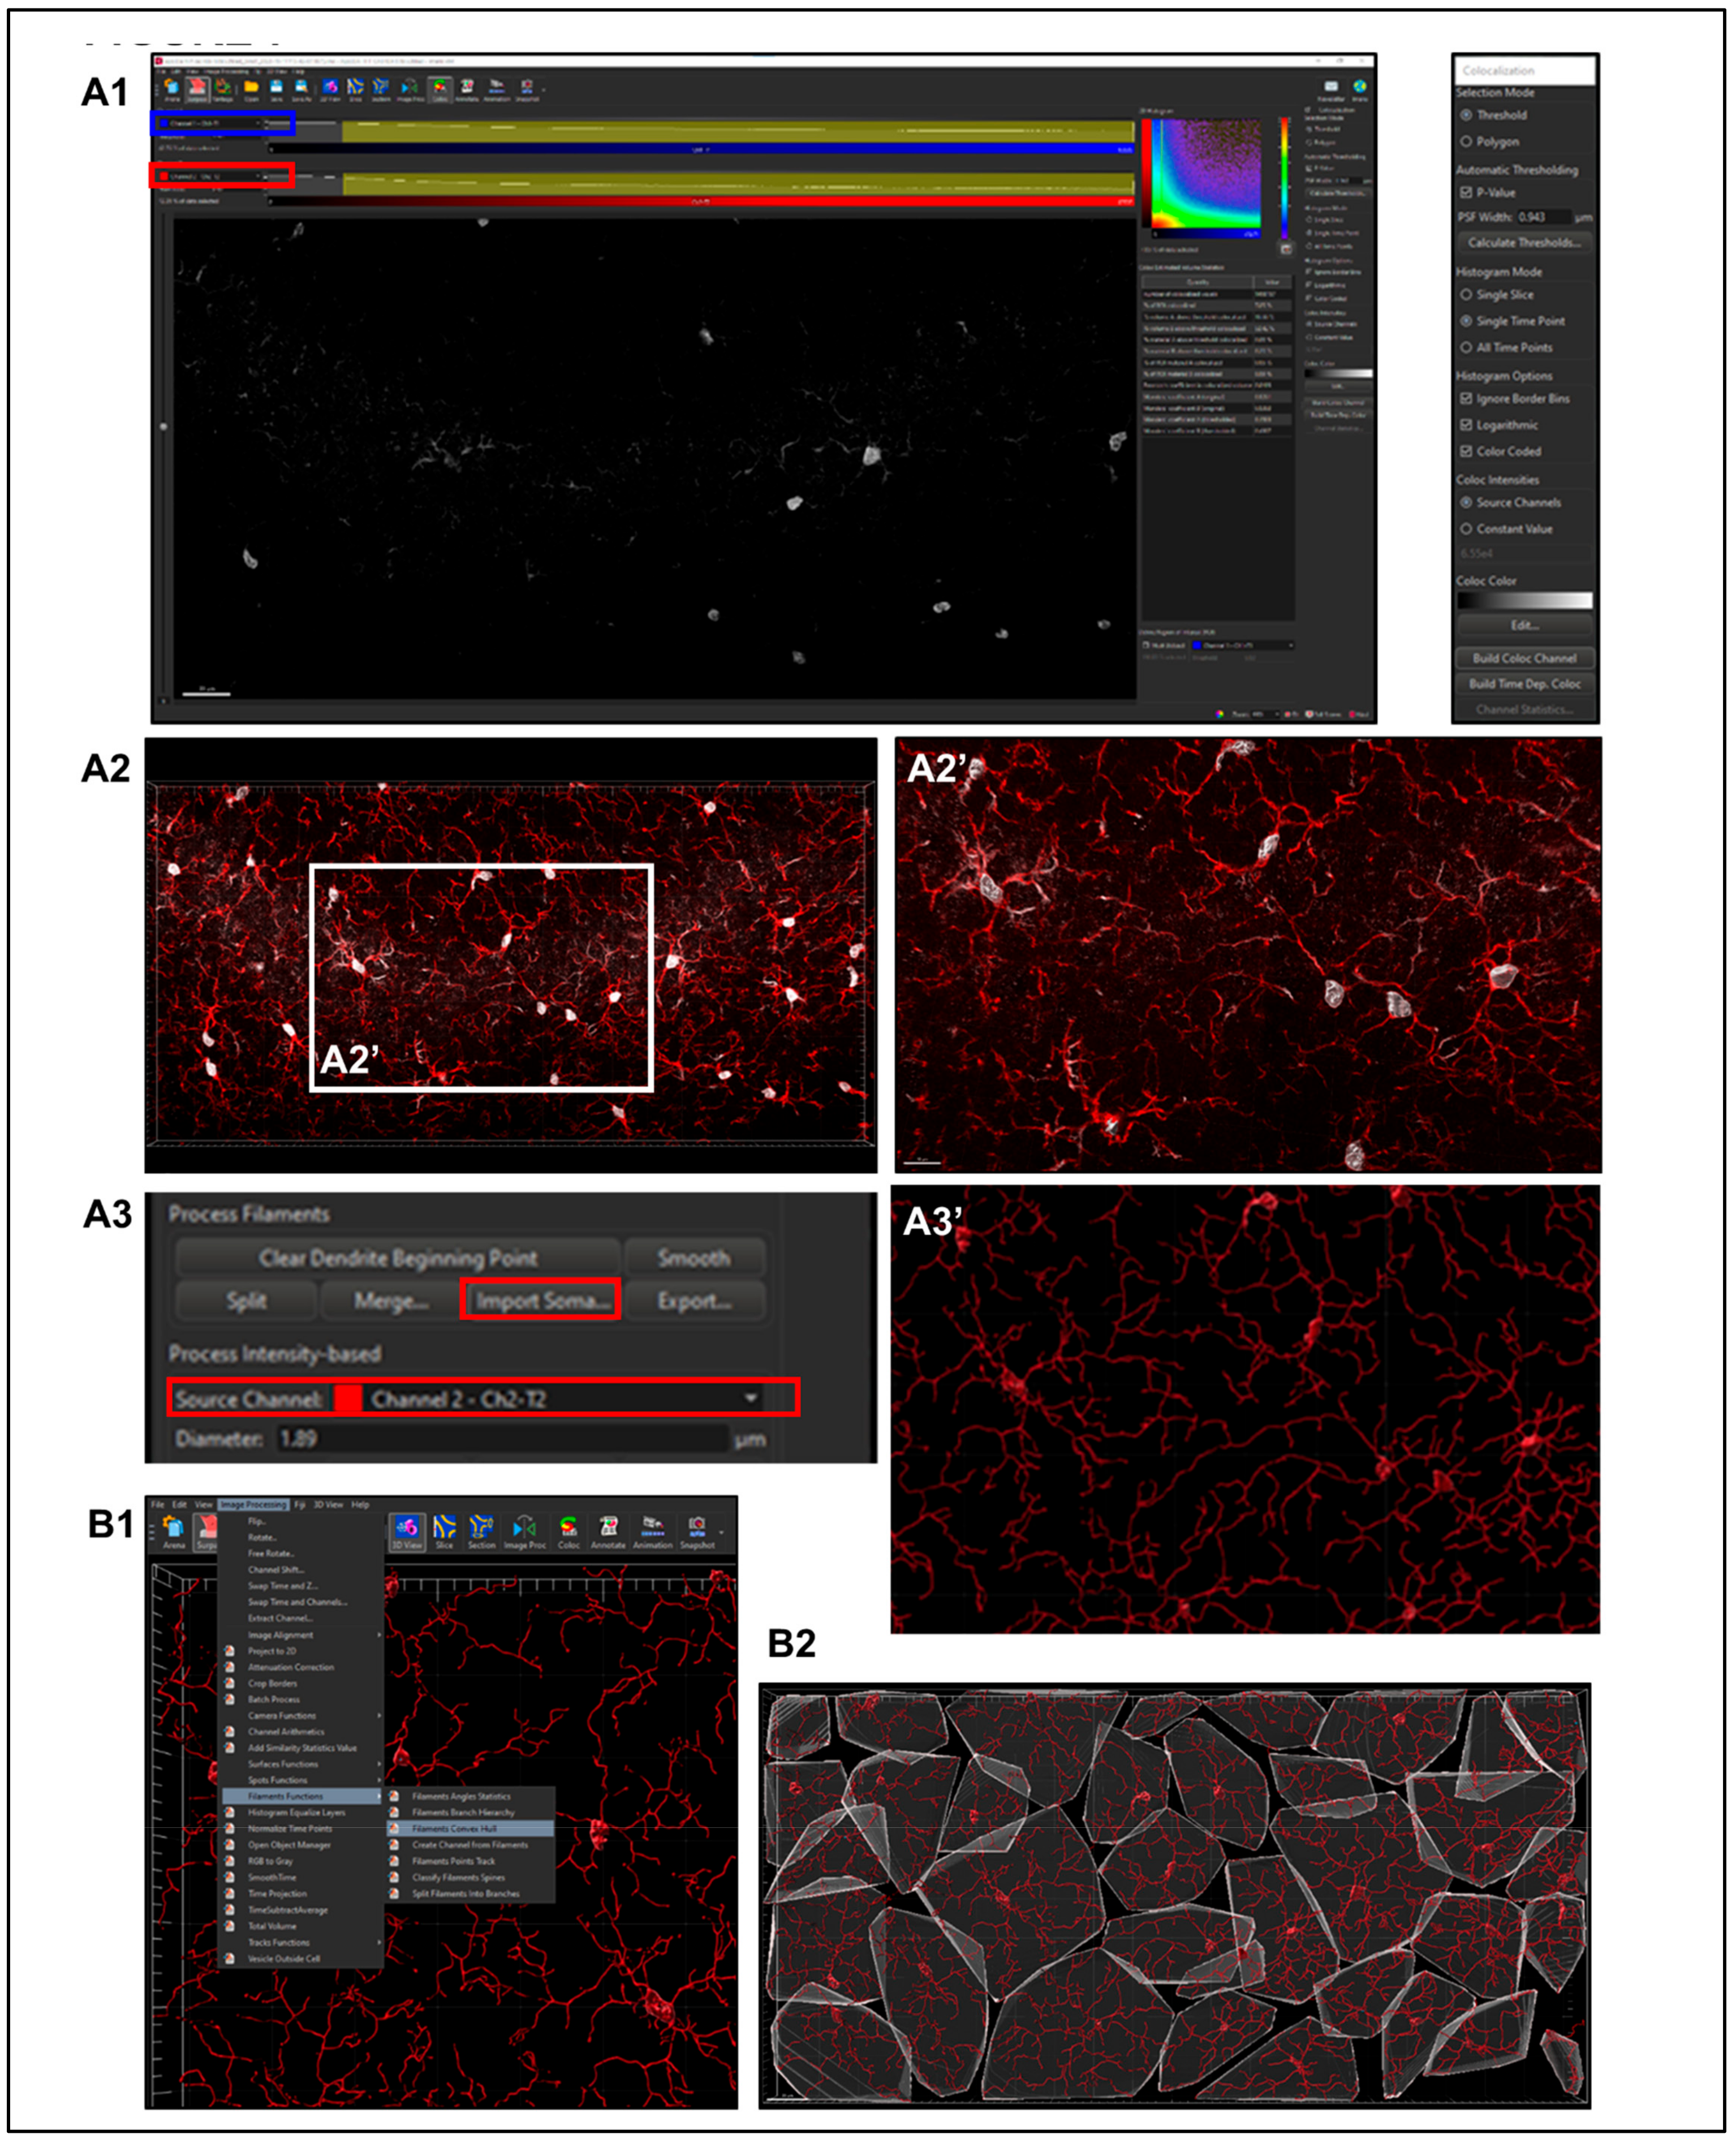
- Automatic detection is rarely accurate for this step (Figure 5A1), so manual threshold to the highest accuracy in coverage is most likely necessary. Afterwards, holding down shift and right or left clicking to add or delete starting points or seed points, respectively, will allow for refinement (Figure 5A2). Ensure that this point is within the center of the cell by toggling or rotating around various planes of the field since depth placement in the 3D plane may lead to inaccurate calculations (Figure 5A3). In our laboratory, we use DAPI co-staining to ensure that the selected cells have a nucleus within the confinement of the z-stack (Figure 5B). Be cautious with the depth of the starting point during manual insertion.
- The “Remove Seed Points Around Starting Point” function is important in mitigating false, hair-like filament creation around the higher intensity edges of the soma. This is also a reason why properly determining the starting point diameter is of importance (Figure 5C).
- The “Remove Disconnected Segments” (seen in White vs. Standard Creation without white) function can also be used to refine filament creation. The maximum gap length can be set in accordance with estimated measured distances between cells. This will keep filament autopathing during creating from making an unnecessary “leap” across the field to connect to a seed point placed in an area of high intensity (Figure 5D).
- Step 4. Soma Determination.
- Step 5. Setting Filament Diameter.
2.5.4. Post-Creation Image Processing
- Step 1. Negating Interfering Antibody Deposits.
- Step 2. Reducing Background.
2.5.5. Post-Creation Editing
- Step 1. Assessment of Creation Accuracy.
- Step 2. Importing Reconstructed Somas Replacing Starting Points.
2.5.6. Sholl Analysis
2.5.7. Convex Hull Analysis
2.5.8. Data Export
- Within the Arena home screen, select all files with completed rendering, select ‘Vantage Plot’ in the primary menu bar and find the desired statistical values within the drop-down menu of the ‘Plot Type’ section. If a value, such as Filament Volume (sum), is not listed within this menu, open ‘preferences’ > ‘statistics’ and ensure that the check box is filled.
- View the ‘Detailed statistics’ tab and order to detect outliers by visualizing the box and whisker plot. If there is a data point with an area, volume or length measurement of zero, this could be a sign that a lone starting point was falsely placed with no seed points to interconnect with. On the contrary, if a cell has exceedingly large values, it may have improperly conjoined with another cell, and this must be split with a new starting point being accurately placed on that string of filaments. Additionally, some filaments may have been clipped during editing and separated from a starting point. This will provide measurement points within a spreadsheet without assigning to a cell, which could improperly shift columns or rows of data, leading to frameshift mis-assignments and mislabeling errors. Careful assessment of outlier points for rendering errors provides an additional layer of confidence that the rendering is representative of the tissue.
- Once confident that creation errors are eliminated, click the save button within the ‘Plot Number Areas’ section to export these data to a workable spreadsheet.
- Within the current version of Imaris, there is no tool to aggregate the Filament number Sholl Intersection points with the specific Sholl sphere radius intersection within Vantage plot. As aforementioned, the detailed specific values data can be accessed within the statistics tab of each file. If all those Excel files are saved to the same folder, an Excel consolidation extension, such as Ablebits (https://www.ablebits.com/downloads/index.php, accessed on 4 January 2023), expedites the process of merging data in multiple spreadsheets to one workbook, selecting all sheets and editing to organize or remove nonessential columns and headers and then consolidating selected worksheets into one sheet. This process places the copied ranges under one another with the names of the source sheets to the first column, which is imperative to match identifiers to their data points. Ultimately, this creates a column layout for each Sholl intersection at every (1 μm) radius for all cells per file.
- All data from exported files can then be consolidated into a master spreadsheet. Given the large size of the exported files, the file format of .xls should be chosen to avoid data corruption. Consistent file naming allows for new columns to be generated using the FlashFill feature of Word Excel software 6. Pivot tables can be used to summarize data according to different groups. After highlighting the dataset, variables derived from column headers will appear in a list. Variables can be assigned as row, column or filter in order to build out the table.
2.6. Statistics
3. Results
3.1. Difference in Number of MLCs Reactive to IUGR, Chorio and HI
3.2. Morphometric Differences in Process (Filament) Length and Volume of Iba1+ MLCs between Models of Perinatal Brain Injury
3.3. Evaluation of Complexity of Iba1+ Processes in MLCs in Response to Perinatal Brain Injury Using Imaris Software
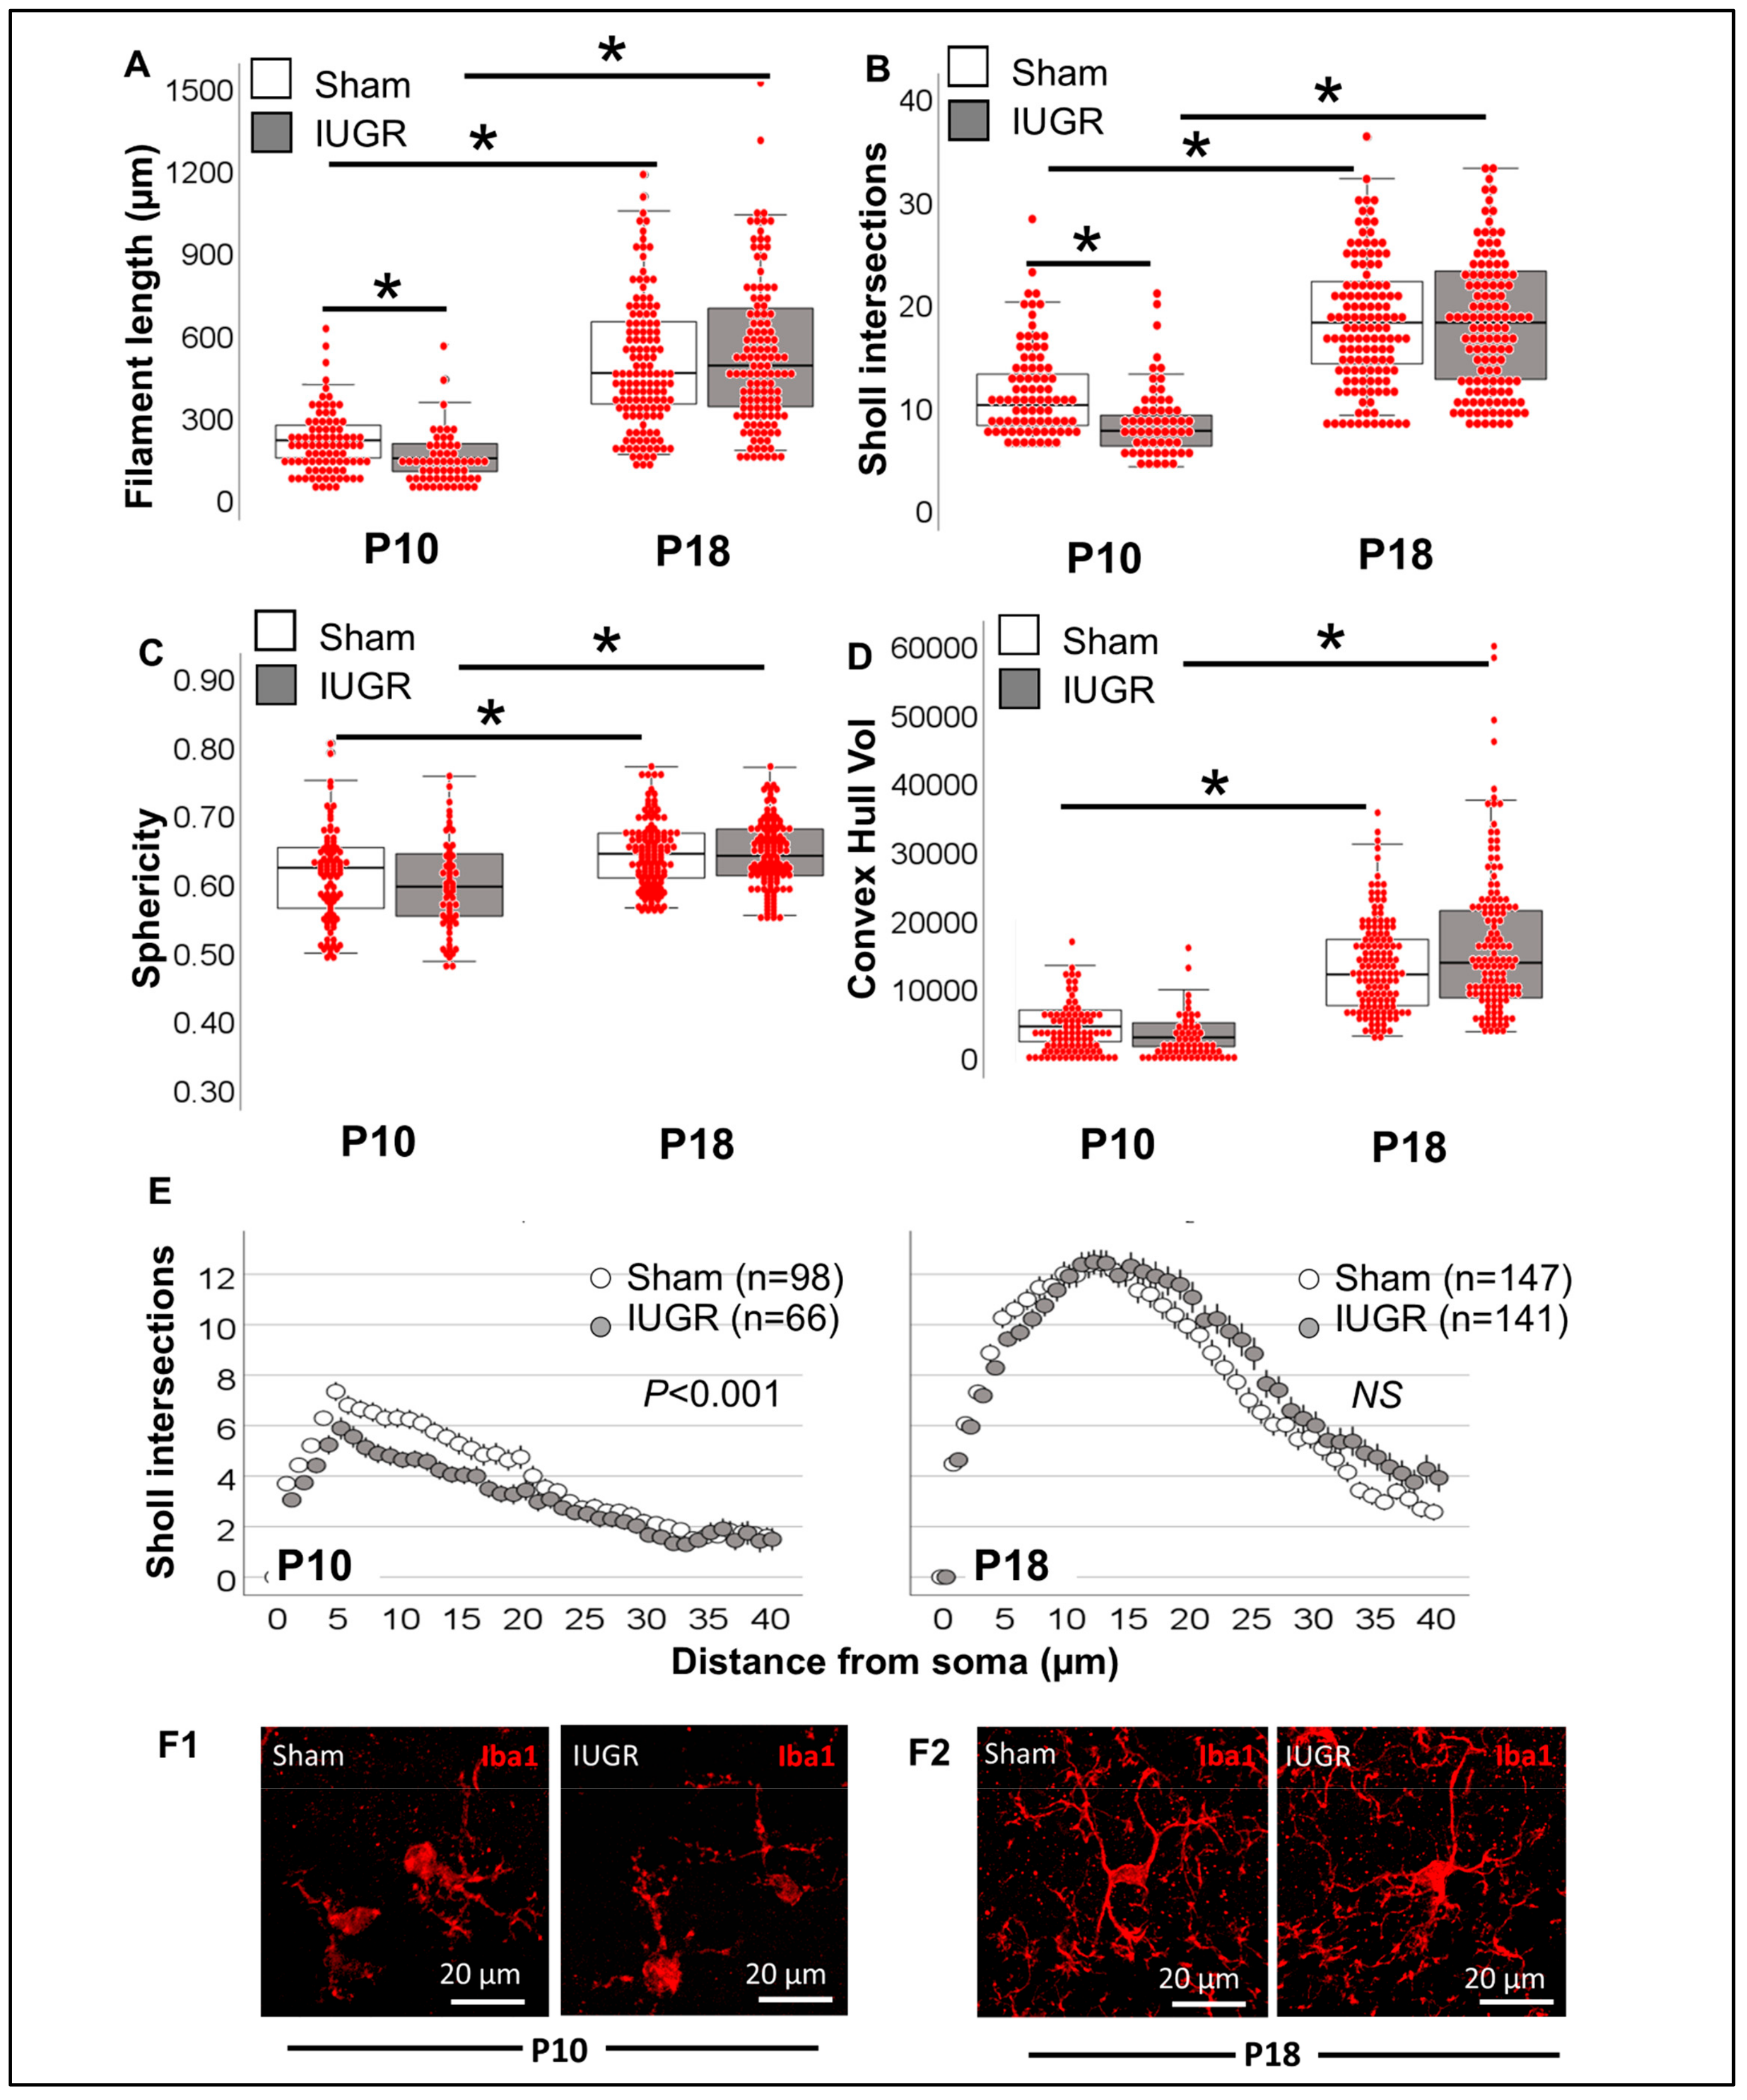
3.3.1. Single-Cell Morphometric Analysis of Iba1+ MLCs in the IUGR Model
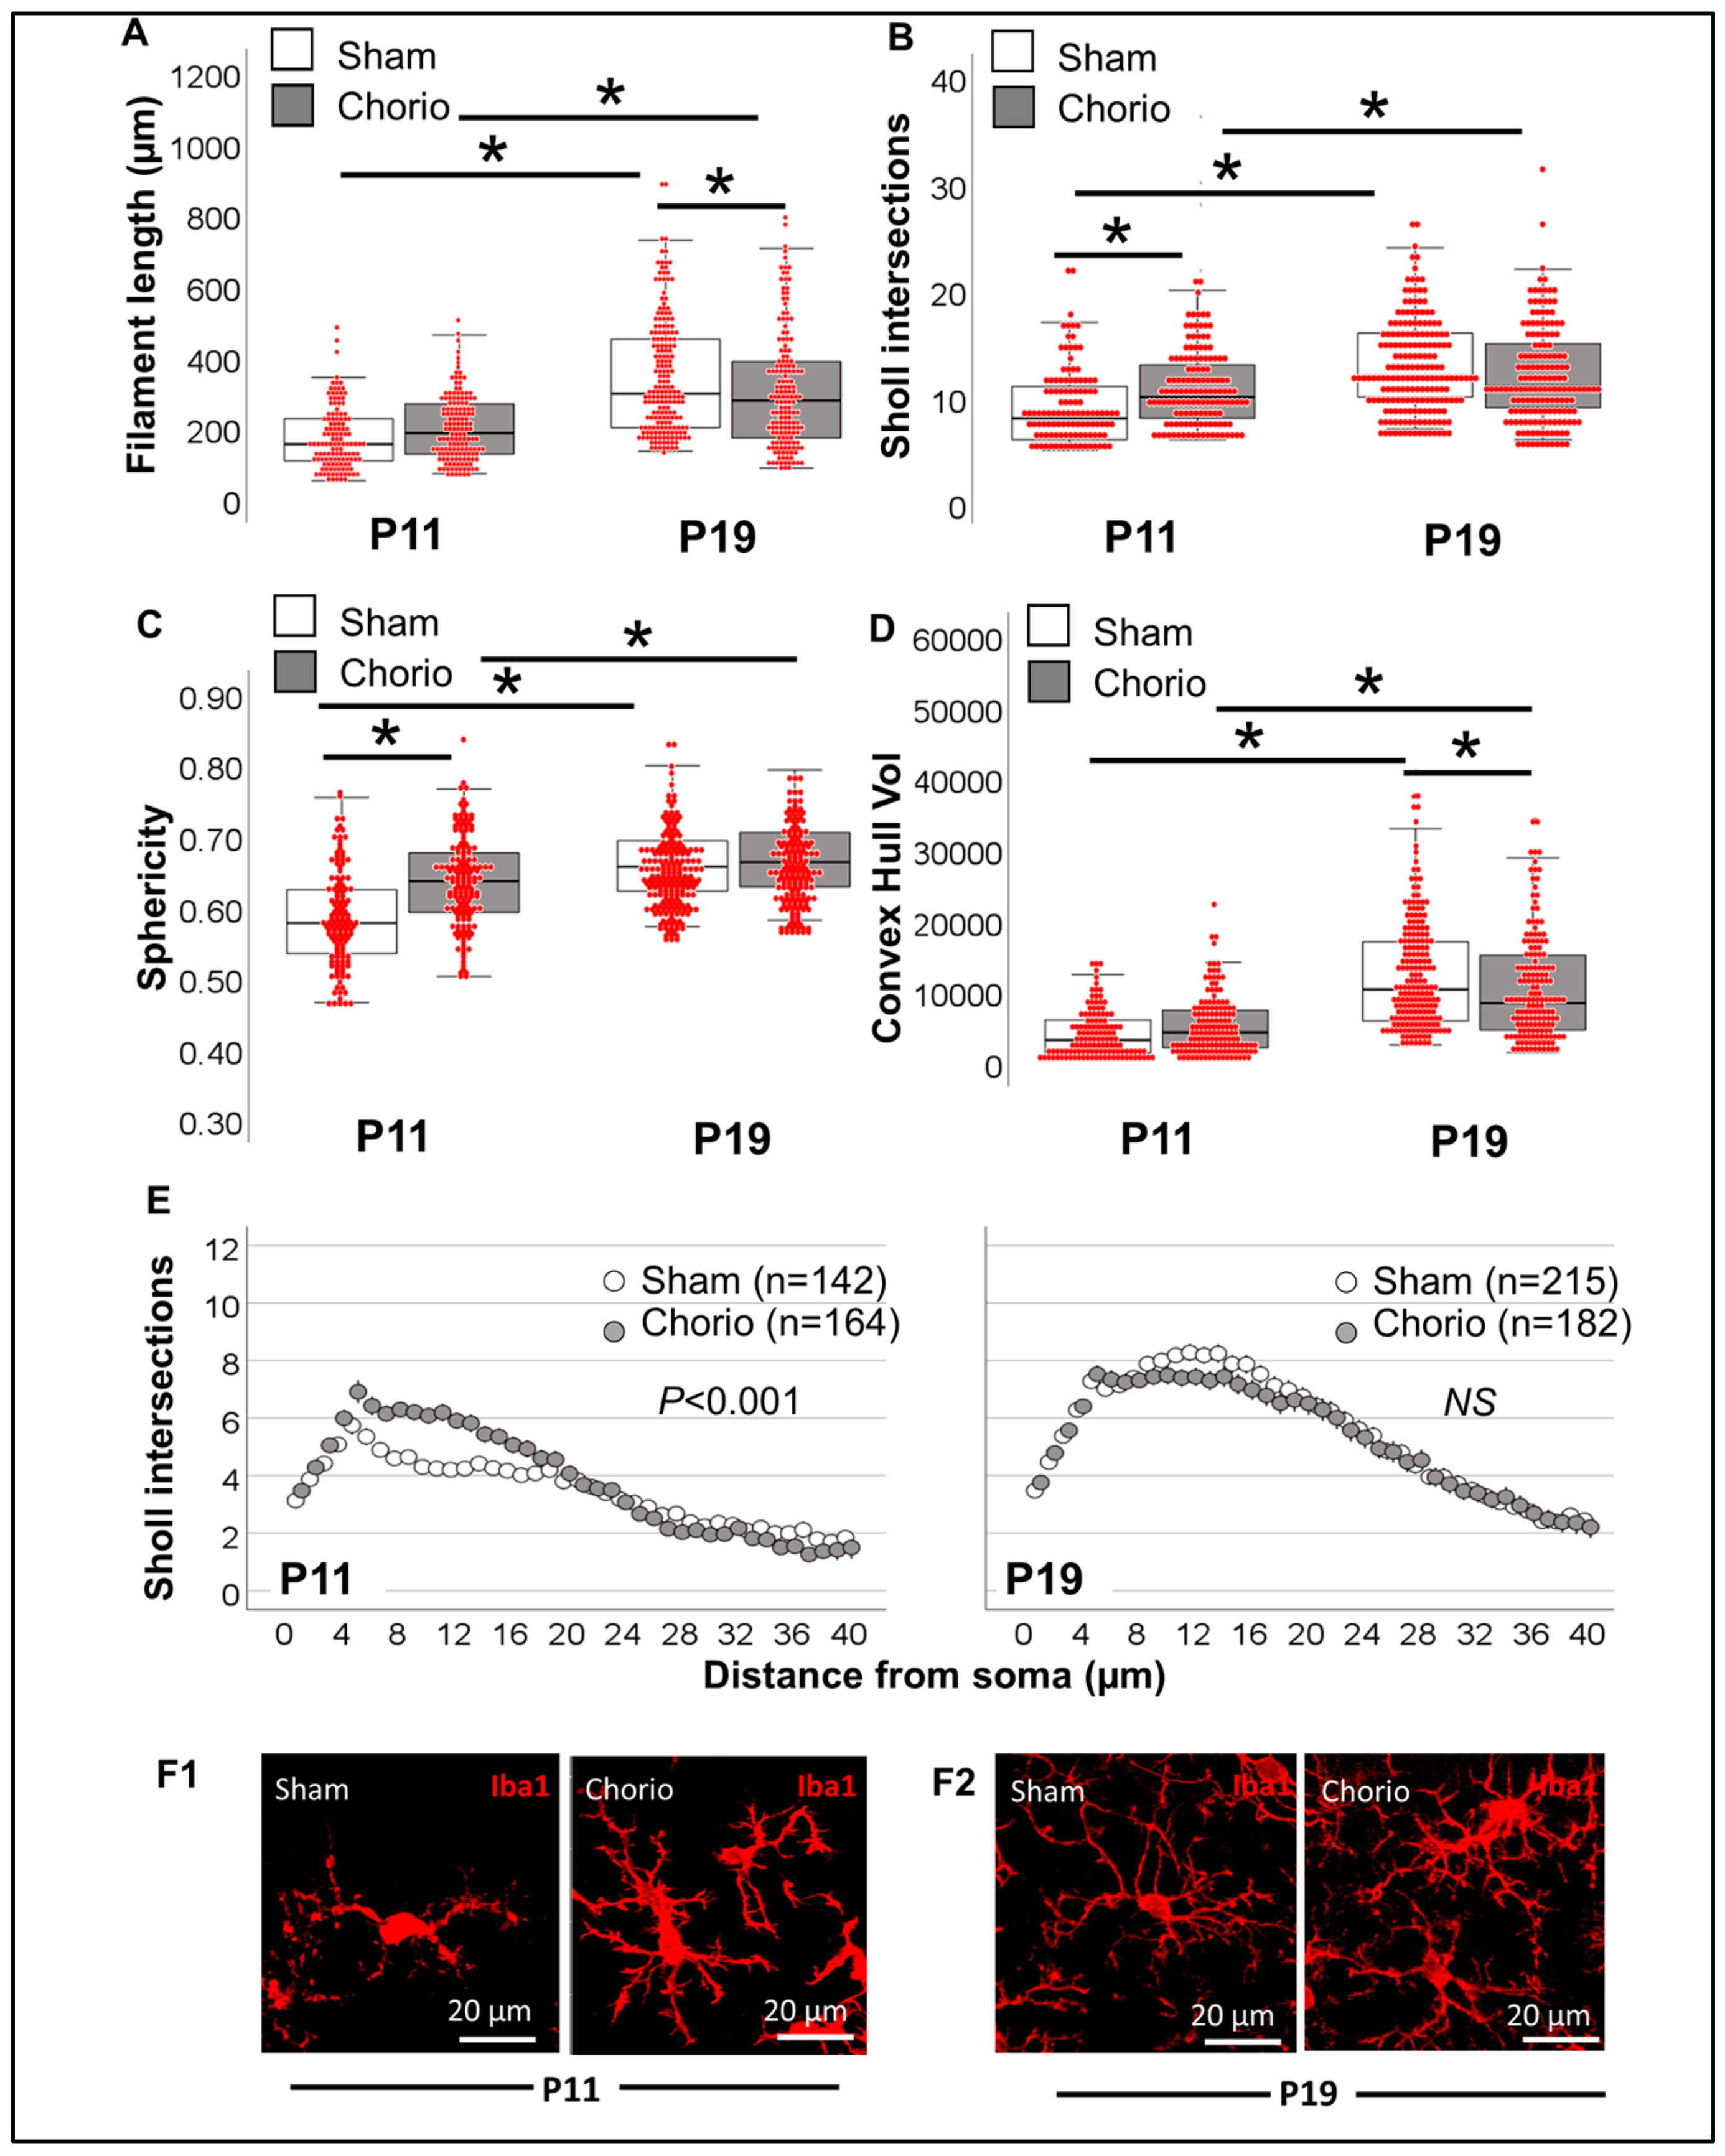
3.3.2. Single-Cell Morphometric Analysis of Iba1+ MLCs in the Chorioamnionitis Model
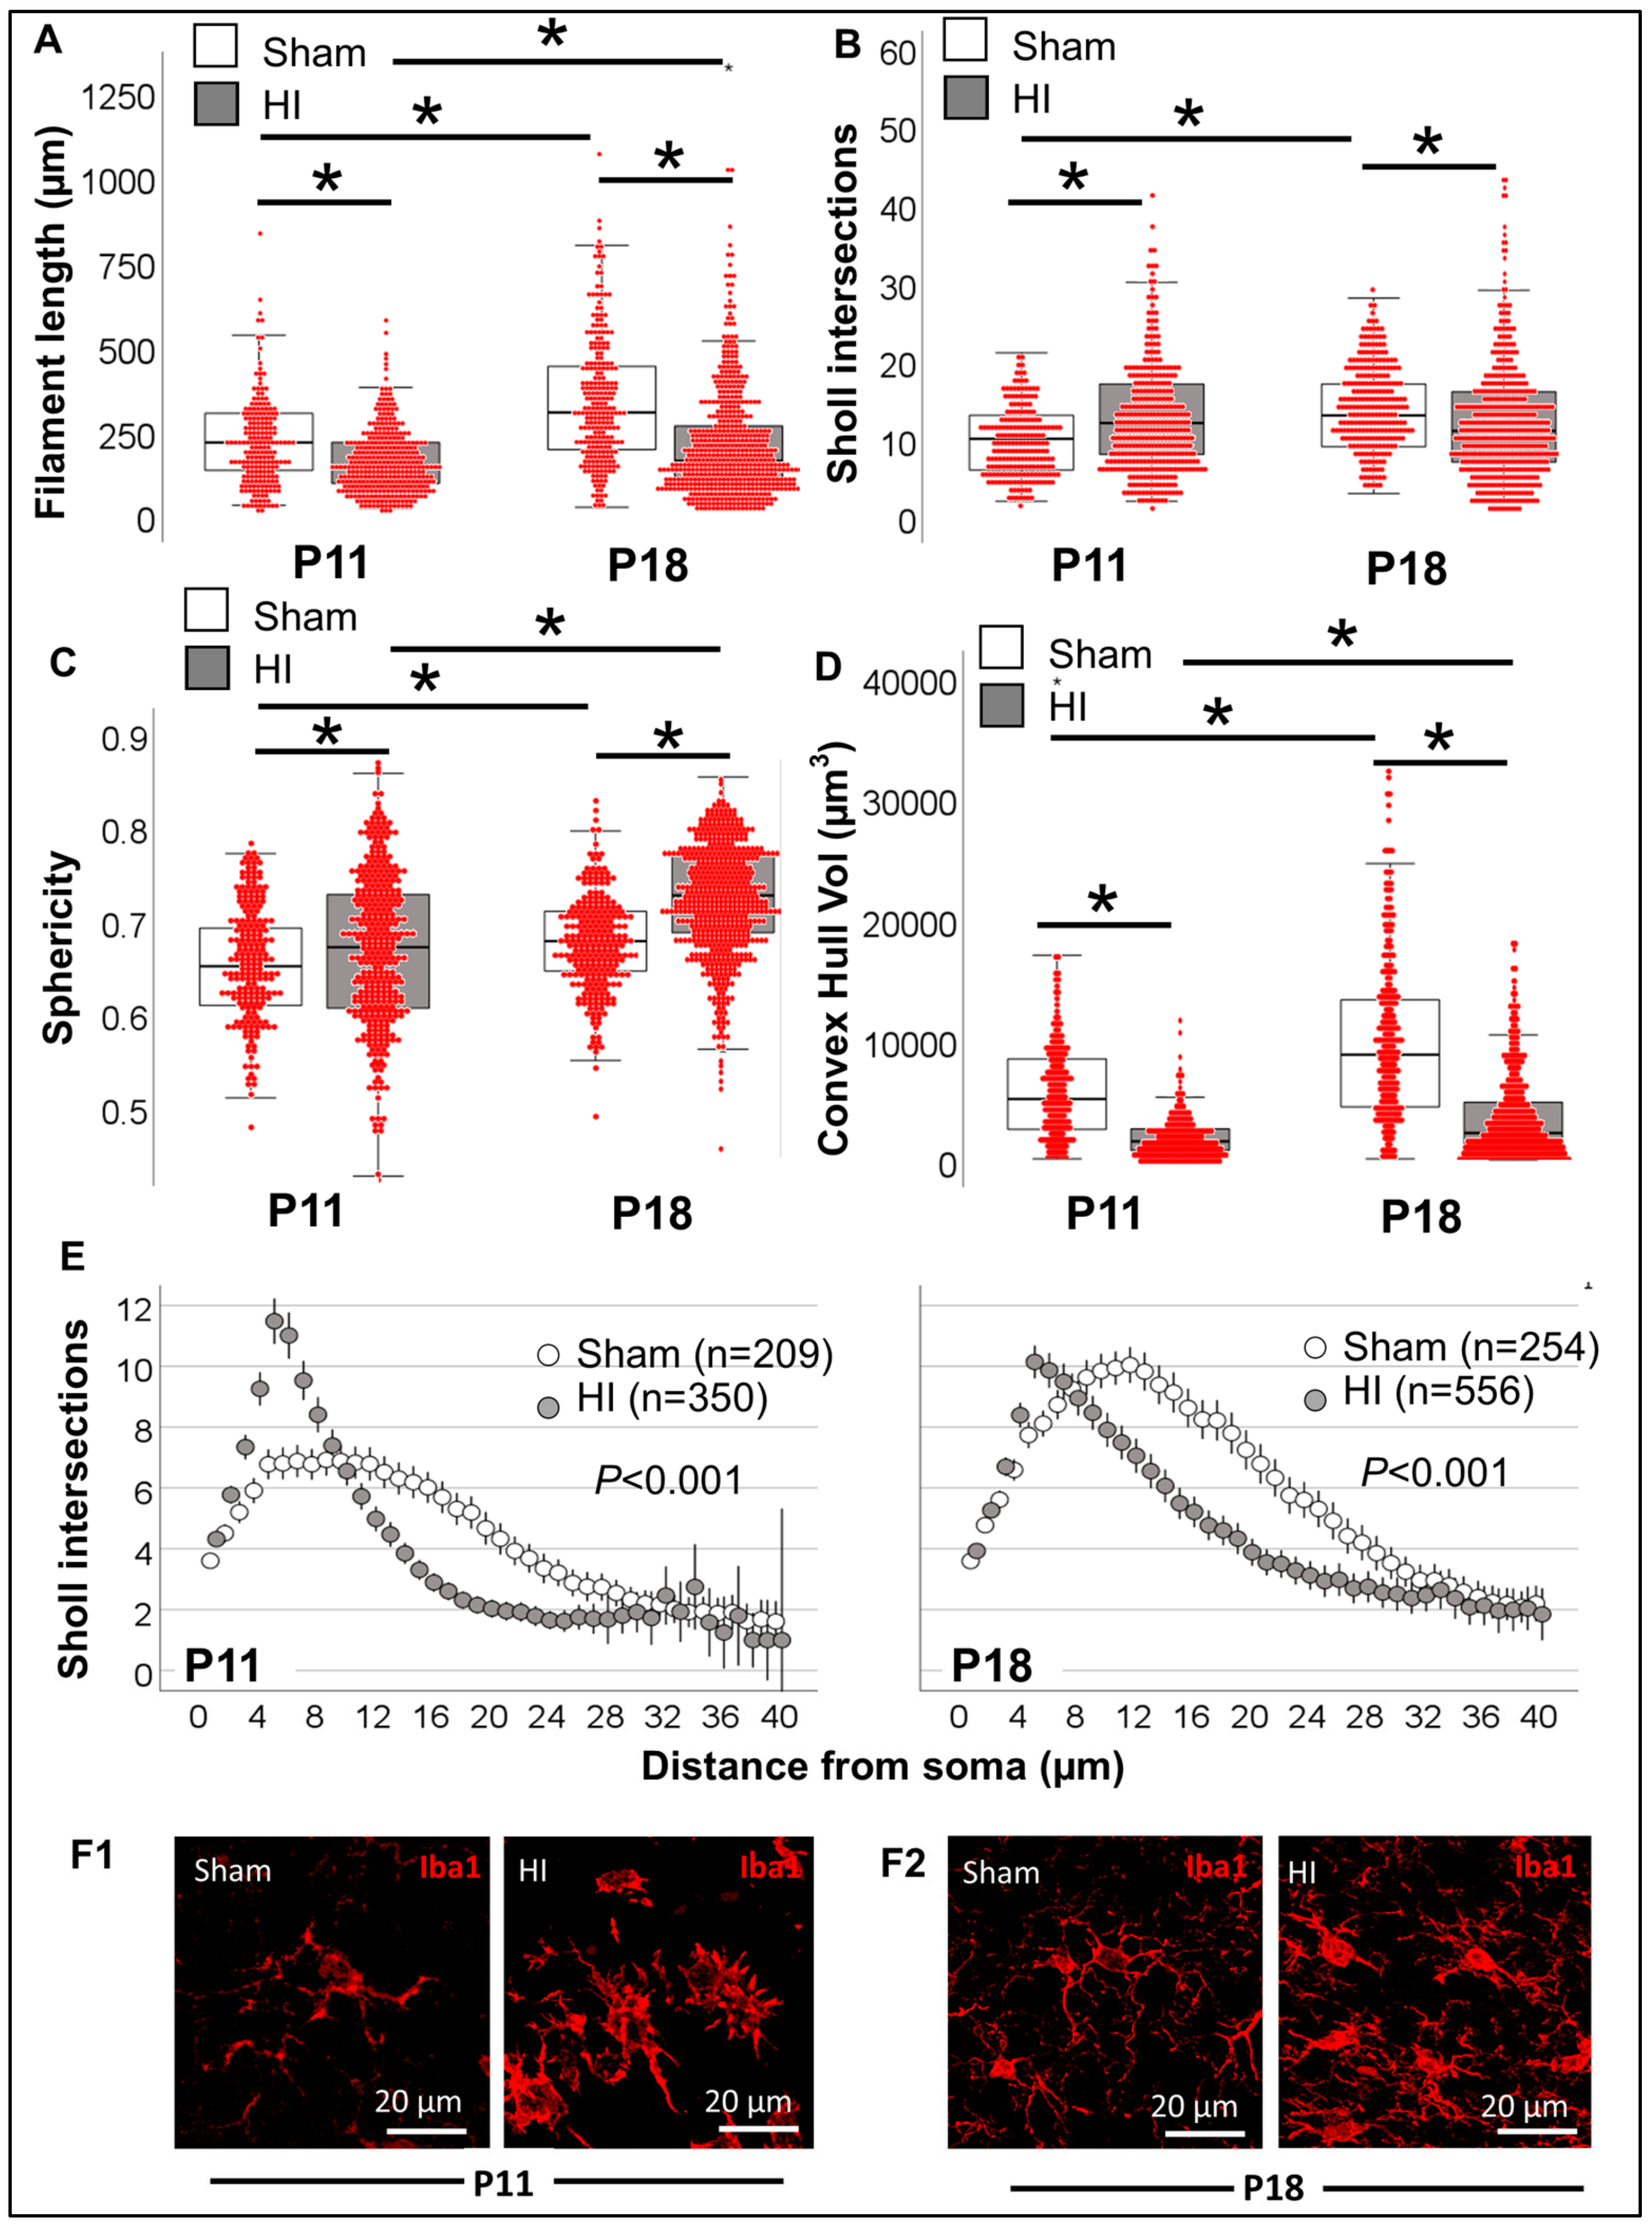
3.3.3. Single-Cell Morphometric Analysis of Iba1+ MLCs in the Neonatal HI Model
4. Discussion
5. Conclusions
Supplementary Materials
Author Contributions
Funding
Institutional Review Board Statement
Informed Consent Statement
Data Availability Statement
Acknowledgments
Conflicts of Interest
References
- Leyh, J.; Paeschke, S.; Mages, B.; Michalski, D.; Nowicki, M.; Bechmann, I.; Winter, K. Classification of Microglial Morphological Phenotypes Using Machine Learning. Front. Cell. Neurosci. 2021, 15, 701673. [Google Scholar] [CrossRef]
- Paolicelli, R.C.; Sierra, A.; Stevens, B.; Tremblay, M.E.; Aguzzi, A.; Ajami, B.; Amit, I.; Audinat, E.; Bechmann, I.; Bennett, M.; et al. Microglia states and nomenclature: A field at its crossroads. Neuron 2022, 110, 3458–3483. [Google Scholar] [CrossRef] [PubMed]
- Lenz, K.M.; Nelson, L.H. Microglia and Beyond: Innate Immune Cells as Regulators of Brain Development and Behavioral Function. Front. Immunol. 2018, 9, 698. [Google Scholar] [CrossRef] [PubMed] [Green Version]
- Cengiz, P.; Zafer, D.; Chandrashekhar, J.H.; Chanana, V.; Bogost, J.; Waldman, A.; Novak, B.; Kintner, D.B.; Ferrazzano, P.A. Developmental differences in microglia morphology and gene expression during normal brain development and in response to hypoxia-ischemia. Neurochem. Int. 2019, 127, 137–147. [Google Scholar] [CrossRef]
- Wurm, J.; Konttinen, H.; Andressen, C.; Malm, T.; Spittau, B. Microglia Development and Maturation and Its Implications for Induction of Microglia-Like Cells from Human iPSCs. Int. J. Mol. Sci. 2021, 22, 3088. [Google Scholar] [CrossRef]
- Jantzie, L.L.; Maxwell, J.R.; Newville, J.C.; Yellowhair, T.R.; Kitase, Y.; Madurai, N.; Ramachandra, S.; Bakhireva, L.N.; Northington, F.J.; Gerner, G.; et al. Prenatal opioid exposure: The next neonatal neuroinflammatory disease. Brain Behav. Immun. 2020, 84, 45–58. [Google Scholar] [CrossRef] [PubMed]
- Sivaguru, M.; Khaw, Y.M.; Inoue, M. A Confocal Reflection Super-Resolution Technique to Image Golgi-Cox Stained Neurons. J. Microsc. 2019, 275, 115–130. [Google Scholar] [CrossRef] [PubMed]
- Sandison, D.R.; Piston, D.W.; Williams, R.M.; Webb, W.W. Quantitative comparison of background rejection, signal-to-noise ratio, and resolution in confocal and full-field laser scanning microscopes. Appl. Opt. 1995, 34, 3576–3588. [Google Scholar] [CrossRef]
- Rey-Villamizar, N.; Somasundar, V.; Megjhani, M.; Xu, Y.; Lu, Y.; Padmanabhan, R.; Trett, K.; Shain, W.; Roysam, B. Large-scale automated image analysis for computational profiling of brain tissue surrounding implanted neuroprosthetic devices using Python. Front. Neuroinform. 2014, 8, 39. [Google Scholar] [CrossRef] [PubMed] [Green Version]
- Salamanca, L.; Mechawar, N.; Murai, K.K.; Balling, R.; Bouvier, D.S.; Skupin, A. MIC-MAC: An automated pipeline for high-throughput characterization and classification of three-dimensional microglia morphologies in mouse and human postmortem brain samples. Glia 2019, 67, 1496–1509. [Google Scholar] [CrossRef] [Green Version]
- St Pierre, M.; Rastogi, N.; Brown, A.; Parmar, P.; Lechner, C.; Fung, C.; Chavez-Valdez, R. Intrauterine Growth Restriction Disrupts the Postnatal Critical Period of Synaptic Plasticity in the Mouse Dorsal Hippocampus in a Model of Hypertensive Disease of Pregnancy. Dev. Neurosci. 2022, 44, 214–232. [Google Scholar] [CrossRef] [PubMed]
- Brown, A.S.; Wieben, M.; Murdock, S.; Chang, J.; Dizon, M.L.V.; St Pierre, M.; Chavez-Valdez, R.; Dorsky, R.I.; Fung, C.M. Intrauterine Growth Restriction Causes Abnormal Embryonic Dentate Gyrus Neurogenesis in Mouse Offspring That Leads to Adult Learning and Memory Deficits. eNeuro 2021, 8, ENEURO.0062-21.2021. [Google Scholar] [CrossRef] [PubMed]
- Nugent, M.S.P.M.; Brown, A.; Nassar, S.; Kitase, K.; Duck, S.A.; Pinto, C.; Jantzie, L.; Fung, C.; Chavez-Valdez, R. Sexual dimorphism in the closure of the hippocampal critical period synaptic plasticity after intrauterine growth restriction—Link to oligodendrocyte and glial dysregulation. Dev. Neurosci. 2023, in press. [Google Scholar]
- Mallard, E.C.; Rehn, A.; Rees, S.; Tolcos, M.; Copolov, D. Ventriculomegaly and reduced hippocampal volume following intrauterine growth-restriction: Implications for the aetiology of schizophrenia. Schizophr. Res. 1999, 40, 11–21. [Google Scholar] [CrossRef]
- Fung, C.; Brown, A.; Cox, J.; Callaway, C.; McKnight, R.; Lane, R. Novel thromboxane A2 analog-induced IUGR mouse model. J. Dev. Orig. Health Dis. 2011, 2, 291–301. [Google Scholar] [CrossRef] [PubMed]
- Chang, J.L.; Bashir, M.; Santiago, C.; Farrow, K.; Fung, C.; Brown, A.S.; Dettman, R.W.; Dizon, M.L.V. Intrauterine Growth Restriction and Hyperoxia as a Cause of White Matter Injury. Dev. Neurosci. 2018, 40, 344–357. [Google Scholar] [CrossRef]
- Chini, M.; Hanganu-Opatz, I.L. Prefrontal Cortex Development in Health and Disease: Lessons from Rodents and Humans. Trends Neurosci. 2021, 44, 227–240. [Google Scholar] [CrossRef]
- Badawi, N.; Kurinczuk, J.J.; Keogh, J.M.; Alessandri, L.M.; O’Sullivan, F.; Burton, P.R.; Pemberton, P.J.; Stanley, F.J. Intrapartum risk factors for newborn encephalopathy: The Western Australian case-control study. BMJ 1998, 317, 1554–1558. [Google Scholar] [CrossRef] [Green Version]
- Bastek, J.A.; Brown, A.G.; Anton, L.; Srinivas, S.K.; D’Addio, A.; Elovitz, M.A. Biomarkers of inflammation and placental dysfunction are associated with subsequent preterm birth. J. Matern.-Fetal Neonatal Med. 2011, 24, 600–605. [Google Scholar] [CrossRef]
- Redline, R.W. Correlation of Placental Pathology with Perinatal Brain Injury. Surg. Pathol. Clin. 2013, 6, 153–180. [Google Scholar] [CrossRef]
- Jantzie, L.L.; Corbett, C.J.; Berglass, J.; Firl, D.J.; Flores, J.; Mannix, R.; Robinson, S. Complex pattern of interaction between in utero hypoxia-ischemia and intra-amniotic inflammation disrupts brain development and motor function. J. Neuroinflammation 2014, 11, 131. [Google Scholar] [CrossRef] [Green Version]
- Jantzie, L.L.; Winer, J.L.; Maxwell, J.R.; Chan, L.A.; Robinson, S. Modeling Encephalopathy of Prematurity Using Prenatal Hypoxia-ischemia with Intra-amniotic Lipopolysaccharide in Rats. J. Vis. Exp. 2015, 105, e53196. [Google Scholar] [CrossRef] [Green Version]
- Maxwell, J.R.; Denson, J.L.; Joste, N.E.; Robinson, S.; Jantzie, L.L. Combined in utero hypoxia-ischemia and lipopolysaccharide administration in rats induces chorioamnionitis and a fetal inflammatory response syndrome. Placenta 2015, 36, 1378–1384. [Google Scholar] [CrossRef] [PubMed]
- Chavez-Valdez, R.; Emerson, P.; Goffigan-Holmes, J.; Kirkwood, A.; Martin, L.J.; Northington, F.J. Delayed injury of hippocampal interneurons after neonatal hypoxia-ischemia and therapeutic hypothermia in a murine model. Hippocampus 2018, 28, 617–630. [Google Scholar] [CrossRef] [PubMed]
- Chavez-Valdez, R.; Lechner, C.; Emerson, P.; Northington, F.J.; Martin, L.J. Accumulation of PSA-NCAM marks nascent neurodegeneration in the dorsal hippocampus after neonatal hypoxic-ischemic brain injury in mice. J. Cereb. Blood Flow Metab. 2021, 41, 1039–1057. [Google Scholar] [CrossRef]
- Northington, F.J.; Kratimenos, P.; Turnbill, V.; Flock, D.L.; Asafu-Adjaye, D.; Chavez-Valdez, R.; Martin, L.J. Basal forebrain magnocellular cholinergic systems are damaged in mice following neonatal hypoxia-ischemia. J. Comp. Neurol. 2022, 530, 1148–1163. [Google Scholar] [CrossRef] [PubMed]
- Ajami, B.; Bennett, J.L.; Krieger, C.; Tetzlaff, W.; Rossi, F.M. Local self-renewal can sustain CNS microglia maintenance and function throughout adult life. Nat. Neurosci. 2007, 10, 1538–1543. [Google Scholar] [CrossRef] [PubMed]
- Bruttger, J.; Karram, K.; Wortge, S.; Regen, T.; Marini, F.; Hoppmann, N.; Klein, M.; Blank, T.; Yona, S.; Wolf, Y.; et al. Genetic Cell Ablation Reveals Clusters of Local Self-Renewing Microglia in the Mammalian Central Nervous System. Immunity 2015, 43, 92–106. [Google Scholar] [CrossRef] [Green Version]
- Adeluyi, A.; Guerin, L.; Fisher, M.L.; Galloway, A.; Cole, R.D.; Chan, S.S.L.; Wyatt, M.D.; Davis, S.W.; Freeman, L.R.; Ortinski, P.I.; et al. Microglia morphology and proinflammatory signaling in the nucleus accumbens during nicotine withdrawal. Sci. Adv. 2019, 5, eaax7031. [Google Scholar] [CrossRef] [PubMed] [Green Version]
- Jolivel, V.; Brun, S.; Biname, F.; Benyounes, J.; Taleb, O.; Bagnard, D.; De Seze, J.; Patte-Mensah, C.; Mensah-Nyagan, A.G. Microglial Cell Morphology and Phagocytic Activity Are Critically Regulated by the Neurosteroid Allopregnanolone: A Possible Role in Neuroprotection. Cells 2021, 10, 698. [Google Scholar] [CrossRef]
- Min, Y.; Yan, L.; Wang, Q.; Wang, F.; Hua, H.; Yuan, Y.; Jin, H.; Zhang, M.; Zhao, Y.; Yang, J.; et al. Distinct Residential and Infiltrated Macrophage Populations and Their Phagocytic Function in Mild and Severe Neonatal Hypoxic-Ischemic Brain Damage. Front. Cell. Neurosci. 2020, 14, 244. [Google Scholar] [CrossRef] [PubMed]
- Pla, L.; Illa, M.; Loreiro, C.; Lopez, M.C.; Vazquez-Aristizabal, P.; Kuhne, B.A.; Barenys, M.; Eixarch, E.; Gratacos, E. Structural Brain Changes during the Neonatal Period in a Rabbit Model of Intrauterine Growth Restriction. Dev. Neurosci. 2020, 42, 217–229. [Google Scholar] [CrossRef] [PubMed]
- Sholl, D.A. Dendritic organization in the neurons of the visual and motor cortices of the cat. J. Anat. 1953, 87, 387–406. [Google Scholar]
- Binley, K.E.; Ng, W.S.; Tribble, J.R.; Song, B.; Morgan, J.E. Sholl analysis: A quantitative comparison of semi-automated methods. J. Neurosci. Methods 2014, 225, 65–70. [Google Scholar] [CrossRef]
- Lin, Z.; Kwan, R.S.K. Local convex hulls for a special class of integer multicommodity flow problems. Comput. Optim. Appl. 2016, 64, 881–919. [Google Scholar] [CrossRef] [Green Version]
- Rideau Batista Novais, A.; Pham, H.; Van de Looij, Y.; Bernal, M.; Mairesse, J.; Zana-Taieb, E.; Colella, M.; Jarreau, P.H.; Pansiot, J.; Dumont, F.; et al. Transcriptomic regulations in oligodendroglial and microglial cells related to brain damage following fetal growth restriction. Glia 2016, 64, 2306–2320. [Google Scholar] [CrossRef] [Green Version]
- Wixey, J.A.; Lee, K.M.; Miller, S.M.; Goasdoue, K.; Colditz, P.B.; Tracey Bjorkman, S.; Chand, K.K. Neuropathology in intrauterine growth restricted newborn piglets is associated with glial activation and proinflammatory status in the brain. J. Neuroinflammation 2019, 16, 5. [Google Scholar] [CrossRef]
- Zinni, M.; Mairesse, J.; Pansiot, J.; Fazio, F.; Iacovelli, L.; Antenucci, N.; Orlando, R.; Nicoletti, F.; Vaiman, D.; Baud, O. mGlu3 receptor regulates microglial cell reactivity in neonatal rats. J. Neuroinflammation 2021, 18, 13. [Google Scholar] [CrossRef] [PubMed]
- Zinni, M.; Pansiot, J.; Colella, M.; Faivre, V.; Delahaye-Duriez, A.; Guillonneau, F.; Bruce, J.; Salnot, V.; Mairesse, J.; Knoop, M.; et al. Impact of Fetal Growth Restriction on the Neonatal Microglial Proteome in the Rat. Nutrients 2021, 13, 3719. [Google Scholar] [CrossRef]
- Au, N.P.B.; Ma, C.H.E. Recent Advances in the Study of Bipolar/Rod-Shaped Microglia and their Roles in Neurodegeneration. Front. Aging Neurosci. 2017, 9, 128. [Google Scholar] [CrossRef] [Green Version]
- Hellstrom Erkenstam, N.; Smith, P.L.; Fleiss, B.; Nair, S.; Svedin, P.; Wang, W.; Bostrom, M.; Gressens, P.; Hagberg, H.; Brown, K.L.; et al. Temporal Characterization of Microglia/Macrophage Phenotypes in a Mouse Model of Neonatal Hypoxic-Ischemic Brain Injury. Front. Cell. Neurosci. 2016, 10, 286. [Google Scholar] [CrossRef] [PubMed] [Green Version]
- Nemeth, C.L.; Drummond, G.T.; Mishra, M.K.; Zhang, F.; Carr, P.; Garcia, M.S.; Doman, S.; Fatemi, A.; Johnston, M.V.; Kannan, R.M.; et al. Uptake of dendrimer-drug by different cell types in the hippocampus after hypoxic-ischemic insult in neonatal mice: Effects of injury, microglial activation and hypothermia. Nanomedicine 2017, 13, 2359–2369. [Google Scholar] [CrossRef] [PubMed]
- Di Martino, E.; Bocchetta, E.; Tsuji, S.; Mukai, T.; Harris, R.A.; Blomgren, K.; Aden, U. Defining a Time Window for Neuroprotection and Glia Modulation by Caffeine After Neonatal Hypoxia-Ischaemia. Mol. Neurobiol. 2020, 57, 2194–2205. [Google Scholar] [CrossRef] [PubMed] [Green Version]
- Bernis, M.E.; Schleehuber, Y.; Zweyer, M.; Maes, E.; Felderhoff-Muser, U.; Picard, D.; Sabir, H. Temporal Characterization of Microglia-Associated Pro- and Anti-Inflammatory Genes in a Neonatal Inflammation-Sensitized Hypoxic-Ischemic Brain Injury Model. Oxidative Med. Cell. Longev. 2022, 2022, 2479626. [Google Scholar] [CrossRef] [PubMed]




Disclaimer/Publisher’s Note: The statements, opinions and data contained in all publications are solely those of the individual author(s) and contributor(s) and not of MDPI and/or the editor(s). MDPI and/or the editor(s) disclaim responsibility for any injury to people or property resulting from any ideas, methods, instructions or products referred to in the content. |
© 2023 by the authors. Licensee MDPI, Basel, Switzerland. This article is an open access article distributed under the terms and conditions of the Creative Commons Attribution (CC BY) license (https://creativecommons.org/licenses/by/4.0/).
Share and Cite
St. Pierre, M.; Duck, S.A.; Nazareth, M.; Fung, C.; Jantzie, L.L.; Chavez-Valdez, R. Unbiased Quantitative Single-Cell Morphometric Analysis to Identify Microglia Reactivity in Developmental Brain Injury. Life 2023, 13, 899. https://doi.org/10.3390/life13040899
St. Pierre M, Duck SA, Nazareth M, Fung C, Jantzie LL, Chavez-Valdez R. Unbiased Quantitative Single-Cell Morphometric Analysis to Identify Microglia Reactivity in Developmental Brain Injury. Life. 2023; 13(4):899. https://doi.org/10.3390/life13040899
Chicago/Turabian StyleSt. Pierre, Mark, Sarah Ann Duck, Michelle Nazareth, Camille Fung, Lauren L. Jantzie, and Raul Chavez-Valdez. 2023. "Unbiased Quantitative Single-Cell Morphometric Analysis to Identify Microglia Reactivity in Developmental Brain Injury" Life 13, no. 4: 899. https://doi.org/10.3390/life13040899
APA StyleSt. Pierre, M., Duck, S. A., Nazareth, M., Fung, C., Jantzie, L. L., & Chavez-Valdez, R. (2023). Unbiased Quantitative Single-Cell Morphometric Analysis to Identify Microglia Reactivity in Developmental Brain Injury. Life, 13(4), 899. https://doi.org/10.3390/life13040899


