Article

Salt Stress-Related Mechanisms in Leaves of the Wild Barley Hordeum spontaneum Generated from RNA-Seq Datasets

by
Aminah A. Barqawi
1 and
Aala A. Abulfaraj
2,*
1
Department of Chemistry, Al-Leith University College, Umm Al-Qura University, Makkah 28434, Saudi Arabia
2
Biological Sciences Department, College of Science & Arts, King Abdulaziz University, Rabigh 21911, Saudi Arabia
*
Author to whom correspondence should be addressed.
Life 2023, 13(7), 1454; https://doi.org/10.3390/life13071454
Submission received: 26 May 2023 / Revised: 22 June 2023 / Accepted: 25 June 2023 / Published: 27 June 2023
(This article belongs to the Special Issue Plant Ecophysiology and Plant Stress Physiology)

Abstract

:
This study aims to detect salt stress-related genes and mechanisms of the wild barley Hordeum spontaneum. Among the generated RNA-Seq datasets, several regulated transcripts are influenced by levels of cellular carbon, nitrogen and oxygen. Some of the regulated genes act on photorespiration and ubiquitination processes, as well as promoting plant growth and development under salt stress. One of the genes, encoding alanine:glyoxylate aminotransferase (AGT), participates in signaling transduction and proline biosynthesis, while the gene encoding asparagine synthetase (ASN) influences nitrogen storage and transport in plants under stress. Meanwhile, the gene encoding glutamate dehydrogenase (GDH) promotes shoot and root biomass production as well as nitrate assimilation. The upregulated genes encoding alpha-aminoadipic semialdehyde synthase (AASAS) and small auxin-up RNA 40 (SAUR40) participate in the production of proline and signaling compounds, respectively, while the gene encoding E3 ubiquitin-protein ligase regulates the carbon/nitrogen-nutrient response and pathogen resistance, in addition to some physiological processes under biotic and abiotic stresses via signal transduction. The gene encoding the tetratricopeptide repeat (TPR)-domain suppressor of STIMPY (TSS) negatively regulates the carbon level in the cell. In conclusion, this study sheds light on possible molecular mechanisms underlying salt stress tolerance in wild barley that can be utilized further in genomics-based breeding programs of cultivated species.

1. Introduction

The impacts of global climate change and soil salinization, in addition to the worldwide demand for increasing crop yields due to the rapidly growing human population, mean it is mandatory for breeders to generate crops with increased levels of tolerance against harsh environmental conditions [1,2,3]. Wild relatives of cultivated plant species provide supplementary insights in breeding and genetic transformation programs towards the utilization of stress-specific genes to complement cultivated species, increasing their ability to tolerate salt stress and to promote plant growth [4]. The level of salt stress that is life-threatening to cultivated barley is estimated to be 100 mM NaCl [5]. Hordeum spontaneum is a wild barley species that is the ancestor of the cultivated diploid (2n = 2x = 14) barley species, H. vulgare. Cultivated barley is among the major cereal crops worldwide and is predominantly self-pollinated. However, it is possible to generate fertile progeny by crossing wild and cultivated barley [6]. This indicates the short genetic distance between the two barley species; a feature that is almost missing in bread (2n = 6x = 42), durum (2n = 4x = 28) and wild (2n = 2x = 14) wheats. However, genetic differences as well as differential controlling elements between the two barley species exist. These differences include stress-related genes that can be targets for subsequent breeding programs, not only in barley but also in many other field crops via metabolic engineering approaches. Previous reports indicate that this wild barley includes a large number of disease resistance and abiotic stress tolerance genes [7,8,9,10,11,12]. More recently, Liu and colleagues [13] further indicated the existence of ~1300 gene families in this wild barley that are missing in cultivated barley as well as other cereal crops.
In the genomic era, high-throughput sequencing methods provide new insights into the signatures of wild plant genomes, offering potential candidates for field crop improvement [14,15]. Therefore, understanding the molecular dynamics of salt stress responses will allow the development of genotypes with enhanced performance and the ability to manage programmed cell death mechanisms under stress conditions [16,17,18,19]. Next-generation sequencing (NGS) represents the latest tool for studying transcriptomes as well as the physiological and biochemical mechanisms of plant salt stress tolerance, whether or not genome sequencing data is available, such as H. spontaneum [13,20,21]. These tolerance mechanisms include the regulation of ion homeostasis, osmotic potential, plant hormone signaling responses, ubiquitination and cell wall composition [3,22,23]. A major influencer of salt stress is the sodium ion, whose high concentration hinders water availability and the plant’s ability to absorb soil nutrients [24]. Thus, an ion transport approach might be a candidate for manipulating the plant’s ability to withstand salt stress.
The present work aims to study the transcriptome of wild barley (H. spontaneum) leaves under salt stress exposure over time in order to obtain an overview of the specific molecular mechanisms used by this wild plant species to tolerate salt stress.

2. Materials and Methods

2.1. Salt Stress Experiment and Isolation of RNA

Plantlets of wild barley (H. spontaneum) were grown as previously described [25]. Fourteen-day-old seedlings were salt-treated at 500 mM NaCl for 0 (used as a control), 2, 12 and 24 h in a replicated experiment. Total RNAs were isolated from the fine-powdered leaves as previously described [25]. Then, the purified RNA samples (30 µg at 400 ng/µL) were sent to Beijing Genomics Institute (BGI), China, for deep sequencing using an Illumina MiSeq platform.

2.2. RNA-Seq Analysis

The raw data recovered from next generation sequencing were submitted in FASTQ format to NCBI and the experiment received an accession number of PRJNA227211. Then, the raw data were filtered and trimmed as described [26]. Then, the clean raw data was de novo assembled via Trinity as described [25]. Assembly of the transcript contigs resulted in the identification of transcripts using an ORF-Predictor [27], while EdgeR (version 3.0.0) was used to detect differentially expressed (DE) transcripts and to make a cluster analysis. A Blastx was performed and the fold change of the DE transcripts was estimated using default parameters [25,28]. Then, a significant Pearson correlation was measured in order to generate a heat map and GO terms were determined using Blast2GO. The coding sequences (CDS) were categorized with a WEGO analysis, and the Protein Information Resource (PIR) was utilized to determine the UniProt IDs. Then, the predicted CDS were subjected to annotation in order to detect the function of the DE transcripts. The data of the RNA-Seq was validated using real-time PCR for four regulated transcripts (Table S1) and their expression levels were calculated relative to the barley actin house-keeping gene as previously described [28].

3. Results

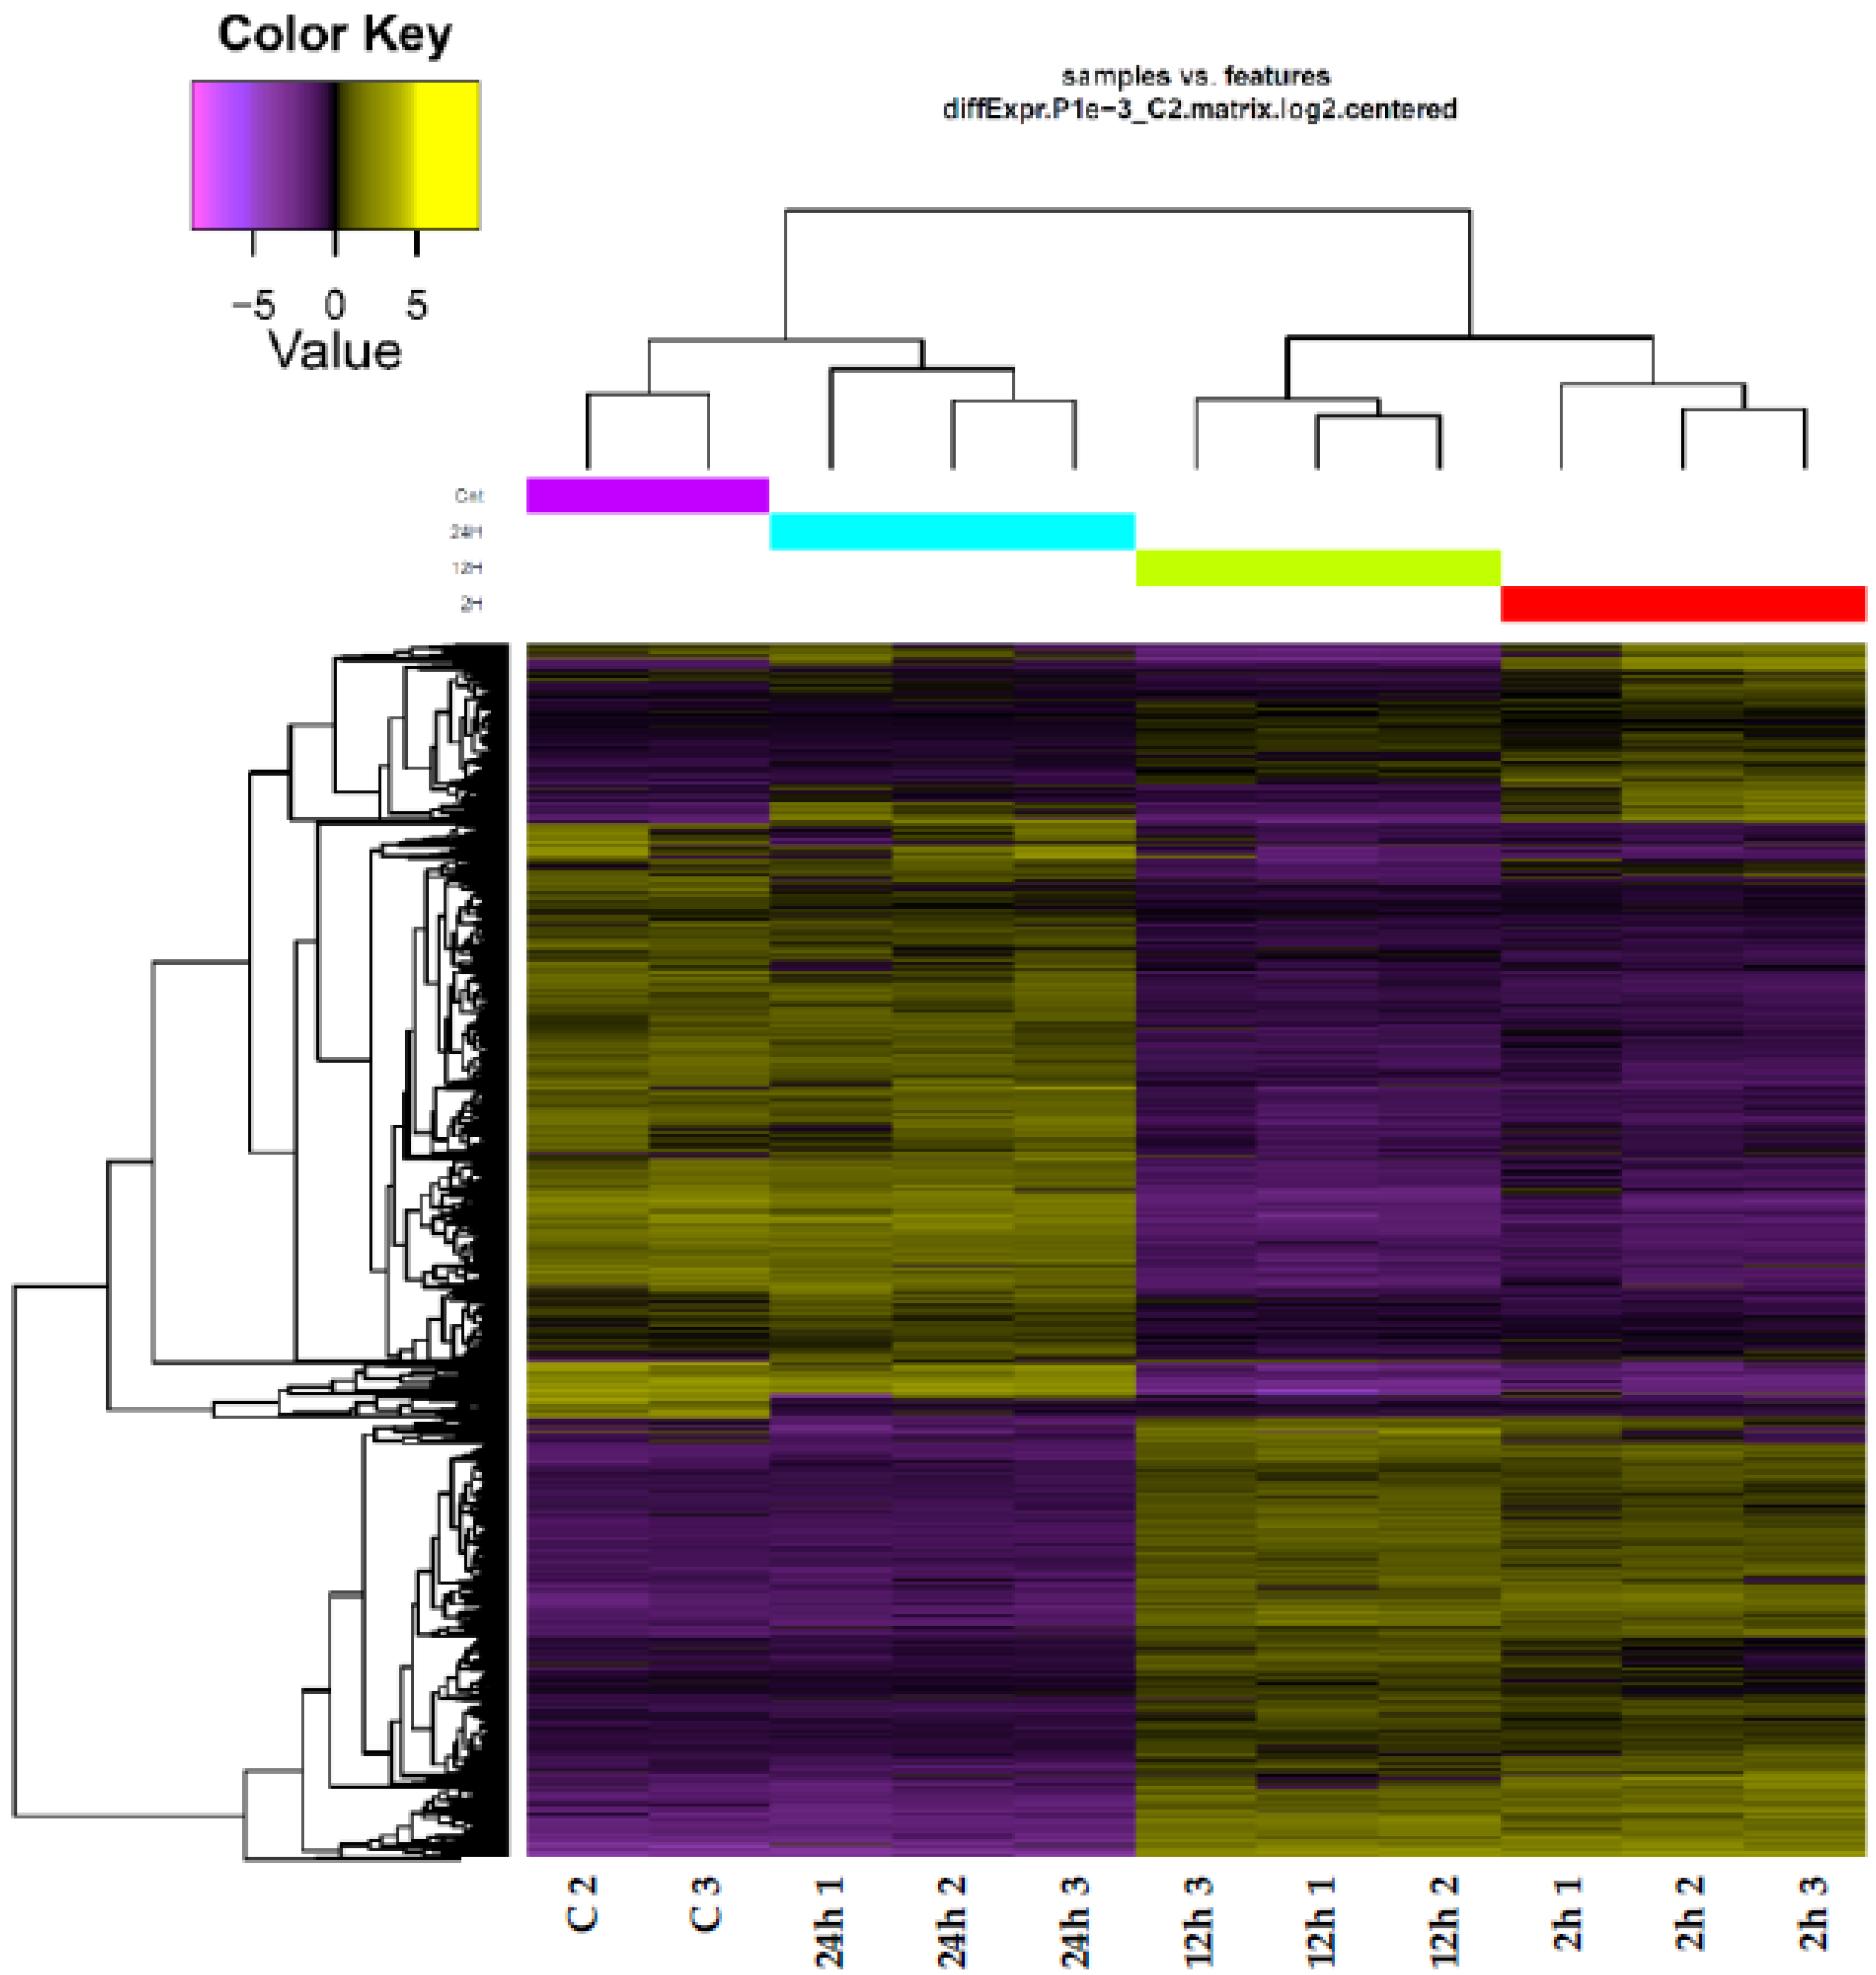
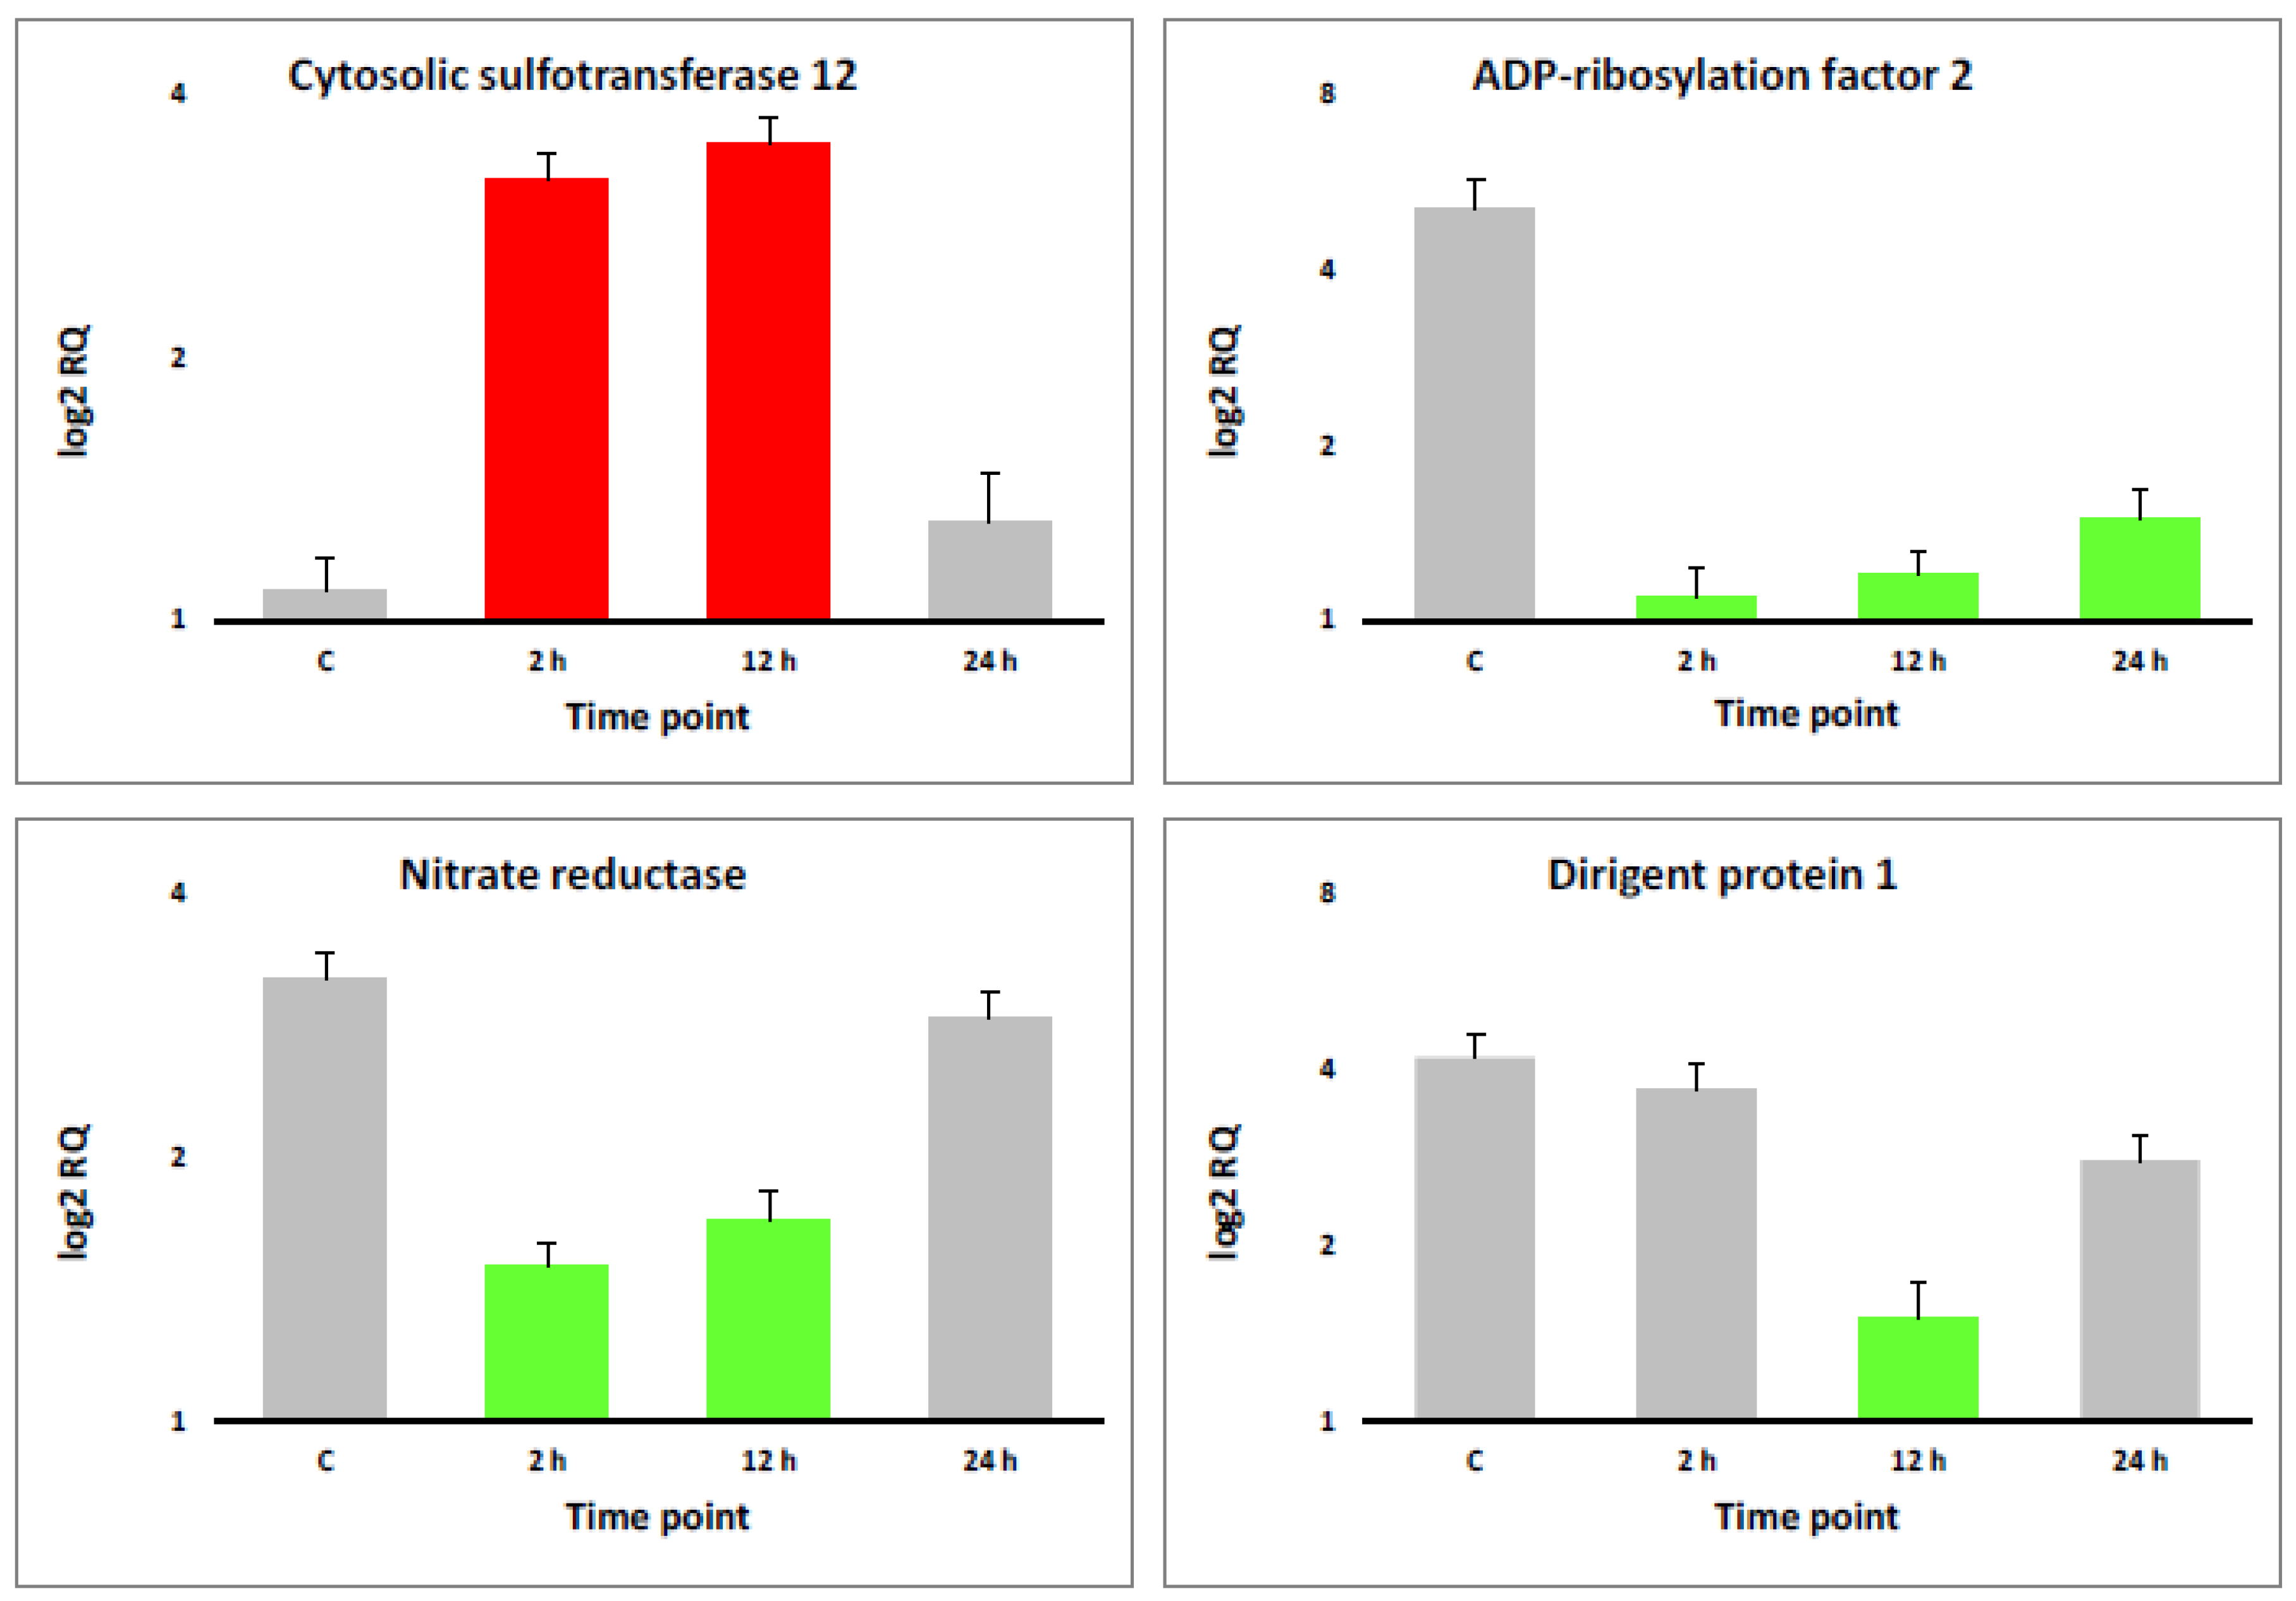
3.1. Quality Assurance and RNA-Seq Data Validation

The raw data recovered from the leaves of H. spontaneum transcriptomes were previously analyzed against the barley UniGene database available at the NCBI [28]. However, we followed a genome-guided assembly approach to secure coverage of all genes under the adverse conditions. The resulting number of DE transcripts in the previous study with a fold change (FC) of ≤ 2 was 9277, of which only 3861 transcripts were mapped against the H. vulgare reference genome. However, the genome-guided assembly approach with a similar FC level resulted in the occurrence of ~11,000 differentially expressed transcripts (Table S2).
The heat map to detect transcriptome patterns under salt stress showed that the replicates at each timepoint of salt stress are closely related (Figure 1). The heat map also indicated a close relationship between the transcriptomes of leaves exposed to 0 and 24 h of salt stress on one hand, and between transcriptomes of leaves exposed to 2 and 12 h on the other. These results reflect the instant response of the plant to salt stress that mostly diminishes after prolonged exposure, e.g., 24 h. We chose a salt concentration of 500 mM NaCl as this wild plant grows naturally on the Red Sea where the salt concentration of the water is much higher; thus, we expected the plants to be able to tolerate this level.
Validation of RNA-Seq datasets was performed via real-time PCR for four transcripts, e.g., one was upregulated at 2 and 12 h of salt stress (cytosolic sulfotransferase 12 of cluster 17), the second was downregulated at 2, 12 and 24 h (ADP-ribosylation factor 2 of cluster 19), the third was downregulated at 2 and 12 h (nitrate reductase of cluster 25) and the fourth was downregulated at 12 h (dirigent protein 1 of cluster 30). Figure 2 indicates that the results of the real-time PCR fully support those of the RNA-Seq datasets introduced in Tables S2–S4.

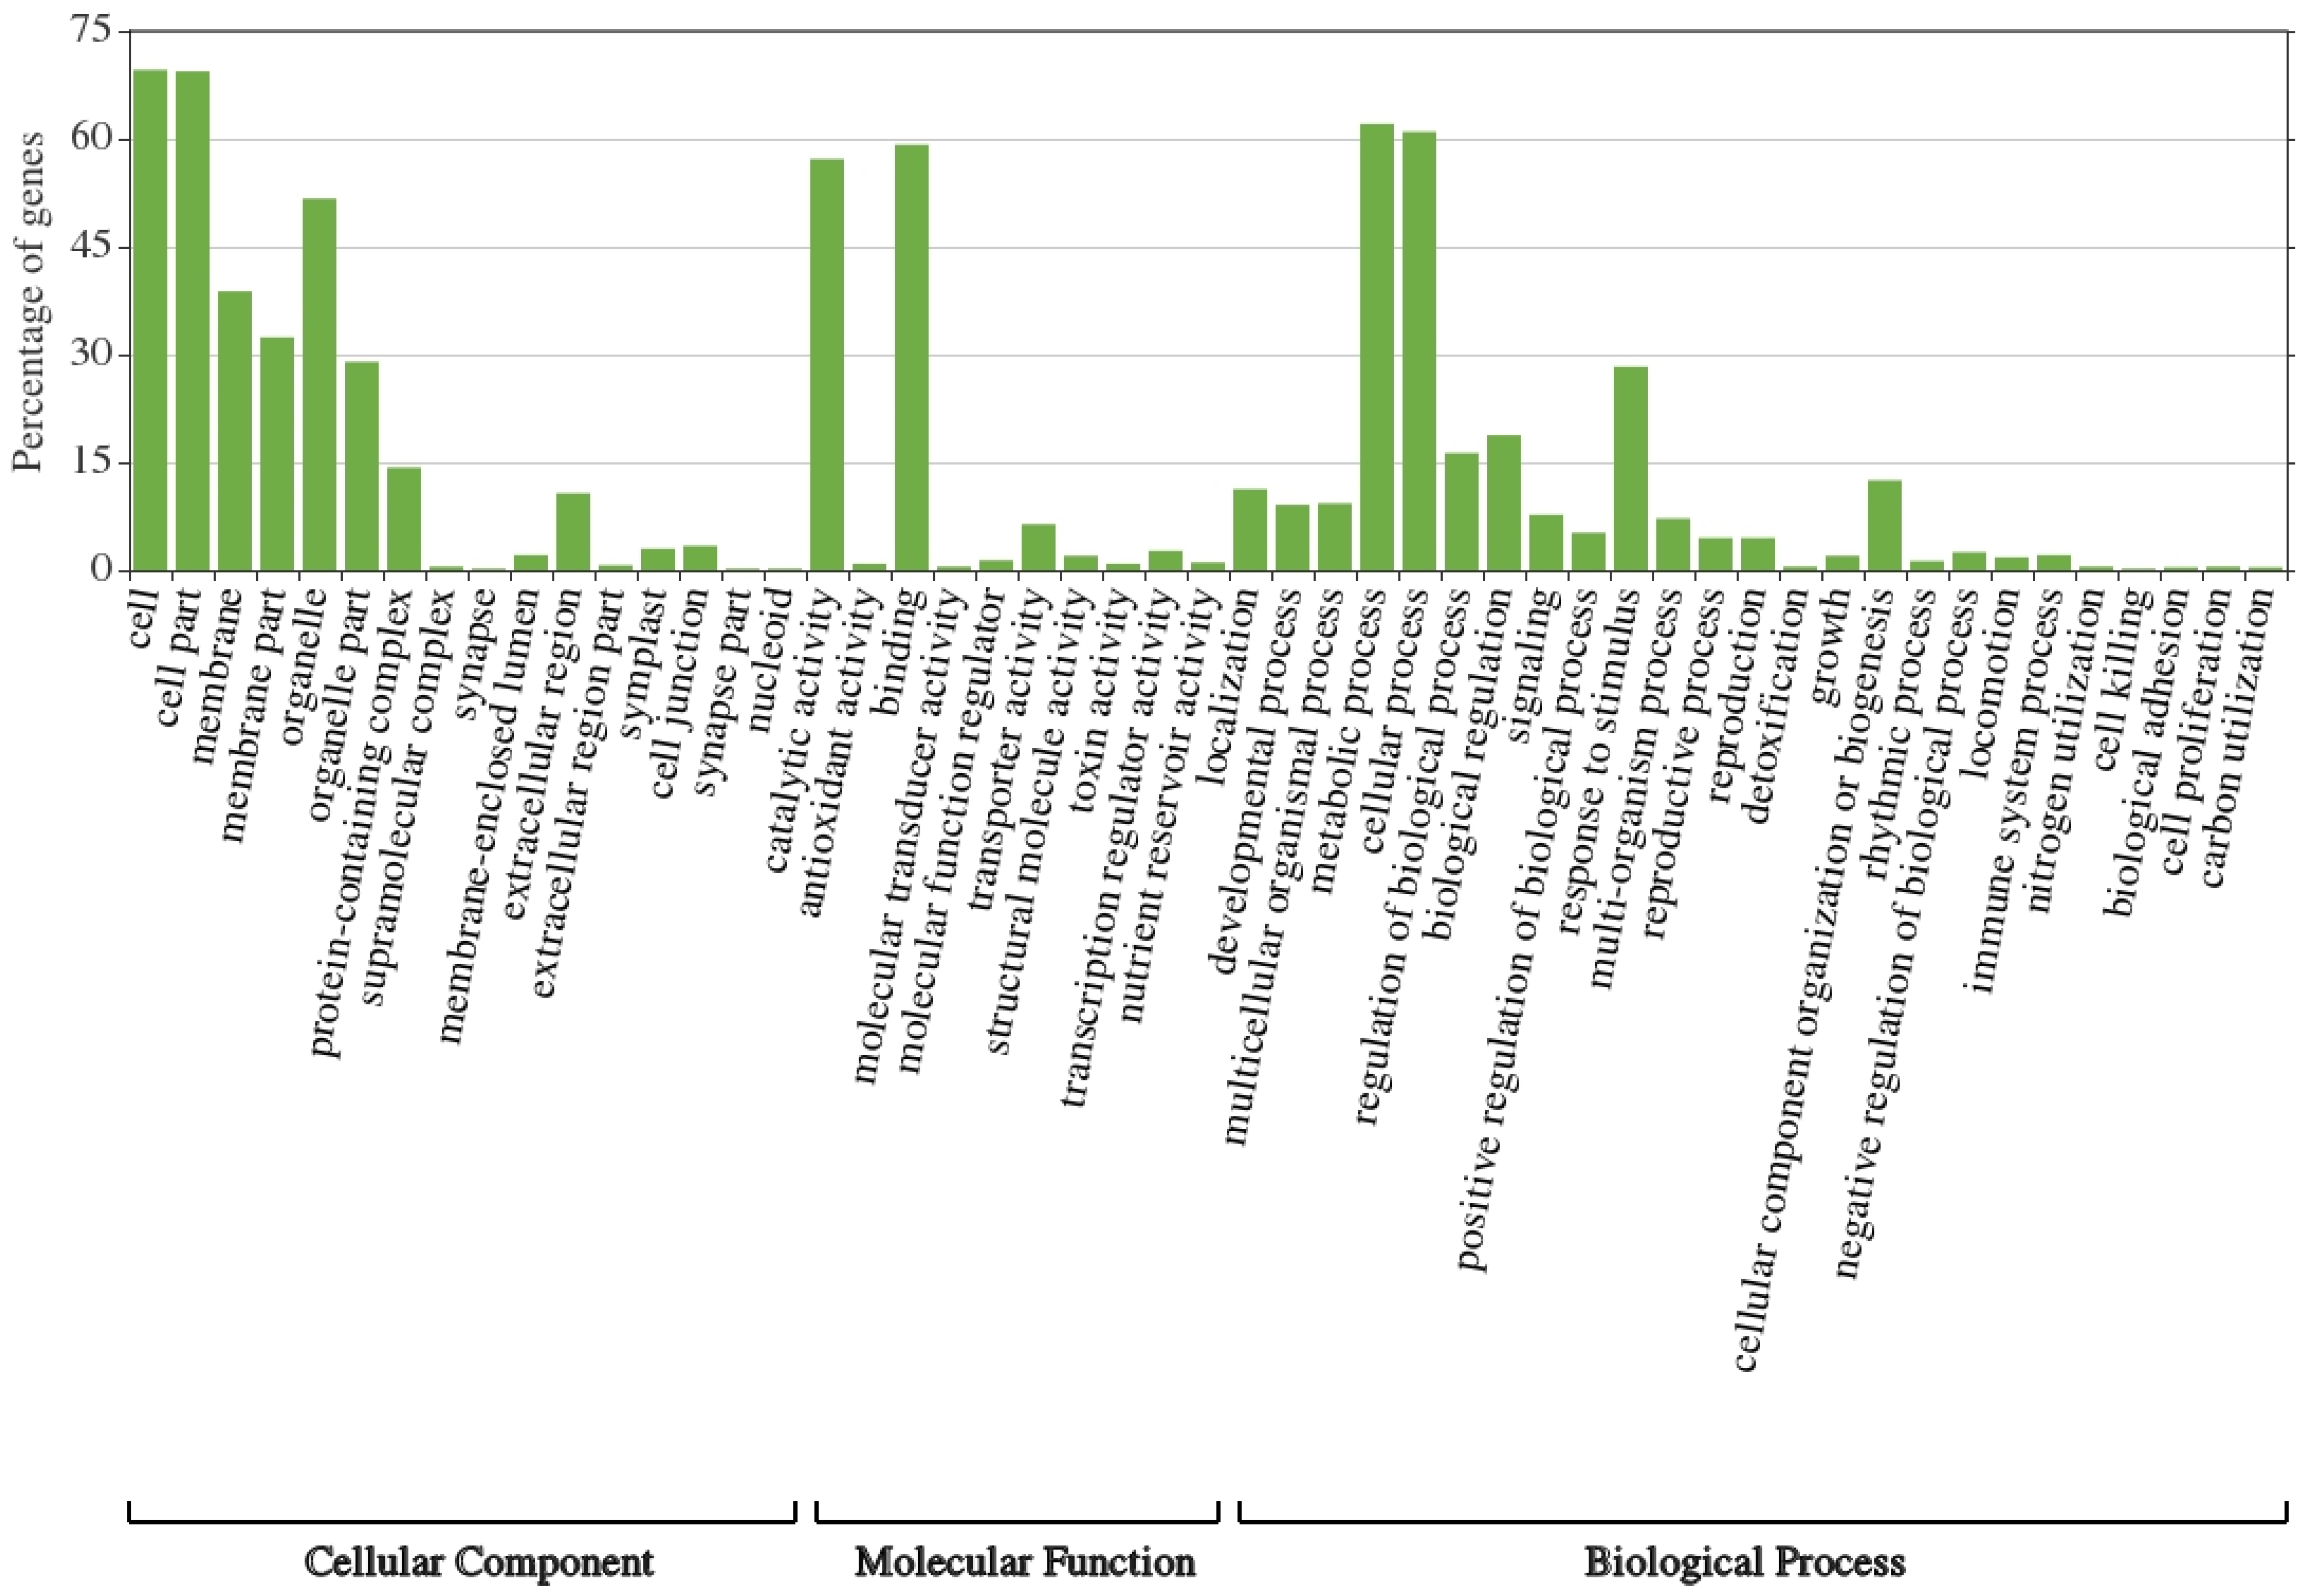
3.2. GO Classification

The annotated transcripts in the leaves of wild barley under salt stress were assigned to three main categories: “cellular component”, “molecular function” and “biological process” (Figure 3 and Figure 4). Highly enriched subcategories of “cellular component” included “cell”, “cell part”, “membrane”, “membrane part”, “organelle” and “organelle parts”; for “molecular function” they included “catalytic activity” and “binding”; and for “biological process” they included “response to stimulus”, “cellular process”, “biological regulation”, “regulation of biological process” and “metabolic process” (Figure 3). Interestingly, highly suppressed subcategories due to salt stress in the three categories included the same subgroups (Figure 4). This indicates that large number of gene families in these subcategories of the three categories showed differential expression under salt stress.

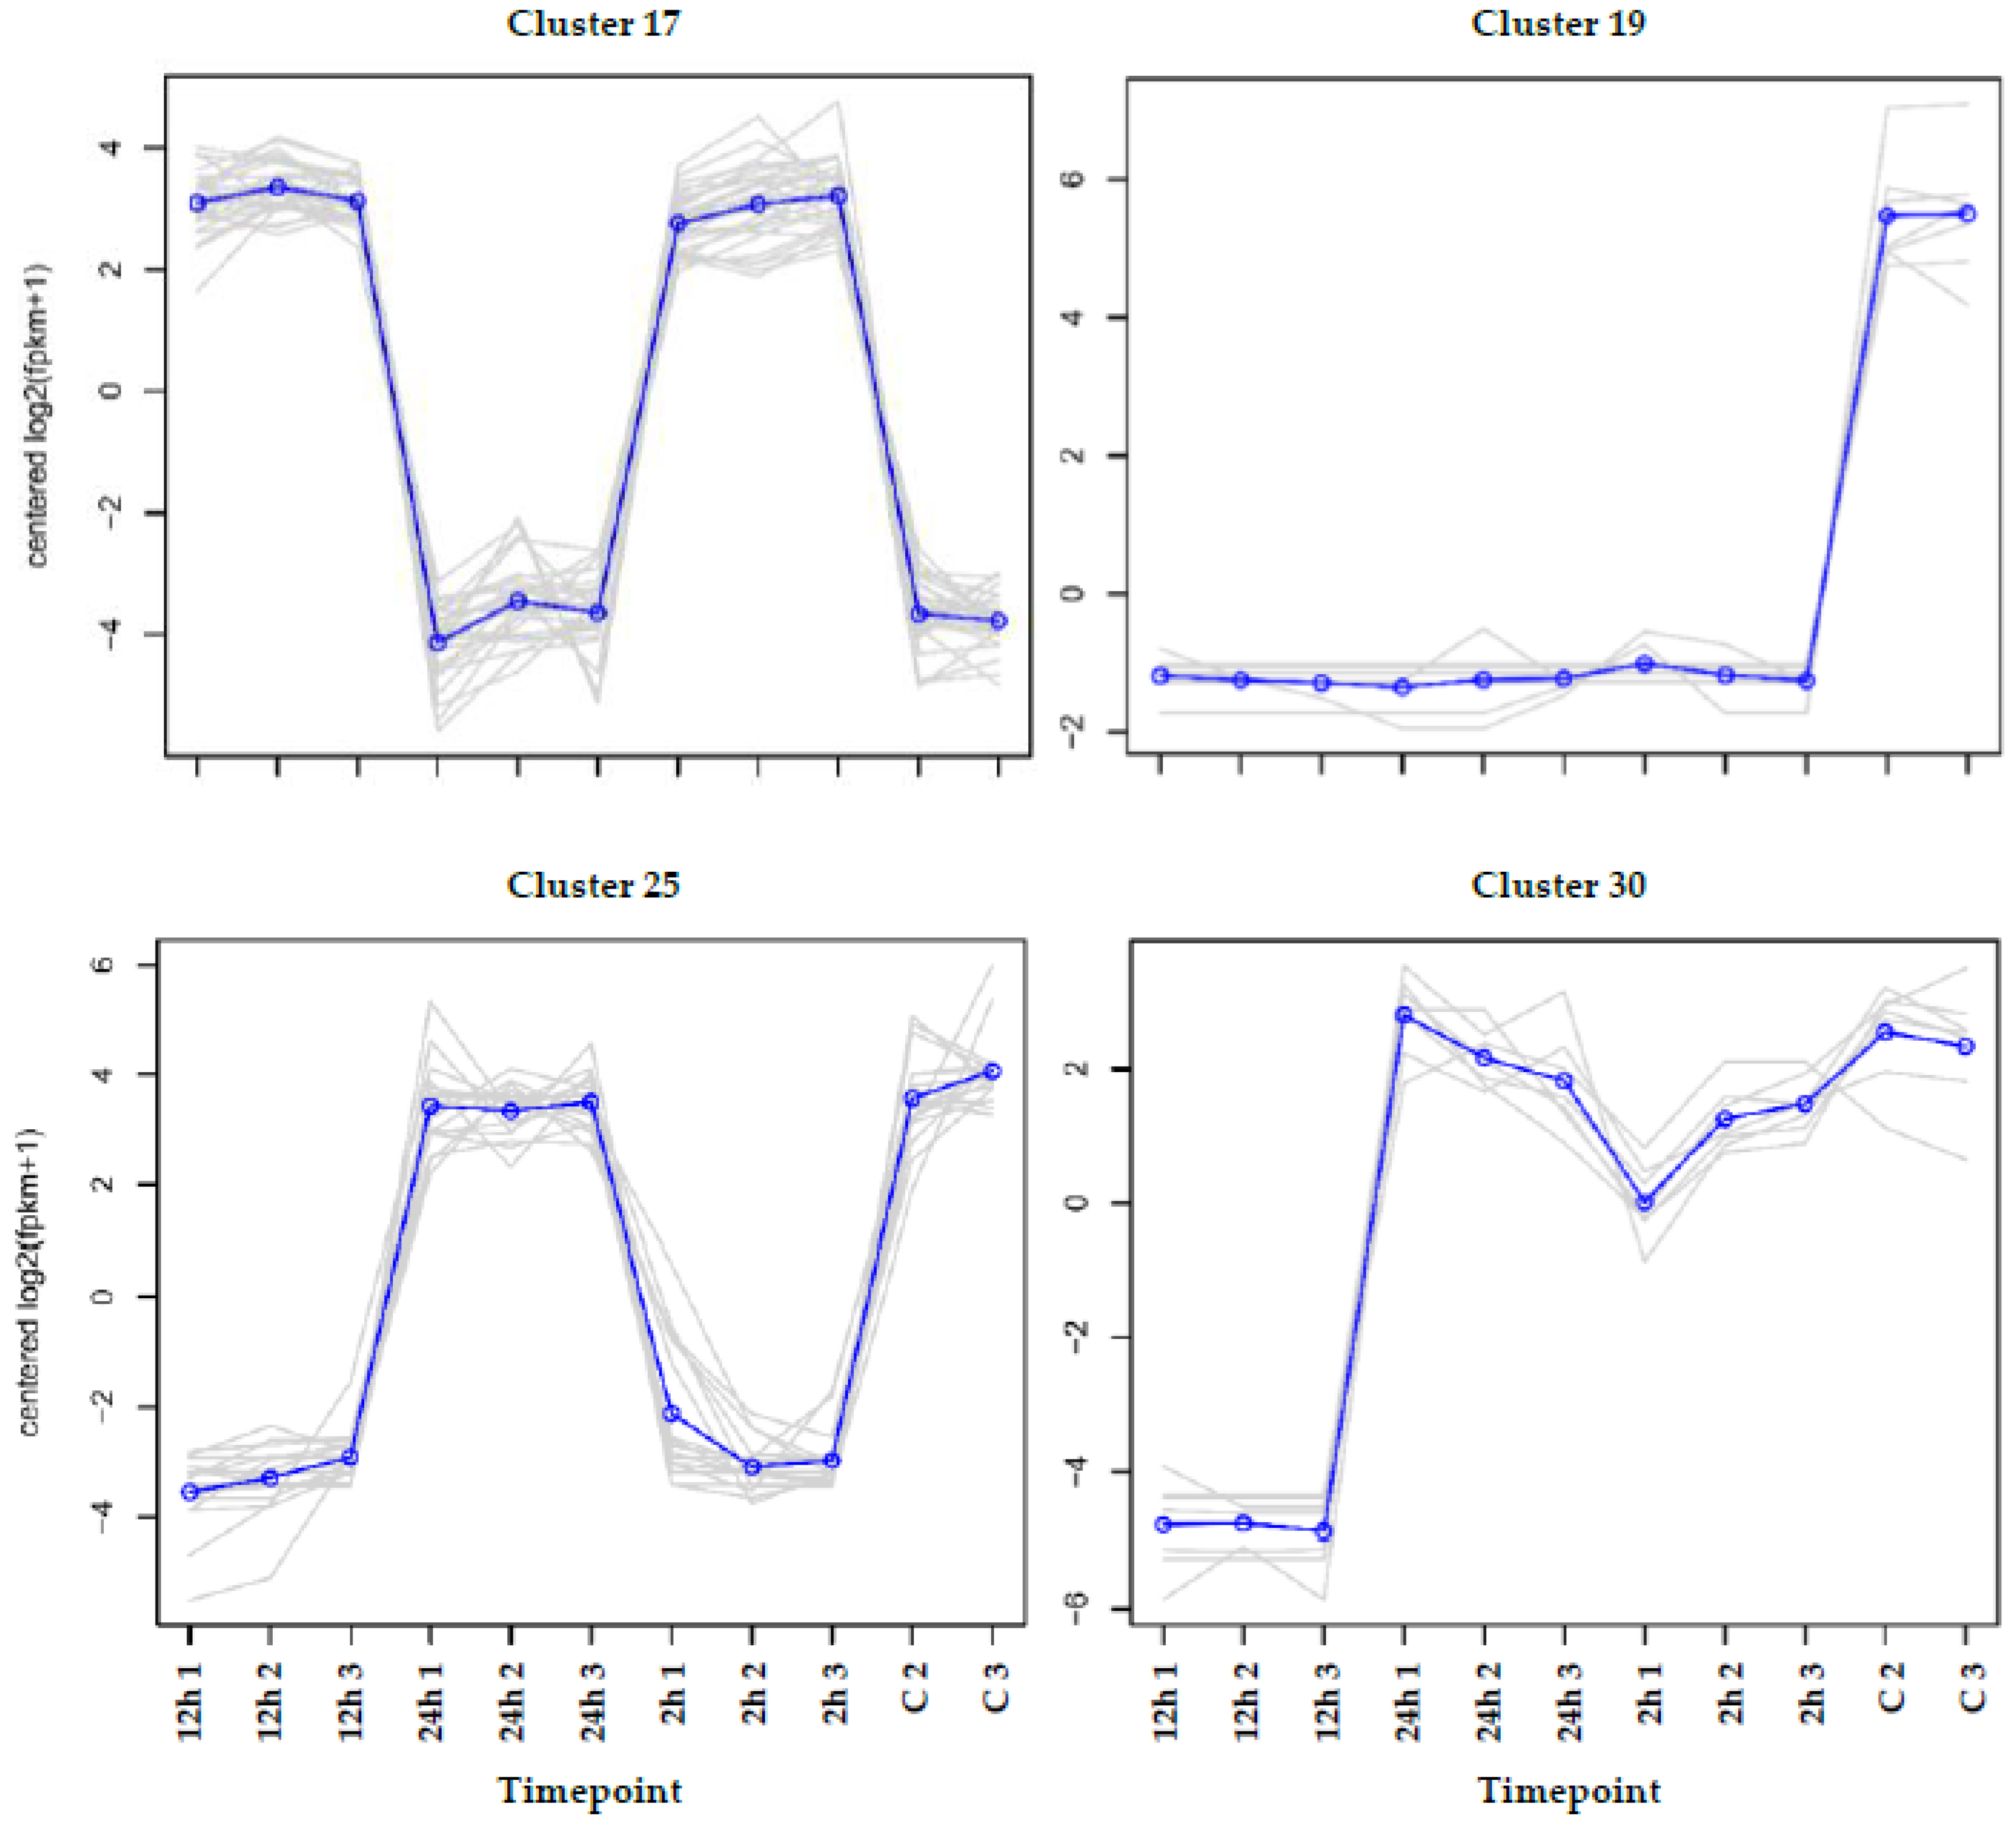
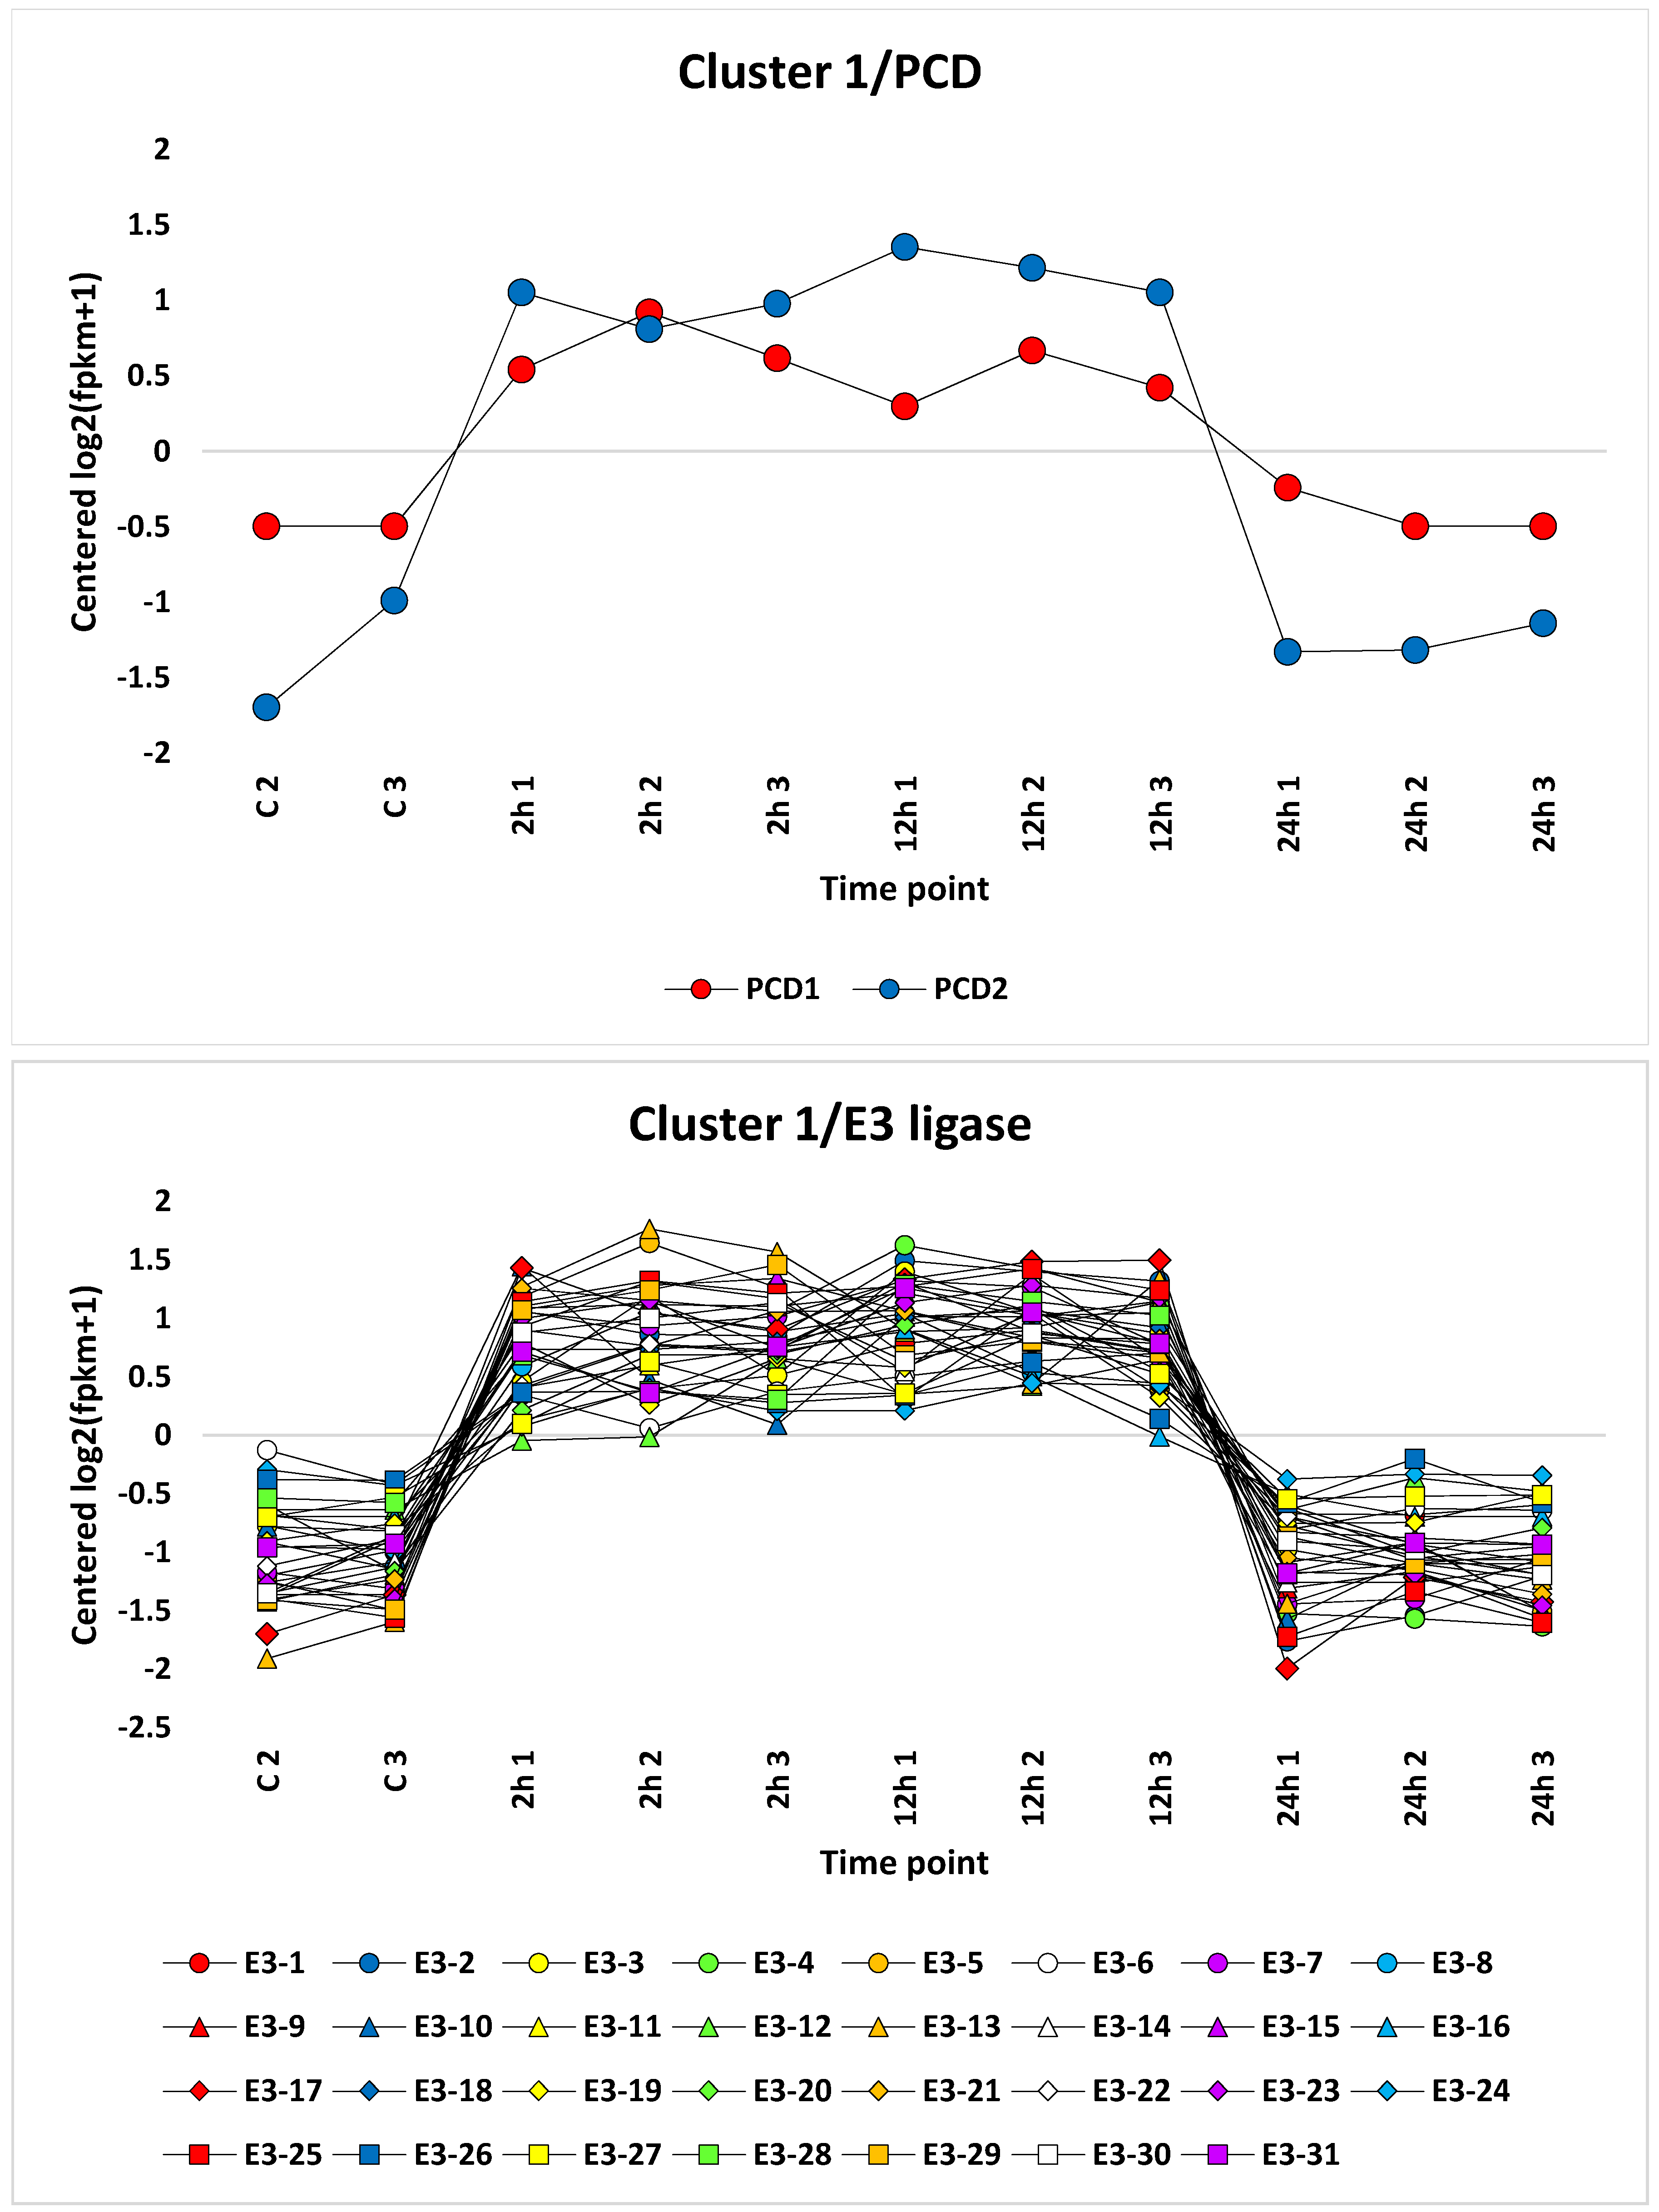
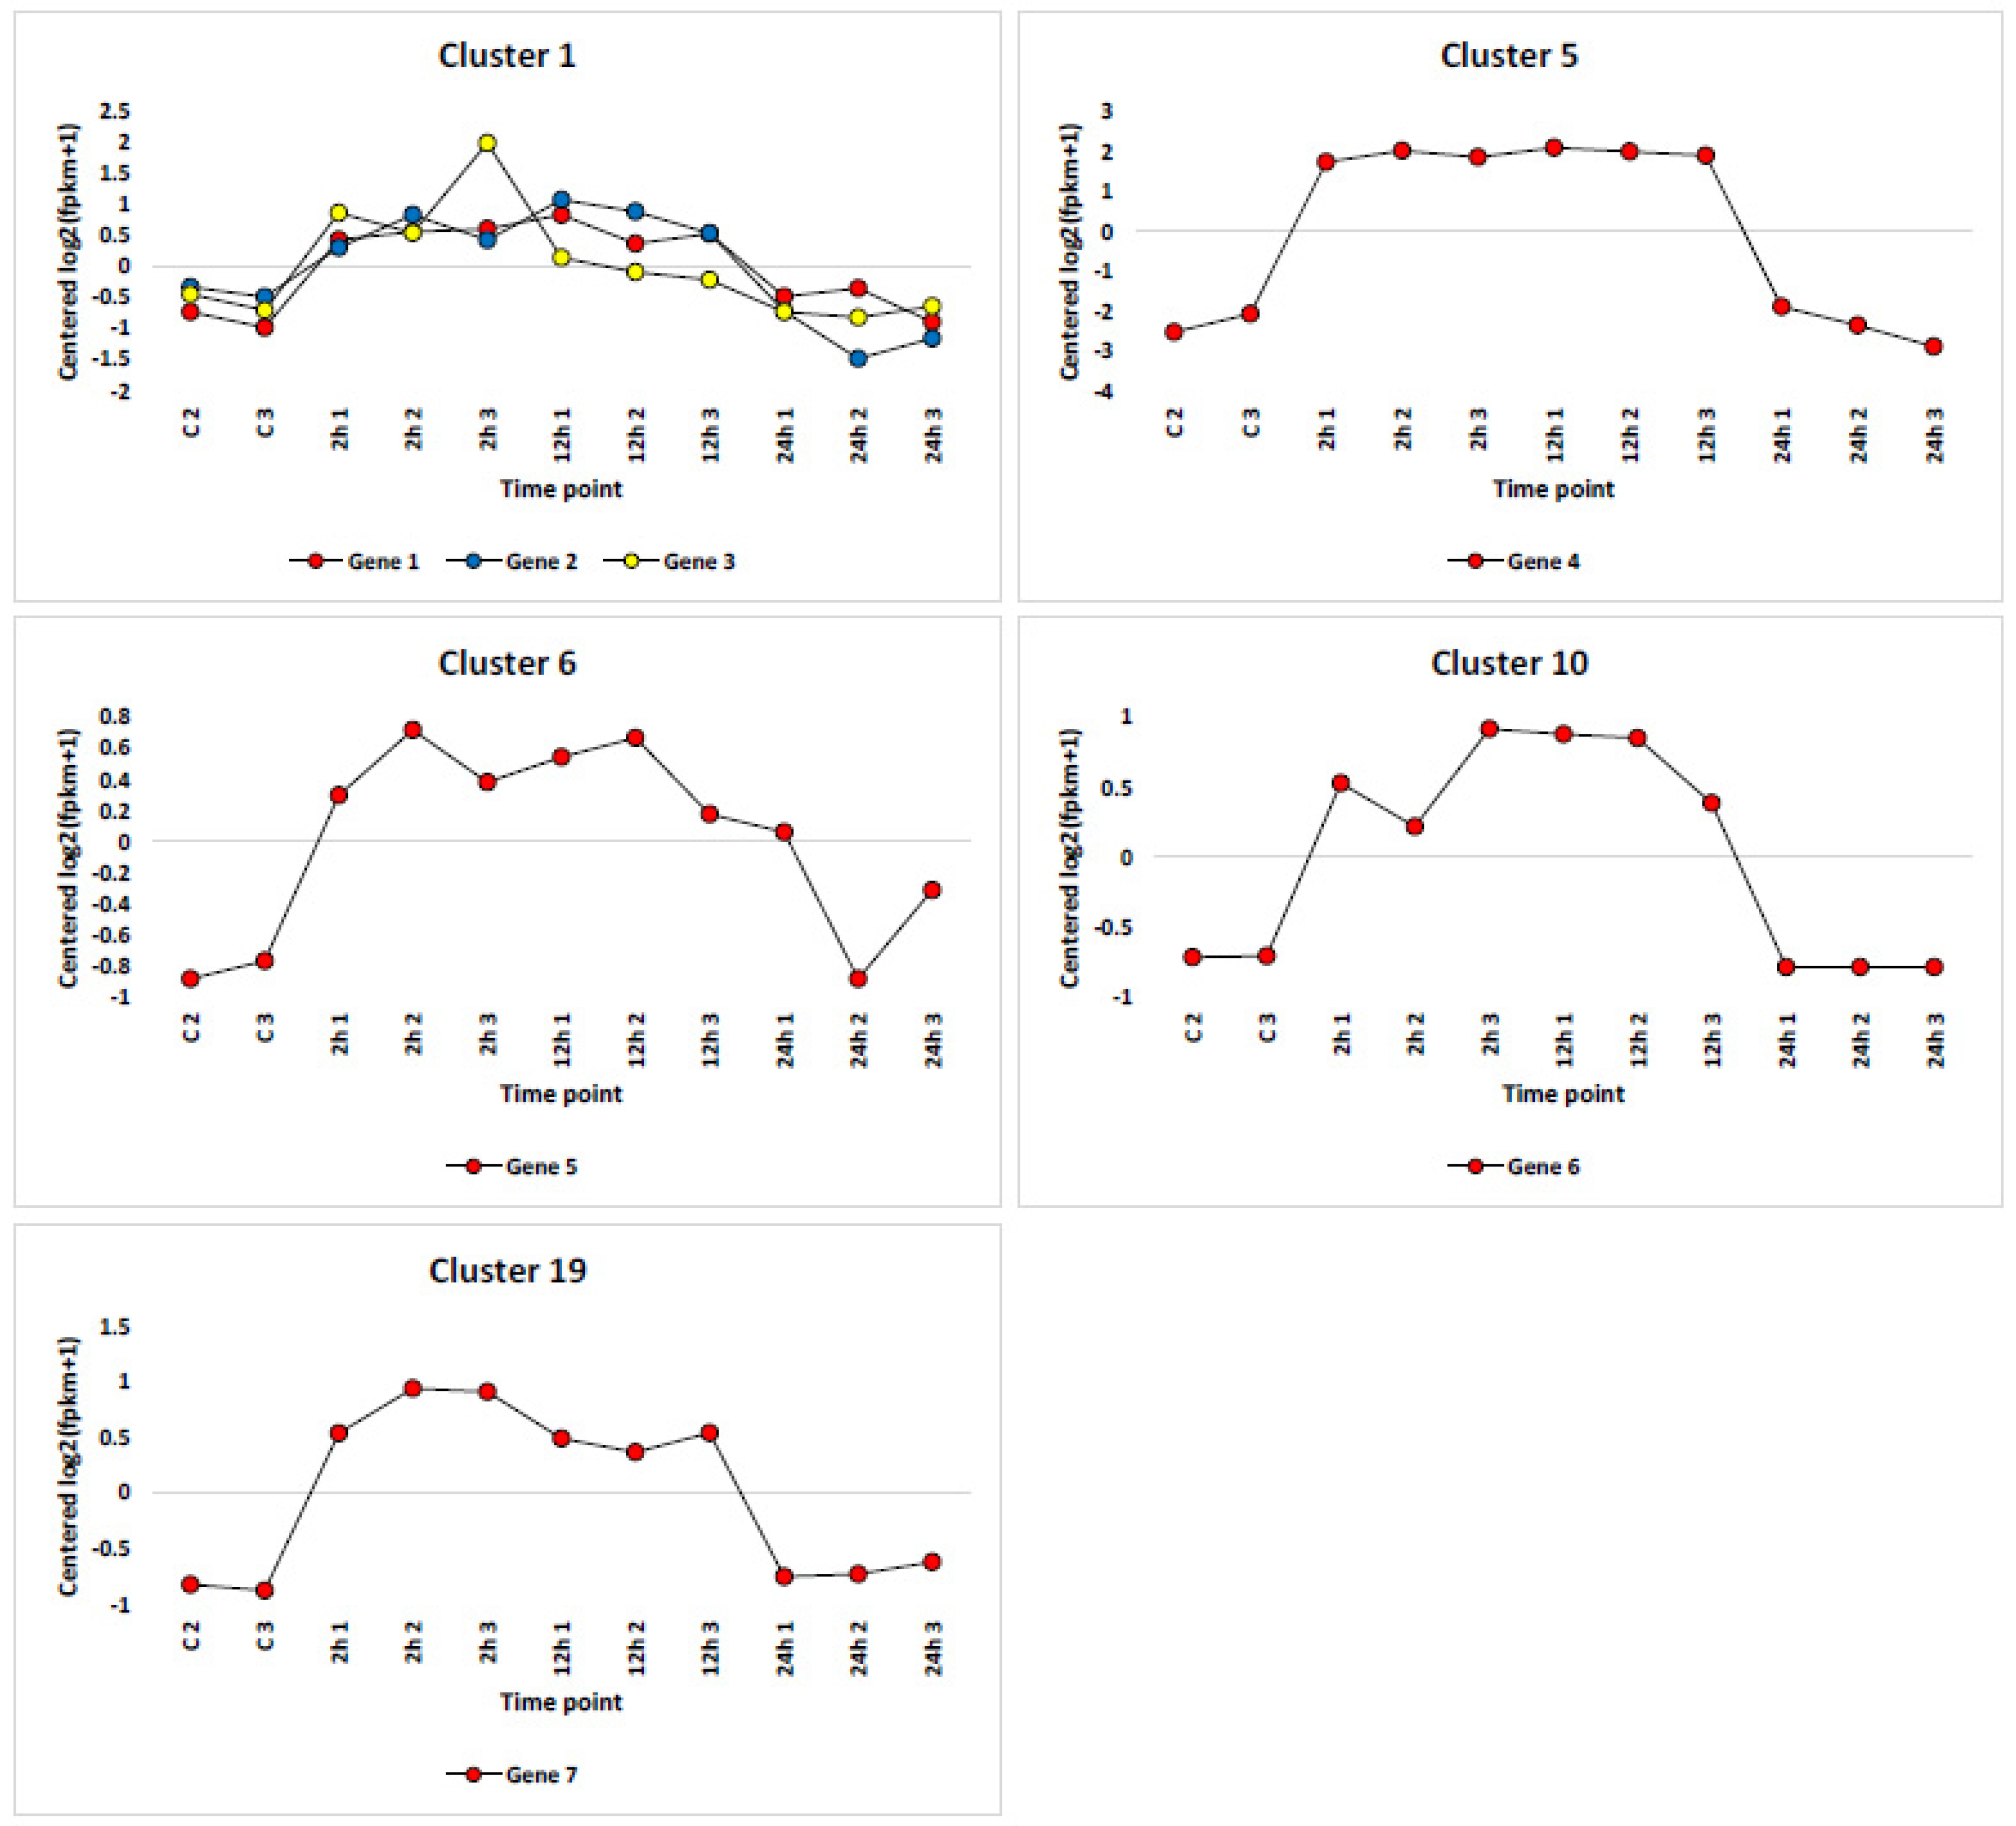
3.3. Cluster Analysis

The analysis of differentially expressed transcripts, either annotated or unannotated, due to salt stress resulted in the recovery of 69 clusters with appropriate algorism (Table S2, Figure S1). Among these clusters, some transcripts in eight clusters were selected for further analysis (Table S3). The criteria for selecting clusters were based on the feasibility of annotation data, fold change and concordance of expression levels for transcripts in a single cluster across different timepoints. The selected expression patterns included upregulation under salt stress (500 mM NaCl) at the 2 and 12 h timepoints (clusters 17, 23 and 39); downregulation at the 2, 12 and 24 h timepoints (cluster 19); downregulation at the 2 and 12 h timepoints (clusters 25, 36 and 7); and downregulation at the 12 h timepoint (cluster 30). These clusters included 280 differentially expressed genes, of which 177 were annotated and hold differential expression levels of ≥2 fold change. Examples of clusters showing these expression patterns are shown in Figure 5. In addition, selected coexpressed genes of cluster 1 with upregulation at the 2 and 12 h timepoints of salt stress were also analyzed (Figure 6). They included 31 genes encoding E3 ubiquitin-protein ligase enzymes and two coexpressed genes promoting programmed cell death (Table S4).

4. Discussion

Upregulation at the 2 and 12 h timepoints of salt stress indicates the response of genes whose expression is required early after the occurrence of salt stress and only for few hours, after which the cell starts to adapt and no longer maintains this high rate of expression. This provides a chance for other genes, whose expression is required at later stages, to be expressed. Downregulation at the 2 and 12 h timepoints or at the 2, 12 and 24 h timepoints of salt stress indicates that these genes are required to be expressed at lower rates at two or all of the timepoints, as they might participate in a specific route within a pathway that is not required under stress conditions during these time windows. This might result in the blocking of such a route in the pathway. If the route is bidirectional, then the downregulated transcripts might occasionally force the pathway to favor the opposite direction. Regulation of these genes most likely occur in metabolic pathways whose metabolites are required at certain levels to maintain tissue, protein or hormone homeostasis and, consequently, growth rate.
The selected genes for discussion include those encoding aminotransferases, of which two genes were upregulated after 2 and 12 h of salt stress (cluster 23, Table S3). Aminotransferases were cited earlier to participate in the regulation of biotic and abiotic stresses [29]. The first enzyme, namely, alanine:glyoxylate aminotransferase (AGT) (Table S3), participates in photorespiration in resistance to several plant pathogens, as well as in salt and water deficit tolerance [29,30]. Meanwhile, the second enzyme, namely, branched-chain-amino-acid aminotransferase 3 (BCAT3) participates in the accumulation of BCAA and the enhanced tolerance against dehydration stress (Figure 7) [31,32,33]. Overexpression of the gene encoding AGT in rice induced several other genes crucial in signaling transduction pathways [29]. These genes include RD22, COR47, ADH1, RAB18 and P5CS1 [34]. The latest gene, P5CS1, encodes a bifunctional enzyme, namely, delta1-pyrroline-5-carboxylate synthase 1 (P5CS1) with a major role in proline synthesis to confer stress tolerance (Figure 7) [35]. Branched-chain-amino-acid aminotransferase 3 (BCAT3) exists in chloroplasts and is effective in restoring the growth rate under stress conditions (Figure 7) [36].
Photorespiration involves a battery of enzymes for exchanging metabolites between chloroplasts, leaf peroxisomes and mitochondria [34]. We speculate that this is a transport process to neutralize the influence of stress at the level of cell organelles (Figure 7). In C3 plants, photorespiration reduces the efficiency of photosynthesis by 25% [37]. However, engineered plants with reduced photorespiration rates did not result in higher plant growth rates. Thus, photorespiration is not per se a harmful process to the organism. In addition, it was proven that photorespiration participates in nitrate assimilation as the main nitrogen source in cells [38]. Ammonia-to-nitrate is a reversible two-step reaction, as ammonia can be oxidized to nitrite, which in turn is oxidized to produce nitrate that becomes amenable to assimilation by plant roots (Figure 7). Upon a shortage of O2, this reaction can be reversed in which nitrate is reduced to nitrite via the action of the gene encoding nitrate reductase (NR), then ammonia is produced via the action of the gene encoding ferredoxin-nitrite reductase (Fd-NiR). We speculate that the direction of the reaction is influenced by the level of O2 in the cell. Interestingly, genes encoding NR and Fd-NiR in the present study showed exactly opposite rates of expression to that encoding AGT, as their expression was reduced after 2 and 12 h of salt stress (Table S3). This indicates that Nr and Fd-NiR genes participate at one end of a cascade of reversible events starting with the influence of salt stress to enrich AGT, which in turn promotes photorespiration that induces the reduction of the O2 level in cells. A low level of O2 might be the reason for the downregulation of the two genes encoding NR and Fd-NiR, which makes the nitrate-to-ammonia direction unfavorable (Figure 7). Furthermore, earlier reports indicate that the elevated CO2 that accompanies a shortage of O2 due to photorespiration suppresses nitrite transport into chloroplasts [39].
Accordingly, we assume that the increase in photorespiration rate under salt stress due to the action of the gene encoding AGT in H. spontaneum will shorten supply of O2. Those cells in favor of converting ammonia to nitrate are then redirected towards nitrate assimilation via manipulation of a number of genes in a cascade of events (Figure 7). The asparagine synthetase gene, ASN, was thought to respond to salt and osmotic stresses [40]. This gene is upregulated at the 2 and 12 h timepoints of salt stress (Table S3). Free asparagine has a vital role in both the storage and transport of nitrogen [41]. Both asparagine and proline were reported to accumulate in Hordeum and wheat as a response to salt stress and participate in conferring stress tolerance [42,43]. Accumulated evidence in the present study, in terms of AGT and ASN upregulation as well as NR and Fd-NiR downregulation, align with the cited influence of these genes on several biological processes in the cell, including the response to adverse environmental conditions (Figure 7) [34,44]. Asparagine is also reported to play a major role in nitrogen storage and transport, as it contains the highest nitrogen to carbon ratio among different amino acids [45,46,47]. Interestingly, the transport of asparagine promotes sequential nitrogen mobilization from the source, namely the xylem/phloem, to be stored in the ultimate sink, namely the seed, to secure seed-filling under stress conditions [43,48].
Glutamate dehydrogenase (GDH) is among those enzymes whose encoding gene is upregulated in leaves of H. spontaneum at the 2 and 12 h timepoints of salt stress (Table S3). Under salt stress, transgenic tobacco overexpressing the gene encoding this enzyme resulted in higher shoot and root biomass production [49]. This is accompanied by differential accumulation of several carbon and nitrogen containing molecules, such as digalactosylglycerol, erythronate and porphyrin. This suggests the possible contribution of these molecules to improving the performance of plants under salt stress. GDH has a central position in carbon and nitrogen metabolism, but it favors deaminating glutamate and the production of oxoglutarate and ammonia when the carbon source is limited [50]. Under such conditions, ammonia can proceed in the oxidation reaction towards nitrate assimilation, which is the major route for incorporating ammonia via the action of AGT as previously noted (Figure 7) into useful organic molecules such as nitrates. This conclusion in the leaves of H. spontaneum aligns with those previously described [51].
Genes encoding E3 ubiquitin-protein ligases were upregulated in the leaves of H. spontaneum at the 2 and 12 h timepoints of salt stress (Tables S3 and S4). The encoded enzymes were reported to regulate the carbon/nitrogen-nutrient response and pathogen resistance in plants, as well as help adjust physiological processes under biotic and abiotic stresses via signal transduction cascades. Signal transduction events facilitate various cellular responses including ubiquitination [22]. Ubiquitination, e.g., a post-translational modification, acts in mediating growth under both normal and adverse environmental conditions [52]. Ubiquitin is a protein that is stable, highly conserved and universally expressed. E3 ligase facilitates the transfer of ubiquitin to the target protein (mono-ubiquitination). Guo et al. [53] indicated that overexpression of a single mono-ubiquitin gene such as E3 ligase can enhance tolerance to multiple stresses. Martin et al. [54] also indicated that plants grown under high sugar and low nitrogen levels experience arrested post-germination growth and cannot survive under such stress conditions due to the influence of one type of E3 ubiquitin-protein ligase, namely RING-type. Photorespiration is known to reduce the efficiency of photosynthesis and, consequently, reduces the sugar level in plant leaves. Therefore, AGT can alleviate the influence of E3 ligase, as AGT promotes photorespiration which serves in avoiding high sugar levels. This enables plants to progress through post-germination growth stages and survive under stress conditions. Extensive exposure to salt stress mediates two types of homeostasis: tissue homeostasis via programmed cell death (PCD) and protein homeostasis via ubiquitination. Under salt stress, PCD acts on eliminating damaged and unwanted cells [55], while ubiquitination acts on eliminating damaged and unwanted proteins in the cell [56]. Such post-translational modification of proteins signals the battery of PCD pathways if the intensity of protein damage in the cell is high (Figure 7) [55].
Genes encoding alpha-aminoadipic semialdehyde synthase (AASA synthase or AASAS) and small auxin-up RNA 40 (SAUR40) were also upregulated at the 2 and 12 h timepoints of salt stress (Table S3). The AASA synthase enzyme is bifunctional in the “lysine degradation” or “saccharopine” pathway as it catalyzes the first two steps in the pathway. The enzyme converts the amino acid lysine to α-aminoadipic-δ-semialdehyde (AASA) which is subsequently converted to aminoadipic acid (AAA) [57]. The overexpression of the gene encoding AASAS is proven to participate in the abiotic stress response and tolerance. The authors justified tolerance by the production of osmolytes, e.g., proline (Figure 7), or signaling compounds that induce downstream stress-responsive genes. The SAUR family is implicated in a wide range of developmental and physiological processes, such as activation of H+-ATPases in plasma membranes and the promotion of cell growth via the “plant hormone signal transduction” pathway [58]. The authors indicated that the expression of genes encoding SAURs is also regulated by other hormones and signals that promote plant growth and development.
The tetratricopeptide repeat (TPR)-domain suppressor of STIMPY (TSS) and ADP-ribosylation factor 2 (ARF2) are two proteins encoded by genes that are downregulated under stress conditions in the leaves of H. spontaneum at the 2, 12 and 24 h timepoints of salt stress (Table S3). The first protein, e.g., TSS, negatively regulates the proliferation of meristematic tissue by integrating developmental signals with carbon source availability [59]. Under stress conditions, the carbon source ought to increase due to photorespiration, as previously noted. According to Skylar et al. [59], the expression of the gene encoding the TSS protein negatively correlates with the carbon level; thus, it is likely that this gene will be downregulated in alignment with the results of the present study. The ARF2 protein was reported to accumulate under salinity stress [60]. In disagreement with our results, Joshi et al. [61] indicated that the overexpressing of the ARF1 gene in rice and Arabidopsis results in higher salt and drought tolerance, whereas the ARF2 gene in the present study was downregulated (Table S3). However, genomic analysis on the structure, organization and evolution of ARF genes by Joshi et al. [61] questioned the aforementioned expression profile in response to both stresses. Therefore, we call for further experimentation and debate in order to delineate the precise role of this gene family under stress conditions.
Prior reports comparing wild (H. spontaneum) and cultivated (H. vulgare) barley indicate differences in phenotypic characteristics due to the different genetic makeup of the two genotypes [6,13]. Other reports indicate that less than half of the alleles found in wild barley exist in cultivated barley [62,63]. This differential presence/expression of alleles include those related to biotic [7,8] and abiotic [11,12] stresses. More recently, Liu and colleagues [13] detected some abiotic stress-related genes that are enriched only in wild barley. In the present study, we can confirm enrichment of seven of these abiotic stress-related genes, which encode enzymes/proteins of two pathways, namely, “plant hormone signal transduction” and “MAKP signaling pathway-plant” at the 2 and 12 h timepoints of salt stress (Figure 8). Of these, genes and gene isoforms encoding SAUR36, SAUR40 and SAUR72 directly promote plant growth and development of wild barley under stress [58]. The lack of enrichment in this SAUR protein family in cultivated barley might explain its inability to withstand salt stress, as SAUR proteins represent the end product of this signal transduction avenue. The other wild barley-specific gene encoding the two-component response regulator, ORR3, was recently reported to confer dehydration tolerance in cyanobacteria [64]. Meanwhile, the gene encoding serine/threonine-protein kinase BSK1-2 regulates innate immunity in plants [65], and the gene encoding the protein phosphatase 2C has influences on metabolism, hormone levels and plant growth factors under salt stress, according to Chu [66,67]. Collectively, these seven genes add to our understanding of the differential performance of the two genotypes under salt stress.

5. Conclusions

The present study has expanded our knowledge of molecular processes of salt tolerance in wild barley (Hordeum spontaneum). Under stress conditions, we paid attention to the genes regulating the levels of sugar and CO2 on one hand, and those regulating O2 and nitrogen (particularly nitrate) on the other. The levels of these elements and the molecules they generate contribute to the plant’s ability to grow and withstand abiotic stresses. This information can provide valuable insights when producing crop plants with improved salt tolerance.

Supplementary Materials

The following supporting information can be downloaded at: https://drive.google.com/drive/folders/1ZqUBMNx-o1HIf9fFhHF_IK9PB-9D-weI?usp=sharing.

Author Contributions

Conceptualization, A.A.B. and A.A.A.; methodology, A.A.B. and A.A.A.; software, A.A.B. and A.A.A.; validation, A.A.B. and A.A.A.; formal analysis, A.A.B. and A.A.A.; investigation, A.A.B. and A.A.A.; resources, A.A.B. and A.A.A.; data curation, A.A.B. and A.A.A.; writing—original draft preparation, A.A.B. and A.A.A.; writing—review and editing, A.A.B. and A.A.A.; visualization, A.A.B. and A.A.A.; supervision, A.A.B. and A.A.A.; project administration, A.A.B. and A.A.A.; funding acquisition, A.A.B. All authors have read and agreed to the published version of the manuscript.

Funding

Deanship of Scientific Research at Umm Al-Qura University, Saudi Arabia (Grant Code: 23UQU4350210DSR01).

Institutional Review Board Statement

Not applicable.

Informed Consent Statement

Not applicable.

Data Availability Statement

The raw next generation sequencing data were submitted in FASTQ format to NCBI and the experiment received accession number of PRJNA227211.

Acknowledgments

The authors would like to thank the Deanship of Scientific Research at Umm Al-Qura University for supporting this work by Grant Code: (23UQU4350210DSR01).

Conflicts of Interest

The authors declare no conflict of interest.

References

  1. Qadir, M.; Quillérou, E.; Nangia, V.; Murtaza, G.; Singh, M.; Thomas, R.J.; Drechsel, P.; Noble, A.D. Economics of salt-induced land degradation and restoration. Nat. Resour. Forum 2014, 38, 282–295. [Google Scholar] [CrossRef]
  2. Savary, S.; Akter, S.; Almekinders, C.; Harris, J.; Korsten, L.; Rotter, R.; Waddington, S.; Watson, D. Mapping disruption and resilience mechanisms in food systems. Food Secur. 2020, 12, 695–717. [Google Scholar] [CrossRef] [PubMed]
  3. Zhao, S.; Zhang, Q.; Liu, M.; Zhou, H.; Ma, C.; Wang, P. Regulation of Plant Responses to Salt Stress. Int. J. Mol. Sci. 2021, 22, 4609. [Google Scholar] [CrossRef] [PubMed]
  4. Brozynska, M.; Furtado, A.; Henry, R.J. Genomics of crop wild relatives: Expanding the gene pool for crop improvement. Plant Biotechnol. J. 2016, 14, 1070–1085. [Google Scholar] [CrossRef] [PubMed]
  5. Ali, B.; Saleem, M.H.; Ali, S.; Shahid, M.J.; Sagir, M.; Tahir, M.B.; Qureshi, K.A.; Jaremko, M.; Selim, S.; Hussain, A. Mitigation of Salinity Stress in Barley Genotypes with Variable Salt Tolerance by Application of Zinc Oxide Nanoparticles (ZnO NPs). Front. Plant Sci. 2022, 13, 973782. [Google Scholar] [CrossRef]
  6. Zohary, D.; Hopf, M.; Weiss, E. Domestication of Plants in the Old World: The Origin and Spread of Domesticated Plants in Southwest Asia, Europe, and the Mediterranean Basin; Oxford University Press: Oxford, UK, 2012. [Google Scholar]
  7. Chen, G.; Liu, Y.; Ma, J.; Zheng, Z.; Wei, Y.; McIntyre, C.L.; Zheng, Y.L.; Liu, C. A novel and major quantitative trait locus for fusarium crown rot resistance in a genotype of Wild Barley (Hordeum spontaneum L.). PLoS ONE 2013, 8, e58040. [Google Scholar] [CrossRef] [Green Version]
  8. Friedt, W.; Horsley, R.D.; Harvey, B.L.; Poulsen, D.M.; Lance, R.C.; Ceccarelli, S.; Grando, S.; Capettini, F. Barley breeding history, progress, objectives, and technology. In Barley: Production, Improvement, and Uses; Blackwell Publishing: Hoboken, NJ, USA, 2011. [Google Scholar]
  9. Kalladan, R.; Worch, S.; Rolletschek, H.; Harshavardhan, V.T.; Kuntze, L.; Seiler, C.; Sreenivasulu, N.; Röder, M.S. Identification of quantitative trait loci contributing to yield and seed quality parameters under terminal drought in barley advanced backcross lines. Mol. Breed. 2013, 32, 71–90. [Google Scholar] [CrossRef]
  10. Lakew, B.; Henry, R.; Eglinton, J.; Baum, M.; Ceccarelli, S.; Grando, S. SSR analysis of introgression of drought tolerance from the genome of Hordeum spontaneum into cultivated barley (Hordeum vulgare ssp. vulgare). Euphytica 2013, 191, 231–243. [Google Scholar] [CrossRef]
  11. Russell, J.; van Zonneveld, M.; Dawson, I.K.; Booth, A.; Waugh, R.; Steffenson, B. Genetic diversity and ecological niche modelling of wild barley: Refugia, large-scale post-LGM range expansion and limited mid-future climate threats? PLoS ONE 2014, 9, e86021. [Google Scholar] [CrossRef] [Green Version]
  12. Wang, X.; Chen, Z.-H.; Yang, C.; Zhang, X.; Jin, G.; Chen, G.; Wang, Y.; Holford, P.; Nevo, E.; Zhang, G. Genomic adaptation to drought in wild barley is driven by edaphic natural selection at the Tabigha Evolution Slope. Proc. Natl. Acad. Sci. USA 2018, 115, 5223–5228. [Google Scholar] [CrossRef] [Green Version]
  13. Liu, M.; Li, Y.; Ma, Y.; Zhao, Q.; Stiller, J.; Feng, Q.; Tian, Q.; Liu, D.; Han, B.; Liu, C. The draft genome of a wild barley genotype reveals its enrichment in genes related to biotic and abiotic stresses compared to cultivated barley. Plant Biotechnol. J. 2020, 18, 443–456. [Google Scholar] [CrossRef] [PubMed] [Green Version]
  14. Dai, F.; Wang, X.; Zhang, X.Q.; Chen, Z.; Nevo, E.; Jin, G.; Wu, D.; Li, C.; Zhang, G. Assembly and analysis of a qingke reference genome demonstrate its close genetic relation to modern cultivated barley. Plant Biotechnol. J. 2018, 16, 760–770. [Google Scholar] [CrossRef] [PubMed] [Green Version]
  15. Zeng, X.; Long, H.; Wang, Z.; Zhao, S.; Tang, Y.; Huang, Z.; Wang, Y.; Xu, Q.; Mao, L.; Deng, G.; et al. The draft genome of Tibetan hulless barley reveals adaptive patterns to the high stressful Tibetan Plateau. Proc. Natl. Acad. Sci. USA 2015, 112, 1095–1100. [Google Scholar] [CrossRef] [PubMed] [Green Version]
  16. Gonzalez-Morales, S.; Solis-Gaona, S.; Valdes-Caballero, M.V.; Juarez-Maldonado, A.; Loredo-Trevino, A.; Benavides-Mendoza, A. Transcriptomics of Biostimulation of Plants under Abiotic Stress. Front. Genet. 2021, 12, 583888. [Google Scholar] [CrossRef] [PubMed]
  17. Bowman, M.J.; Park, W.; Bauer, P.J.; Udall, J.A.; Page, J.T.; Raney, J.; Scheffler, B.E.; Jones, D.C.; Campbell, B.T. RNA-Seq transcriptome profiling of upland cotton (Gossypium hirsutum L.) root tissue under water-deficit stress. PLoS ONE 2013, 8, e82634. [Google Scholar] [CrossRef] [PubMed] [Green Version]
  18. Raney, J.A. Transcriptome Analysis of Drought Induced Stress in Chenopodium Quinoa; Brigham Young University: Provo, UT, USA, 2012. [Google Scholar]
  19. Paes de Melo, B.; Carpinetti, P.d.A.; Fraga, O.T.; Rodrigues-Silva, P.L.; Fioresi, V.S.; de Camargos, L.F.; Ferreira, M.F.d.S. Abiotic stresses in plants and their markers: A practice view of plant stress responses and programmed cell death mechanisms. Plants 2022, 11, 1100. [Google Scholar] [CrossRef] [PubMed]
  20. Mehta, R.H.; Ponnuchamy, M.; Kumar, J.; Reddy, N.R. Exploring drought stress-regulated genes in senna (Cassia angustifolia Vahl.): A transcriptomic approach. Funct. Integr. Genom. 2017, 17, 1–25. [Google Scholar] [CrossRef]
  21. Van Eck, L.; Davidson, R.M.; Wu, S.; Zhao, B.Y.; Botha, A.M.; Leach, J.E.; Lapitan, N.L. The transcriptional network of WRKY53 in cereals links oxidative responses to biotic and abiotic stress inputs. Funct. Integr. Genom. 2014, 14, 351–362. [Google Scholar] [CrossRef] [Green Version]
  22. Li, X.; Hasegawa, Y.; Lu, Y.; Sato, T. Ubiquitin related enzymes and plant-specific ubiquitin ligase ATL family in tomato plants. Plant Biotechnol. 2017, 34, 71–78. [Google Scholar] [CrossRef] [Green Version]
  23. Park, H.J.; Kim, W.Y.; Yun, D.J. A New Insight of Salt Stress Signaling in Plant. Mol. Cells 2016, 39, 447–459. [Google Scholar] [CrossRef] [Green Version]
  24. Gong, Z. Plant abiotic stress: New insights into the factors that activate and modulate plant responses. J. Integr. Plant Biol. 2021, 63, 429. [Google Scholar] [CrossRef] [PubMed]
  25. Abulfaraj, A.A. Stepwise signal transduction cascades under salt stress in leaves of wild barley (Hordeum spontaneum). Biotechnol. Biotechnol. Equip. 2020, 34, 860–872. [Google Scholar] [CrossRef]
  26. Bolger, A.M.; Lohse, M.; Usadel, B. Trimmomatic: A flexible trimmer for Illumina sequence data. Bioinformatics 2014, 30, 2114–2120. [Google Scholar] [CrossRef] [PubMed] [Green Version]
  27. Min, X.J.; Butler, G.; Storms, R.; Tsang, A. OrfPredictor: Predicting protein-coding regions in EST-derived sequences. Nucleic Acids Res. 2005, 33, W677–W680. [Google Scholar] [CrossRef] [Green Version]
  28. Bahieldin, A.; Atef, A.; Sabir, J.S.; Gadalla, N.O.; Edris, S.; Alzohairy, A.M.; Radhwan, N.A.; Baeshen, M.N.; Ramadan, A.M.; Eissa, H.F.; et al. RNA-Seq analysis of the wild barley (H. spontaneum) leaf transcriptome under salt stress. Comptes Rendus Biol. 2015, 338, 285–297. [Google Scholar] [CrossRef]
  29. Liepman, A.H.; Olsen, L.J. Peroxisomal alanine: Glyoxylate aminotransferase (AGT1) is a photorespiratory enzyme with multiple substrates in Arabidopsis thaliana. Plant J. 2001, 25, 487–498. [Google Scholar] [CrossRef]
  30. Liepman, A.H.; Olsen, L.J. Alanine aminotransferase homologs catalyze the glutamate:glyoxylate aminotransferase reaction in peroxisomes of Arabidopsis. Plant Physiol. 2003, 131, 215–227. [Google Scholar] [CrossRef] [Green Version]
  31. Pires, M.V.; Pereira Júnior, A.A.; Medeiros, D.B.; Daloso, D.M.; Pham, P.A.; Barros, K.A.; Engqvist, M.K.; Florian, A.; Krahnert, I.; Maurino, V.G. The influence of alternative pathways of respiration that utilize branched-chain amino acids following water shortage in Arabidopsis. Plant Cell Environ. 2016, 39, 1304–1319. [Google Scholar] [CrossRef] [Green Version]
  32. Batista-Silva, W.; Heinemann, B.; Rugen, N.; Nunes-Nesi, A.; Araujo, W.L.; Braun, H.P.; Hildebrandt, T.M. The role of amino acid metabolism during abiotic stress release. Plant Cell Environ. 2019, 42, 1630–1644. [Google Scholar] [CrossRef] [Green Version]
  33. Shim, J.S.; Jeong, H.I.; Bang, S.W.; Jung, S.E.; Kim, G.; Kim, Y.S.; Redillas, M.; Oh, S.J.; Seo, J.S.; Kim, J.K. Drought-induced Branched-Chain Amino Acid Aminotransferase Enhances Drought Tolerance in Rice. Plant Physiol. 2023, 191, 1435–1447. [Google Scholar] [CrossRef]
  34. Kothari, K.S.; Dansana, P.K.; Giri, J.; Tyagi, A.K. Rice Stress Associated Protein 1 (OsSAP1) Interacts with Aminotransferase (OsAMTR1) and Pathogenesis-Related 1a Protein (OsSCP) and Regulates Abiotic Stress Responses. Front. Plant Sci. 2016, 7, 1057. [Google Scholar] [CrossRef] [PubMed] [Green Version]
  35. Hu, C.A.; Delauney, A.J.; Verma, D.P. A bifunctional enzyme (delta 1-pyrroline-5-carboxylate synthetase) catalyzes the first two steps in proline biosynthesis in plants. Proc. Natl. Acad. Sci. USA 1992, 89, 9354–9358. [Google Scholar] [CrossRef] [PubMed] [Green Version]
  36. Maloney, G.S.; Kochevenko, A.; Tieman, D.M.; Tohge, T.; Krieger, U.; Zamir, D.; Taylor, M.G.; Fernie, A.R.; Klee, H.J. Characterization of the branched-chain amino acid aminotransferase enzyme family in tomato. Plant Physiol. 2010, 153, 925–936. [Google Scholar] [CrossRef] [PubMed] [Green Version]
  37. Sharkey, T.D. Estimating the rate of photorespiration in leaves. Physiol. Plant. 1988, 73, 147–152. [Google Scholar] [CrossRef]
  38. Rachmilevitch, S.; Cousins, A.B.; Bloom, A.J. Nitrate assimilation in plant shoots depends on photorespiration. Proc. Natl. Acad. Sci. USA 2004, 101, 11506–11510. [Google Scholar] [CrossRef] [Green Version]
  39. Bloom, A.J.; Burger, M.; Rubio Asensio, J.S.; Cousins, A.B. Carbon dioxide enrichment inhibits nitrate assimilation in wheat and Arabidopsis. Science 2010, 328, 899–903. [Google Scholar] [CrossRef] [Green Version]
  40. Wang, H.; Liu, D.; Sun, J.; Zhang, A. Asparagine synthetase gene TaASN1 from wheat is up-regulated by salt stress, osmotic stress and ABA. J. Plant Physiol. 2005, 162, 81–89. [Google Scholar] [CrossRef]
  41. Postles, J.; Curtis, T.Y.; Powers, S.J.; Elmore, J.S.; Mottram, D.S.; Halford, N.G. Changes in Free Amino Acid Concentration in Rye Grain in Response to Nitrogen and Sulfur Availability, and Expression Analysis of Genes Involved in Asparagine Metabolism. Front. Plant Sci. 2016, 7, 917. [Google Scholar] [CrossRef] [Green Version]
  42. Garthwaite, A.J.; von Bothmer, R.; Colmer, T.D. Salt tolerance in wild Hordeum species is associated with restricted entry of Na+ and Cl into the shoots. J. Exp. Bot. 2005, 56, 2365–2378. [Google Scholar] [CrossRef]
  43. Oddy, J.; Raffan, S.; Wilkinson, M.D.; Elmore, J.S.; Halford, N.G. Stress, nutrients and genotype: Understanding and managing asparagine accumulation in wheat grain. CABI Agric. Biosci. 2020, 1, 10. [Google Scholar] [CrossRef]
  44. Halford, N.G.; Curtis, T.Y.; Chen, Z.; Huang, J. Effects of abiotic stress and crop management on cereal grain composition: Implications for food quality and safety. J. Exp. Bot. 2015, 66, 1145–1156. [Google Scholar] [CrossRef] [Green Version]
  45. Gaufichon, L.; Reisdorf-Cren, M.; Rothstein, S.J.; Chardon, F.; Suzuki, A. Biological functions of asparagine synthetase in plants. Plant Sci. 2010, 179, 141–153. [Google Scholar] [CrossRef]
  46. Gaufichon, L.; Marmagne, A.; Belcram, K.; Yoneyama, T.; Sakakibara, Y.; Hase, T.; Grandjean, O.; Clément, G.; Citerne, S.; Boutet-Mercey, S. ASN 1-encoded asparagine synthetase in floral organs contributes to nitrogen filling in Arabidopsis seeds. Plant J. 2017, 91, 371–393. [Google Scholar] [CrossRef] [PubMed] [Green Version]
  47. Lea, P.J.; Sodek, L.; Parry, M.A.; Shewry, P.R.; Halford, N.G. Asparagine in plants. Ann. Appl. Biol. 2007, 150, 1–26. [Google Scholar] [CrossRef]
  48. Lam, H.M.; Wong, P.; Chan, H.K.; Yam, K.M.; Chen, L.; Chow, C.M.; Coruzzi, G.M. Overexpression of the ASN1 gene enhances nitrogen status in seeds of Arabidopsis. Plant Physiol. 2003, 132, 926–935. [Google Scholar] [CrossRef] [Green Version]
  49. Tercé-Laforgue, T.; Clément, G.; Marchi, L.; Restivo, F.M.; Lea, P.J.; Hirel, B. Resolving the role of plant NAD-glutamate dehydrogenase: III. Overexpressing individually or simultaneously the two enzyme subunits under salt stress induces changes in the leaf metabolic profile and increases plant biomass production. Plant Cell Physiol. 2015, 56, 1918–1929. [Google Scholar] [CrossRef] [PubMed] [Green Version]
  50. Purnell, M.P.; Botella, J.R. Tobacco isoenzyme 1 of NAD(H)-dependent glutamate dehydrogenase catabolizes glutamate in vivo. Plant Physiol. 2007, 143, 530–539. [Google Scholar] [CrossRef] [PubMed] [Green Version]
  51. Zanin, L.; Zamboni, A.; Monte, R.; Tomasi, N.; Varanini, Z.; Cesco, S.; Pinton, R. Transcriptomic analysis highlights reciprocal interactions of urea and nitrate for nitrogen acquisition by maize roots. Plant Cell Physiol. 2015, 56, 532–548. [Google Scholar] [CrossRef] [Green Version]
  52. Lyzenga, W.J.; Stone, S.L. Abiotic stress tolerance mediated by protein ubiquitination. J. Exp. Bot. 2012, 63, 599–616. [Google Scholar] [CrossRef] [Green Version]
  53. Guo, Q.; Zhang, J.; Gao, Q.; Xing, S.; Li, F.; Wang, W. Drought tolerance through overexpression of monoubiquitin in transgenic tobacco. J. Plant Physiol. 2008, 165, 1745–1755. [Google Scholar] [CrossRef]
  54. Martin, T.; Oswald, O.; Graham, I.A. Arabidopsis seedling growth, storage lipid mobilization, and photosynthetic gene expression are regulated by carbon:nitrogen availability. Plant Physiol. 2002, 128, 472–481. [Google Scholar] [CrossRef]
  55. Roberts, J.Z.; Crawford, N.; Longley, D.B. The role of Ubiquitination in Apoptosis and Necroptosis. Cell Death Differ. 2022, 29, 272–284. [Google Scholar] [CrossRef] [PubMed]
  56. Guo, H.J.; Tadi, P. Biochemistry, Ubiquitination. In StatPearls [Internet]; StatPearls Publishing: Tampa, FL, USA, 2022. [Google Scholar]
  57. Arruda, P.; Neshich, I.P. Nutritional-rich and stress-tolerant crops by saccharopine pathway manipulation. Food Energy Secur. 2012, 1, 141–147. [Google Scholar] [CrossRef]
  58. Ren, H.; Gray, W.M. SAUR proteins as effectors of hormonal and environmental signals in plant growth. Mol. Plant 2015, 8, 1153–1164. [Google Scholar] [CrossRef] [Green Version]
  59. Skylar, A.; Sung, F.; Hong, F.; Chory, J.; Wu, X. Metabolic sugar signal promotes Arabidopsis meristematic proliferation via G2. Dev. Biol. 2011, 351, 82–89. [Google Scholar] [CrossRef] [Green Version]
  60. Muthamilarasan, M.; Mangu, V.R.; Zandkarimi, H.; Prasad, M.; Baisakh, N. Structure, organization and evolution of ADP-ribosylation factors in rice and foxtail millet and their expression in rice. Sci. Rep. 2016, 6, 24008. [Google Scholar] [CrossRef] [PubMed] [Green Version]
  61. Joshi, R.; Ramanarao, M.V.; Lee, S.; Kato, N.; Baisakh, N. Ectopic expression of ADP ribosylation factor 1 (SaARF1) from smooth cordgrass (Spartina alterniflora Loisel) confers drought and salt tolerance in transgenic rice and Arabidopsis. Plant Cell Tissue Organ Cult. (PCTOC) 2014, 117, 17–30. [Google Scholar] [CrossRef]
  62. Horns, F.; Hood, M.E. The evolution of disease resistance and tolerance in spatially structured populations. Ecol. Evol. 2012, 2, 1705–1711. [Google Scholar] [CrossRef]
  63. Tombuloglu, G.; Tombuloglu, H.; Sakcali, M.S.; Unver, T. High-throughput transcriptome analysis of barley (Hordeum vulgare) exposed to excessive boron. Gene 2015, 557, 71–81. [Google Scholar] [CrossRef]
  64. Kimura, S.; Sato, M.; Fan, X.; Ohmori, M.; Ehira, S. The two-component response regulator OrrA confers dehydration tolerance by regulating avaKa expression in the cyanobacterium Anabaena sp. strain PCC 7120. Environ. Microbiol. 2022, 24, 5165–5173. [Google Scholar] [CrossRef]
  65. Shi, H.; Shen, Q.; Qi, Y.; Yan, H.; Nie, H.; Chen, Y.; Zhao, T.; Katagiri, F.; Tang, D. BR-SIGNALING KINASE1 physically associates with FLAGELLIN SENSING2 and regulates plant innate immunity in Arabidopsis. Plant Cell 2013, 25, 1143–1157. [Google Scholar] [CrossRef] [PubMed] [Green Version]
  66. Chu, M.; Chen, P.; Meng, S.; Xu, P.; Lan, W. The Arabidopsis phosphatase PP2C49 negatively regulates salt tolerance through inhibition of AtHKT1;1. J. Integr. Plant Biol. 2021, 63, 528–542. [Google Scholar] [CrossRef] [PubMed]
  67. Wu, Z.; Luo, L.; Wan, Y.; Liu, F. Genome-wide characterization of the PP2C gene family in peanut (Arachis hypogaea L.) and the identification of candidate genes involved in salinity-stress response. Front. Plant Sci 2023, 14, 1093913. [Google Scholar] [CrossRef] [PubMed]
Figure 1. Heat map describing the interrelation among genes at control (C) and salt-stressed (500 mM NaCl) samples across different timepoints (e.g., 2, 12 and 24 h) in leaves of H. spontaneum.
Life 13 01454 g001
Figure 2. qPCR used for validating RNA-Seq datasets in leaves of H. spontaneum under salt stress (500 mM NaCl) using four randomly selected transcripts that were upregulated at the 2 and 12 h timepoints (cytosolic sulfotransferase 12). Meanwhile, downregulation occurred at the 2, 12 and 24 h timepoints (ADP-ribosylation factor 2); at the 2 and 12 h (nitrate reductase); and at the 12 h timepoint (dirigent protein 1). Upregulated transcripts are shown in red columns, while downregulated transcripts are shown in green columns. Unregulated transcripts are shown in gray columns.
Life 13 01454 g002
Figure 3. GO classification of upregulated genes under salt stress (500 mM NaCl) based on the similarity search within leaf CDS in the leaf transcriptome of H. spontaneum.
Life 13 01454 g003
Figure 4. GO classification of downregulated genes under salt stress (500 mM NaCl) based on the similarity search within leaf CDS in the leaf transcriptome of H. spontaneum.
Life 13 01454 g004
Figure 5. Examples of clusters that were upregulated under salt stress (500 mM NaCl) at the 2 and 12 h timepoints (cluster 17), while being downregulated at the 2, 12 and 24 h timepoints (cluster 19), at the 2 and 12 h timepoints (cluster 25) and at the 12 h timepoint (cluster 30) in the leaf transcriptome of H. spontaneum. Detailed descriptions of regulated transcripts of these clusters are shown in Tables S2 and S3.
Life 13 01454 g005
Figure 6. Expression patterns of coexpressed genes encoding E3 ubiquitin-protein ligase and those related to programmed cell death of cluster 1 for samples treated with salt stress (500 mM NaCl) at the 0, 2, 12 and 24 h timepoints in the leaf transcriptome of H. spontaneum. Descriptions of the genes are shown in Tables S2 and S4.
Life 13 01454 g006
Figure 7. Influence of regulated genes in leaves of H. spontaneum under salt stress (500 mM NaCl) on several biological processes in terms of plant growth and development. The four-box pattern refers to regulated genes at the 0, 2, 12 and/or 24 h timepoints of salt (500 mM NaCl). Upregulated transcripts are shown in red boxes, downregulated transcripts are shown in green boxes and unregulated transcripts are shown in gray boxes. ASN = asparagine synthetase, AASAS = alpha-aminoadipic semialdehyde synthase, P5CS = delta1-pyrroline-5-carboxylate synthase, AGT = alanine:glyoxylate aminotransferase, BCAT3 = branched-chain-amino-acid aminotransferase 3, E3 ligase = E3 ubiquitin-protein ligase, PM = plasma membrane, TSS = tetratricopeptide repeat (TPR)-domain suppressor of STIMPY, SAUR = small auxin-up RNA 40, NR = nitrate reductase, Fd-NiR = ferredoxin-nitrite reductase, GDH = glutamate dehydrogenase, PCD = programmed cell death.
Life 13 01454 g007
Figure 8. Expression patterns of genes specific to wild barley H. spontaneum in pathways “plant hormone signal transduction” (ko04075) and “MAPK signaling pathway-plant” (ko04016) at the 0, 2, 12 and 24 h timepoints of salt stress (500 mM NaCl). All genes showed upregulation at the 2 and 12 h timepoints of salt stress (500 mM NaCl). Gene 1 = encodes two-component response regulator ORR3, gene 2 = encodes serine/threonine-protein kinase BSK1-2, gene 3 = encodes auxin-responsive protein SAUR71, gene 4 = encodes auxin-responsive protein SAUR36 (isoform 1), gene 5 = encodes auxin-responsive protein SAUR36 (isoform 2), gene 6 = encodes auxin-responsive protein SAUR40, gene 7 = encodes protein phosphatase 2C. Genes 1-6 regulate enzymes/proteins of the “plant hormone signal transduction” pathway, while genes 2 and 7 regulate enzymes of “MAPK signaling pathway-plant”. These seven genes were recently proven to be regulated in wild barley (H. spontaneum), yet are not regulated in cultivated barley [13]. See Table S2 for more details.
Life 13 01454 g008
Disclaimer/Publisher’s Note: The statements, opinions and data contained in all publications are solely those of the individual author(s) and contributor(s) and not of MDPI and/or the editor(s). MDPI and/or the editor(s) disclaim responsibility for any injury to people or property resulting from any ideas, methods, instructions or products referred to in the content.

