
Soccer, Sleep, Repeat: Effects of Training Characteristics on Sleep Quantity and Sleep Architecture

Abstract
:1. Introduction
2. Materials and Methods
2.1. Sample
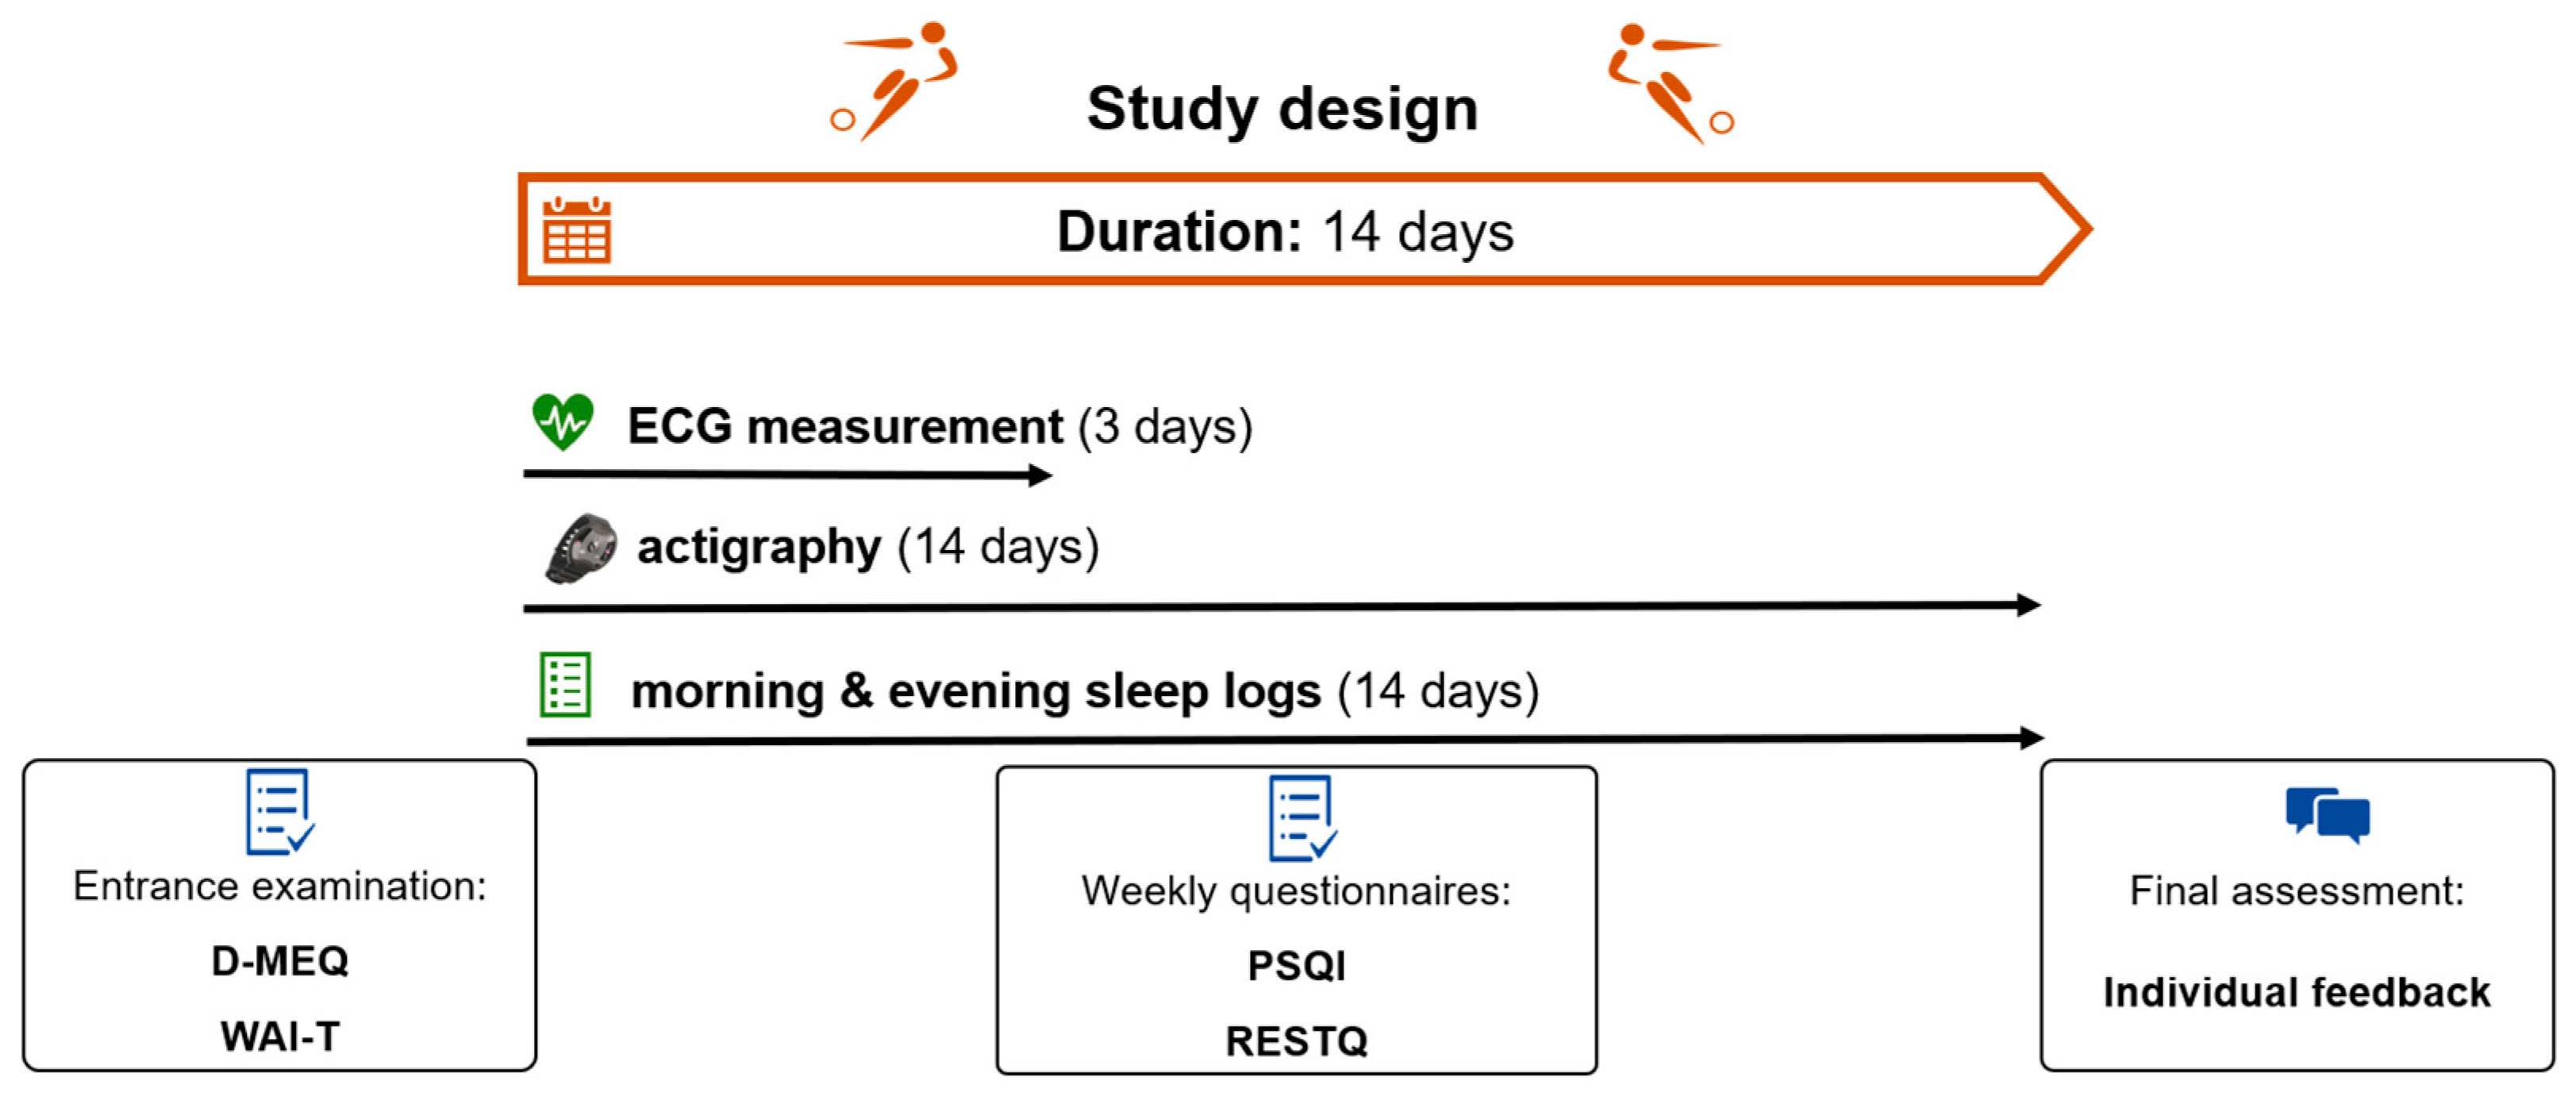
2.2. Study Design
2.3. Statistics
3. Results
3.1. Descriptives
3.2. Questionnaires
3.3. Perceived Training Intensity
3.4. Timing of Last Physical Activity before Bedtime
3.5. Number of Training Sessions
4. Discussion
Limitations
5. Conclusions
Author Contributions
Funding
Institutional Review Board Statement
Informed Consent Statement
Data Availability Statement
Acknowledgments
Conflicts of Interest
Appendix A

| Team | Number N | Age M (SD) | Study Period | Data Collection | |
|---|---|---|---|---|---|
| 2018/19 | U15 | 16 | 14.13 (0.50) | 22 days (11–12/2018) | Paper pencil, LimeSurvey (LimeSurvey GmbH, Hamburg, DE) |
| 2018/19 | U16 | 8 | 15.29 (0.49) | 18 days (04/2019) | Paper pencil, LimeSurvey (LimeSurvey GmbH, Hamburg, DE) |
| 2019/20 | U15 | 6 | 15.00 (0.00) | 14 days (12/2019) | Paper pencil, LimeSurvey (LimeSurvey GmbH, Hamburg, DE) |
| 2020/21 | U15 | 23 | 14.13 (0.46) | 3 × 14 days (12/2020, 03/2021, 04/2021) | Trayn app (Trayn Inc., Vienna, AT) |
Appendix B
| Abbreviation | Explanation |
|---|---|
| TIB | time in Bed = length of hypnogram (min) |
| TSP | total sleep period = duration from the first to the last sleep epoch (min) |
| WTSP | wake time within the TSP (min) |
| WTSP_2 | wake time of awakenings with a min duration of 2 min within the TSP (min) |
| WASO | wake after sleep onset = duration from the first sleep epoch until the end of the file (min) |
| TST | total duration of sleep within the TSP (min) |
| WAKE | amount of wakefulness (min) |
| LIGHT | amount of light sleep (min) |
| DEEP | amount of deep sleep (min) |
| REM | amount of REM sleep (min) |
| NREM | amount of NREM (LIGHT + DEEP) sleep (min) |
| LIGHT_FH/_SH | amount of light sleep in first/second night half |
| DEEP_FH/_SH | amount of deep sleep in first/second night half |
| REM_FH/_SH | amount of REM sleep in first/second night half |
| PC_X | percent of wakefulness, light, deep, or REM sleep within the TST (%) |
| SOL | sleep onset latency (min) |
| SOL_AASM | until first sleep (any) epoch |
| SOL_LGHT | until first light sleep epoch |
| SOL_DEEP | until first deep sleep epoch |
| SOL_REM | until first REM epoch |
| SOL_5 | time point after which the sleeper has spent at least five minutes (10 subsequent epochs) in a sleep stage other than wake (continuous sleep) |
| SOL_10 | time point after which the sleeper has spent at least ten minutes (20 subsequent epochs) in a sleep stage other than wake (continuous sleep) |
| SE | leep efficiency = TST/TIB × 100 (%) |
| SME | sleep maintenance efficiency = TST/SPT × 100 (%) |
| NOA | number of awakenings within the TSP |
| NOA_2 | number of awakenings within the TSP with a minimum duration of two continuous wake minutes |
| NSS | number of stage shifts within the TSP |
| FS | first sleep (min) |
| FA | final awakening (min) |
| WAFA | wake time after final awakening |
Appendix C


References
- Iber, C.; Ancoli-Israel, S.; Chesson, A.; Quan, S.F. The AASM Manual for the Scoring of Sleep and Associated Events: Rules, Terminology and Technical Specification; American Academy of Sleep Medicine: Darien, IL, USA, 2007. [Google Scholar]
- Assefa, S.; Diaz-Abad, M.; Wickwire, E.M.; Scharf, S.M. The Functions of Sleep. AIMS Neurosci. 2015, 2, 155–171. [Google Scholar] [CrossRef]
- Paruthi, S.; Brooks, L.J.; D’Ambrosio, C.; Hall, W.; Kotagal, S.; Lloyd, R.M.; Malow, B.A.; Maski, K.; Nichols, C.; Quan, S.F.; et al. Recommended Amount of Sleep for Pediatric Populations: A Consensus Statement of the American Academy of Sleep Medicine. J. Clin. Sleep Med. 2016, 12, 785–786. [Google Scholar] [CrossRef] [PubMed]
- Claudino, J.G.; Gabbett, T.J.; de Sá Souza, H.; Simim, M.; Fowler, P.; De Alcantara Borba, D.D.A.; Melo, M.; Bottino, A.; Loturco, I.; D’Almeida, V.; et al. Which parameters to use for sleep quality monitoring in team sport athletes? A systematic review and meta-analysis. BMJ Open Sport Exerc. Med. 2019, 5, e000475. [Google Scholar] [CrossRef] [PubMed] [Green Version]
- Patel, A.K.; Reddy, V.; Shumway, K.R.; Araujo, J.F. Physiology, Sleep Stages; StatPearls: Treasure Island, FL, USA, 2022. Available online: https://www.ncbi.nlm.nih.gov/books/NBK526132/ (accessed on 8 June 2023).
- Walsh, N.P.; Halson, S.L.; Sargent, C.; Roach, G.D.; Nédélec, M.; Gupta, L.; Leeder, J.; Fullagar, H.H.; Coutts, A.J.; Edwards, B.J.; et al. Sleep and the athlete: Narrative review and 2021 expert consensus recommendations. Br. J. Sports Med. 2020, 55, 356–368. [Google Scholar] [CrossRef] [PubMed]
- Knufinke, M.; Nieuwenhuys, A.; Geurts, S.A.E.; Coenen, A.M.L.; Kompier, M.A.J. Self-reported sleep quantity, quality and sleep hygiene in elite athletes. J. Sleep Res. 2018, 27, 78–85. [Google Scholar] [CrossRef] [Green Version]
- Robey, E.; Dawson, B.; Halson, S.; Gregson, W.; Goodman, C.; Eastwood, P. Sleep quantity and quality in elite youth soccer players: A pilot study. Eur. J. Sport Sci. 2014, 14, 410–417. [Google Scholar] [CrossRef]
- Suppiah, H.T.; Swinbourne, R.; Wee, J.; Tay, V.; Gastin, P. Sleep Characteristics of Elite Youth Athletes: A Clustering Approach to Optimize Sleep Support Strategies. Int. J. Sports Physiol. Perform. 2021, 16, 1225–1233. [Google Scholar] [CrossRef]
- Whitworth-Turner, C.; Di Michele, R.; Muir, I.; Gregson, W.; Drust, B. A comparison of sleep patterns in youth soccer players and non-athletes. Sci. Med. Footb. 2018, 2, 3–8. [Google Scholar] [CrossRef]
- Hrozanova, M.; Klöckner, C.A.; Sandbakk, Ø.; Pallesen, S.; Moen, F. Reciprocal Associations Between Sleep, Mental Strain, and Training Load in Junior Endurance Athletes and the Role of Poor Subjective Sleep Quality. Front. Psychol. 2020, 11, 2498. [Google Scholar] [CrossRef]
- Fullagar, H.H.K.; Skorski, S.; Duffield, R.; Hammes, D.; Coutts, A.J.; Meyer, T. Sleep and Athletic Performance: The Effects of Sleep Loss on Exercise Performance, and Physiological and Cognitive Responses to Exercise. Sports Med. 2015, 45, 161–186. [Google Scholar] [CrossRef]
- Riederer, M.F. How Sleep Impacts Performance in Youth Athletes. Curr. Sports Med. Rep. 2020, 19, 463–467. Available online: https://journals.lww.com/acsm-csmr/Fulltext/2020/11000/How_Sleep_Impacts_Performance_in_Youth_Athletes.8.aspx (accessed on 8 June 2023). [CrossRef] [PubMed]
- Driver, H.S.; Taylor, S.R. Exercise and sleep. Sleep Med. Rev. 2000, 4, 387–402. [Google Scholar] [CrossRef] [PubMed]
- Shapiro, C.M.; Bortz, R.; Mitchell, D.; Bartel, P.; Jooste, P. Slow-wave sleep: A recovery period after exercise. Science 1981, 214, 1253–1254. [Google Scholar] [CrossRef] [PubMed] [Green Version]
- Buman, M.P.; Phillips, B.A.; Youngstedt, S.D.; Kline, C.E.; Hirshkowitz, M. Does nighttime exercise really disturb sleep? Results from the 2013 National Sleep Foundation Sleep in America Poll. Sleep Med. 2014, 15, 755–761. [Google Scholar] [CrossRef]
- Yamanaka, Y.; Hashimoto, S.; Takasu, N.N.; Tanahashi, Y.; Nishide, S.-Y.; Honma, S.; Honma, K.-I. Morning and evening physical exercise differentially regulate the autonomic nervous system during nocturnal sleep in humans. Am. J. Physiol. Integr. Comp. Physiol. 2015, 309, 1112–1121. [Google Scholar] [CrossRef] [Green Version]
- de Faria, A.P.; Cavagnolli, D.A.; Rossi, M.V.; Ferreira, S.E.; Bittencourt, L.R.A.; Tufik, S.; de Mello, M.T. Effects of Resistance Exercise on the Sleep Patterns of Sedentary Individuals. Sleep Sci. 2009, 2, 141–146. Available online: https://sleepscience.org.br/details/135 (accessed on 8 June 2023).
- Kovacevic, A.; Mavros, Y.; Heisz, J.J.; Fiatarone Singh, M.A. The effect of resistance exercise on sleep: A systematic review of randomized controlled trials. Sleep Med. Rev. 2018, 39, 52–68. [Google Scholar] [CrossRef]
- Maculona Esteves, A.; Ackel-D′Elia, C.; Tufik, S.; De Mello, M.T. Sleep patterns and acute physical exercise: The effects of gender, sleep disturbances, type and time of physical exercise. J. Sports Med. Phys. Fit. 2014, 54, 809–815. [Google Scholar]
- Souissi, M.; Chtourou, H.; Zrane, A.; Ben Cheikh, R.; Dogui, M.; Tabka, Z.; Souissi, N. Effect of time-of-day of aerobic maximal exercise on the sleep quality of trained subjects. Biol. Rhythm. Res. 2012, 43, 323–330. [Google Scholar] [CrossRef]
- Kredlow, M.A.; Capozzoli, M.C.; Hearon, B.A.; Calkins, A.W.; Otto, M.W. The effects of physical activity on sleep: A meta-analytic review. J. Behav. Med. 2015, 38, 427–449. [Google Scholar] [CrossRef]
- Thornton, H.R.; Duthie, G.M.; Pitchford, N.W.; Delaney, J.A.; Benton, D.T.; Dascombe, B.J. Effects of a 2-Week High-Intensity Training Camp on Sleep Activity of Professional Rugby League Athletes. Int. J. Sports Physiol. Perform. 2017, 12, 928–933. [Google Scholar] [CrossRef]
- Killer, S.C.; Svendsen, I.S.; Jeukendrup, A.E.; Gleeson, M. Evidence of disturbed sleep and mood state in well-trained athletes during short-term intensified training with and without a high carbohydrate nutritional intervention. J. Sports Sci. 2018, 35, 1402–1410. [Google Scholar] [CrossRef] [Green Version]
- Romdhani, M.; Washif, J.A.; Taylor, L.; Chamari, K. Soccer Players’ Sleep Quality and Training Load Were Affected by the COVID-19 Lockdown: An International Survey. Int. J. Sports Physiol. Perform. 2023, 18, 530–540. [Google Scholar] [CrossRef] [PubMed]
- Suppiah, H.T.; Low, C.Y.; Chia, M. Effects of sports training on sleep characteristics of Asian adolescent athletes. Biol. Rhythm. Res. 2015, 46, 523–536. [Google Scholar] [CrossRef]
- Knufinke, M.; Nieuwenhuys, A.; Geurts, S.A.E.; Møst, E.I.S.; Maase, K.; Moen, M.H.; Coenen, A.M.; Kompier, M.A. Train hard, sleep well? Perceived training load, sleep quantity and sleep stage distribution in elite level athletes. J. Sci. Med. Sport 2017, 21, 427–432. [Google Scholar] [CrossRef]
- Cook, J.D.; Charest, J. Sleep and Performance in Professional Athletes. Curr. Sleep Med. Rep. 2023, 9, 56–81. [Google Scholar] [CrossRef] [PubMed]
- Fietze, I.; Strauch, J.; Holzhausen, M.; Glos, M.; Theobald, C.; Lehnkering, H.; Penzel, T. Sleep quality in professional ballet dancers. Chronobiol. Int. 2009, 26, 1249–1262. [Google Scholar] [CrossRef] [PubMed]
- Topalidis, P.; Heib, D.P.J.; Baron, S.; Eigl, E.-S.; Hinterberger, A.; Schabus, M. The Virtual Sleep Lab—A Novel Method for Accurate Four-Class Sleep Staging Using Heart-Rate Variability from Low-Cost Wearables. Sensors 2023, 23, 2390. [Google Scholar] [CrossRef] [PubMed]
- Griefahn, B.; Kunemund, C.; Brode, P.; Mehnert, P. Zur Validität der deutschen Übersetzung des Morningness-Eveningness-Questionnaires von Horne und Östberg. T. Somnologie 2001, 5, 71–80. [Google Scholar] [CrossRef]
- Brand, R.; Ehrlenspiel, F.; Graf, K. Wettkampf-Angst-Inventar (WAI): Manual zur komprehensiven Eingangsdiagnostik von Wettkampfangst, Wettkampfängstlichkeit und Angstbewältigungsmodus im Sport (1st ed.). Bundesinst. für Sportwiss. 2009. Available online: https://www.bisp-surf.de/Record/PU200907003359 (accessed on 16 February 2023).
- Buysse, D.J.; Reynolds, C.F.; Monk, T.H.; Berman, S.R.; Kupfer, D.J. The Pittsburgh sleep quality index: A new instrument for psychiatric practice and research. Psychiatry Res. 1989, 28, 193–213. [Google Scholar] [CrossRef]
- Kellmann, M.; Kallus, K.W. Recovery-Stress Questionnaire for Athletes: User Manual. Human Kinetics. 2001. Available online: https://books.google.at/books?hl=en&lr=&id=tyYBWi0pc68C&oi=fnd&pg=PR9&ots=JUUE2Xd6jI&sig=Cub682Cj7bqERCER6ELDnR15aB4&redir_esc=y#v=onepage&q&f=false (accessed on 16 February 2023).
- Frytz, P.; Hödlmoser, K. Der Zusammenhang zwischen Schlaf und Training bei jugendlichen Elite-Mannschaftsathleten in Österreich. Z. Sportpsychol. 2022, 29, 62–73. [Google Scholar] [CrossRef]
- Saletu, B.; Wessely, P.; Grünberger, J.; Schultes, M. Erste klinische Erfahrungen mit einem neuen schlafanstoßenden Benzodiazepin, Cinolazepam, mittels eines Selbstbeurteilungsbogens für Schlaf- und Aufwachqualität (SSA). Neuropsychiatrie 1987, 1, 169–176. [Google Scholar]
- Ohayon, M.M.; Carskadon, M.A.; Guilleminault, C.; Vitiello, M.V. Meta-Analysis of Quantitative Sleep Parameters from Childhood to Old Age in Healthy Individuals: Developing Normative Sleep Values Across the Human Lifespan. Sleep 2004, 27, 1255–1273. [Google Scholar] [CrossRef] [PubMed]
- Stanley, J.; Peake, J.M.; Buchheit, M. Cardiac Parasympathetic Reactivation Following Exercise: Implications for Training Prescription. Sports Med. 2013, 43, 1259–1277. [Google Scholar] [CrossRef]
- Burton, A.R.; Rahman, K.; Kadota, Y.; Lloyd, A.; Vollmer-Conna, U. Reduced heart rate variability predicts poor sleep quality in a case–control study of chronic fatigue syndrome. Exp. Brain Res. 2010, 204, 71–78. [Google Scholar] [CrossRef]
- Guo, X.; Su, T.; Xiao, H.; Xiao, R.; Xiao, Z. Using 24-h Heart Rate Variability to Investigate the Sleep Quality and Depression Symptoms of Medical Students. Front. Psychiatry 2022, 12, 781673. [Google Scholar] [CrossRef]
- Norton, K.; Norton, L.; Sadgrove, D. Position statement on physical activity and exercise intensity terminology. J. Sci. Med. Sport 2010, 13, 496–502. [Google Scholar] [CrossRef]
- Oswald, I. Sleep as a Restorative Process: Human Clues. Prog. Brain Res. 1980, 53, 279–288. [Google Scholar] [CrossRef]
- Edinborough, L.; Bruce-Low, S.; Hill, J.; Woodhouse, J.; Jarvis, M.; Pedlar, C. Day Type and Start Time May Influence Sleep in Adolescent Professional Football Players. Int. J. Sports Med. 2022, 44, 336–343. [Google Scholar] [CrossRef]
- Miller, D.J.; Sargent, C.; Roach, G.D.; Scanlan, A.T.; Vincent, G.E.; Lastella, M. Moderate-intensity exercise performed in the evening does not impair sleep in healthy males. Eur. J. Sport Sci. 2019, 20, 80–89. [Google Scholar] [CrossRef]
- Saidi, O.; Davenne, D.; Lehorgne, C.; Duché, P. Effects of timing of moderate exercise in the evening on sleep and subsequent dietary intake in lean, young, healthy adults: Randomized crossover study. Eur. J. Appl. Physiol. 2020, 120, 1551–1562. [Google Scholar] [CrossRef]
- Stutz, J.; Eiholzer, R.; Spengler, C.M. Effects of Evening Exercise on Sleep in Healthy Participants: A Systematic Review and Meta-Analysis. Sports Med. 2019, 49, 269–287. [Google Scholar] [CrossRef] [PubMed]
- Buxton, O.M.; L’Hermite-Balériaux, M.; Hirschfeld, U.; Cauter, E. Acute and Delayed Effects of Exercise on Human Melatonin Secretion. J. Biol. Rhythm. 1997, 12, 568–574. [Google Scholar] [CrossRef] [PubMed]
- Youngstedt, S.D. Does Exercise Truly Enhance Sleep? Physician Sportsmed. 2015, 25, 72–82. [Google Scholar] [CrossRef] [PubMed]
- Sateia, M.J. International Classification of Sleep Disorders-Third Edition. Chest 2014, 146, 1387–1394. [Google Scholar] [CrossRef]
- Schlarb, A.A.; Claßen, M.; Hellmann, S.M.; Vögele, C.; Gulewitsch, M.D. Sleep and somatic complaints in university students. J. Pain Res. 2017, 10, 1189–1199. [Google Scholar] [CrossRef] [Green Version]
- Duffield, T.C.; Lim, M.M.; Novak, M.; Lin, A.; Luther, M.; Williams, C.N.; Piantino, J. The relationship between depressive symptoms, somatic complaints, and concussion history with poor sleep in collegiate athletes. Sleep Health 2021, 7, 43–48. [Google Scholar] [CrossRef]
- Driller, M.W.; Dunican, I.C.; Omond, S.E.T.; Boukhris, O.; Stevenson, S.; Lambing, K.; Bender, A.M. Pyjamas, Polysomnography and Professional Athletes: The Role of Sleep Tracking Technology in Sport. Sports 2023, 11, 14. [Google Scholar] [CrossRef]


| Training Characteristics | Nights within Each Athlete | Number of Athletes Included in the Analysis | Overall Count of Nights Included in the Analysis |
|---|---|---|---|
| Training intensity | 2 | 33 | 66 |
| Training time | 2 | 22 | 44 |
| Number of trainings per day | 3 | 42 | 126 |
| Mdn (IQR) | ||
|---|---|---|
| Sleep quantity | time in bed (min) | 496.29 (472.38–519.72) |
| total sleep time (min) | 437.40 (414.25–458.58) | |
| sleep onset latency (min) | 21.29 (12.78–32.54) | |
| wake after sleep onset (min) | 41.00 (24.08–62.27) | |
| sleep efficiency (%) | 87.57 (84.46–91.58) | |
| Sleep architecture | percentage of light sleep (%) | 54.97 (51.87–59.07) |
| percentage of deep sleep (%) | 25.52 (21.96–28.53) | |
| percentage of REM sleep (%) | 18.80 (17.78–20.55) |
| Variable | M | SD | N | WTSP [min] | WAKE [min] | WASO [min] | LIGHT [%] | DEEP [%] | REM [%] | SE [%] | NOA 2 | SOL 5 [min] | TST [min] | Subj. SQ | Morning Condition | |
|---|---|---|---|---|---|---|---|---|---|---|---|---|---|---|---|---|
| D-MEQ | sum score | 43.49 | 7.42 | 50 | −0.416 ** | −0.338 * | −0.317 * | 0.366 ** | 0.375 ** | |||||||
| WAI-T | sum score | 19.75 | 4.83 | 51 | ||||||||||||
| somatic anxiety | 6.29 | 1.84 | 0.289 * | 0.288 * | 0.301 * | |||||||||||
| concentration deficits | 4.96 | 1.24 | ||||||||||||||
| worry | 6.73 | 2.77 | ||||||||||||||
| RESTQ | stress | 13.84 | 4.36 | 49 | −0.391 ** | −0.522 ** | −0.432 ** | −0.367 * | −0.337 * | |||||||
| fatigue | 1.48 | 0.93 | 0.325 * | −0.345 * | 0.341 * | 0.353 * | 0.353 * | −0.306 * | −0.306 * | |||||||
| recovery | 13.98 | 4.52 | 0.341 * | 0.547 ** | 0.453 ** | 0.449 ** | −0.313 * | −0.306 * | ||||||||
| sleep quality | 4.36 | 1.00 | 0.335 * | 0.286 * |
| Condition | Timing | Overall Count of Nights Included in the Analysis |
|---|---|---|
| Earliest training before bedtime per athlete | 7:30 a.m. | 3 |
| 3:00 p. m. | 11 | |
| 4:00 p.m. | 8 | |
| Latest training before bedtime per athlete | 4:00 p.m. | 14 |
| 4:15 p.m. | 8 |
Disclaimer/Publisher’s Note: The statements, opinions and data contained in all publications are solely those of the individual author(s) and contributor(s) and not of MDPI and/or the editor(s). MDPI and/or the editor(s) disclaim responsibility for any injury to people or property resulting from any ideas, methods, instructions or products referred to in the content. |
© 2023 by the authors. Licensee MDPI, Basel, Switzerland. This article is an open access article distributed under the terms and conditions of the Creative Commons Attribution (CC BY) license (https://creativecommons.org/licenses/by/4.0/).
Share and Cite
Frytz, P.; Heib, D.P.J.; Hoedlmoser, K. Soccer, Sleep, Repeat: Effects of Training Characteristics on Sleep Quantity and Sleep Architecture. Life 2023, 13, 1679. https://doi.org/10.3390/life13081679
Frytz P, Heib DPJ, Hoedlmoser K. Soccer, Sleep, Repeat: Effects of Training Characteristics on Sleep Quantity and Sleep Architecture. Life. 2023; 13(8):1679. https://doi.org/10.3390/life13081679
Chicago/Turabian StyleFrytz, Patricia, Dominik P. J. Heib, and Kerstin Hoedlmoser. 2023. "Soccer, Sleep, Repeat: Effects of Training Characteristics on Sleep Quantity and Sleep Architecture" Life 13, no. 8: 1679. https://doi.org/10.3390/life13081679