Article

Occurrence of Microplastics in Most Consumed Fruits and Vegetables from Turkey and Public Risk Assessment for Consumers

1
Department of Biology, Faculty of Science, Muğla Sıtkı Koçman University, Muğla 48000, Turkey
2
Department of Aquatic Sciences, Faculty of Fisheries, Muğla Sıtkı Koçman University, Muğla 48000, Turkey
*
Author to whom correspondence should be addressed.
Life 2023, 13(8), 1686; https://doi.org/10.3390/life13081686
Submission received: 23 June 2023 / Revised: 17 July 2023 / Accepted: 3 August 2023 / Published: 4 August 2023
(This article belongs to the Special Issue Update on Microplastics in the Food Chain)

Abstract

:
Microplastics are transferred to humans through the food chain by consuming food contaminated with microplastics. However, the knowledge about the risks of dietary exposure for humans to these particles is very limited. Moreover, only a few studies on microplastic pollution in fruit and vegetables have been carried on. Thus, this study aims to investigate the presence of microplastics in some of the most consumed fruits and vegetables (pear (Pyrus communis), apple (Malus domestica), tomato (Solanum lycopersicum), onion (Allium cepa), potatoes (Solanum tuberosum), and cucumber (Cucumis sativus)) from Turkey and to evaluate the potential risk for consumers. Fruits and vegetable samples were purchased from different markets and fruiterer (two of each) in Muğla province, Southwest of Turkey. Microplastic extraction processes were carried out on the edible parts of the samples. According to the results obtained, a total of 210 particles (2.9 ± 1.6 particle g−1) were detected in all samples. Any significant difference occurred among the different markets. The maximum average amount of microplastic was determined in tomato samples (3.63 ± 1.39 particle g−1). The highest microplastic intake was with tomato (398,520 particles individual−1 year−1 for Estimated Annual Intake (EAI) and Estimated Daily Intake (EDI) for children 68.24 particles kg−1 day−1). The occurrence of microplastics of big size, that are not allowed to pass by plant xylem transport, suggests that fresh vegetables and fruits can be contaminated with plastic, especially during the production phase, during agricultural activities and during the marketing process (transport to the market and purchasing process).

1. Introduction

Plastic is a range of polymer materials that, due to its light weight, durability, low cost, and low thermal conductivity, have been rapidly increasing in production and use in the last 50 years. Global plastic production is shaping increasing passing from an approximately 1.5 million tons in the 1950s [1] to 390.7 million tons in 2021 [2]. Although the ease of production and use of plastics is regarded as an advantage for humanity, the most important disadvantage in terms of environment is that they gain waste status after the end of their usage span [3]. Increasing population and consumption habits lead to the emergence of plastic waste in amounts that cannot cope. Due to the mismanagement of plastic waste, approximately one-third of them leakage into both terrestrial and aquatic ecosystems and pollute the environment [4]. As a result, over the past decade, plastic debris in both marine and freshwater systems has become an emerging issue [5]. Studies have revealed that almost 80% of marine litter is made up of plastics [6,7].
Plastics entering the ecosystem as waste is exposed to degradation as a result of the effect of natural processes and environmental factors (mechanical degradation such as wind and erosion, UV radiation, biological degradation, etc.) and decompose into smaller particles, and they are transported into the human metabolism by being involved in the food chain [8,9,10,11,12,13]. Thus, according to their size, plastics are categorized into two different categories: plastic materials with dimensions larger than 5 mm are defined as “Macroplastic”, whereas “small pieces of plastic between 0.1 µm and 5 mm in diameter” are defined as “Microplastic” [14,15,16,17,18,19,20,21,22].
Microplastics were first noted in North America as spherules in plankton tows along the coast of New England in the 1970s [23] and in a study conducted on the coast of New Zealand, it was revealed for the first time in 1977 that plastic waste was a source of pollutants [24]. Although plastics entered our lives about a century ago, the fact that they have increased enough to form litter islands in the oceans shows how serious the threat is [25]. Plastic particles found in marine and freshwater ecosystems can spread over a wide area, including currents and hydrodynamic processes in the aquatic environment, and terrestrial ecosystems due to their hydrophobic properties [8,26,27].
Entering ecosystems in this way, microplastics continue to decompose constantly and exist in every abiotic part of the ecosystem, and inevitably negatively affect the natural life cycle of all living groups (plants and animals) [28,29,30]. Microplastics can both bioaccumulate and be transported to the upper levels of the food chain by entering the structure of plants and animals [28,29,31,32,33]. In addition, microplastics can cause the concentration of other toxic pollutants to increase in natural ecosystems and the transport of microorganisms to distant regions due to the adsorption on surface areas [34,35]. There is an increased interest to understand the impacts of microplastics on natural ecosystems, as the impacts still remain poorly understood.
Due to its durability, easy formability and low cost compared to other raw materials [36], plastics have started to be used intensively in every field of industry, including agricultural activities. The most commonly used plastics in agricultural activities are basically Polyethylene (PE), Polypropylene (PP), Poly-vinyl chloride (PVC), Polyethylene Terephthalate (PET), and rarely Polycarbonate (PC) type plastics. All these plastics and their outputs (MPs) remain on the soil surface during or after agricultural production and may cause pollution. These plastics remaining on the soil surface, as in other ecosystems, decompose into smaller pieces due to many different physical and biological factors, turn into microplastics and infuse into the soil [37,38]. Impacts of MPs in terrestrial ecosystems can be related to the ingestion of particles by soil organisms causing harm to their growth, biosorption through the roots of plants and reproduction at different trophic levels of the food chain and to the total environment [39,40,41].
Microplastics are transferred to humans through the consumption of food contaminated with these particles [20,42]. Although it is well-known that some additives (Bisphenol A (BPA), Phthalates, Polybrominated diphenyl ethers, etc.) used in the production of plastics have harmful effects on humans [4,43], there is still limited information on the effects of microplastics to human health and their toxicity. Nevertheless, their occurrence in the human body was concerning and reported even in the placenta [44] and in blood [45]. Despite this, there is no international food standard limit yet determined for plastic contamination control. Hence, it is very important to investigate the presence of microplastics starting from the bottom of the food chain and to evaluate the possible risks on human health. To date, the occurrence of microplastics was mainly reported on seafood (e.g., mussels, fish, and zooplankton) [46,47,48,49]. However, many other land-based foods as well as processed food were found to be contaminated with microplastics [50,51,52,53,54,55]. One of the main sources of microplastics in food originates from plastic packaging materials that come into direct contact with food items during the production processing and marketing chain [56].
With regards to fruits and vegetables, to date, only a few studies aiming to investigate the occurrence of microplastics in these highly consumed healthy food items were carried out globally [57,58,59]. With regard to Turkey, this is the first study which reports the occurrence of microplastic in agricultural foods.
Thus, this study aimed to determine the occurrence of microplastic in some of the most consumed fruits and vegetables (tomato, cucumber, onion, potatoes, apple, and pear) in Turkey and purchased from different markets and fruiterer in Muğla (Turkey). A further aim was to assess the risk in terms of public health.

2. Materials and Methods

2.1. Study Area and Sampling

Muğla, located in the Southern Western of Turkey, is one of the most important centers of beekeeping and olive cultivation in the country. In addition, fruit farming (especially citrus and pomegranate) is also carried out in the region. Fruits (apple and pear) and vegetables (tomato, cucumber, onion, and potatoes) samples were purchased from different markets (2 markets and 2 fruiterer) located in Muğla. The purchase sites of the samples were named M1 = Market 1, M2 = Market 2, F1 = Fruiterer 1 and F2 = Fruiterer 2. A number of 3 samples for each product were purchased from each market and fruiterer (12 samples for each fruit and vegetable for a total of 72 samples). The samples were transported to the laboratory and stored under cold conditions (+4 °C) until further analyses.

2.2. Prevention of Contamination during the Laboratory Process

To prevent external contamination of samples during the laboratory process the following precautions were taken. Only cotton aprons were worn during the analyses. All laboratory equipment was rinsed with pre-filtered distilled water in order to remove possible particles inside and stored in a fume hood. All the doors and windows of the laboratory were kept closed during the analyses to prevent airborne contamination [60,61]. In addition to all these precautions, in order to evaluate the potential microplastic contamination that could occur during laboratory studies and can interfere with the results, 4 filter papers were left at different points of the laboratory during the analyses to detect airborne contamination. The time taken for the analysis of each sample during the laboratory study was calculated as approximately 40 min (±5 min). Thus, the amount of microplastics on the control filters were counted under a stereo microscope and were deduced from all the results obtained. The average number of microplastics detected on the control filters placed in different points of the laboratory, that could interfere in a 40 min period, airborne interferences calculated as <1 for each type or color and was considered irrelevant according to [62,63,64].

2.3. Extraction of Microplastics from Fruit and Vegetable Samples

Fruit and vegetable samples were rinsed thoroughly with pre-filtered distilled water, then peeled and sliced using a sterile stainless steel knife on the same day. Three samples of 1 gr were taken from each item (triplicate). After the sliced fruit and vegetable samples were placed in glass beakers, the mouths of the beakers were covered with aluminum foil. Then, the beakers were left to dry in an oven set at 60 °C for 24–48 h. The dried samples were pulverized using a sterilized steel-made blender. Given the lack of a standard international protocol in the literature for the extraction of microplastics from fruits and vegetables, the methods reported by [65] modified by [59] was applied in this study. Accordingly, 5 g of dried powdered fruit and vegetable samples were weighed and placed into glass centrifuge tubes with 50 mL capacity. A total of 20 mL of prefiltered distilled water was added to each tube and the samples were centrifuged at 2000 rotate per minute (rpm) for 15 min. The supernatant part of each centrifuged sample was taken and filtered with a vacuum pump through GF/F Whatman® filter papers (47 mm diameter and 0.7 µm pore size). Then, after adding 20 mL of sodium chloride (NaCl-Merck EMSURE®, Merck, Darmstadt, Germany) to the samples remaining in the centrifuge tube, they were centrifuged again at 2000 rpm for 15 min. Again, the supernatant of the centrifuged samples was taken and filtered through the same filter paper. A total of 20 mL of zinc chloride (ZnCl2-Merck EMSURE®, Germany) solution was added to the samples remaining in the centrifuge tubes. Then, these samples were centrifuged at 2000 rpm for 15 min and filtered through the same filter paper. This process was applied for all the fruit and vegetable samples. Each of the filter papers was placed in the Petri dishes separately, closed and left to dry at room temperature (23 °C).
Filter papers were examined under a stereo microscope (Leica®, Wetzlar, Germany) and the microplastics were counted and grouped according to their color, shape, and size. Microplastics were classified as red, blue, green, yellow, white, grey, black, and other in terms of color and as fragments, fibrils, film, and foam particles in terms of shape [66,67,68,69]. All the results were expressed as particles per gram (particle g−1).

2.4. SEM Analysis

HITACHI™ SU5000 field emission scanning electron microscope (FE-SEM) (HITACHI™, Tokyo, Japan), was used for the surfaces analysis of the microplastics for a subsample of the filters. The samples were dried for 24 h and then transferred to a stub and coated with gold sputtering to make it conductive. The surface of the sample was scanned with an Energy Dispersive Spectroscopy (EDS) detector (Oxford X-MaxN 80 mm2 detector, Oxford Instruments, Abingdon, UK) at 15 kV [70,71].

2.5. Polymers Characterization by ATR-FTIR

Polymer characterization of microplastics was carried out by using Attenuated Total Reflection Fourier Transform Infrared Spectroscopy (ATR-FTIR Thermo Scientific™ Nicolet iS10, Thermo Fisher Scientific, Waltham, MA, USA). Plastic particles were randomly selected from a subsample of the analyzed filters and carefully placed into a Petri plate using steel forceps and then processed by ATR-FTIR.

2.6. Risk Assessment

Estimated Daily Intake (EDI) values for each fruit and vegetable were calculated with the formula below [72,73].
EDI = (C × IR)/BW,
where:
C: Mean number of microplastics per gram detected in sample tissue (items kg−1 day−1)
IR: The Daily Ingestion Rate per capita for pear (0.01 kg day−1), apple (0.09 kg day−1), tomato (0.30 kg day−1), onion (0.06 kg day−1), potatoes (0.14 kg day−1), and cucumber (0.05 kg day−1) in Turkey [74].
BW: Body weight 70 kg for adults and 16 kg for children [75].
Estimated Annual Intake (EAI) values of microplastics based on the consumption of fruit and vegetables were calculated using the following equation [49,76,77,78].
EAI = C × AIR,
where:
C: Average number of microplastics detected per gram in fruit and vegetable tissues (particle g−1)
AIR: Annual Ingestion Rate per capita for pear (5202.5 g year−1), apple (31,166.6 g year−1), tomato (110,700.0 g year−1), onion (21,100.0 g year−1), potatoes (51,300.0 g year−1), and cucumber (18,500.0 g year−1) [74].
AIR per capita was calculated by dividing the amount of food item consumed in Turkey by the population (Population of Turkey: 83,614,362 [74]).

2.7. Statistical Analysis

All data were first gathered in Excel. Thus, all statistical analyses were accomplished using StatSoft® Statistica STAT 10.0 software. This software is an integrated data analysis, graphics, featuring analytic procedures for science applications. First, the basic descriptive statistics (mean, minimum, maximum, and standard deviation) was calculated for each group (in term of the vegetable item, purchase site, color, shapes and size). Appropriate sample size and power calculation were previously determined using the G*Power 3.1 software using a large effect size (f = 0.40; α = 0.05, power = 0.7). Then, a comparison in the amount of microplastics among samples, among different purchase sites, in terms of color, shapes and size was accomplished by applying one-way analysis of variance (ANOVA). Hence, when the differences among the groups resulted significant, the significance of differences between pairs of group means was tested by post-hoc Tukey test A level of p < 0.05 was considered significant for all the analyses.

3. Results

3.1. Classification of Microplastic in Terms of Abundance

A total of 210 microplastics (average 2.9 ± 1.6 particles g−1) were detected in all samples (n = 72). The mean microplastics occurrence in the different products according to the purchase sites is presented in Table 1.
The maximum amount of microplastics was determined as 44 in tomato samples, followed by cucumber (43 particles), pear (38 particles), apple (37 particles), onion (31 particles), and potatoes (17 particles). Statistically significant differences were determined between potato and tomato (p = 0.007) and between potato and cucumber (p = 0.009) (Figure 1).
Considering the different markets, the maximum amount of microplastic was detected in M1 (54 particles), followed by F1 (53 particles), F2 (52 particles), and M2 (51 particles), respectively. No statistical difference was determined between markets and fruiteries (p > 0.05).
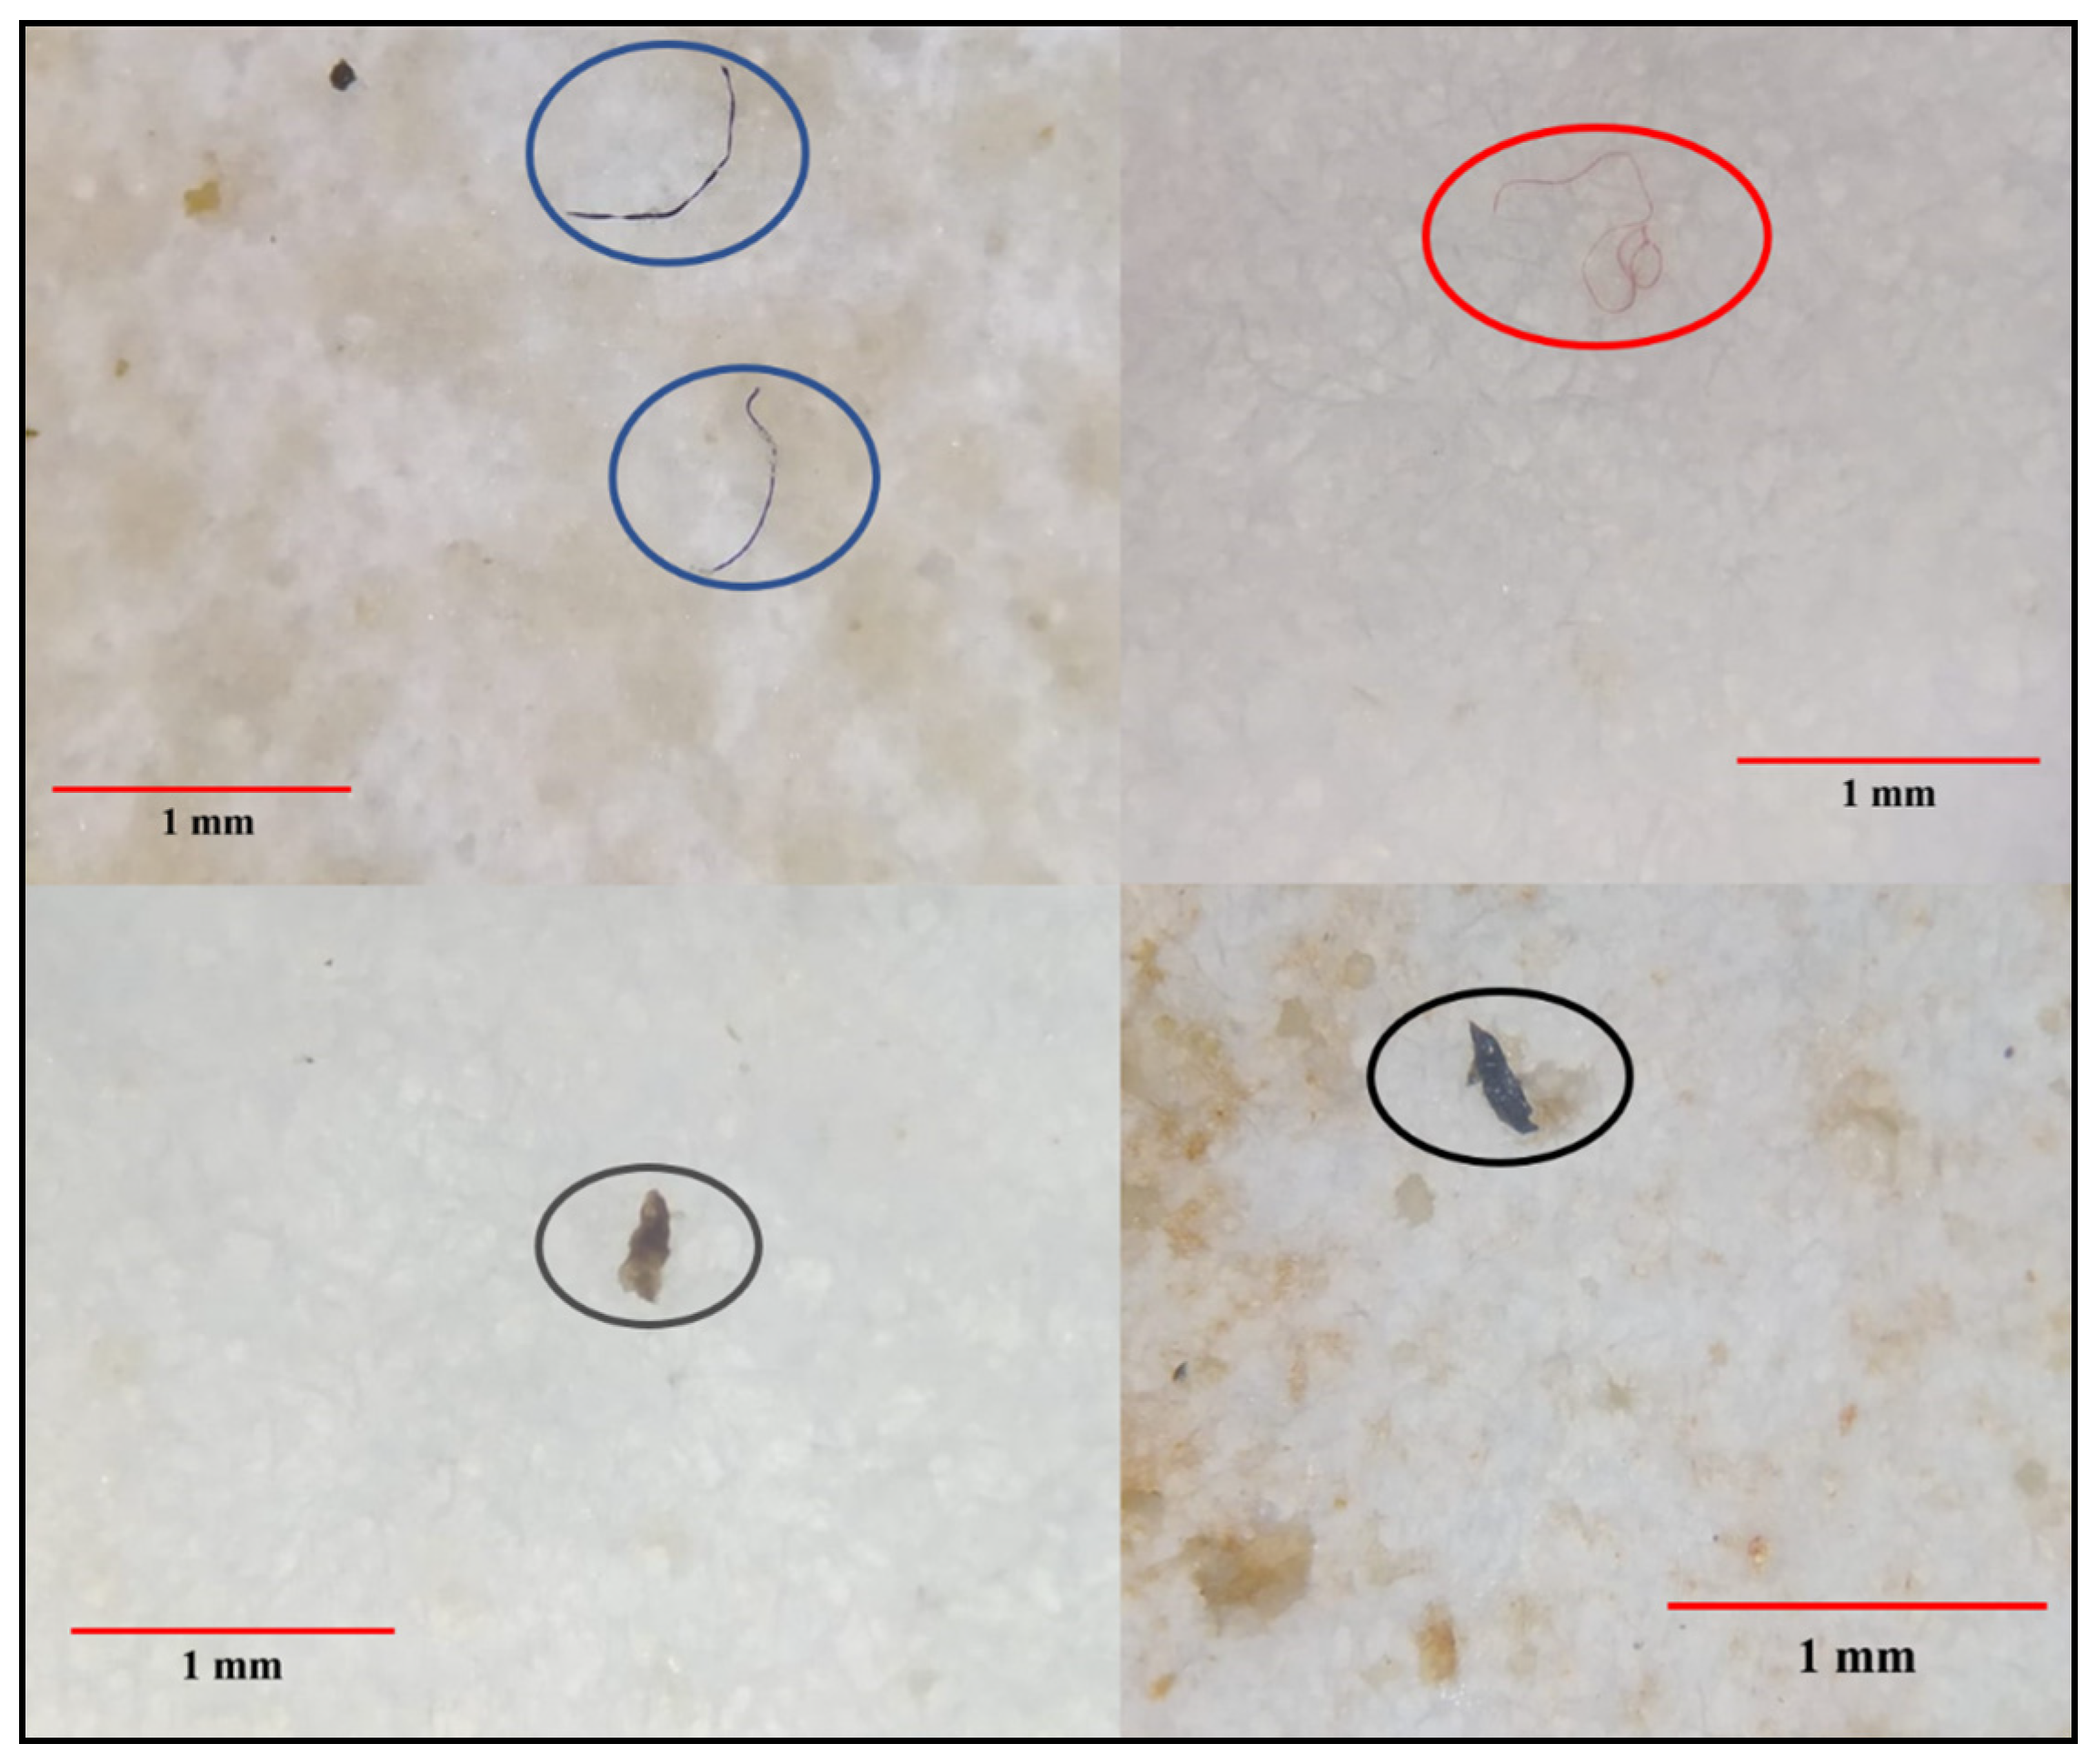
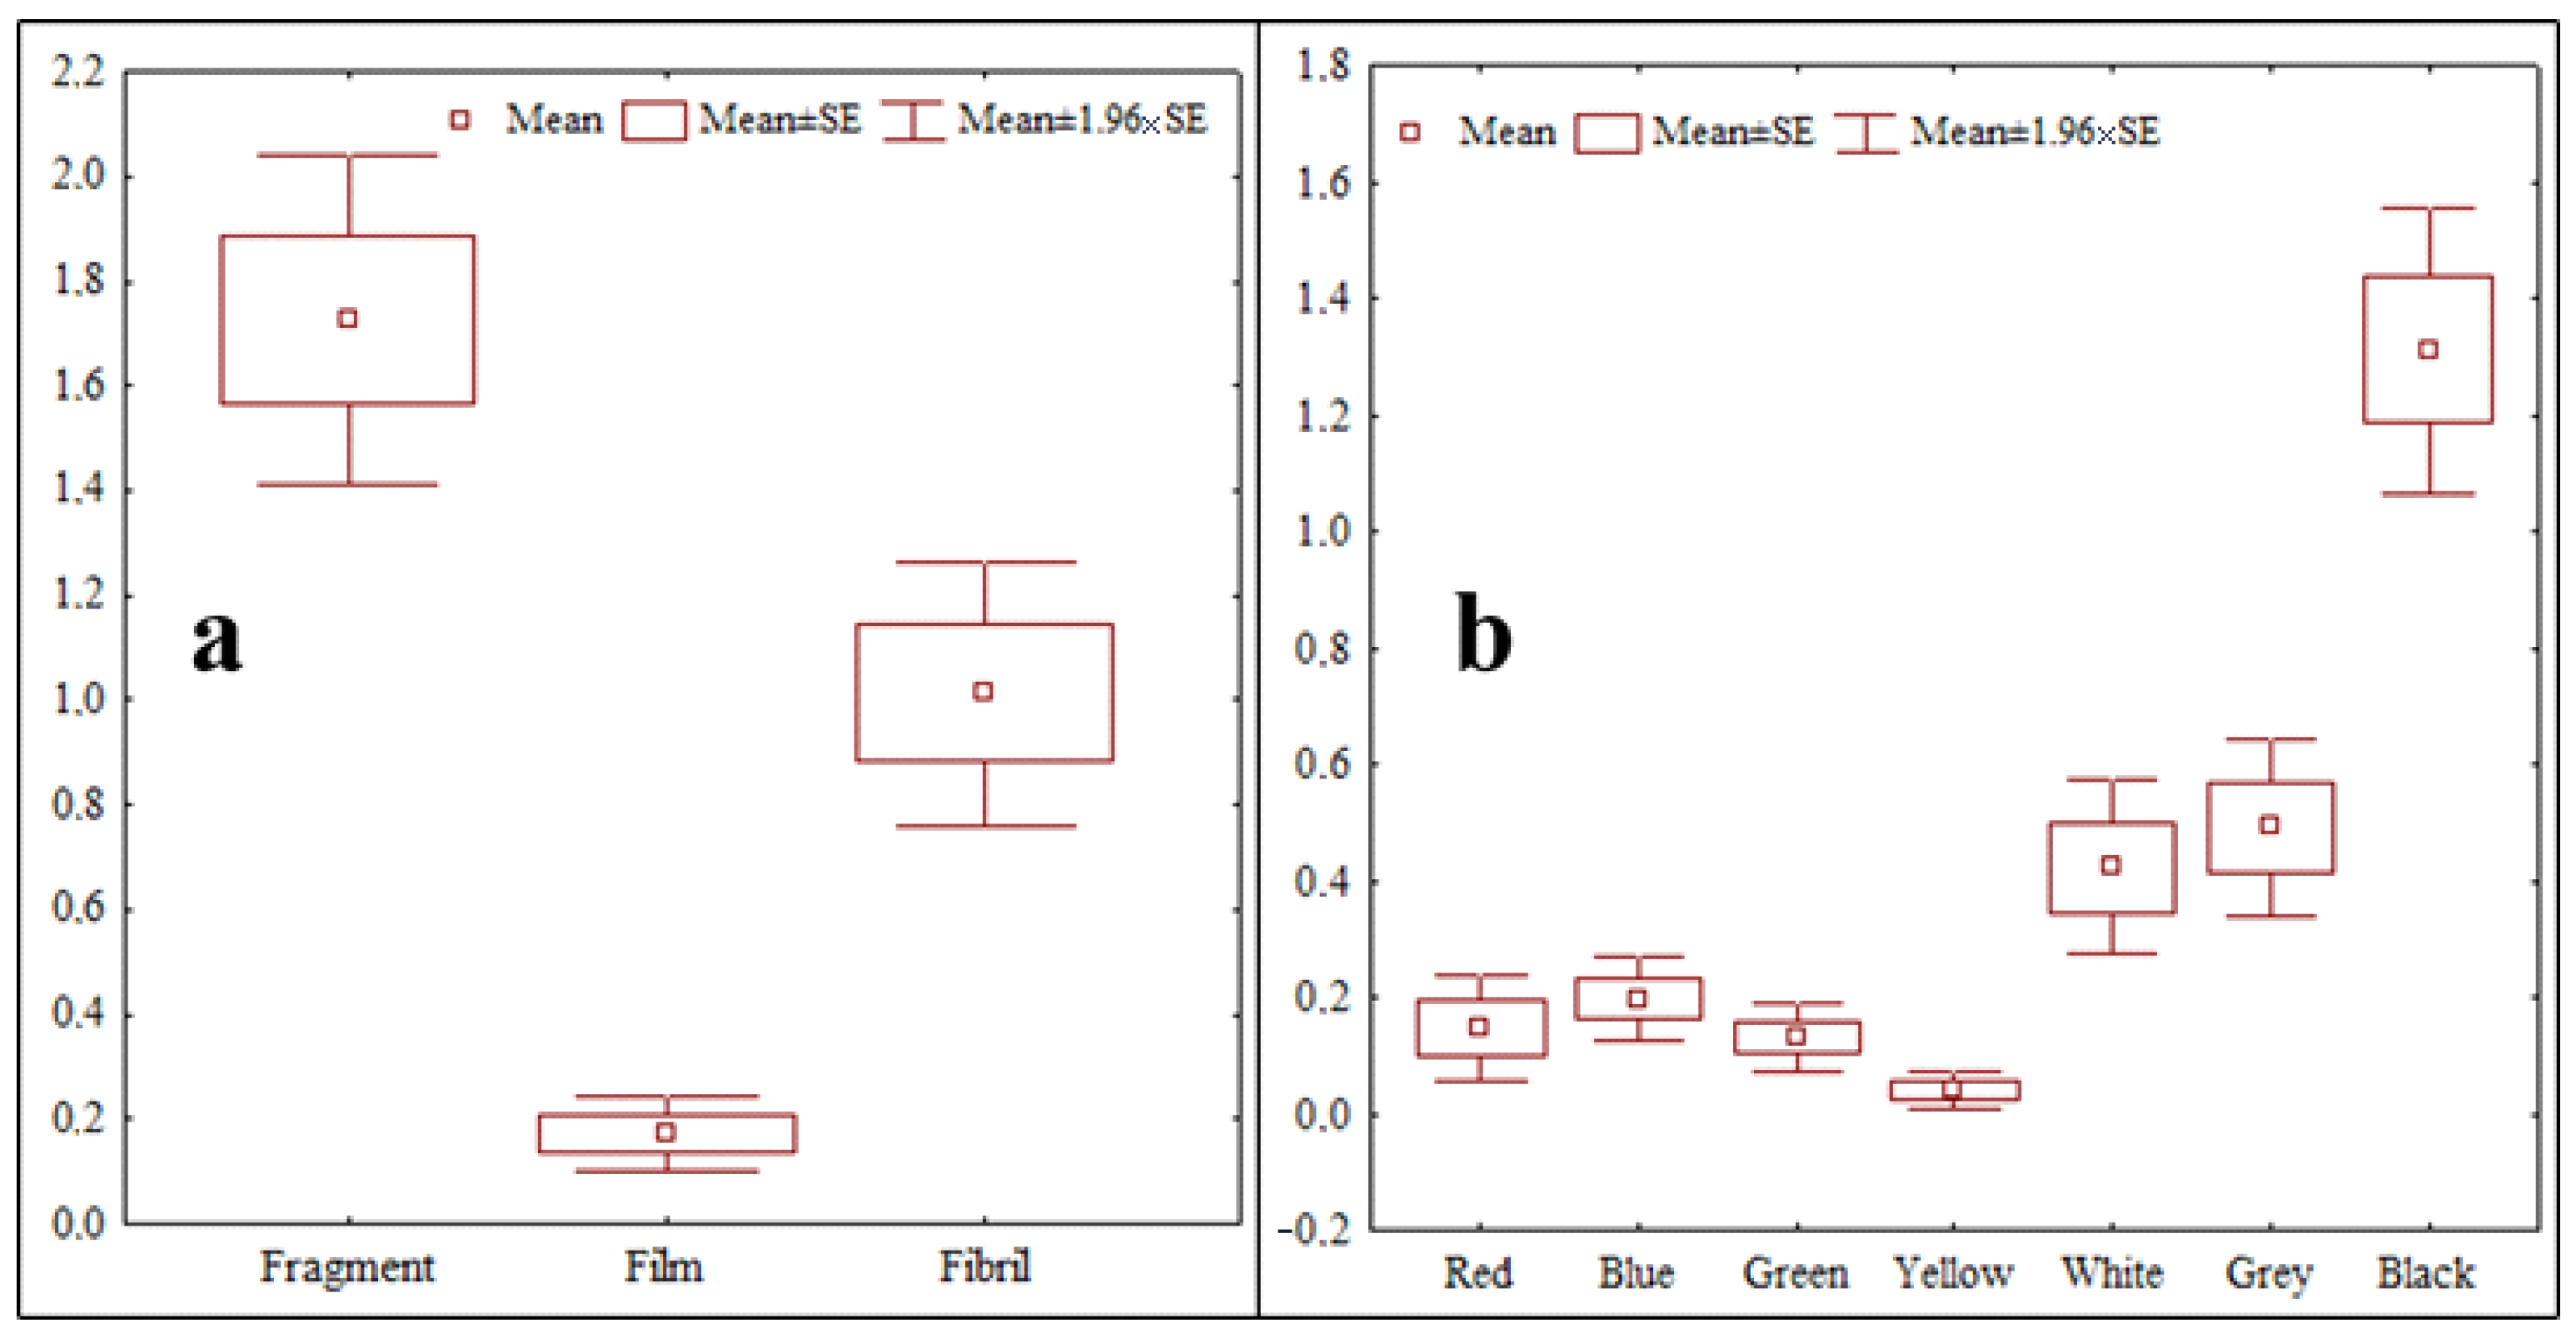
The occurrence of microplastics in the fruits and vegetables samples in terms of color, shape, and size according to purchase sites is presented in Table S1 of the Supplementary Materials. A total of 59.3% of all microplastics were fragments followed by fibril (34.8%) and film (5.9%), respectively (Figure 2).
Statistically significant differences were determined between different shapes of microplastic (p < 0.05) (Figure 3a). Black colored microplastics were the dominant group (45.5% of samples), followed by grey (17.9%), white (16.5%), blue (7.8%), red (6.1%), green (4.5%), and yellow (1.7%), respectively. Statistically significant differences were determined between black-colored microplastics and all other color groups (p < 0.05) (Figure 3b). Microplastics in the 0.1 µm–1 mm size group were significantly more numerous (rate of 86.1%) than those of the 1–5 mm size group (p < 0.05).
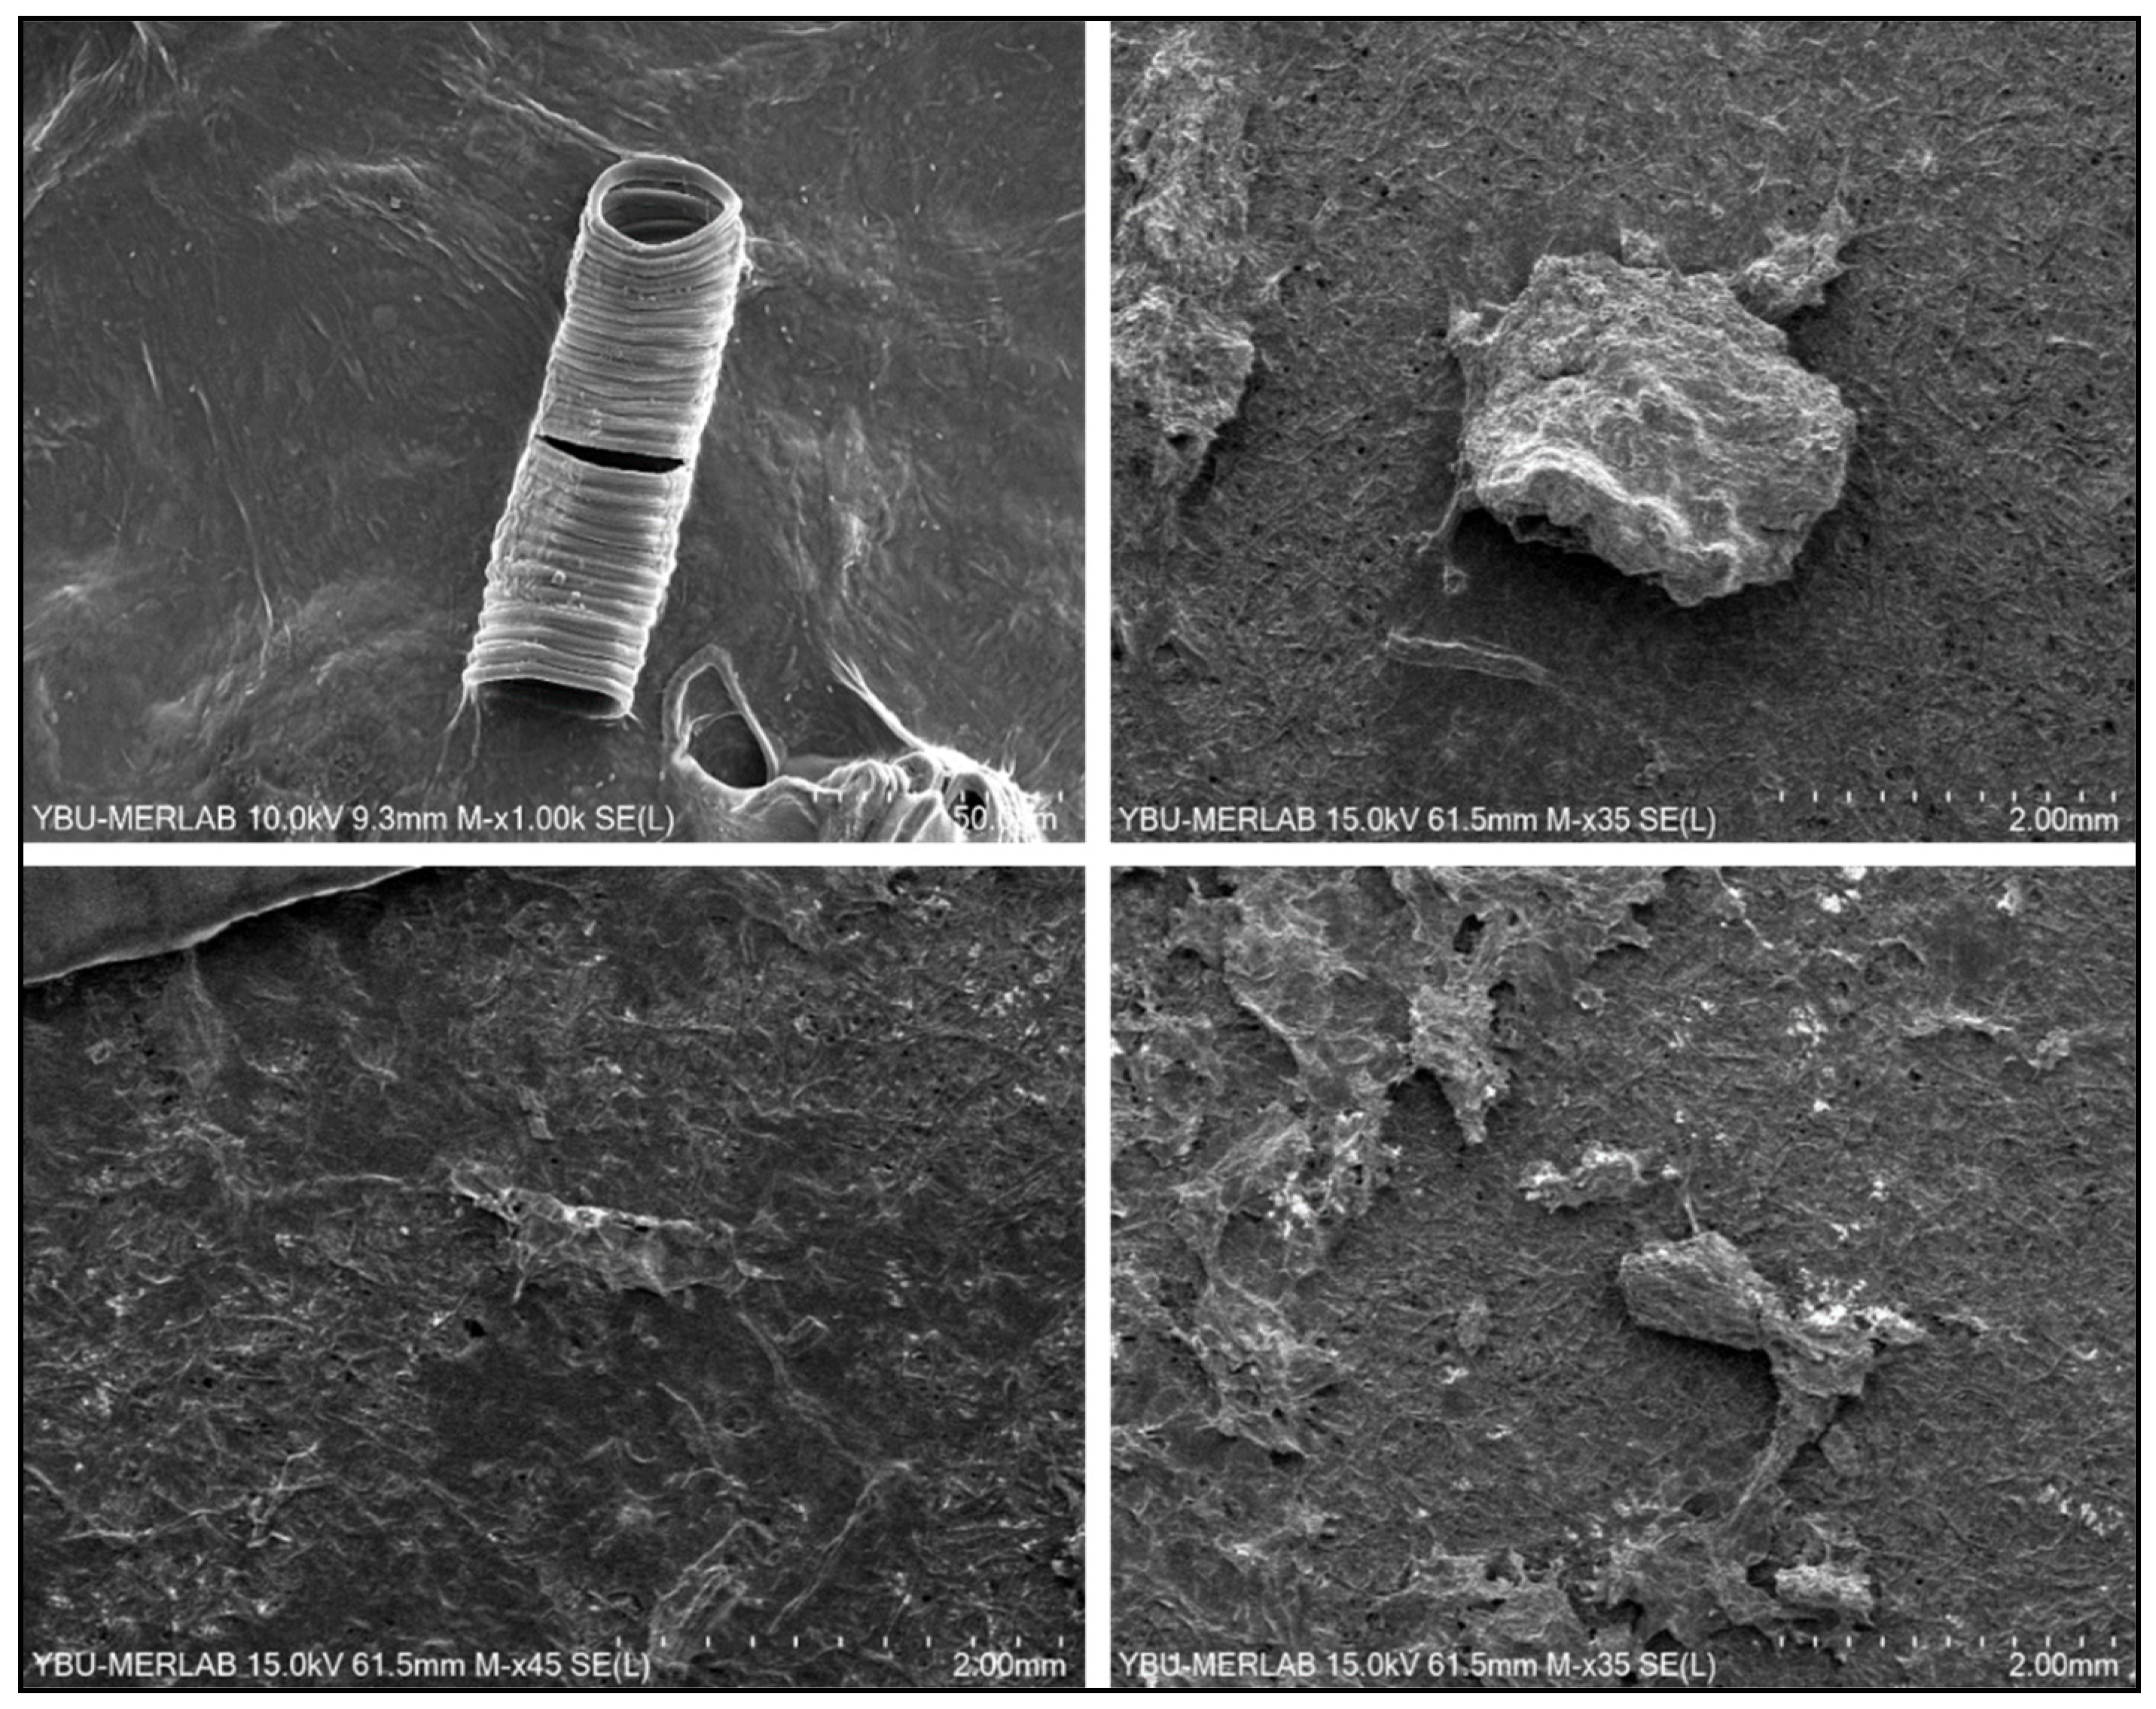
Magnified images of the microplastics detected in the analysed samples by SEM-EDS are reported in Figure 4.
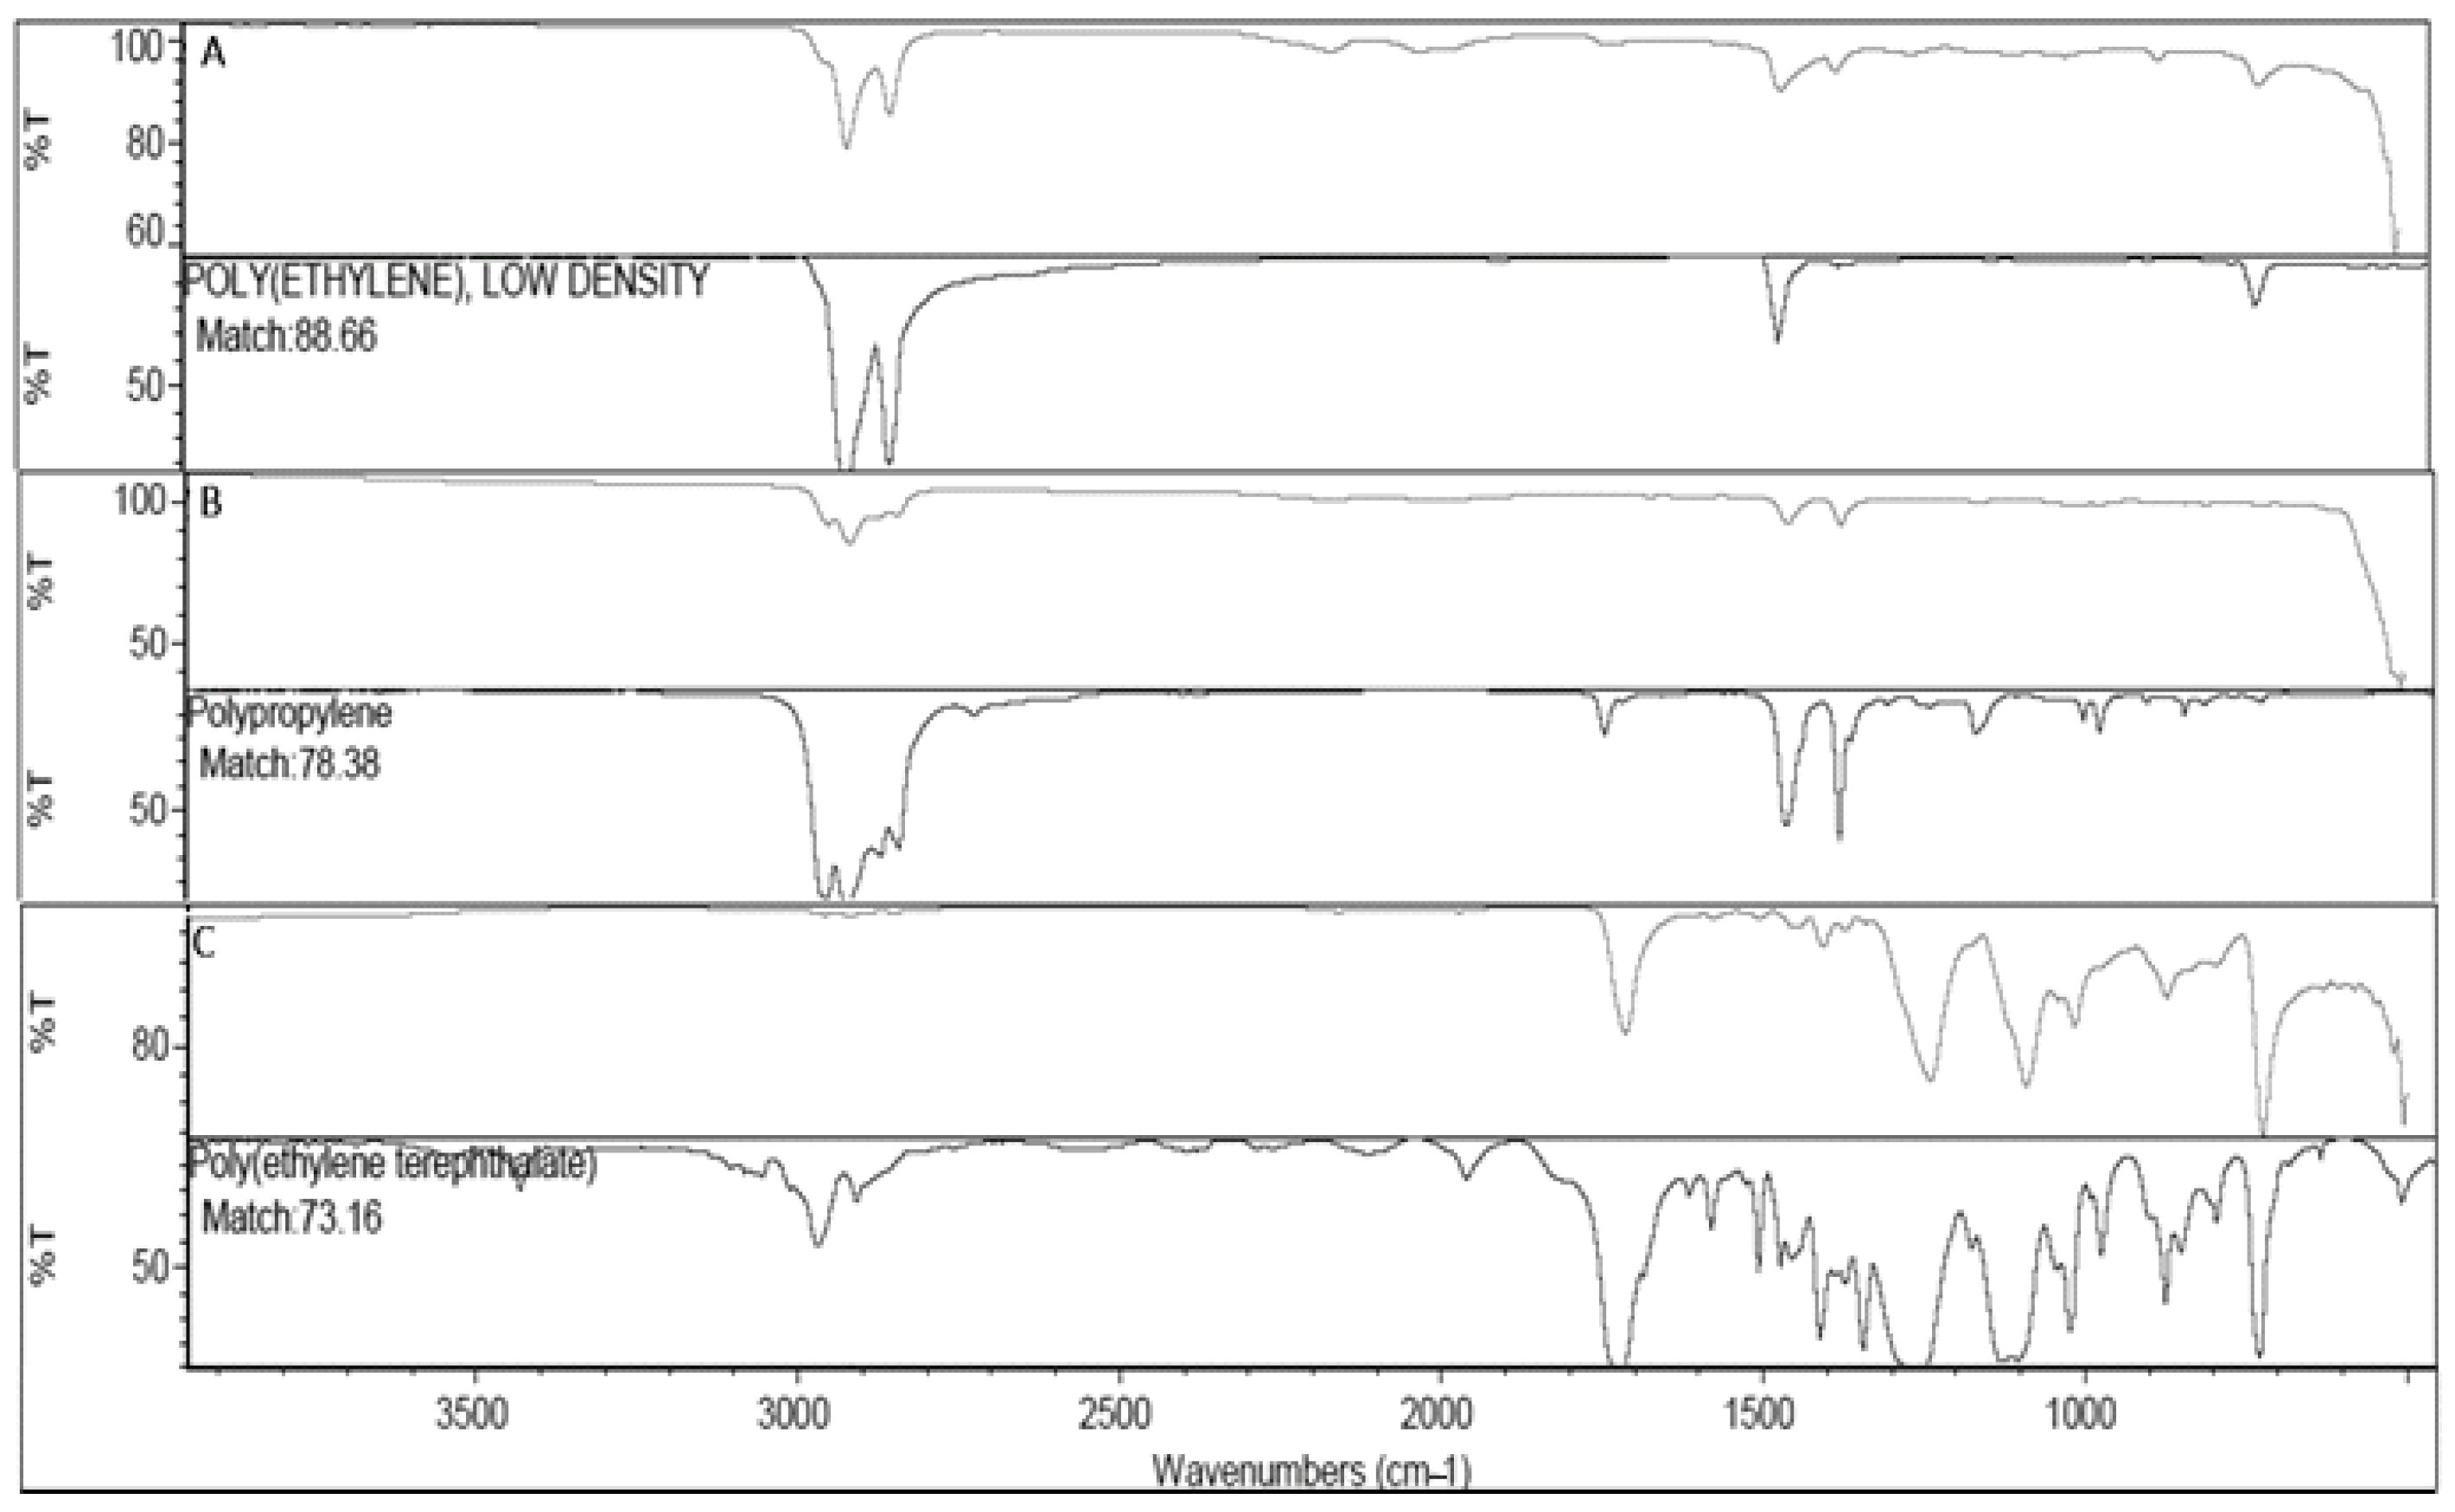
The polymers characterization by ATR-FTIR revealed the highest matchings with three main polymers: Polyethylene low density (PE) (in 60% of the samples; best match 88.66% and 79.47% avg.), Polypropylene (PP) (in 20% of the samples; best match 78.38% and 71.46% avg.) and Polyethylene terephthalate (PET) (in 20% of the samples; best match 73.16% and 70.02% avg.) (Figure 5).

3.2. Risk Assessment

According to risk analysis results, the highest EAI was determined in tomato samples as 398,520 particles individual−1 year−1. This was followed by apples, potatoes, cucumber, onion, and pears, respectively (Table 2). According to the results of EDI calculations, children ingest more microplastics through the consumption of fruits and vegetables than adults. The highest daily intake was found to be 68.24 particles kg−1 day−1 for children followed by adults (15.60 particles kg−1 day−1) in tomato. With the consumption of 1 portion of 100 gr tomato, 6.8 particles (17.1 particles per 250 g portion) for children and 1.6 particles (3.9 particles per 250 g portion) for adults could enter the digestive system daily. Moreover, in the report published by [46], it is recommended to consume 400 g of fruits and vegetables daily. When tomatoes (the product with the highest amount of microplastics determined in the current study) are consumed in the amount recommended by [79], 2.76 particles for children, and 6.24 particles for adults can enter the digestive tract daily.

4. Discussion

It is well-recognized that microplastics are present in every environment constituting the biosphere and, accordingly, environmental pollution from micro- and nano-plastics has become an emerging problem. Plastics, which gain waste status after their usage is completed, may enter many urban and rural areas and, consequently, the soil where agricultural activities take place may be polluted. Microplastics can also reach agricultural areas (wastewater treatment plants, irrigation water, and atmospheric precipitation) directly or indirectly through the degradation of plastics used in agricultural activities [38,80,81]. This contamination in the soil naturally affects the fruits and vegetables grown in this environment. Many studies have reported that microplastics can move vertically deeper than the soil surface in various ways, such as farming activities, rhizome harvesting (e.g., potatoes, carrots), and cracks in the soil surface caused by dry climate [80,82,83,84]. Microplastics detected in fruits and vegetables may reach the plants through various factors during the cultivation of the crops. Microplastics reaching deep from the soil surface can be transported to various plant parts such as leaves, stems, and fruits after being accumulated in the roots [85,86,87]. Nevertheless, it is possible only for the particle of small size able to pass through the xylem.
The current study investigated the possible MP pollution in the most consumed fruits and vegetables (pear, apple, tomato, onion, potato, and cucumber) in Turkey and evaluated the potential risk deriving from their consumption in terms of public health. To this aim, samples of some of the most consumed fruits and vegetables in Turkey (pear, apple, tomato, onion, potato, and cucumber) were purchased from four different markets and fruiterer in Muğla province. A total of 210 microplastics (average 2.9 ± 1.6 particles g−1) were detected in all samples (n = 72). The average microplastic number detected in fruits per gram was apple 3.1 ± 1.2 and pear 3.1 ± 1.3. The average occurrence in vegetables per gram were tomato 3.6 ± 1.4, cucumber 3.6 ± 1.8, onion 2.6 ± 1.5, and potato 1.5 ± 1.6. Since there are a few studies on the presence of microplastics in agricultural areas and especially their accumulation in fruits and vegetables, the results obtained from the current study could be compared only with a limited number of studies [57], investigating the accumulation of nano and microplastics in the edible parts of different fruits and vegetables (apple, pear, broccoli, lettuce, and carrot) purchased in different markets in Catania (Italy), reported that the nano- and microplastic amounts was: 2.0 × 10⁵ ± 1.3 × 10⁵ in apple, 1.9 × 10⁵ ± 1.1 × 10⁵ in pear, 1.3 × 10⁵ ± 0.8 × 10⁵ in broccoli, 5.1 × 10⁴ ± 2.5 × 10⁴ in lettuce, and 1.0 × 10⁵ ± 0.4 × 10⁵ in carrot. The results reported by [57] substantially higher than the findings of this current study because, together with microplastics, they also investigated the possible accumulation of nanoplastics in the edible tissues of examined fruits and vegetables. While 86.1% of microplastics detected in our study are in the 0.1–1000 µm size group (the other group’s size is larger), the average size of the plastic particles detected in [57] ranged from 1.51 to 2.52 µm. Ref. [59] analyzed the presence of microplastics in fruits (grapes and banana) and vegetables (brinjal and potato) samples taken from different markets in Trichy, Tamil Nadu (India) and reported the occurrence of microplastics of 2 and 10 µm size in fruits and 2 and 10 µm size in vegetables, respectively. Ref. [58] detected 1 μm and 0.2 μm sized polystyrene (PS) microplastics in carrot roots and leaves, respectively. All these studies showed that humans can be directly exposed to microplastics through fresh fruits and vegetables.
Although our knowledge about the interference of microplastics from soil to different tissues of plants is still limited, transpiration pull has a significant role in plant uptake and bioaccumulation of plastic particles [85,88]. Experimental studies in fully controlled environments have proven that plants can carry nanoscale (<100 nm), submicrometer (<1 μm), and micro-sized (≥1 μm) plastics from their roots to their leaves [38,58,89,90,91]. Ref. [41] stated that plastic particles entered the epidermal tissue of wheat roots and are stimulated via the pericycle and transported into the xylem. They also reported that the particles could pass through the xylem to the aerial part of the plant. In addition, Ref. [91] reported that after the accumulation of microplastics in the root of cucumber, they could be transported to leaves, flowers, and fruits through the stems. However, in almost all of these studies on translocation of microplastics, nanoscale plastics (<100 nm) were primarily examined, while micro-sized plastics (1 or 2 μm) remained in the roots. In the current study, plastics were counted under the microscope and classified according to their size and color. Although 86.1% of the plastics detected were in the range of 0.1–1000 µm, these measurements were made on only visible particles. This is one of the limitations of the current study. Previous studies showed that in such measurements made with the naked eye using a microscope, particles below certain sizes could not be distinguished from each other and even could not be seen. For instance, Ref. [92] stated that sizes below 500 µm cannot be distinguished and classified in the counts made with the naked eye under the microscope. Also, Ref. [93] emphasized that it was problematic for the human eye to identify microplastics with a size of 200 µm under the microscope. In this sense, although the plastics detected in this study were determined as 0.1–1000 µm by definition, they were particles closer to 1 mm in size and it is impossible that particles of this size could reach the plant tissues from the soil by direct absorption. Previous studies showed that micro- and nano-plastics could adhere to the leaves of plants. In a previous study, a solution containing 100 and 500 nm (average particle size of micronanoplastics’ (MNP) 105.53 ± 3 nm and 532.06 ± 26 nm, respectively) polystyrene microplastics were sprayed onto lettuce leaves in the growing stage. Leaves were then subjected to multiple washings and after microplastics treatment, a large amount of these particles accumulated on the lettuce leaves were still detected on the tissues [94].
Considering the polymer characterization, the most dominant group determined as a result of the FTIR analysis in the current study was PE (60%) followed by PP and PET (20% and 20%, respectively). Plastic-based materials are commonly used in packaging, transportation, storage, and exhibit, especially in markets, which are among the suppliers for food products to reach the end consumer, and PE and PP are the most commonly used plastic types [95]. Plastic packaging is an important method for keeping fruits and vegetables fresh and store them to the consumers fresh as they have been harvested from the field. For example, the most effective storage conditions for the fruits and vegetables used in this study are polyethylene bags, plastic, polystyrene, cardboard trays, polyethylene, or polypropylene flow wrapping for apples, polyethylene bags for potatoes, plastic punnets covered in film or flow wrapping for tomatoes [96], PP non-perforated packaging for pears, PE bags and net bags for onions [97], and shrink-wrapped plastic packaging for cucumbers [98]. Thus, petroleum-derived plastic materials are used extensively in all of these storage conditions. Contamination of food items from plastic packaging has been already reported by [99] investigating food delivery and disposable plastic cups for daily drinking. Thus, it is highly possible that the plastic particles eroded from the packaging materials contaminate the stored fruits and vegetables: the soft surface of the examined vegetable (such as tomatoes or cucumbers) can be easily damaged by physical impact with the packaging during transport. Considering the size of the particles detected in the edible parts of fruits and vegetables in the current study, it is highly likely that microplastics reached the sample tissues as a result of contamination during the storage processes instead of relocation from the plant’s transport system.
With regard to the risk assessments, it was determined that children are more exposed to microplastics due to their higher rate of consumption of fruits and vegetables. The tolerable daily intake (TDI) for plastics has not yet been determined. Therefore, it is not possible to determine whether this level of exposure complies with regulations. However, in the report published by [100], in order to see the worst-case scenario in terms of public health risk assessment, it is stated that one portion (250 g) can contain up to 1000 microplastic particles considering the highest reported concentration of microplastics (4 particles g−1) in mussels. All the EAI and EDI values determined in the current study are much lower than this upper limit. However, it may pose a risk to human health as there is no tolerable limit value for plastics. Ref. [57] reported that the maximum EDI values for children and adults for apple samples (1.41 × 10⁶ particles kg day−1 for children, 4.62 × 10⁵ particles kg day−1 for adults) whereas EDI values for pear samples were 1.37 × 10⁶ particles kg day−1 for children and 4.48 × 10⁵ particles kg day−1 for adults. As mentioned above, the discrepancy between the results of that study and the current can be due to the calculation of both nano- and microplastic numbers in their study. Ref. [101] reported the EDI values for microplastics in mineral waters in plastic bottles as 1.5 × 10⁶ p−1 kg−1 body-weight−1 day−1 and 3.4 × 10⁶ p−1 kg−1 body-weight−1 day−1 for adults and children, respectively. These results are much higher than the EDI values found in the current study (Table 2).

5. Conclusions

This study reveals the presence of microplastics in the edible parts of the mostly consumed fresh vegetables and fruits in the Turkish market. Although the analyzed samples were collected only from a single region, the study represents the first reference for Turkey and one of the few available studies focusing on the occurrence of microplastics in vegetables and fruits. The occurrence of microplastics of big size, that are not allowed to pass by xylem transport, suggests that fresh vegetables and fruits can be contaminated with plastic, especially during the production phase, during agricultural activities (greenhouses, plastic crates, additive fertilizers, etc.) and during the marketing process (transport to the market and purchasing process). Nevertheless, in nutritional diets recommended for healthy eating all over the world (especially the World Health Organization’s (WHO) Mediterranean diet) at least 400 g of fruits and vegetables must be consumed every day to maintain good health [102,103]. Nonetheless, it would be a mistake to ignore this serious food safety issue due to the lack of information on how much microplastics are emitted, whether by conventional, integrated or organic means. Therefore, it is extremely important to monitor the quality of fruits and vegetables and identify and minimize the potential sources of contamination that can occur during the food supply chain. Considering the broad presence of microplastics and the lack of certain regulations, the development of standard methodologies for fruits and vegetables is highly suggested.

Supplementary Materials

The following supporting information can be downloaded at: https://www.mdpi.com/article/10.3390/life13081686/s1. Table S1: The abundance of microplastics in the examined samples of fruits and vegetables in terms of shape, color, and size by purchase sites (mean ± SD particles g−1).

Author Contributions

Conceptualization, R.B.A., D.G. and A.Y.; methodology, A.Y. and İ.Ş.; formal analysis, R.B.A., D.G. and F.T.; investigation R.B.A., D.G. and F.T.; data curation, R.B.A. and D.G.; writing—original draft preparation, D.G., A.Y. and İ.Ş.; writing—review and editing, A.Y. and D.G.; funding acquisition, R.B.A. and D.G. All authors have read and agreed to the published version of the manuscript.

Funding

This research was partially funded by the Scientific and Technological Research Council of Turkey (TÜBİTAK) within the 2209-A—Research Project Support Program for Undergraduate Students.

Institutional Review Board Statement

Not applicable.

Informed Consent Statement

Not applicable.

Data Availability Statement

The data used during the current study are available from the corresponding author on a reasonable request.

Acknowledgments

The authors would like to thank Nisan Yozukmaz (Pamukkale University, Turkey) for the English editing of the text.

Conflicts of Interest

The authors declare no conflict of interest.

References

  1. PlasticsEurope. The Compelling Facts about Plastics 2007: An Analysis of Plastics Production, Demand and Recovery for 2007 in Europe. Available online: https://plasticseurope.org/wp-content/uploads/2021/10/2007-Compelling-facts.pdf (accessed on 25 March 2023).
  2. PlasticEurope. Plastics—The Facts 2022: An Analysis of European Plastics Production, Demand and Waste Data. Available online: https://plasticseurope.org/wp-content/uploads/2023/03/PE-PLASTICS-THE-FACTS_FINAL_DIGITAL-5.pdf (accessed on 25 March 2023).
  3. Kısacık, H. Depozıto and plastic bag fee applications: Accountıng process. Bus. Manag. Stud. Int. J. 2019, 7, 183. [Google Scholar]
  4. de Wit, W.; Hamilton, A.; Scheer, R.; Stakes, T.; Allan, S. Solving plastic pollution through accountability. WWF Plast. Rep. 2019, 25, 6–46. [Google Scholar]
  5. Jambeck, J.R.; Geyer, R.; Wilcox, C.; Siegler, T.R.; Perryman, M.; Andrady, A.; Narayan, R.; Law, K.L. Marine pollution. Plastic waste inputs from land into the ocean. Science 2015, 347, 768–771. [Google Scholar] [CrossRef]
  6. Galgani, F.; Fleet, D.; Van Franeker, J.A.; Katsanevakis, S.; Maes, T.; Mouat, J.; Janssen, C. Marine Strategy Framework Directive-Task Group 10 Report Marine Litter; Office for Official Publications of the European Communities: Luxembourg, 2010. [Google Scholar]
  7. Güven, O.; Gökdağ, K.; Jovanović, B.; Kıdeyş, A.E. Microplastic litter composition of the Turkish territorial waters of the Mediterranean Sea, and its occurrence in the gastrointestinal tract of fish. Environ. Pollut. 2017, 223, 286–294. [Google Scholar] [CrossRef] [PubMed]
  8. Ng, K.L.; Obbard, J.P. Prevalence of microplastics in Singapore’s coastal marine environment. Mar. Pollut. Bull. 2006, 52, 761–767. [Google Scholar] [CrossRef]
  9. Fendall, L.S.; Sewell, M.A. Contributing to marine pollution by washing your face: Microplastics in facial cleansers. Mar. Pollut. Bull. 2009, 58, 1225–1228. [Google Scholar] [CrossRef]
  10. Cole, M.; Lindeque, P.; Halsband, C.; Galloway, T.S. Microplastics as contaminants in the marine environment: A review. Mar. Pollut. Bull. 2011, 62, 2588–2597. [Google Scholar] [CrossRef]
  11. Auta, H.S.; Emenike, C.U.; Fauziah, S.H. Screening of Bacillus strains isolated from mangrove ecosystems in Peninsular Malaysia for microplastic degradation. Environ. Pollut. 2017, 231, 1552–1559. [Google Scholar] [CrossRef] [PubMed]
  12. Efimova, I.; Bagaeva, M.; Bagaev, A.; Kileso, A.; Chubarenko, I.P. Secondary microplastics generation in the sea swash zone with coarse bottom sediments: Laboratory experiments. Front. Mar. Sci. 2018, 5, 313. [Google Scholar] [CrossRef]
  13. Kazour, M.; Jemaa, S.; Issa, C.; Khalaf, G.; Amara, R. Microplastics pollution along the Lebanese coast (Eastern Mediterranean Basin): Occurrence in surface water, sediments and biota samples. Sci. Total Environ. 2019, 696, 133933. [Google Scholar] [CrossRef]
  14. Thompson, R.C.; Olsen, Y.; Mitchell, R.P.; Davis, A.; Rowland, S.J.; John, A.W.; Russell, A.E. Lost at sea: Where is all the plastic? Science 2004, 304, 838. [Google Scholar] [CrossRef] [PubMed]
  15. Arthur, C.; Baker, J.E.; Bamford, H.A. Proceedings of the International Research Workshop on the Occurrence, Effects, and Fate of Microplastic Marine Debris; NOAA Technical Memorandum NOS-OR & R-30; University of Washington Tacoma: Tacoma, WA, USA, 2008. [Google Scholar]
  16. Thompson, R.C.; Moore, C.J.; Vom Saal, F.S.; Swan, S.H. Plastics, the environment and human health: Current consensus and future trends. Philos. Trans. R. Soc. B Biol. Sci. 2009, 364, 2153–2166. [Google Scholar] [CrossRef]
  17. Barnes, D.K.; Galgani, F.; Thompson, R.C.; Barlaz, M. Accumulation and fragmentation of plastic debris in global environments. Philos. Trans. R. Soc. 2009, 364, 1985–1998. [Google Scholar] [CrossRef]
  18. GESAMP. Sources, fate and effects of microplastics in the marine environment: A global assessment. In Reports and Studies-IMO/FAO/Unesco-IOC/WMO/IAEA/UN/UNEP Joint Group of Experts on the Scientific Aspects of Marine Environmental Protection (GESAMP) Eng No. 93; Kershaw, P.J., Ed.; International Maritime Organization: London, UK, 2015; Volume 90, 96p. [Google Scholar]
  19. Masura, J.; Baker, J.; Foster, G.; Arthur, C.; Herring, C. Laboratory Methods for the Analysis of Microplastics in the Marine Environment: Recommendations for Quantifying Synthetic Particles in Waters and Sediments; NOAA Technical Memorandum NOS-OR&R-48; NOAA Marine Debris Division: Silver Spring, MD, USA, 2015; 31p. [Google Scholar]
  20. EFSA CONTAM Panel (EFSA Panel on Contaminants in the Food Chain). Statement on the presence of microplastics and nanoplastics in food, with particular focus on seafood. EFSA J. 2016, 14, 4501. [Google Scholar] [CrossRef]
  21. Lusher, A.; Hollman, P.; Mendoza-Hill, J. Microplastics in Fisheries and Aquaculture: Status of Knowledge on Their Occurrence and Implications for Aquatic Organisms and Food Safety; FAO: Rome, Italy, 2017; Volume 615, 147p. [Google Scholar]
  22. Lebreton, L.; Egger, M.; Slat, B. A global mass budget for positively buoyant macroplastic debris in the ocean. Sci. Rep. 2019, 9, 1–10. [Google Scholar] [CrossRef]
  23. Carpenter, E.J.; Anderson, S.J.; Harvey, G.R.; Miklas, H.P.; Peck, B.B. Polystyrene spherules in coastal waters. Science 1972, 17, 749–750. Available online: http://links.jstor.org/sici?sici=0036-8075%2819721117%293%3A178%3A4062%3C749%3APSICW%3E2.0.CO%3B2-E (accessed on 14 June 2023). [CrossRef] [PubMed]
  24. Gregory, M.R. Plastic pellets on New Zealand beaches. Mar. Pollut. Bull. 1977, 8, 82–84. [Google Scholar] [CrossRef]
  25. Hidalgo-Ruz, V.; Gutow, L.; Thompson, R.C.; Thiel, M. Microplastics in the marine environment: A review of the methods used for identification and quantification. Environ. Sci. Technol. 2012, 46, 3060–3075. [Google Scholar] [CrossRef]
  26. Borrelle, S.B.; Ringma, J.; Law, K.L.; Monnahan, C.C.; Lebreton, L.; McGivern, A.; Rochman, C.M. Predicted growth in plastic waste exceeds efforts to mitigate plastic pollution. Science 2020, 369, 1515–1518. [Google Scholar] [CrossRef]
  27. Horton, A.A.; Barnes, D.K. Microplastic pollution in a rapidly changing world: Implications for remote and vulnerable marine ecosystems. Sci. Total Environ. 2020, 738, 140349. [Google Scholar] [CrossRef]
  28. Boerger, C.M.; Lattin, G.L.; Moore, S.L.; Moore, C.J. Plastic ingestion by planktivorous fishes in the North Pacific Central Gyre. Mar. Pollut. Bull. 2010, 60, 2275–2278. [Google Scholar] [CrossRef]
  29. Van Cauwenberghe, L.; Janssen, C.R. Microplastics in bivalves cultured for human consumption. Environ. Pollut. 2014, 193, 65–70. [Google Scholar] [CrossRef]
  30. Hu, D.; Shen, M.; Zhang, Y.; Li, H.; Zeng, G. Microplastics and nanoplastics: Would they affect global biodiversity change? Environ. Sci. Pollut. Res. 2019, 26, 19997–20002. [Google Scholar] [CrossRef] [PubMed]
  31. Teuten, E.L.; Saquing, J.M.; Knappe, D.R.; Barlaz, M.A.; Jonsson, S.; Björn, A.; Takada, H. Transport and release of chemicals from plastics to the environment and to wildlife. Philos. Trans. R. Soc. B Biol. Sci. 2009, 364, 2027–2045. [Google Scholar] [CrossRef] [PubMed]
  32. Andrady, A.L. Microplastics in the marine environment. Mar. Pollut. Bull. 2011, 62, 1596–1605. [Google Scholar] [CrossRef] [PubMed]
  33. Fossi, M.C.; Panti, C.; Guerranti, C.; Coppola, D.; Giannetti, M.; Marsili, L.; Minutoli, R. Are baleen whales exposed to the threat of microplastics? A case study of the Mediterranean fin whale (Balaenoptera physalus). Mar. Pollut. Bull. 2012, 64, 2374–2379. [Google Scholar] [CrossRef]
  34. Mammo, F.K.; Amoah, I.D.; Gani, K.M.; Pillay, M.; Ratha, S.K.; Bux, F.; Kumari, S. Microplastics in the environment: Interactions with microbes and chemical contaminants. Sci. Total Environ. 2020, 743, 140518. [Google Scholar] [CrossRef] [PubMed]
  35. Gregory, M.R. Environmental implications of plastic debris in marine settings—Entanglement, ingestion, smothering, hangers-on, hitch-hiking and alien invasions. Philos. Trans. R. Soc. B Biol. Sci. 2009, 364, 2013–2025. [Google Scholar] [CrossRef]
  36. Derraik, J.G. The pollution of the marine environment by plastic debris: A review. Mar. Pollut. Bull. 2002, 44, 842–852. [Google Scholar] [CrossRef] [PubMed]
  37. He, D.; Luo, Y.; Lu, S.; Liu, M.; Song, Y.; Lei, L. Microplastics in soils: Analytical methods, pollution characteristics and ecological risks. TrAC Trends Anal. Chem. 2018, 109, 163–172. [Google Scholar] [CrossRef]
  38. Li, J.; Song, Y.; Cai, Y. Focus topics on microplastics in soil: Analytical methods, occurrence, transport, and ecological risks. Environ. Pollut. 2020, 257, 113570. [Google Scholar] [CrossRef]
  39. Rillig, M.C. Microplastic in terrestrial ecosystems and the soil? Environ. Sci. Technol. 2012, 46, 6453–6454. [Google Scholar] [CrossRef]
  40. Rillig, M.C.; Lehmann, A.; Souza Machado, A.A.; Yang, G. Microplastic effects on plants. New Phytol. 2019, 223, 1066–1070. [Google Scholar] [CrossRef] [PubMed]
  41. Li, L.; Luo, Y.; Li, R.; Zhou, Q.; Peijnenburg, W.J.; Yin, N.; Yang, J.; Tu, C.; Zhang, Y. Effective uptake of submicrometre plastics by crop plants via a crack-entry mode. Nat. Sustain. 2020, 3, 929–937. [Google Scholar] [CrossRef]
  42. Karbalaei, S.; Hanachi, P.; Walker, T.R.; Cole, M. Occurrence, sources, human health impacts and mitigation of microplastic pollution. Environ. Sci. Pollut. Res. 2018, 25, 36046–36063. [Google Scholar] [CrossRef] [PubMed]
  43. Meeker, J.D.; Sathyanarayana, S.; Swan, S.H. Phthalates and other additives in plastics: Human exposure and associated health outcomes. Philos. Trans. R. Soc. 2009, 364, 2097–2113. [Google Scholar] [CrossRef]
  44. Ragusa, A.; Svelato, A.; Santacroce, C.; Catalona, P.; Notarstefano, V.; Carnevali, O.; Papa, F.; Rongioletti, M.C.A.; Baiocco, F.; Draghi, S.; et al. Plasticenta: First evidence of microplastics in human placenta. Environ. Int. 2021, 146, 106274. [Google Scholar] [CrossRef]
  45. Leslie, H.A.; van Velzen, M.J.; Brandsma, S.H.; Vethaak, A.D.; Garcia-Vallejo, J.J.; Lamoree, M.H. Discovery and quantification of plastic particle pollution in human blood. Environ. Int. 2022, 163, 107199. [Google Scholar] [CrossRef]
  46. Rochman, C.M.; Tahir, A.; Williams, S.L.; Baxa, D.V.; Lam, R.; Miller, J.T.; Teh, F.C.; Werorilangi, S.; Teh, S.J. Anthropogenic debris in seafood: Plastic debris and fibers from textiles in fish and bivalves sold for human consumption. Sci. Rep. 2015, 5, 14340. [Google Scholar] [CrossRef] [PubMed]
  47. Akoueson, F.; Sheldon, L.M.; Danopoulos, E.; Morris, S.; Hotten, J.; Chapman, E.; Li, J.; Rotchell, J.M. A preliminary analysis of microplastics in edible versus non-edible tissues from seafood samples. Environ. Pollut. 2020, 263, 114452. [Google Scholar] [CrossRef]
  48. Rashid, C.P.; Jyothibabu, R.; Arunpandi, N.; Abhijith, V.T.; Josna, M.P.; Vidhya, V.; Gupta, G.V.M.; Ramanamurty, M.V. Microplastics in zooplankton in the eastern Arabian Sea: The threats they pose to fish and corals favoured by coastal currents. Mar. Pollut. Bull. 2021, 173, 113042. [Google Scholar] [CrossRef] [PubMed]
  49. Yozukmaz, A. Investigation of microplastics in edible wild mussels from İzmir Bay (Aegean Sea, Western Turkey): A risk assessment for the consumers. Mar. Pollut. Bull. 2021, 171, 112733. [Google Scholar] [CrossRef] [PubMed]
  50. Liebezeit, G.; Liebezeit, E. Non-pollen particulates in honey and sugar. Food Addit. Contam. 2013, 30, 2136–2140. [Google Scholar] [CrossRef]
  51. Liebezeit, G.; Liebezeit, E. Synthetic particles as contaminants in German beers. Food Addit. Contam. 2014, 31, 1574–1578. [Google Scholar] [CrossRef]
  52. Bouwmeester, H.; Hollman, P.C.H.; Peters, R.J.B. Potential health impact of environmentally released micro-and nanoplastics in the human food production chain: Experiences from nanotoxicology. Environ. Sci. Technol. 2015, 49, 8932–8947. [Google Scholar] [CrossRef] [PubMed]
  53. Yang, D.; Shi, H.; Li, L.; Li, J.; Jabeen, K.; Kolandhasamy, P. Microplastic pollution in table salts from China. Environ. Sci. Technol. 2015, 49, 13622–13627. [Google Scholar] [CrossRef] [PubMed]
  54. Hernandez, L.M.; Xu, E.G.; Larsson, H.C.E.; Tahara, R.; Maisuria, V.B.; Tufenkji, N. Plastic teabags release billions of microparticles and nanoparticles into tea. Environ. Sci. Technol. 2019, 53, 12300–12310. [Google Scholar] [CrossRef] [PubMed]
  55. Know, J.H.; Kim, J.W.; Pham, T.D.; Tarafdar, A.; Hong, S.; Chun, S.H.; Lee, S.H.; Kang, D.Y.; Kim, J.Y.; Kim, S.B.; et al. Microplastics in food: A review on analytical methods and challenges. Int. J. Environ. Health Res. 2020, 17, 6710. [Google Scholar]
  56. Mei, T.; Wang, J.; Xiao, X.; Lv, J.; Li, Q.; Dai, H.; Liu, X.; Pi, F. Identification and Evaluation of Microplastics from Tea Filter Bags Based on Raman Imaging. Foods 2022, 11, 2871. [Google Scholar] [CrossRef]
  57. Conti, G.O.; Ferrante, M.; Banni, M.; Favara, C.; Nicolosi, I.; Cristaldi, A.; Fiore, M.; Zuccarello, P. Micro-and nano-plastics in edible fruit and vegetables. The first diet risks assessment for the general population. Environ. Res. 2020, 187, 109677. [Google Scholar] [CrossRef]
  58. Dong, Y.; Gao, M.; Qiu, W.; Song, Z. Uptake of microplastics by carrots in presence of As (III): Combined toxic effects. J. Hazard. Mater. 2021, 411, 125055. [Google Scholar] [CrossRef] [PubMed]
  59. Rajendran, K.; Rajendiran, R.; Pasupathi, M.S.; Ahamed, S.B.N.; Kalyanasundaram, P.; Velu, R.K. Authentication of Microplastic Accumulation in Customary Fruits and Vegetables. Preprint 2022, 1–12. [Google Scholar] [CrossRef]
  60. Torre, M.; Digka, N.; Anastasopoulou, A.; Tsangaris, C.; Mytilineou, C. Anthropogenic microfibres pollution in marine biota. A new and simple methodology to minimize airborne contamination. Mar. Pollut. Bull. 2016, 113, 55–61. [Google Scholar] [CrossRef]
  61. Crawford, C.B.; Quinn, B. Microplastic collection techniques. In Microplastic Pollutants, 1st ed.; Elsevier Limited: Amsterdam, The Netherland, 2017; pp. 179–202. [Google Scholar] [CrossRef]
  62. Lusher, A.L.; Burke, A.; O’Connor, I.; Officer, R. Microplastic pollution in the Northeast Atlantic Ocean: Validated and opportunistic sampling. Mar. Pollut. Bull. 2014, 88, 325–333. [Google Scholar] [CrossRef]
  63. Catarino, A.I.; Thompson, R.; Sanderson, W.; Henry, T.B. Development and optimization of a standard method for extraction of microplastics in mussels by enzyme digestion of soft tissues. Environ. Toxicol. Chem. 2017, 36, 947–951. [Google Scholar] [CrossRef] [PubMed]
  64. La Daana, K.K.; Officer, R.; Lyashevska, O.; Thompson, R.C.; O’Connor, I. Microplastic abundance, distribution and composition along a latitudinal gradient in the Atlantic Ocean. Mar. Pollut. Bull. 2017, 115, 307–314. [Google Scholar]
  65. Corradini, F.; Meza, P.; Eguiluz, R.; Casado, F.; Huerta-Lwanga, E.; Geissen, V. Evidence of microplastic accumulation in agricultural soils from sewage sludge disposal. Sci. Total Environ. 2019, 671, 411–420. [Google Scholar] [CrossRef]
  66. Nuelle, M.T.; Dekiff, J.H.; Remy, D.; Fries, E. A new analytical approach for monitoring microplastics in marine sediments. Environ. Pollut. 2014, 184, 161–169. [Google Scholar] [CrossRef]
  67. Lots, F.A.; Behrens, P.; Vijver, M.G.; Horton, A.A.; Bosker, T. A large-scale investigation of microplastic contamination: Abundance and characteristics of microplastics in European beach sediment. Mar. Pollut. Bull. 2017, 123, 219–226. [Google Scholar] [CrossRef]
  68. Avio, G.; Gorbi, S.; Regoli, F. Experimental development of a new protocol for extraction and characterization of microplastics in fish tissues: First observations in commercial species from Adriatic Sea. Mar. Environ. Res. 2015, 111, 18–26. [Google Scholar] [CrossRef]
  69. Garcia, A.G.; Suárez, D.C.; Li, J.; Rotchell, J.M. A comparison of microplastic contamination in freshwater fish from natural and farmed sources. Environ. Sci. Pollut. Res. 2021, 28, 14488–14497. [Google Scholar] [CrossRef] [PubMed]
  70. Ding, J.; Li, J.; Sun, C.; Jiang, F.; Ju, P.; Qu, L.; Qu, L.; Zheng, Y.; He, C. Detection of microplastics in local marine organisms using a multi-technology system. Anal. Methods 2019, 11, 78–87. [Google Scholar] [CrossRef]
  71. Anuar, S.T.; Abdullah, N.S.; Yahya, N.K.E.; Chin, T.T.; Yusoff, K.M.K.K.; Mohamad, Y.; Azmi, A.A.; Jaafar, M.; Mohammad, N.; Khalik, W.M.A.W.M.; et al. A multidimensional approach for microplastics monitoring in two major tropical river basins, Malaysia. Environ. Res. 2023, 227, 115717. [Google Scholar] [CrossRef] [PubMed]
  72. USEPA. Guidance For Assessing Chemical Contamination Data for Use in Fish Advisories: Volume II Risk Assessment and Fish Consumption Limits, 3rd ed.; U.S. Environmental Protection Agency: Washington, DC, USA, 2000; 383p.
  73. Lin, Q.; Zhao, S.; Pang, L.; Sun, C.; Chen, L.; Li, F. Potential risk of microplastics in processed foods: Preliminary risk assessment concerning polymer types, abundance, and human exposure of microplastics. Ecotoxicol. Environ. Saf. 2022, 247, 114260. [Google Scholar] [CrossRef]
  74. TURKSTAT. Address Based Population Registration System Results; Turkish Statistical Institute: Ankara, Turkey, 2020.
  75. Copat, C.; Vinceti, M.; D’Agati, M.G.; Arena, G.; Mauceri, V.; Grasso, A.; Fallico, R.; Sciacca, S.; Ferrante, M. Mercury and selenium intake by seafood from the Ionian Sea: A risk evaluation. Ecotoxicol. Environ. Saf. 2014, 100, 87–92. [Google Scholar] [CrossRef]
  76. Wakkaf, T.; El Zrelli, R.; Kedzierski, M.; Balti, R.; Shaiek, M.; Mansour, L.; Tlig-Zouari, S.; Bruzaud, S.; Rabaoui, L. Microplastics in edible mussels from a southern Mediterranean lagoon: Preliminary results on seawater-mussel transfer and implications for environmental protection and seafood safety. Mar. Pollut. Bull. 2020, 158, 111355. [Google Scholar] [CrossRef] [PubMed]
  77. Akhbarizadeh, R.; Dobaradaran, S.; Nabipour, I.; Tajbakhsh, S.; Darabi, A.H.; Spitz, J. Abundance, composition, and potential intake of microplastics in canned fish. Mar. Pollut. Bull. 2020, 160, 111633. [Google Scholar] [CrossRef] [PubMed]
  78. Barboza, L.G.A.; Lopes, C.; Oliveira, P.; Bessa, F.; Otero, V.; Henriques, B.; Raimundo, J.; Caetano, M.; Vale, C.; Guilhermino, L. Microplastics in wild fish from North East Atlantic Ocean and its potential for causing neurotoxic effects, lipid oxidative damage, and human health risks associated with ingestion exposure. Sci. Total Environ. 2020, 717, 134625. [Google Scholar] [CrossRef]
  79. World Health Organization (WHO). Diet, Nutrition and the Prevention of Chronic Diseases: Report of a Joint WHO/FAO Expert Consultation; WHO Technical Report Series, No. 916; WHO: Geneva, Switzerland, 2003; 149p. [Google Scholar]
  80. Ng, E.L.; Huerta Lwanga, E.; Eldridge, S.M.; Johnston, P.; Hu, H.W.; Geissen, V.; Chen, D. An overview of microplastic and nanoplastic pollution in agroecosystems. Sci. Total Environ. 2018, 627, 1377–1388. [Google Scholar] [CrossRef]
  81. Campanale, C.; Galafassi, S.; Savino, I.; Massarelli, C.; Ancona, V.; Volta, P.; Uricchio, V.F. Microplastics pollution in the terrestrial environments: Poorly known diffuse sources and implications for plants. Sci. Total Environ. 2022, 805, 150431. [Google Scholar] [CrossRef]
  82. Rilling, M.C.; Ingraffia, R.; de Souza Machado, A.A. Microplastic incorporation into soil in agroecosystems. Front. Plant Sci. 2017, 8, 1805. [Google Scholar] [CrossRef] [PubMed]
  83. O’Conner, D.; Pan, S.; Shen, Z.; Song, Y.; Jin, Y.; Wu, W.M.; Hou, D. Microplastics undergo accelerated vertical migration in sand soil due to small size and wet-dry cycles. Environ. Pollut. 2019, 249, 527–534. [Google Scholar] [CrossRef] [PubMed]
  84. Zhou, Y.; Wang, J.; Zou, M.; Jia, Z.; Zhou, S.; Li, Y. Microplastics in soils: A review of methods, occurrence, fate, transport, ecological and environmental risks. Sci. Total Environ. 2020, 748, 141368. [Google Scholar] [CrossRef] [PubMed]
  85. Azeem, I.; Adeel, M.; Ahmad, M.A.; Shakoor, N.; Jiangcuo, G.D.; Azeem, K.; Ishfaq, M.; Shakoor, A.; Ayaz, M.; Xu, M.; et al. Uptake and accumulation of nano/microplastics in plants: A critical review. Nanomaterials 2021, 11, 2935. [Google Scholar] [CrossRef]
  86. Gan, Q.; Cui, J.; Jin, B. Environmental microplastics: Classification, sources, fates, and effects on plants. Chemosphere 2022, 313, 137559. [Google Scholar] [CrossRef]
  87. Sharma, U.; Sharma, S.; Rana, V.S.; Rana, N.; Kumar, V.; Sharma, S.; Qadri, H.; Kumar, V.; Bhat, S.A. Assessment of microplastics pollution on soil health and eco-toxicological risk in horticulture. Soil Syst. 2023, 7, 7. [Google Scholar] [CrossRef]
  88. Li, L.; Zhou, Q.; Yin, N.; Tu, C.; Luo, Y. Uptake and accumulation of microplastics in an edible plant. Sci. Bull. 2019, 64, 928–934. [Google Scholar] [CrossRef]
  89. Lian, J.; Wu, J.; Xiong, H.; Zeb, A.; Yang, T.; Su, X.; Su, L.; Liu, W. Impact of polystyrene nanoplastics (PSNPs) on seed germination and seedling growth of wheat (Triticum aestivum L.). J. Hazard. Mater. 2020, 385, 121620. [Google Scholar] [CrossRef]
  90. Li, Z.; Li, Q.; Li, R.; Zhou, J.; Wang, G. The distribution and impact of polystyrene nanoplastics on cucumber plants. Environ. Sci. Pollut. Res. 2021, 28, 16042–16053. [Google Scholar] [CrossRef]
  91. Liu, Y.; Guo, R.; Zhang, S.; Sun, Y.; Wang, F. Uptake and translocation of nano/microplastics by rice seedlings: Evidence from a hydroponic experiment. J. Hazard. Mater. 2022, 421, 126700. [Google Scholar] [CrossRef]
  92. Lv, L.; Yan, X.; Feng, L.; Jiang, S.; Lu, Z.; Xie, H.; Sun, S.; Chen, J.; Li, C. Challenge for the detection of microplastics in the environment. Water Environ. Res. 2021, 93, 5–15. [Google Scholar] [CrossRef]
  93. Song, Y.K.; Hong, S.H.; Jang, M.; Han, G.M.; Rani, M.; Lee, J.; Shim, W.J. A comparison of microscopic and spectroscopic identification methods for analysis of microplastics in environmental samples. Mar. Pollut. Bull. 2015, 93, 202–209. [Google Scholar] [CrossRef] [PubMed]
  94. He, D.; Guo, T.; Li, J.; Wang, F. Optimize lettuce washing methods to reduce the risk of microplastics ingestion: The evidence from microplastics residues on the surface of lettuce leaves and in the lettuce washing wastewater. Sci. Total Environ. 2023, 868, 161726. [Google Scholar] [CrossRef] [PubMed]
  95. Heller, M.C.; Mazor, M.H.; Keoleian, G.A. Plastics in the US: Toward a material flow characterization of production, markets and end of life. Environ. Res. Lett. 2020, 15, 094034. [Google Scholar] [CrossRef]
  96. White, A.; Lockyer, S. Removing plastic packaging from fresh produce–what’s the impact? Nutr. Bull. 2020, 45, 35–50. [Google Scholar] [CrossRef]
  97. Terry, L.A.; Mena, C.; Williams, A.; Jenney, N.; Whitehead, P. Fruit and Vegetable Resource Maps: Mapping Fruit and Vegetable Waste through the Wholesale Supply Chain; Final Report RSC008; Waste & Resources Action Programme (WRAP): Banbury, UK, 2011; 95p. [Google Scholar]
  98. Waste & Resources Action Programme. Evidence Review: Plastic Packaging and Fresh Produce. Available online: http://www.wrap.org.uk/content/evidence-review-plastic-packaging-and-fresh-produce (accessed on 6 November 2019).
  99. Fadare, O.O.; Wan, B.; Guo, L.H.; Zhao, L. Microplastics from consumer plastic food containers: Are we consuming it? Chemosphere 2020, 253, 126787. [Google Scholar] [CrossRef]
  100. Food and Agriculture Organization. Aquaculture Newsletter; FAO: Rome, Italy, 2017; Volume 57, 64p. [Google Scholar]
  101. Zuccarello, P.; Ferrante, M.; Cristaldi, A.; Copat, C.; Grasso, A.; Sangregorio, D.; Fiore, M.; Conti, G.O. Exposure to microplastics (<10 μm) associated to plastic bottles mineral water consumption: The first quantitative study. Water Res. 2019, 157, 365–371. [Google Scholar] [CrossRef] [PubMed]
  102. Romagnolo, D.F.; Selmin, O.I. Mediterranean Diet and Prevention of Chronic Diseases. Nutr. Today 2017, 52, 208–222. [Google Scholar] [CrossRef]
  103. Renzella, J.; Townsend, N.; Jewell, J.; Breda, J.; Roberts, N.; Rayner, M.; Wickramasinghe, K. What National and Subnational Interventions and Policies Based on Mediterranean and Nordic Diets are Recommended or Implemented in the WHO European Region and Is There Evidence of Effectiveness in Reducing Noncommunicable Diseases, 1st ed.; World Health Organization, Regional Office for Europe: Copenhagen, Denmark, 2018; 58p. [Google Scholar]
Figure 1. Microplastic occurrence in different fruits and vegetables.
Life 13 01686 g001
Figure 2. Some microplastics in different colours and shapes extracted from fruit and vegetable samples in this study.
Life 13 01686 g002
Figure 3. Statistical comparison of total MPs accumulation detected in fruits and vegetables in terms of shape and color ((a): shape, (b): color).
Life 13 01686 g003
Figure 4. Microplastic images under a scanning electron microscope, at different magnifications.
Life 13 01686 g004
Figure 5. Results of the polymer’s characterization by ATR-FTIR. (A) Poly(ethylene), low density; (B) Polypropylene; (C) Poly(ethylene) terephthalate.
Life 13 01686 g005
Table 1. Mean occurrence of microplastics in fruits and vegetables for each purchase site (mean ± standard deviation particles g−1).
Purchase
Site
Product
PearTomatoApplePotatoesCucumberOnionMean
M13.7 ± 0.63.3 ± 2.13.5 ± 0.70.5 ± 0.53.5 ± 3.33.5 ± 2.33.0 ± 2
M23.0 ± 0.73.7 ± 0.52.2 ± 0.71.0 ± 0.84.1 ± 0.82.8 ± 0.62.8 ± 1.2
F13.6 ± 0.54.9 ± 0.83.5 ± 2.21.0 ± 0.72.1 ± 1.12.5 ± 1.72.9 ± 1.7
F22.2 ± 2.42.5 ± 0.83 ± 0.93.3 ± 2.14.6 ± 0.91.7 ± 0.82.9 ± 1.6
Mean3.1 ± 1.33.6 ± 1.43.1 ± 1.21.5 ± 1.63.6 ± 1.82.6 ± 1.52.9 ± 1.6
Table 2. Estimated annual and daily intake amounts (EAI and EDI) of the microplastics related to the consumption of fruits and vegetables.
EAI
(Particles Individual−1 Year−1)
EDI (Particles kg−1 Day−1)
ChildrenAdult
Pear16,127.62.760.63
Apple96,617.416.543.78
Tomato398,520.068.2415.60
Onion54,860.09.392.15
Potatoes76,950.013.183.01
Cucumber66,600.011.402.61
Disclaimer/Publisher’s Note: The statements, opinions and data contained in all publications are solely those of the individual author(s) and contributor(s) and not of MDPI and/or the editor(s). MDPI and/or the editor(s) disclaim responsibility for any injury to people or property resulting from any ideas, methods, instructions or products referred to in the content.