Liver Fibrosis Regression and Associated Factors in HCV Patients Treated with Direct-Acting Antiviral Agents

 ,
,
Abstract
:1. Introduction
2. Materials and Methods
2.1. Patients
2.2. Study Design
2.3. Liver Stiffness Measurement
2.4. Data Collection
2.5. Statistical Analysis
3. Results
3.1. Patients
3.2. Virologic Data
3.3. Liver Fibrosis Staging
3.4. Comorbidities and Complications
3.5. Laboratory Values
3.6. Liver Fibrosis Regression
4. Discussion
5. Conclusions
Supplementary Materials
Author Contributions
Funding
Institutional Review Board Statement
Informed Consent Statement
Data Availability Statement
Conflicts of Interest
References
- HCV Updates of the World Health Organization. Available online: https://www.who.int/news-room/fact-sheets/detail/hepatitis-c (accessed on 1 June 2023).
- Abu-Freha, N.; Mathew Jacob, B.; Elhoashla, A.; Afawi, Z.; Abu-Hammad, T.; Elsana, F.; Paz, S.; Etzion, O. Chronic hepatitis C: Diagnosis and treatment made easy. Eur. J. Gen. Pract. 2022, 28, 102–108. [Google Scholar] [CrossRef] [PubMed]
- Carrat, F.; Fontaine, H.; Dorival, C.; Simony, M.; Diallo, A.; Hezode, C.; De Ledinghen, V.; Larrey, D.; Haour, G.; Bronowicki, J.P.; et al. Clinical outcomes in patients with chronic hepatitis C after direct-acting antiviral treatment: A prospective cohort study. Lancet 2019, 393, 1453–1464. [Google Scholar] [CrossRef]
- Mandorfer, M.; Kozbial, K.; Schwabl, P.; Chromy, D.; Semmler, G.; Stattermayer, A.F.; Pinter, M.; Hernández-Gea, V.; Fritzer-Szekeres, M.; Steindl-Munda, P.; et al. Changes in hepatic venous pressure gradient predict hepatic decompensation in patients who achieved sustained virologic response to interferon-free therapy. Hepatology 2020, 71, 1023–1036. [Google Scholar] [CrossRef] [PubMed]
- Mauro, E.; Crespo, G.; Montironi, C.; Londono, M.C.; Hernandez-Gea, V.; Ruiz, P.; Sastre, L.; Lombardo, J.; Mariño, Z.; Díaz, A.; et al. Portal pressure and liver stiffness measurements in the prediction of Liver fibrosis regression after sustained virological response in recurrent hepatitis C. Hepatology 2018, 67, 1683–1694. [Google Scholar] [CrossRef] [PubMed]
- World Health Organization. Global Health Sector Strategy on Viral Hepatitis 2016–2021; WHO: Geneva, Switzerland, 2016; Available online: https://apps.who.int/iris/bitstream/handle/10665/246177/WHO-HIV-2016.06-eng.pdf;jsessionid=60A93ADD1A191FF6A0FA823314D24C43?sequence=1 (accessed on 1 June 2003).
- Shiha, G.; Soliman, R.; Hassan, A.A.; Mikhail, N.N.H. Changes in hepatic Liver fibrosis and incidence of HCC following direct-acting antiviral treatment of F3 chronic hepatitis c patients: A prospective observational study. Hepatoma Res. 2022, 8, 29. [Google Scholar] [CrossRef]
- Zakareya, T.; Elhelbawy, M.; Elzohry, H.; Eltabbakh, M.; Deif, M.; Abbasy, M. Long-Term Impact of Hepatitis C Virus Eradication on Liver Stiffness in Egyptian Patients. Can. J. Gastroenterol. Hepatol. 2021, 20, 4961919. [Google Scholar] [CrossRef]
- Shiha, G.; Mousa, N.; Soliman, R.; Nnh Mikhail, N.; Adel Elbasiony, M.; Khattab, M. Incidence of HCC in chronic hepatitis C patients with advanced hepatic Liver fibrosis who achieved SVR following DAAs: A prospective study. J. Viral. Hepat. 2020, 27, 671–679. [Google Scholar] [CrossRef]
- Lockart, I.; Yeo, M.G.H.; Hajarizadeh, B.; Dore, G.J.; Danta, M. HCC incidence after hepatitis C cure among patients with advanced Liver fibrosis or cirrhosis: A meta-analysis. Hepatology 2022, 76, 139–154. [Google Scholar] [CrossRef]
- Bonder, A.; Afdhal, N. Utilization of FibroScan in clinical practice. Curr. Gastroenterol. Rep. 2014, 16, 372. [Google Scholar] [CrossRef]
- Fraquelli, M.; Rigamonti, C.; Casazza, G.; Conte, D.; Donato, M.F.; Ronchi, G.; Colombo, M. Reproducibility of transient elastography in the evaluation of liver Liver fibrosis in patients with chronic liver disease. Gut 2007, 56, 968–973. [Google Scholar] [CrossRef]
- Sterling, R.K.; Lissen, E.; Clumeck, N.; Sola, R.; Correa, M.C.; Montaner, J.; SSulkowski, M.; Torriani, F.J.; Dieterich, D.T.; Thomas, D.L.; et al. Development of a simple noninvasive index to predict significant fibrosis in patients with HIV/HCV coinfection. Hepatology 2006, 43, 1317–1325. [Google Scholar] [CrossRef] [PubMed]
- Wai, C.T.; Greenson, J.K.; Fontana, R.J.; Kalbfleisch, J.D.; Marrero, J.A.; Conjeevaram, H.S.; Lok, A.S. A simple noninvasive index can predict both significant fibrosis and cirrhosis in patients with chronic hepatitis C. Hepatology 2003, 38, 518–526. [Google Scholar] [CrossRef] [PubMed]
- Huang, C.F.; Yu, M.L. Unmet needs of chronic hepatitis C in the era of direct-acting antiviral therapy. Clin. Mol. Hepatol. 2020, 26, 251–260. [Google Scholar] [CrossRef]
- Kanwal, F.; Kramer, J.; Asch, S.M.; Chayanupatkul, M.; Cao, Y.; El-Serag, H.B. Risk of hepatocellular cancer in HCV patients treated with direct-acting antiviral agents. Gastroenterology 2017, 153, 996–1005.e1. [Google Scholar] [CrossRef] [PubMed]
- Li, D.K.; Ren, Y.; Fierer, D.S.; Rutledge, S.; Shaikh, O.S.; Lo Re, V., III; Simon, T.; Abou Samra, A.; Chung, R.T.; Butt, A.A. The short-term incidence of hepatocellular carcinoma is not increased after hepatitis C treatment with direct-acting antivirals: An Archives study. Hepatology 2018, 67, 2244–2253. [Google Scholar] [CrossRef]
- Ioannou, G.N.; Green, P.K.; Berry, K. HCV eradication induced by direct acting antiviral agents reduces the risk of hepatocellular carcinoma. J. Hepatol. 2017, 68, 25–32. [Google Scholar] [CrossRef]
- Fernandes, F.F.; Piedade, J.; Guimaraes, L.; Nunes, E.P.; Chaves, U.; Goldenzon, R.V.; Cardoso, S.W.; Duarte, J.; Grinsztejn, B.; Veloso, V.G.; et al. Effectiveness of direct-acting agents for hepatitis C and liver stiffness changing after sustained virological response. J. Gastroenterol. Hepatol. 2019, 34, 2187–2195. [Google Scholar] [CrossRef]
- Yoo, H.W.; Park, J.Y.; Kim, S.G.; Jung, Y.K.; Lee, S.H.; Kim, M.Y.; Jun, D.W.; Jang, J.Y.; Lee, J.W.; Kwon, O.S. Regression of liver fibrosis and hepatocellular carcinoma development after HCV eradication with oral antiviral agents. Sci. Rep. 2022, 7, 193. [Google Scholar] [CrossRef]
- Trivedi, H.D.; Curry, M.P.; Lai, M. Reply to: The presence of diabetes impacts liver fibrosis and steatosis by transient elastography in a primary care population. Ann. Hepatol. 2021, 25, 100347. [Google Scholar] [CrossRef]
- Sato, S.; Kawai, H.; Sato, S.; Iwasaki, H.; Omori, M.; Kita, Y.; Ikeda, Y.; Awatsu, T.; Murata, A.; Taniguchi, G.; et al. Hypertension and diabetes mellitus are associated with high FIB-4 index in a health checkup examination cohort without known liver disease. BMC Gastroenterol. 2022, 22, 478. [Google Scholar] [CrossRef]
- Poynard, T.; McHutchison, J.; Manns, M.; Trepo, C.; Lindsay, K.; Goodman, Z.; Ling, M.H.; Albrecht, J. Impact of pegylated interferon alfa-2b and ribavirin on liver fibrosis in patients with chronic hepatitis C. Gastroenterology 2002, 122, 1303–1313. [Google Scholar] [CrossRef] [PubMed]
- Chan, J.; Gogela, N.; Zheng, H.; Lammert, S.; Ajayi, T.; Fricker, Z.; Kim, A.Y.; Robbins, G.K.; Chung, R.T. Direct-Acting Antiviral Therapy for Chronic HCV Infection Results in Liver Stiffness Regression Over 12 Months Post-treatment. Dig. Dis. Sci. 2018, 63, 486–492. [Google Scholar] [CrossRef] [PubMed]
- Lledó, G.M.; Carrasco, I.; Benítez-Gutiérrez, L.M.; Arias, A.; Royuela, A.; Requena, S.; Cuervas-Mons, V.; de Mendoza, C. Regression of liver fibrosis after curing chronic hepatitis C with oral antivirals in patients with and without HIV coinfection. AIDS 2018, 23, 2347–2352. [Google Scholar] [CrossRef] [PubMed]
- Kalidindi, Y.; Jung, J.; Feldman, R.; Riley, T., 3rd. Association of Direct-Acting Antiviral Treatment with Mortality Among Medicare Beneficiaries with Hepatitis C. JAMA Netw. Open 2020, 1, e2011055. [Google Scholar] [CrossRef]
- Sahakyan, Y.; Lee-Kim, V.; Bremner, K.E.; Bielecki, J.M.; Krahn, M.D. Impact of direct-acting antiviral regimens on mortality and morbidity outcomes in patients with chronic hepatitis c: Systematic review and meta-analysis. J. Viral. Hepat. 2021, 28, 739–754. [Google Scholar] [CrossRef]
- Ogawa, E.; Chien, N.; Kam, L.; Yeo, Y.H.; Ji, F.; Huang, D.Q.; Cheung, R.; Nguyen, M.H. Association of Direct-Acting Antiviral Therapy with Liver and Nonliver Complications and Long-term Mortality in Patients with Chronic Hepatitis C. JAMA Intern. Med. 2023, 183, 97–105. [Google Scholar] [CrossRef]
- Marciniewicz, E.; Podgórski, P.; Pawłowski, T.; Małyszczak, K.; Fleischer-Stępniewska, K.; Knysz, B.; Waliszewska-Prosół, M.; Żelwetro, A.; Rymer, W.; Inglot, M.; et al. Evaluation of brain volume alterations in HCV-infected patients after interferon-free therapy: A pilot study. J. Neurol. Sci. 2019, 399, 36–43. [Google Scholar] [CrossRef]
- Tagliapietra, M.; Monaco, S. Neuroimaging Findings in Chronic Hepatitis C Virus Infection: Correlation with Neurocognitive and Neuropsychiatric Manifestations. Int. J. Mol. Sci. 2020, 21, 2478. [Google Scholar] [CrossRef]
- Taha, G.; Ezra, L.; Abu-Freha, N. Hepatitis C Elimination: Opportunities and Challenges in 2023. Viruses 2023, 15, 1413. [Google Scholar] [CrossRef]
- Moonen, C.P.B.; den Heijer, C.D.J.; Dukers-Muijrers, N.H.T.M.; van Dreumel, R.; Steins, S.C.J.; Hoebe, C.J.P.A. A systematic review of barriers and facilitators for hepatitis B and C screening among migrants in the EU/EEA region. Front. Public Health 2023, 15, 1118227. [Google Scholar] [CrossRef]

| Characteristic | Patients, n = 209 (%) |
|---|---|
| Age, mean ± SD, years | 58 ± 11.3 |
| Age at diagnosis, mean ± SD, years | 47 ± 12.1 |
| Age at treatment, mean ± SD, years | 54 ± 10.9 |
| Sex (male) | 117 (56) |
| Ethnicity | |
| Jewish | 201 (96.2) |
| Bedouin | 8 (3.8) |
| Subgrouping | |
| Israeli-born | 74 (35.4) |
| Immigrant—former Soviet Union | 135 (64.6) |
| Genotype | |
| 1a | 34 (16.3) |
| 1b | 121 (57.9) |
| 2a | 9 (4.3) |
| 3 | 38 (18.2) |
| 4a | 4 (1.9) |
| Patient type | |
| Treatment-naïve | 149 (71.3) |
| Experienced past treatment | 58 (27.8) |
| Viral load (IU/mL) | |
| ≤800,000 | 76 (36.4) |
| >800,000 | 133 (63.6) |
| Method of fibrosis assessment at treatment time | |
| Fibrotest | 165 (78.9) |
| Fibroscan | 21 (10) |
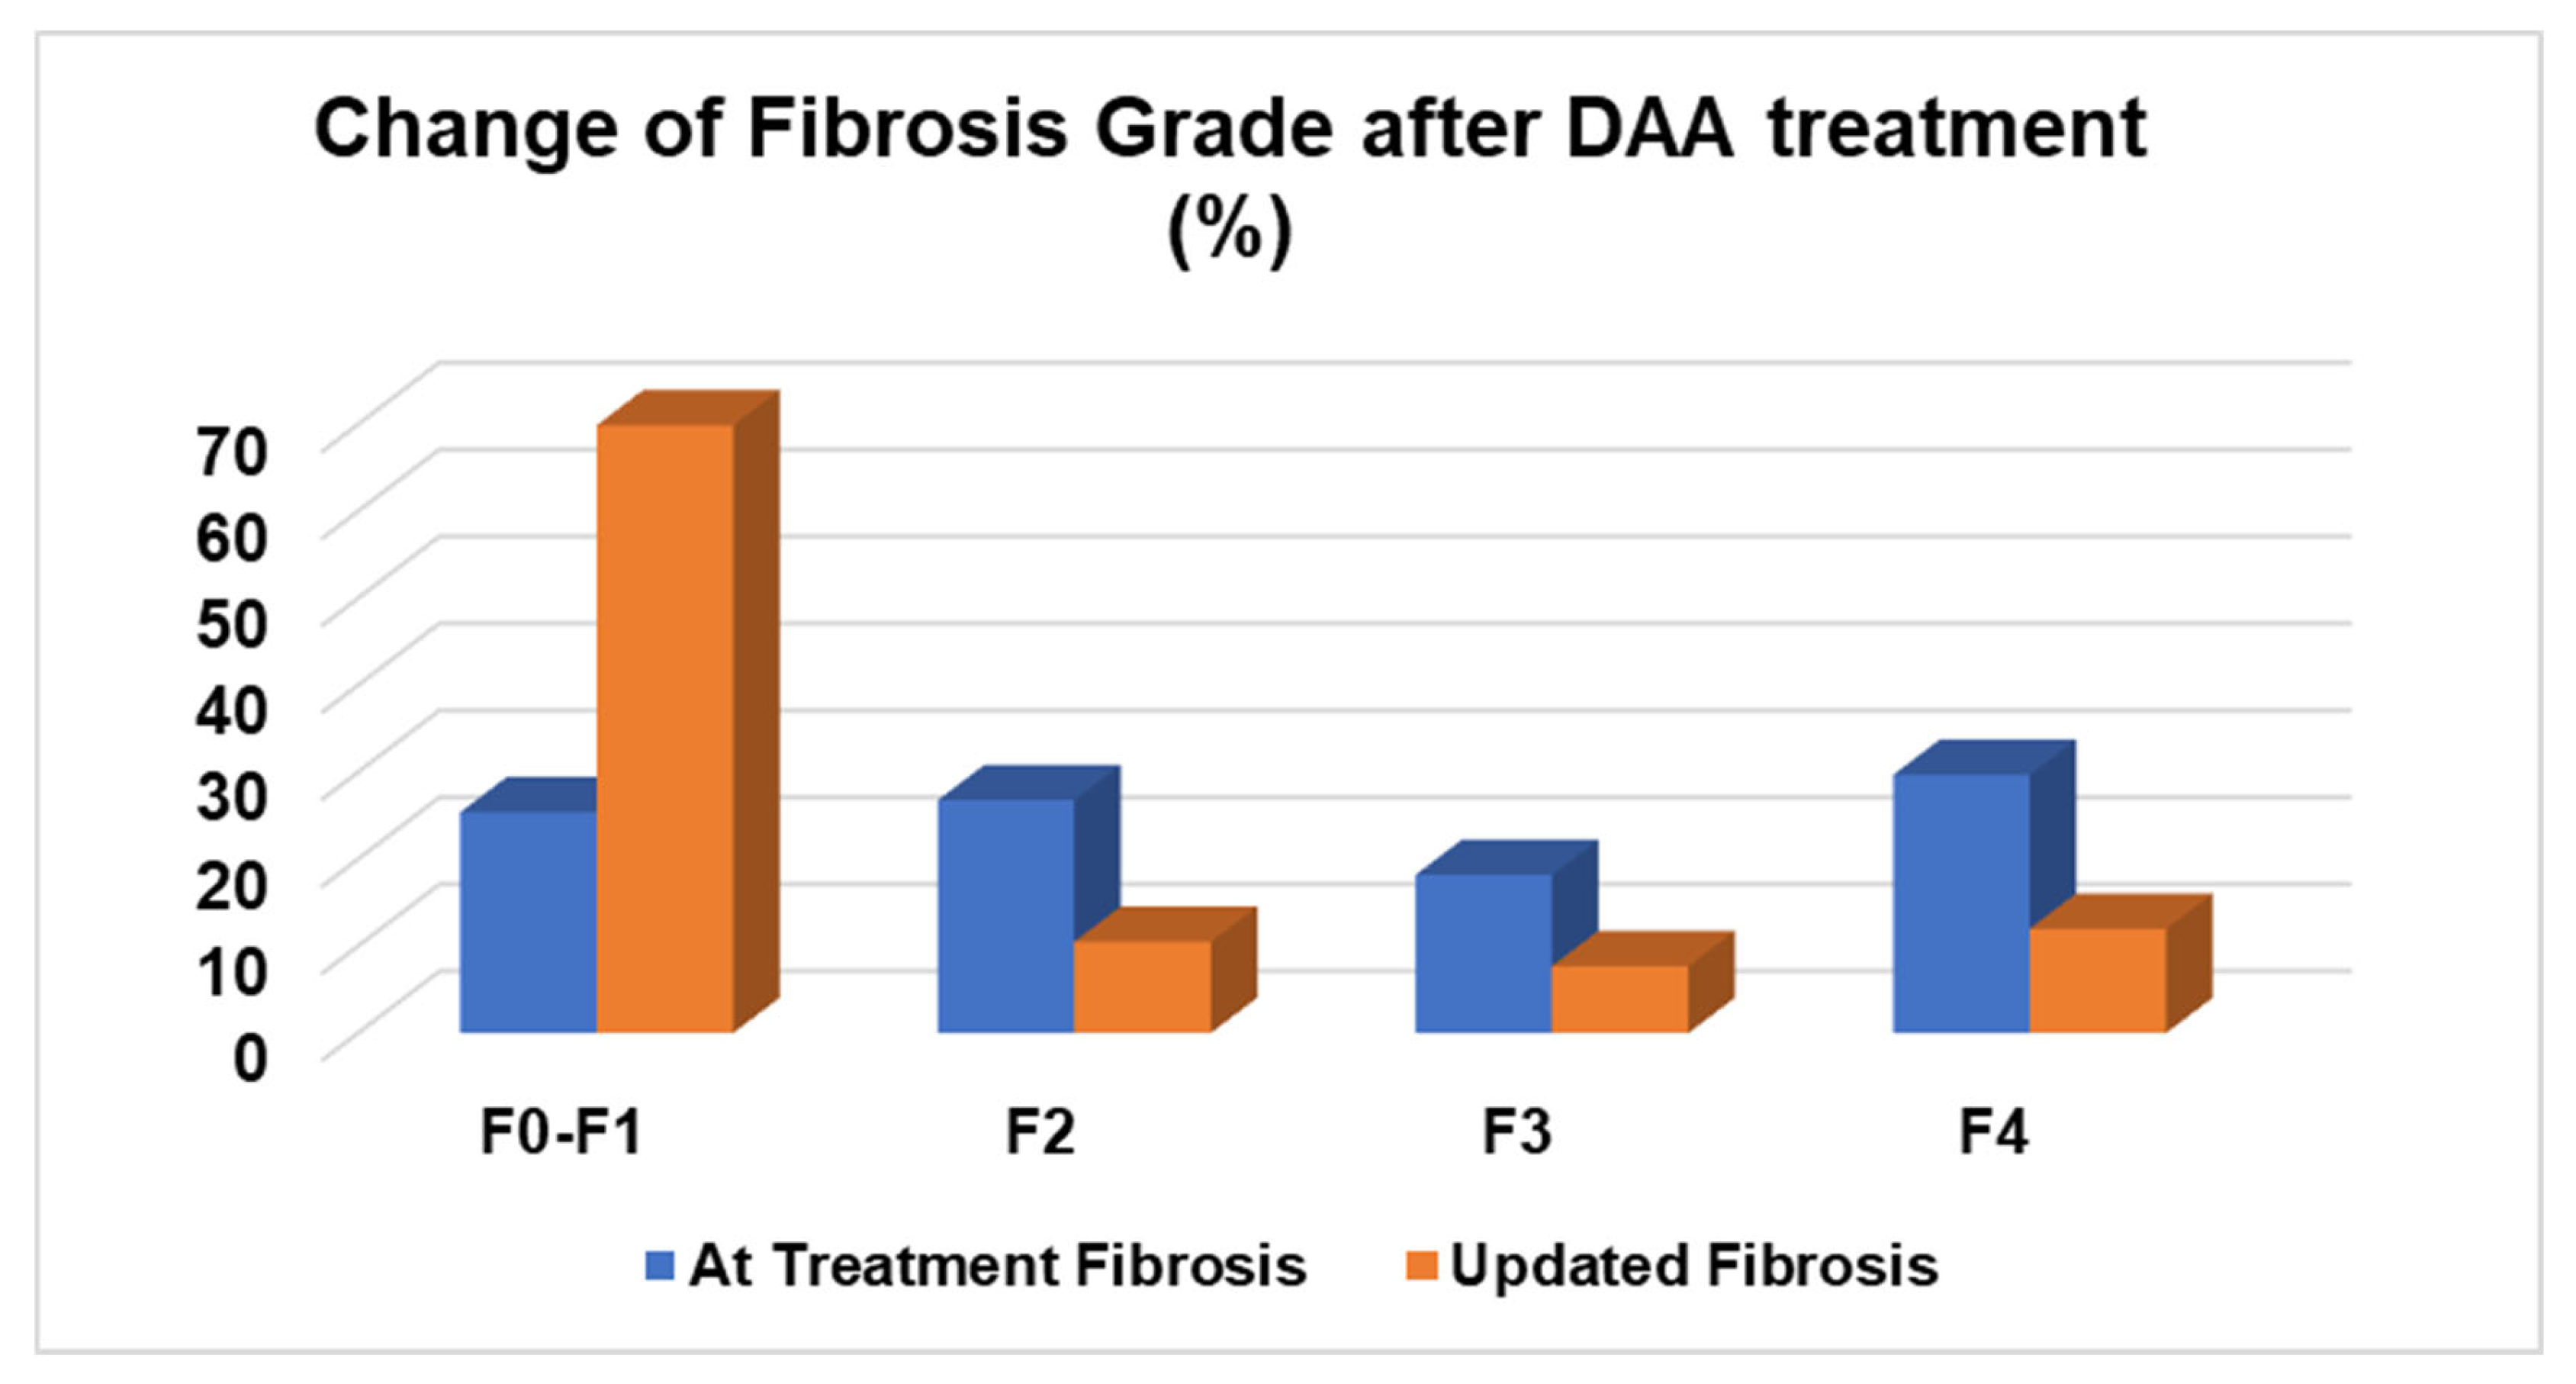
| Fibrosis stage at treatment time | |
| F0–F1 | 53 (25.4) |
| F2 | 56 (26.8) |
| F3 | 38 (18.2) |
| F4 | 62 (29.7) |
| Updated fibrosis stage | |
| F0–F1 | 146 (69.9) |
| F2 | 22 (10.5) |
| F3 | 16 (7.7) |
| F4 | 25 (12) |
| Change in fibrosis score | |
| No change in the fibrosis score | 75 (35.9) |
| Regression of fibrosis | |
| 3 stages | 18 (8.6) |
| 2 stages | 38 (18.2) |
| 1 stage | 63 (30.1) |
| Progression of fibrosis | |
| 1 stage | 12 (5.7) |
| 2 stages | 3 (1.4) |
| Regression in the fibrosis score | |
| From F3/F4 to F2 or less | 58 (27.8) |
| Treatment type | |
| Dasabuvir/ombitasvir or paritaprevir/ritonavir | 19 (9.1) |
| Dasabuvir/ombitasvir or paritaprevir/ritonavir/ribavirin | 13 (6.2) |
| Ledipasvir/sofosbuvir | 28 (13.4) |
| Ledipasvir/sofosbuvir/ribavirin | 4 (1.9) |
| Elbasvir/grazoprevir | 39 (18.7) |
| Daclatasvir/sofosbuvir | 4 (1.9) |
| Daclatasvir/sofosbuvir/ribavirin | 16 (2.9) |
| Sofosbuvir/velpatasvir | 49 (23.4) |
| Pibrentasvir/glecaprevir | 45 (21.5) |
| Sustained virologic response (SVR) | 207 (99) |
| Comorbidity | Patients, n = 209 (%) |
|---|---|
| HIV | 5 (2.4) |
| HBV | 7 (3.3) |
| HBV/HDV | 1 (0.5) |
| Fatty liver disease | 37 (17.7) |
| Obesity | 49 (23.4) |
| Diabetes mellitus | 29 (13.9) |
| Non-Hodgkin lymphoma | 3 (1.4) |
| Depression | 16 (7.7) |
| Hypothyroidism | 14 (6.7) |
| Hyperthyroidism | 2 (1) |
| Complication | |
| Liver cirrhosis | 69 (33) |
| HCC | 10 (4.8) |
| Esophageal varices | 24 (11.5) |
| Esophageal varices bleeding | 11 (5.3) |
| SBP | 2 (1) |
| Child–Pugh classification—at treatment time (n = 69) | |
| A | 58 (84) |
| B | 11 (16) |
| C | 0 |
| Child–Pugh classification—updated (n = 69) | |
| A | 61 (88.5) |
| B | 8 (11.5) |
| C | 0 |
| Laboratory | At Treatment | Updated Value | p-Value |
|---|---|---|---|
| Hemoglobin | 13.86 ± 1.7 | 13.43 ± 1.69 | <0.001 |
| WBC | 6.9 ± 2.2 | 8.3 ± 12.9 | 0.107 |
| PLT | 212 ± 232 | 210 ± 84 | 0.876 |
| INR | 1.00 ± 0.14 | 1.02 ± 0.16 | 0.022 |
| ALT | 64.9 ± 47 | 20.5 ± 12.2 | <0.001 |
| AST | 60.6 ± 39 | 29 ± 29 | <0.001 |
| GGT | 74 ± 71.4 | 35.6 ± 36.1 | <0.001 |
| Alkaline phosphatase | 91.1 ± 31.7 | 79.3 ± 43.3 | <0.001 |
| Total bilirubin | 0.79 ± 0.5 | 0.0.71 ± 0.63 | 0.077 |
| Creatinine | 0.69 ± 0.17 | 0.77 ± 0.38 | <0.001 |
| Albumin (gr/dL) | 4.10 ± 0.41 | 4.12 ± 0.4 | 0.519 |
| Sodium | 138.5 ± 13 | 139.0 ± 16 | 0.676 |
| Fib-4 score | 3.09 ± 4 | 3.5 ± 8.8 | 0.505 |
| APRI score | 1.4 ± 1.7 | 0.93 ± 2.4 | 0.028 |
| Characteristic | Fibrosis Regression n = 119 (%) | No Fibrosis Regression n = 90 (%) | p-Value |
|---|---|---|---|
| Age | 59.4 ± 10.7 | 56.1 ± 11.9 | 0.018 |
| Age at diagnosis | 48.6 ± 11.8 | 44.9 ± 12 | 0.027 |
| Age at treatment | 55.5 ± 10.5 | 52.1 ± 11.4 | 0.029 |
| Sex (male) | 75 (63) | 42 (46.7) | 0.018 |
| Ethnicity | |||
| Jewish | 84 (93.3) | 117 (98.3) | |
| Bedouin | 2 (1.7) | 6 (6.7) | 0.130 |
| Genotype | 0.664 | ||
| 1a | 16 (17.8) | 18 (15.1) | |
| 1b | 54 (60) | 67 (56.3) | |
| 2a | 5 (5.6) | 4 (3.4) | |
| 3 | 13 (14.4) | 25 (21) | |
| 4a | 2 (2.2) | 2 (1.6) | |
| Patient type | 0.984 | ||
| Naïve | 85 (72) | 64 (71.9) | |
| Experienced | 33 (28) | 25 (28.1) | |
| Viral load (IU/mL) | 0.833 | ||
| ≤800,000 | 44 (37) | 32 (35.6) | |
| >800,000 | 75 (63) | 58 (64.4) | |
| Method of fibrosis assessment at treatment time | 0.052 | ||
| Fibrotest | 101 (78.4) | 64 (77.1) | |
| Fibroscan | 10 (8.8) | 11 (13.3) | |
| Fibrosis stage at treatment time | <0.001 | ||
| F0–F1 | 1 (0.8) | 52 (57.8) | |
| F2 | 45 (37.8) | 11 (12.2) | |
| F3 | 33 (27.7) | 5 (5.6) | |
| F4 | 40 (33.6) | 22 (22.4) | |
| Updated fibrosis stage | <0.001 | ||
| F0–F1 | 93 (78) | 53 (59) | |
| F2 | 15 (12.6) | 4 (4.4) | |
| F3 | 11 (9.25) | 5 (5.6) | |
| F4 | 0 | 25 (27.8) | |
| Sustained virologic response (SVR) | 117 (98.3) | 90 (100) | 0.217 |
| Liver cirrhosis | 42 (36.2) | 27 (30.7) | 0.409 |
| HCC | 4 (3.5) | 6 (6.9) | 0.267 |
| Esophageal varices | 9 (7.6) | 15 (16.7) | 0.043 |
| Esophageal varices bleeding | 2 (1.7) | 9 (10) | 0.008 |
| SBP | 0 | 2 (2.2) | 0.104 |
| Child–Pugh classification—at treatment time | 0.650 | ||
| A | 36 (85.7) | 22 (81.5) | |
| B | 6 (84.3) | 5 (18.5) | |
| C | 0 | ||
| Child–Pugh classification—updated | 0.719 | ||
| A | 37 (85.7) | 24 (88.9) | |
| B | 5 (14.3) | 3 (11.1) | |
| C | 0 | 0 |
| Univariate Analysis | Multivariate Analysis | |||||
|---|---|---|---|---|---|---|
| OR | 95% CI | p-Value | OR | 95% CI | p-Value | |
| Age | 1.027 | 1.001–1.052 | 0.038 | 0.713 | 0.552–0.919 | 0.009 |
| Age at treatment | 1.029 | 1.003–1.055 | 0.031 | 1.359 | 1.055–1.751 | 0.017 |
| Age at diagnosis | 1.026 | 1.003–1.051 | 0.029 | 1.039 | 0.986–1.094 | 0.155 |
| Sex, male | 1.948 | 1.116–3.399 | 0.019 | 1.151 | 0.594–2.231 | 0.677 |
| Baseline fibrosis stage | 2.209 | 1.716–2.845 | <0.001 | 2.555 | 1.864–3.503 | <0.001 |
| Viral load > 800,000 IU/mL | 0.940 | 0.532–1.663 | 0.833 | |||
| ALT at treatment | 1.003 | 0.997–1.009 | 0.288 | |||
| AST at treatment | 1.003 | 0.996–1.011 | 0.382 | |||
| Platelets at treatment | 0.999 | 0.998–1.001 | 0.393 | |||
Disclaimer/Publisher’s Note: The statements, opinions and data contained in all publications are solely those of the individual author(s) and contributor(s) and not of MDPI and/or the editor(s). MDPI and/or the editor(s) disclaim responsibility for any injury to people or property resulting from any ideas, methods, instructions or products referred to in the content. |
© 2023 by the authors. Licensee MDPI, Basel, Switzerland. This article is an open access article distributed under the terms and conditions of the Creative Commons Attribution (CC BY) license (https://creativecommons.org/licenses/by/4.0/).
Share and Cite
Abu-Freha, N.; Abu-Kosh, O.; Yardeni, D.; Ashur, Y.; Abu-Arar, M.; Yousef, B.; Monitin, S.; Weissmann, S.; Etzion, O. Liver Fibrosis Regression and Associated Factors in HCV Patients Treated with Direct-Acting Antiviral Agents. Life 2023, 13, 1872. https://doi.org/10.3390/life13091872
Abu-Freha N, Abu-Kosh O, Yardeni D, Ashur Y, Abu-Arar M, Yousef B, Monitin S, Weissmann S, Etzion O. Liver Fibrosis Regression and Associated Factors in HCV Patients Treated with Direct-Acting Antiviral Agents. Life. 2023; 13(9):1872. https://doi.org/10.3390/life13091872
Chicago/Turabian StyleAbu-Freha, Naim, Osama Abu-Kosh, David Yardeni, Yaffa Ashur, Muhammad Abu-Arar, Baha Yousef, Shulamit Monitin, Sarah Weissmann, and Ohad Etzion. 2023. "Liver Fibrosis Regression and Associated Factors in HCV Patients Treated with Direct-Acting Antiviral Agents" Life 13, no. 9: 1872. https://doi.org/10.3390/life13091872
APA StyleAbu-Freha, N., Abu-Kosh, O., Yardeni, D., Ashur, Y., Abu-Arar, M., Yousef, B., Monitin, S., Weissmann, S., & Etzion, O. (2023). Liver Fibrosis Regression and Associated Factors in HCV Patients Treated with Direct-Acting Antiviral Agents. Life, 13(9), 1872. https://doi.org/10.3390/life13091872