


Quantitative Evaluation of Fundus Autofluorescence in Laser Photocoagulation Scars for Diabetic Retinopathy: Conventional vs. Short-Pulse Laser


Abstract
:1. Introduction
2. Materials and Methods
2.1. Study Design
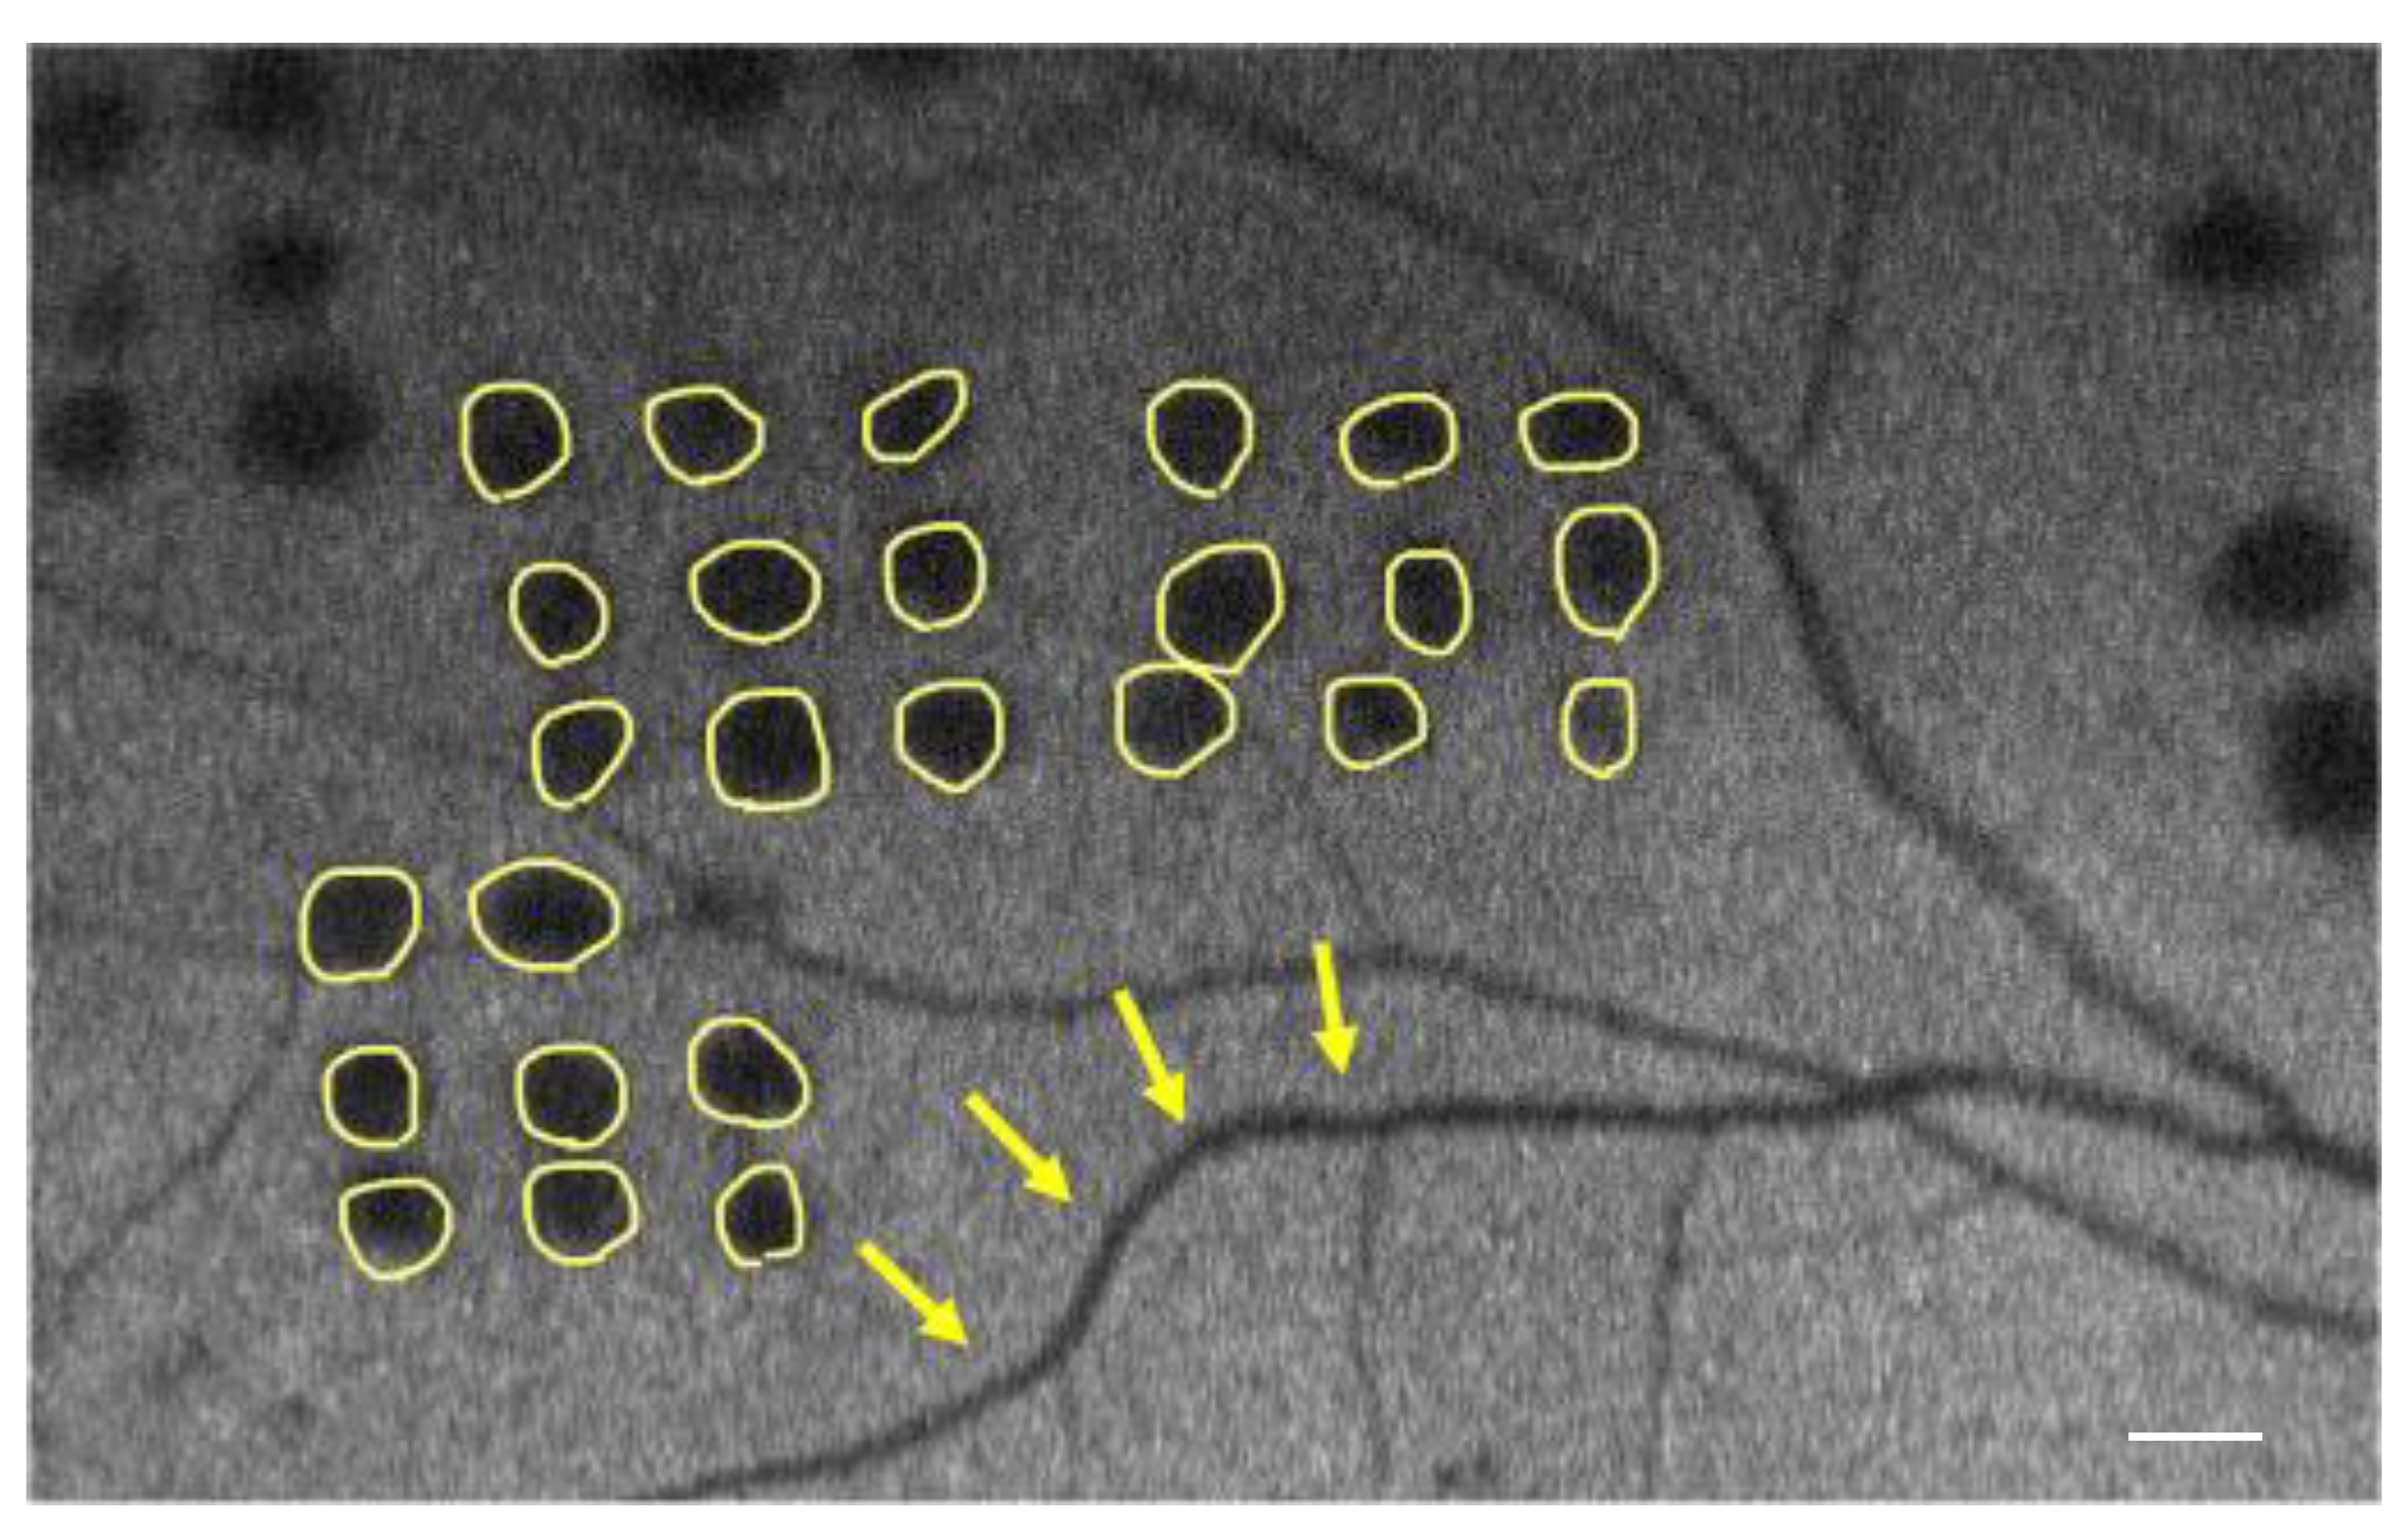
2.2. FAF Aquisition
2.3. Statistics
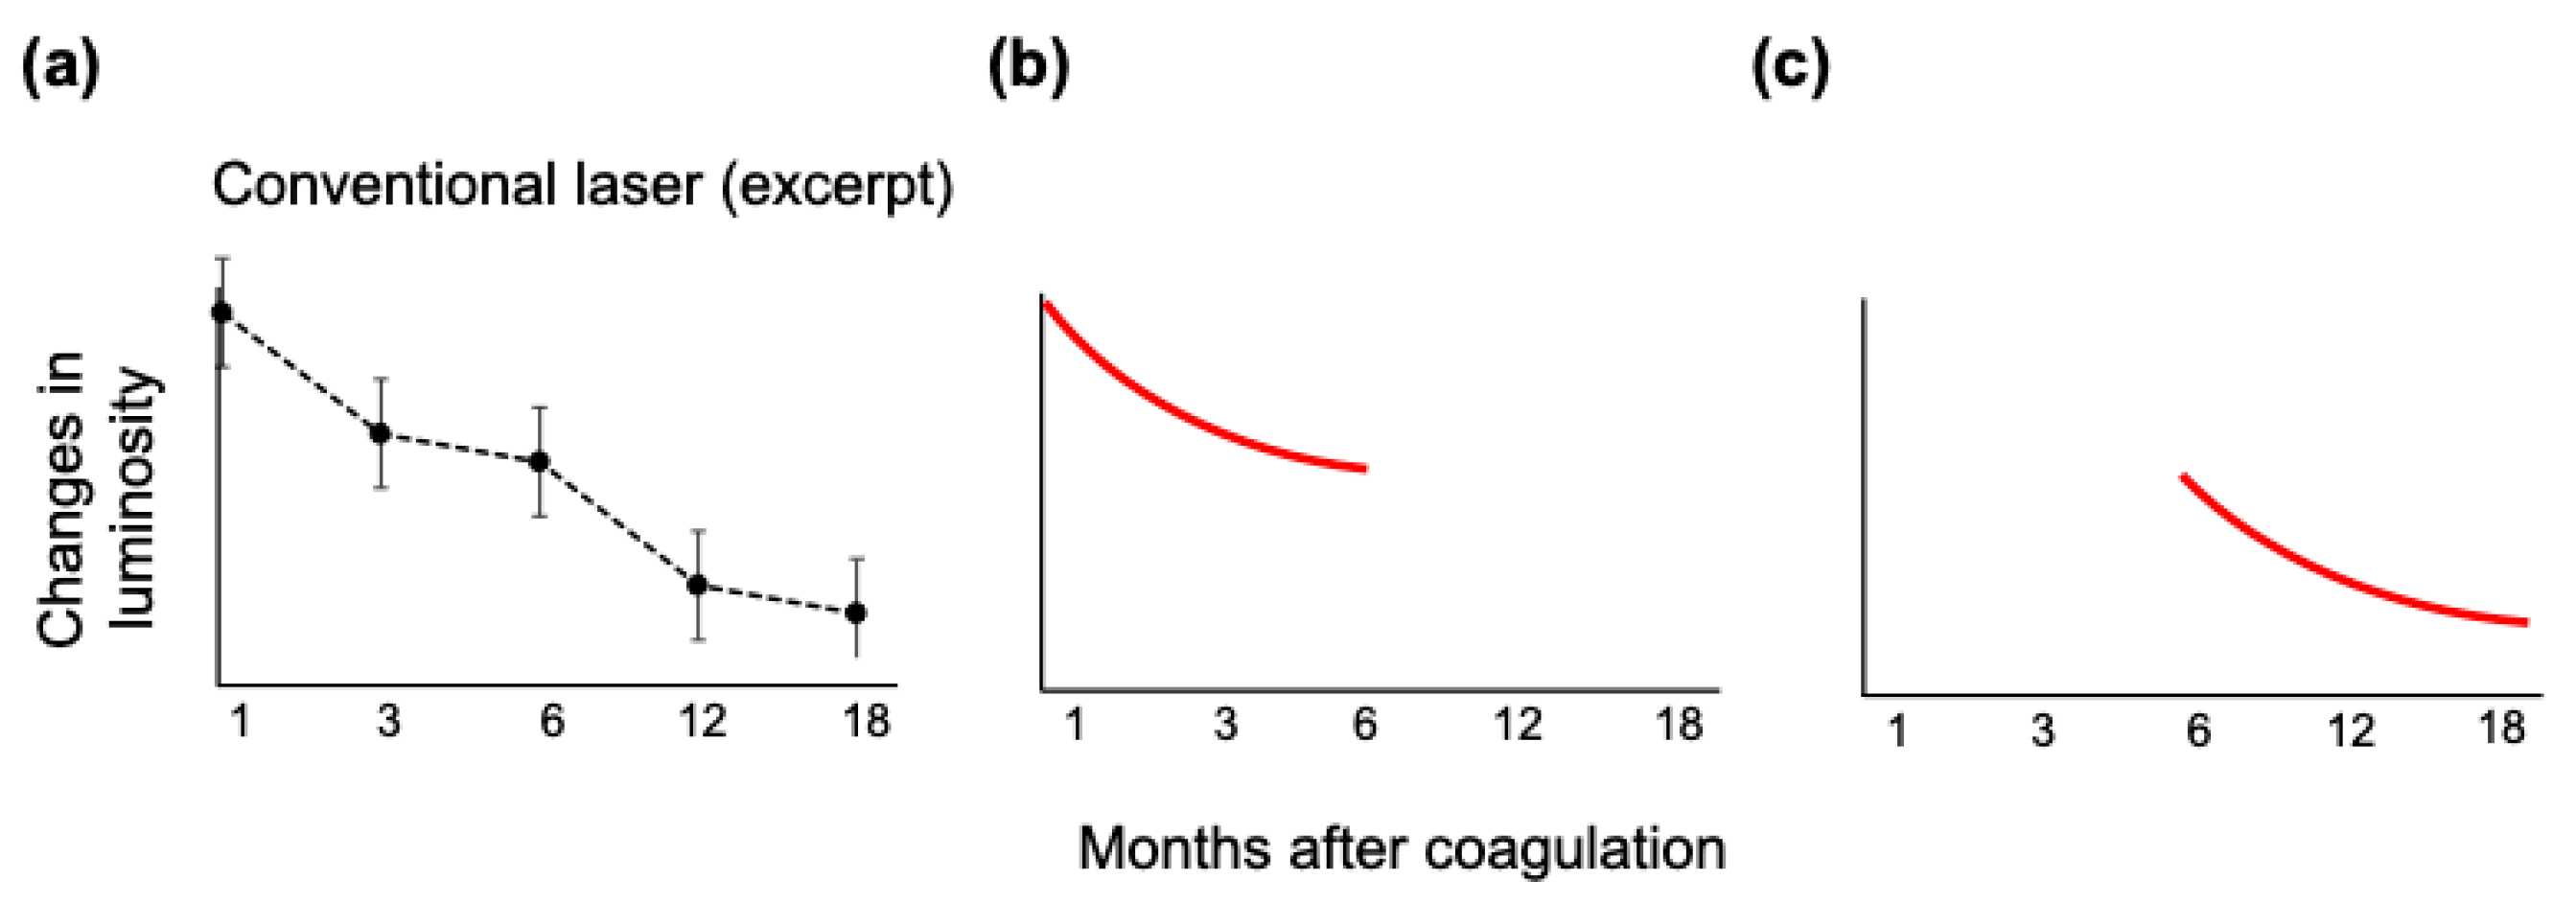
3. Results
3.1. Patient Characteristics
3.2. Laser Setting Parameters
3.3. Clinical Outcomes
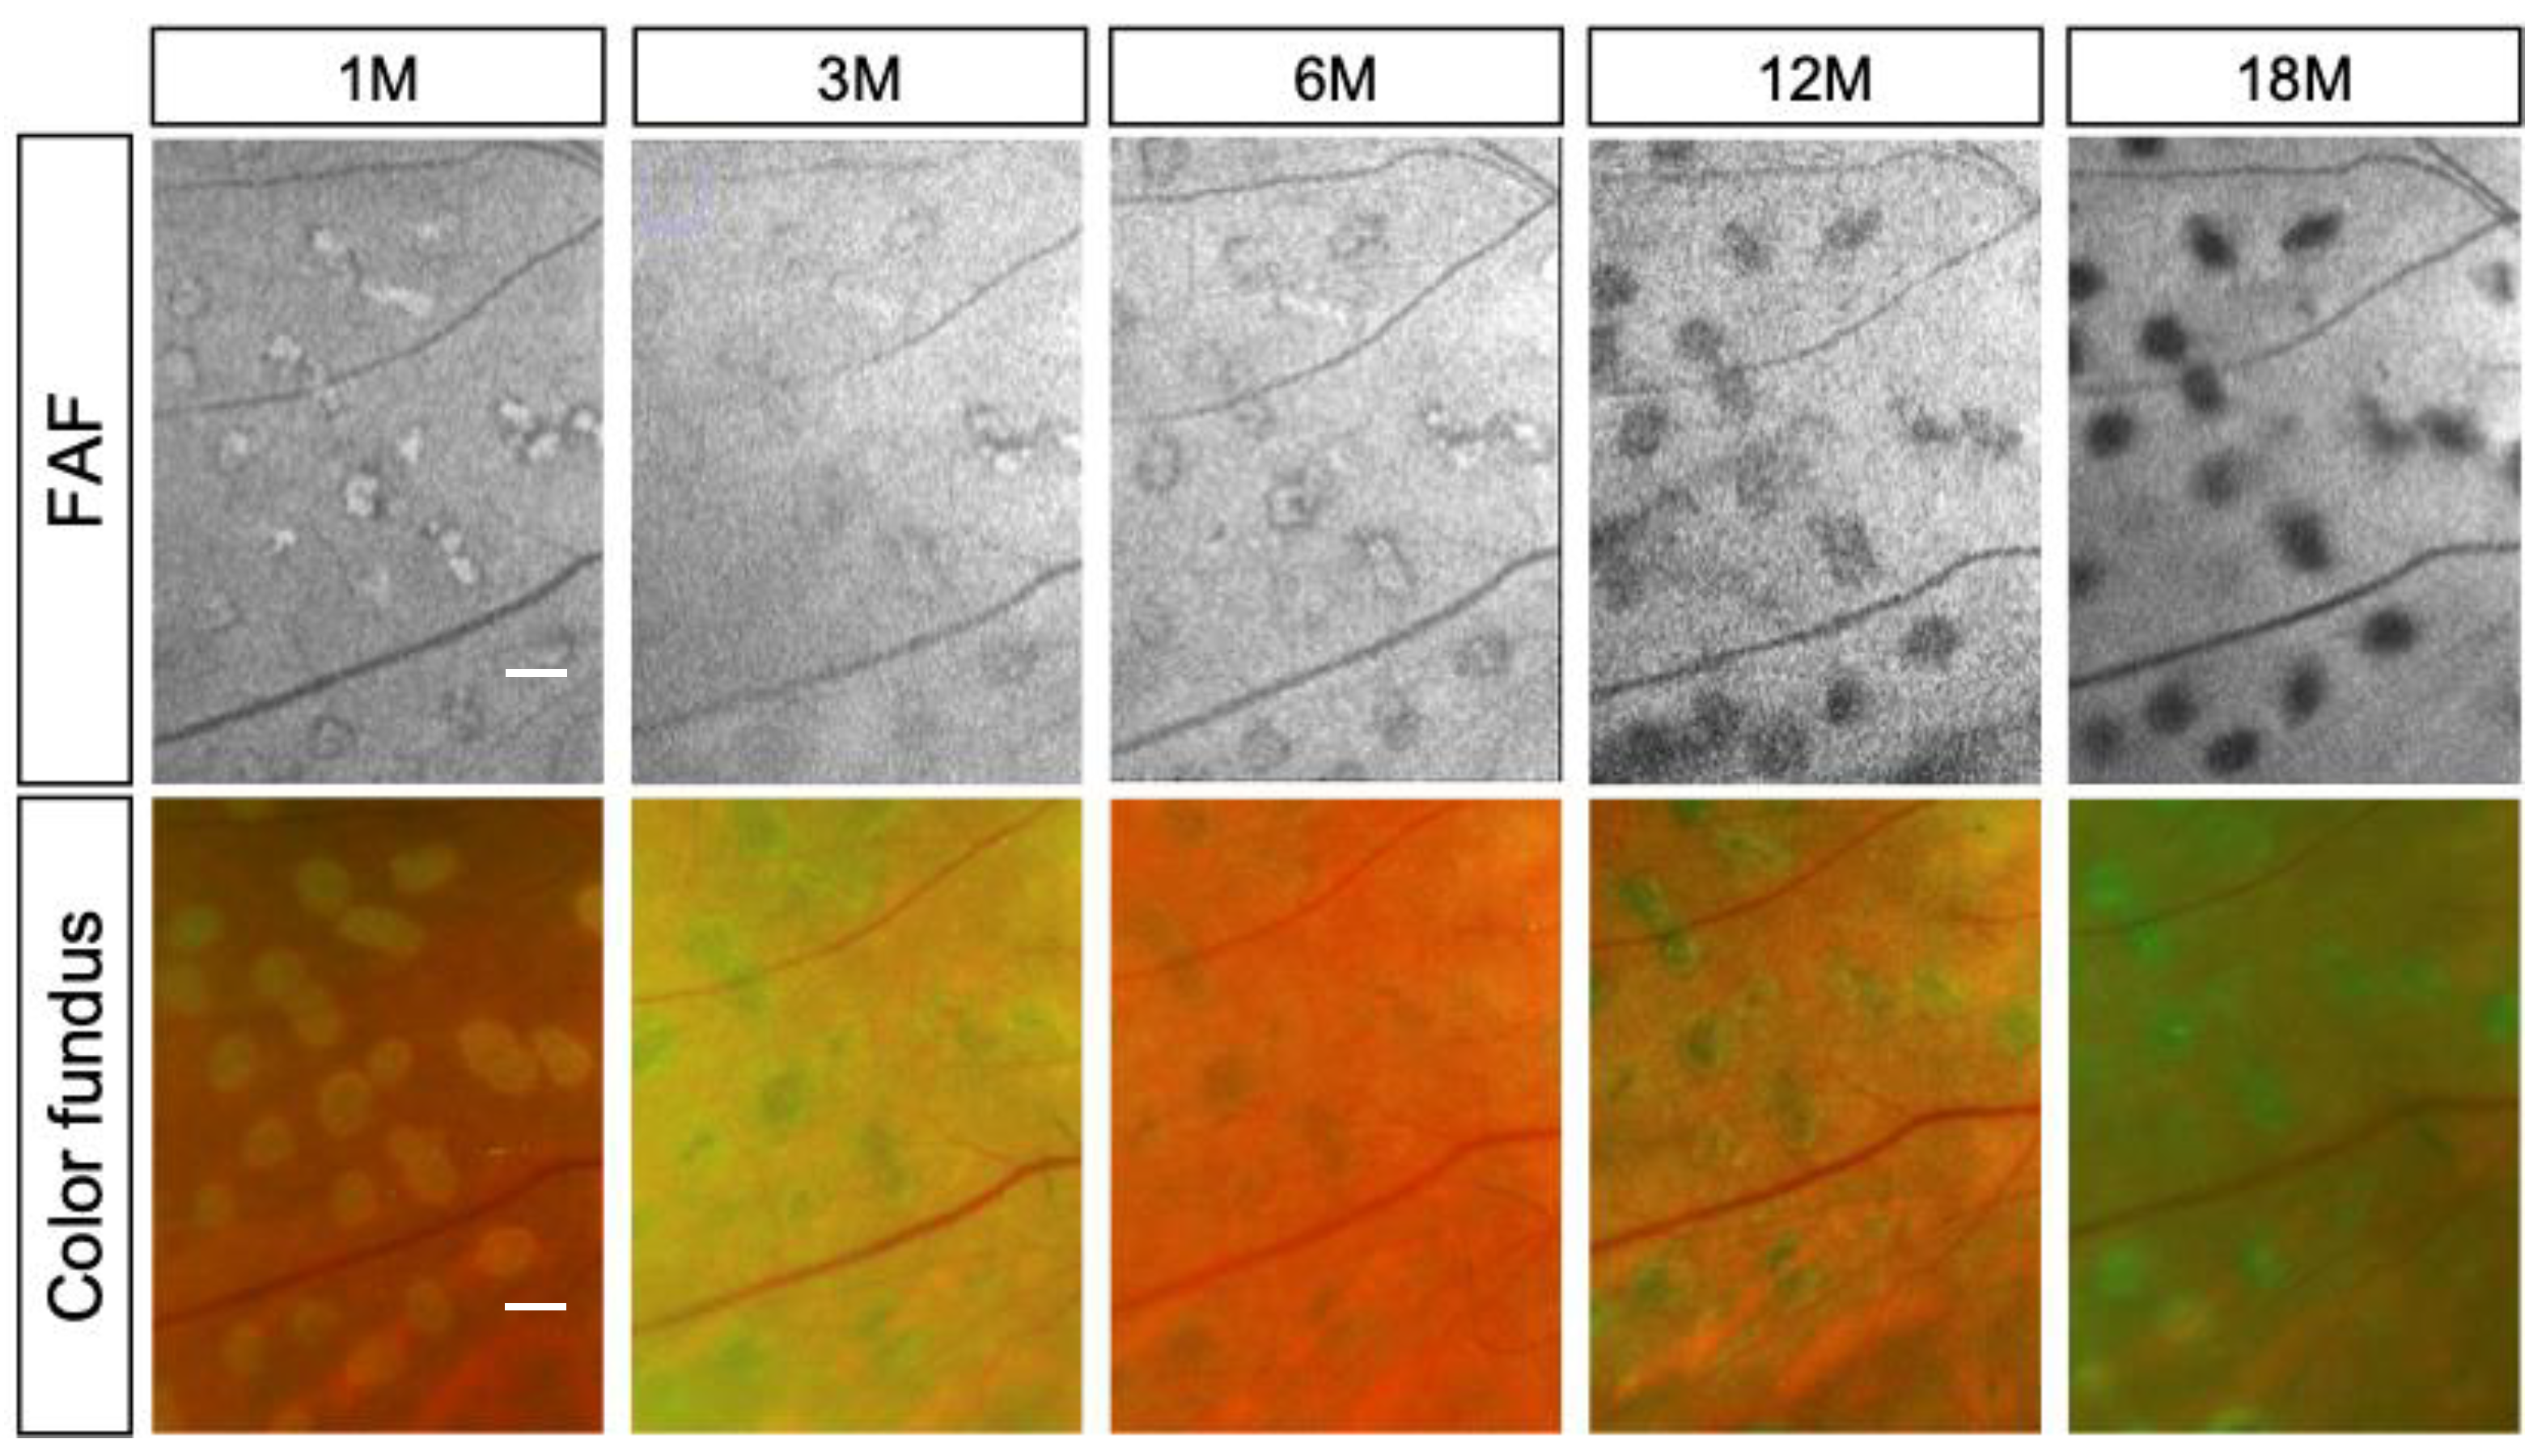
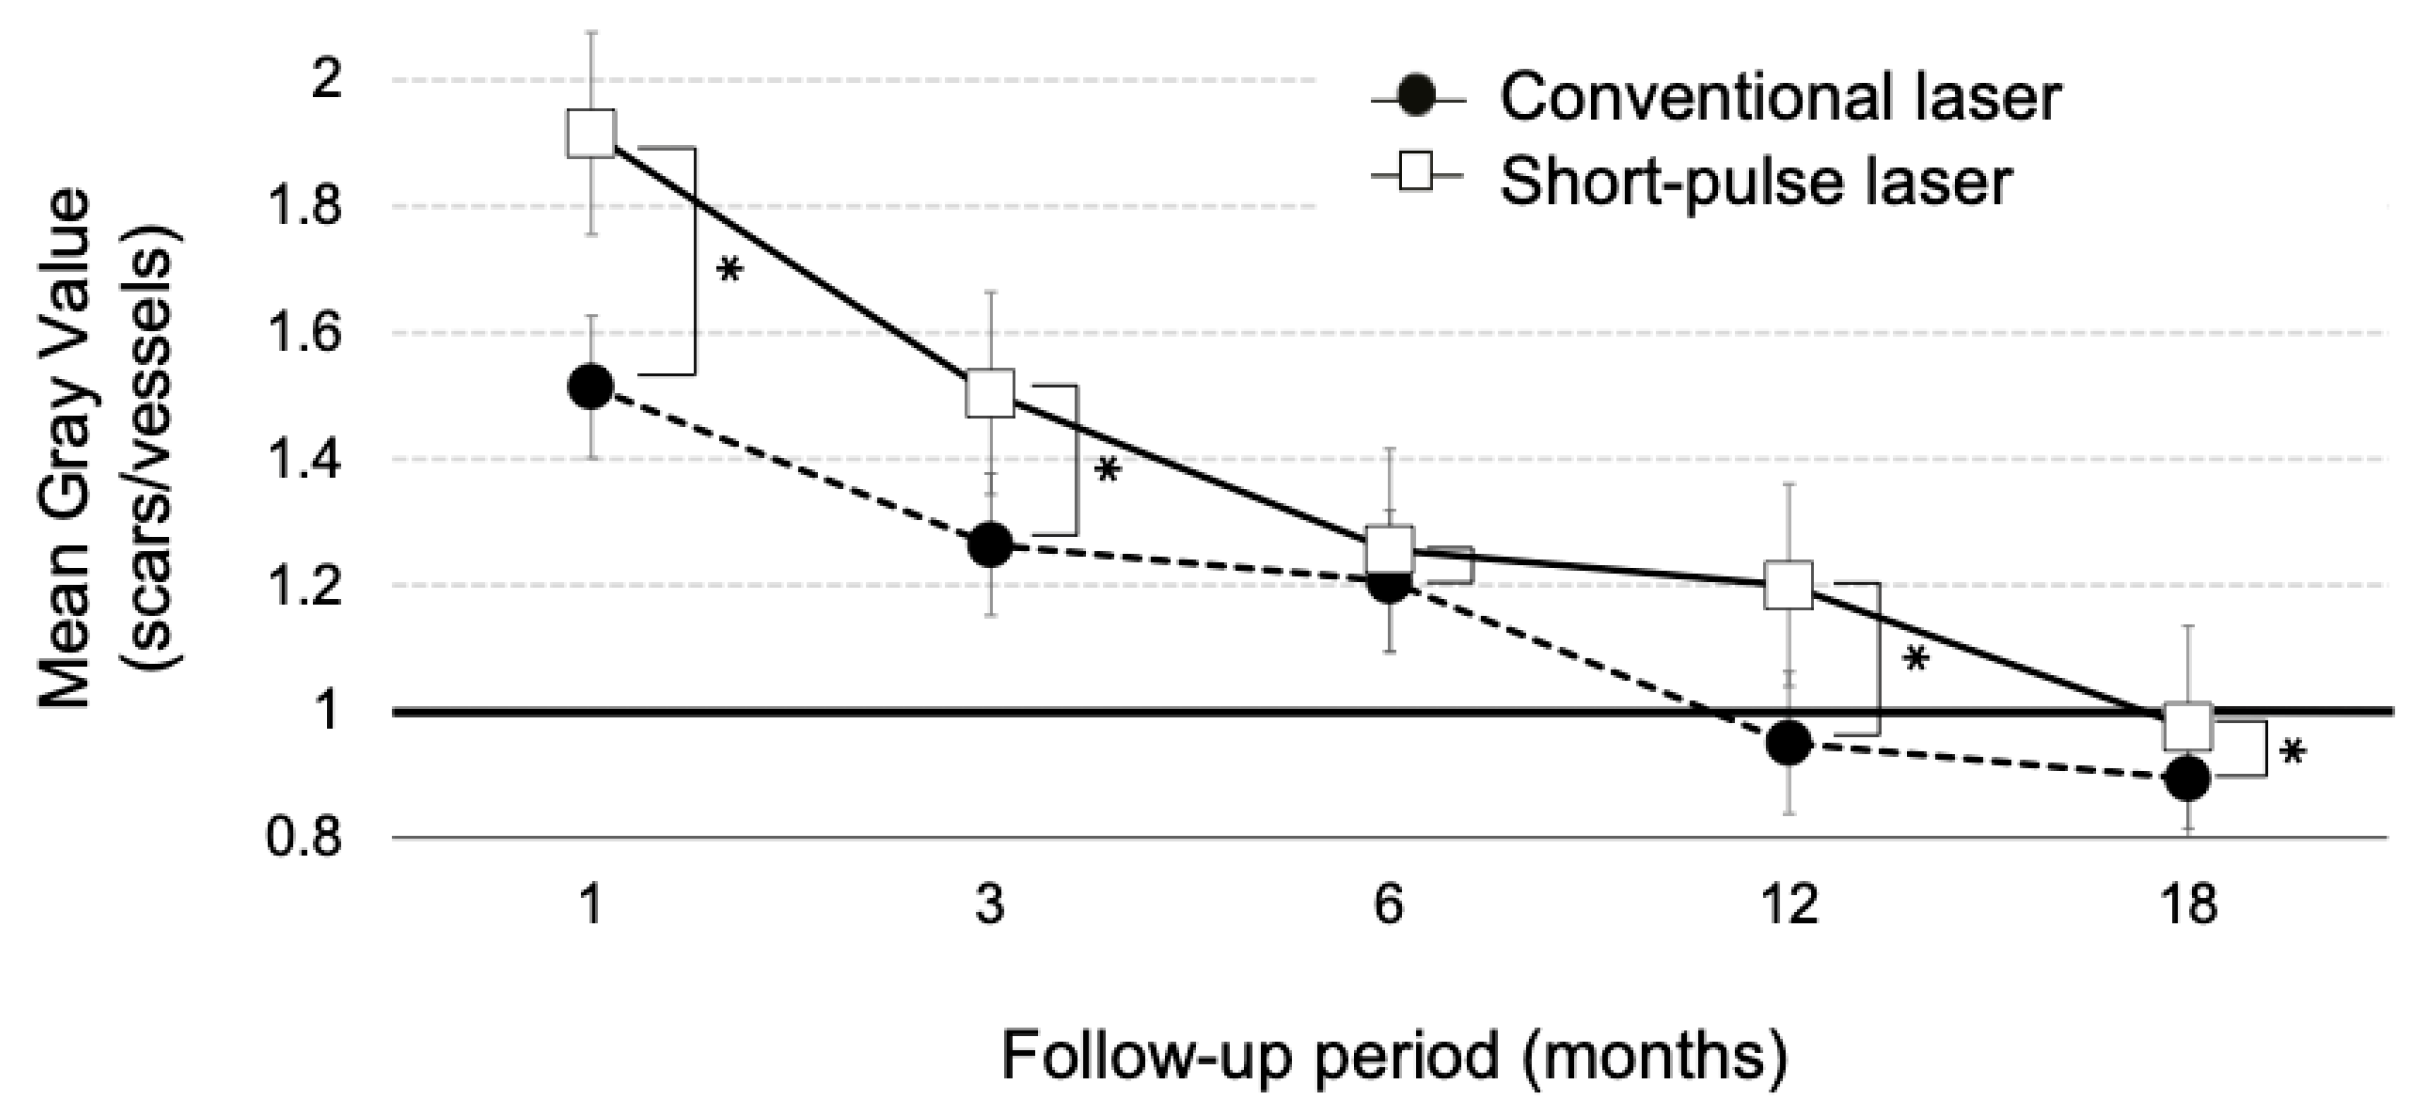
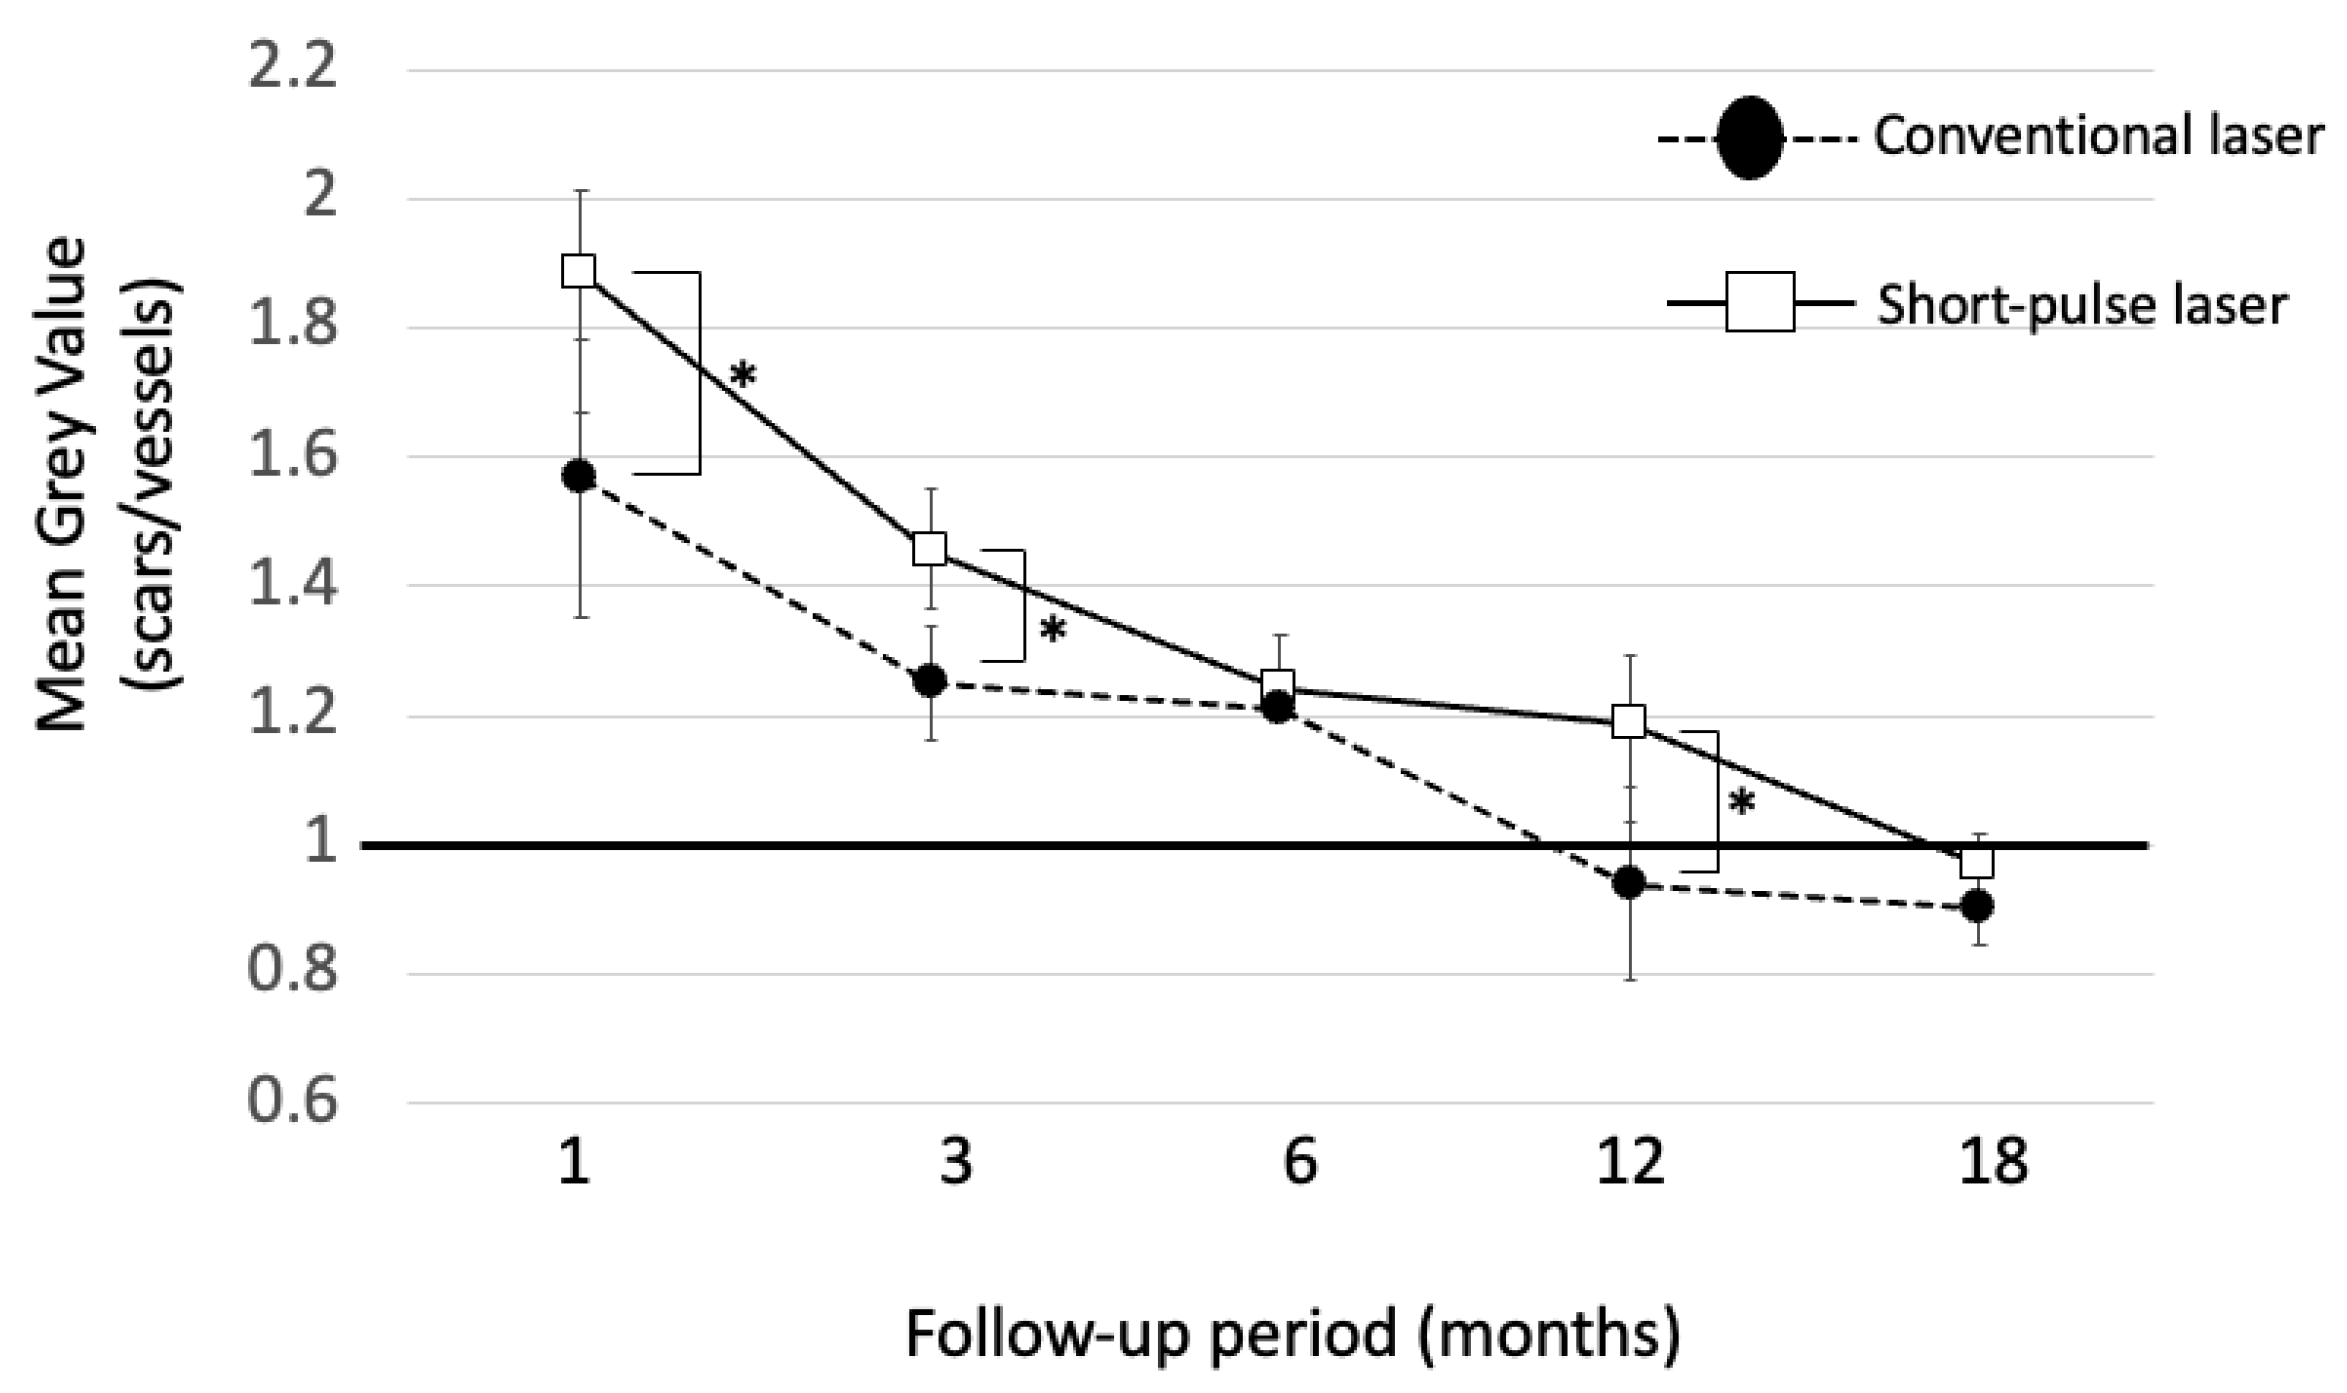
3.4. Luminosity Ratio of the Photocoagulation Scars
4. Discussion
5. Conclusions
Author Contributions
Funding
Institutional Review Board Statement
Informed Consent Statement
Data Availability Statement
Conflicts of Interest
References
- Yau, J.W.; Rogers, S.L.; Kawasaki, R.; Lamoureux, E.L.; Kowalski, J.W.; Bek, T.; Chen, S.J.; Dekker, J.M.; Fletcher, A.; Grauslund, J.; et al. Global prevalence and major risk factors of diabetic retinopathy. Diabetes Care 2012, 35, 556–564. [Google Scholar] [CrossRef]
- NCD Risk Factor Collaboration. Worldwide trends in diabetes since 1980: A pooled analysis of 751 population-based studies with 4.4 million participants. Lancet 2016, 387, 1513–1530. [Google Scholar] [CrossRef]
- Cheung, N.; Mitchell, P.; Wong, T.Y. Diabetic retinopathy. Lancet 2010, 376, 124–136. [Google Scholar] [CrossRef]
- Lally, D.R.; Shah, C.P.; Heier, J.S. Vascular endothelial growth factor and diabetic macular edema. Surv. Ophthalmol. 2016, 61, 759–768. [Google Scholar] [CrossRef]
- Early Photocoagulation for Diabetic Retinopathy. ETDRS report number 9. Early Treatment Diabetic Retinopathy Study Research Group. Ophthalmology 1991, 98, 766–785. [Google Scholar]
- Pearson, A.R.; Tanner, V.; Keightley, S.J.; Casswell, A.G. What effect does laser photocoagulation have on driving visual fields in diabetics? Eye 1998, 12 Pt 1, 64–68. [Google Scholar] [CrossRef]
- Takamura, Y.; Arimura, S.; Miyake, S.; Matsumura, T.; Gozawa, M.; Iwasaki, K.; Inatani, M. Panretinal Photocoagulation Using Short-Pulse Laser Induces Less Inflammation and Macular Thickening in Patients with Diabetic Retinopathy. J. Ophthalmol. 2017, 2017, 8530261. [Google Scholar] [CrossRef]
- Ulbig, M.R.; Arden, G.B.; Hamilton, A.M. Color contrast sensitivity and pattern electroretinographic findings after diode and argon laser photocoagulation in diabetic retinopathy. Am. J. Ophthalmol. 1994, 117, 583–588. [Google Scholar] [CrossRef]
- Blumenkranz, M.S.; Yellachich, D.; Andersen, D.E.; Wiltberger, M.W.; Mordaunt, D.; Marcellino, G.R.; Palanker, D. Semiautomated patterned scanning laser for retinal photocoagulation. Retina 2006, 26, 370–376. [Google Scholar] [CrossRef]
- Sanghvi, C.; McLauchlan, R.; Delgado, C.; Young, L.; Charles, S.J.; Marcellino, G.; Stanga, P.E. Initial experience with the Pascal photocoagulator: A pilot study of 75 procedures. Br. J. Ophthalmol. 2008, 92, 1061–1064. [Google Scholar] [CrossRef]
- Muqit, M.M.; Marcellino, G.R.; Gray, J.C.; McLauchlan, R.; Henson, D.B.; Young, L.B.; Patton, N.; Charles, S.J.; Turner, G.S.; Stanga, P.E. Pain responses of Pascal 20 ms multi-spot and 100 ms single-spot panretinal photocoagulation: Manchester Pascal Study, MAPASS report 2. Br. J. Ophthalmol. 2010, 94, 1493–1498. [Google Scholar] [CrossRef]
- Ito, A.; Hirano, Y.; Nozaki, M.; Ashikari, M.; Sugitani, K.; Ogura, Y. Short pulse laser induces less inflammatory cytokines in the murine retina after laser photocoagulation. Ophthalmic. Res. 2015, 53, 65–73. [Google Scholar] [CrossRef]
- Chappelow, A.V.; Tan, K.; Waheed, N.K.; Kaiser, P.K. Panretinal photocoagulation for proliferative diabetic retinopathy: Pattern scan laser versus argon laser. Am. J. Ophthalmol. 2012, 153, 137–142.e2. [Google Scholar] [CrossRef]
- Muqit, M.M.; Marcellino, G.R.; Henson, D.B.; Young, L.B.; Turner, G.S.; Stanga, P.E. Pascal panretinal laser ablation and regression analysis in proliferative diabetic retinopathy: Manchester Pascal Study Report 4. Eye 2011, 25, 1447–1456. [Google Scholar] [CrossRef]
- Nishida, K.; Sakaguchi, H.; Kamei, M.; Shiraki, N.; Oura, Y.; Wakabayashi, T.; Hara, C.; Fukushima, Y.; Sato, T.; Sayanagi, K.; et al. Simulation of panretinal laser photocoagulation using geometric methods for calculating the photocoagulation index. Eur. J. Ophthalmol. 2017, 27, 205–209. [Google Scholar] [CrossRef]
- Brancato, R.; Pece, A.; Avanza, P.; Radrizzani, E. Photocoagulation scar expansion after laser therapy for choroidal neovascularization in degenerative myopia. Retina 1990, 10, 239–243. [Google Scholar] [CrossRef]
- Maeshima, K.; Utsugi-Sutoh, N.; Otani, T.; Kishi, S. Progressive enlargement of scattered photocoagulation scars in diabetic retinopathy. Retina 2004, 24, 507–511. [Google Scholar] [CrossRef]
- Nagpal, M.; Marlecha, S.; Nagpal, K. Comparison of laser photocoagulation for diabetic retinopathy using 532-nm standard laser versus multispot pattern scan laser. Retina 2010, 30, 452–458. [Google Scholar] [CrossRef]
- Schatz, H.; Madeira, D.; McDonald, H.R.; Johnson, R.N. Progressive enlargement of laser scars following grid laser photocoagulation for diffuse diabetic macular edema. Arch. Ophthalmol. 1991, 109, 1549–1551. [Google Scholar] [CrossRef]
- Shiraya, T.; Kato, S.; Shigeeda, T.; Yamaguchi, T.; Kaiya, T. Comparison of burn size after retinal photocoagulation by conventional and high-power short-duration methods. Acta Ophthalmol. 2014, 92, e585–e586. [Google Scholar] [CrossRef]
- Higaki, M.; Nozaki, M.; Yoshida, M.; Ogura, Y. Less Expansion of Short-Pulse Laser Scars in Panretinal Photocoagulation for Diabetic Retinopathy. J. Ophthalmol. 2018, 2018, 9371895. [Google Scholar] [CrossRef] [PubMed]
- Muqit, M.M.; Gray, J.C.; Marcellino, G.R.; Henson, D.B.; Young, L.B.; Charles, S.J.; Turner, G.S.; Stanga, P.E. Fundus autofluorescence and Fourier-domain optical coherence tomography imaging of 10 and 20 millisecond Pascal retinal photocoagulation treatment. Br. J. Ophthalmol. 2009, 93, 518–525. [Google Scholar] [CrossRef] [PubMed]
- Bindewald, A.; Bird, A.C.; Dandekar, S.S.; Dolar-Szczasny, J.; Dreyhaupt, J.; Fitzke, F.W.; Einbock, W.; Holz, F.G.; Jorzik, J.J.; Keilhauer, C.; et al. Classification of fundus autofluorescence patterns in early age-related macular disease. Investig. Ophthalmol. Vis. Sci. 2005, 46, 3309–3314. [Google Scholar] [CrossRef] [PubMed]
- Ogura, S.; Yasukawa, T.; Kato, A.; Usui, H.; Hirano, Y.; Yoshida, M.; Ogura, Y. Wide-field fundus autofluorescence imaging to evaluate retinal function in patients with retinitis pigmentosa. Am. J. Ophthalmol. 2014, 158, 1093–1098. [Google Scholar] [CrossRef] [PubMed]
- Robson, A.G.; Saihan, Z.; Jenkins, S.A.; Fitzke, F.W.; Bird, A.C.; Webster, A.R.; Holder, G.E. Functional characterisation and serial imaging of abnormal fundus autofluorescence in patients with retinitis pigmentosa and normal visual acuity. Br. J. Ophthalmol. 2006, 90, 472–479. [Google Scholar] [CrossRef] [PubMed]
- Ahmed, J.; Braun, R.D.; Dunn, R., Jr.; Linsenmeier, R.A. Oxygen distribution in the macaque retina. Investig. Ophthalmol. Vis. Sci. 1993, 34, 516–521. [Google Scholar]
- Haugh, L.M.; Linsenmeier, R.A.; Goldstick, T.K. Mathematical models of the spatial distribution of retinal oxygen tension and consumption, including changes upon illumination. Ann. Biomed. Eng. 1990, 18, 19–36. [Google Scholar] [CrossRef] [PubMed]
- Wang, L.; Kondo, M.; Bill, A. Glucose metabolism in cat outer retina: Effects of light and hyperoxia. Investig. Ophthalmol. Vis. Sci. 1997, 38, 48–55. [Google Scholar]
- Witmer, A.N.; Vrensen, G.F.; Van Noorden, C.J.; Schlingemann, R.O. Vascular endothelial growth factors and angiogenesis in eye disease. Prog. Retin. Eye Res. 2003, 22, 1–29. [Google Scholar] [CrossRef]
- Budzynski, E.; Smith, J.H.; Bryar, P.; Birol, G.; Linsenmeier, R.A. Effects of photocoagulation on intraretinal PO2 in cat. Investig. Ophthalmol. Vis. Sci. 2008, 49, 380–389. [Google Scholar] [CrossRef]
- Stefánsson, E. Ocular oxygenation and the treatment of diabetic retinopathy. Surv. Ophthalmol. 2006, 51, 364–380. [Google Scholar] [CrossRef] [PubMed]
- Muqit, M.M.; Gray, J.C.; Marcellino, G.R.; Henson, D.B.; Young, L.B.; Patton, N.; Charles, S.J.; Turner, G.S.; Dick, A.D.; Stanga, P.E. In vivo laser-tissue interactions and healing responses from 20- vs 100-millisecond pulse Pascal photocoagulation burns. Arch. Ophthalmol. 2010, 128, 448–455. [Google Scholar] [CrossRef] [PubMed]
- Stitt, A.W.; Gardiner, T.A.; Archer, D.B. Retinal and choroidal responses to panretinal photocoagulation: An ultrastructural perspective. Graefes Arch. Clin. Exp. Ophthalmol. 1995, 233, 699–705. [Google Scholar] [CrossRef]
- Schmitz-Valckenberg, S.; Holz, F.G.; Bird, A.C.; Spaide, R.F. Fundus autofluorescence imaging: Review and perspectives. Retina 2008, 28, 385–409. [Google Scholar] [CrossRef] [PubMed]
- Framme, C.; Roider, J. Immediate and long-term changes of fundus autofluorescence in continuous wave laser lesions of the retina. Ophthalmic Surg. Lasers Imaging 2004, 35, 131–138. [Google Scholar] [CrossRef] [PubMed]
- Muqit, M.M.; Denniss, J.; Nourrit, V.; Marcellino, G.R.; Henson, D.B.; Schiessl, I.; Stanga, P.E. Spatial and spectral imaging of retinal laser photocoagulation burns. Investig. Ophthalmol. Vis. Sci. 2011, 52, 994–1002. [Google Scholar] [CrossRef] [PubMed]
- Hessemer, V.; Schmidt, K.G. Influence of panretinal photocoagulation on the ocular pulse curve. Am. J. Ophthalmol. 1997, 123, 748–752. [Google Scholar] [CrossRef]
- Hiroshiba, N.; Ogura, Y.; Nishiwaki, H.; Miyamoto, K.; Honda, Y. Alterations of retinal microcirculation in response to scatter photocoagulation. Investig. Ophthalmol. Vis. Sci. 1998, 39, 769–776. [Google Scholar]
- Iwase, T.; Kobayashi, M.; Yamamoto, K.; Ra, E.; Terasaki, H. Effects of photocoagulation on ocular blood flow in patients with severe non-proliferative diabetic retinopathy. PLoS ONE 2017, 12, e0174427. [Google Scholar] [CrossRef]
- Mendivil, A.; Cuartero, V. Ocular blood flow velocities in patients with proliferative diabetic retinopathy after scatter photocoagulation. Two years of follow-up. Retina 1996, 16, 222–227. [Google Scholar] [CrossRef]
- Iwase, T.; Mikoshiba, Y.; Ra, E.; Yamamoto, K.; Ueno, Y.; Terasaki, H. Evaluation of blood flow on optic nerve head after pattern scan and conventional laser panretinal photocoagulation. Medicine 2019, 98, e16062. [Google Scholar] [CrossRef] [PubMed]
- Yamada, Y.; Suzuma, K.; Onizuka, N.; Uematsu, M.; Mohamed, Y.H.; Kitaoka, T. Evaluation of retinal blood flow before and after panretinal photocoagulation using pattern scan laser for diabetic retinopathy. Curr. Eye Res. 2017, 42, 1707–1712. [Google Scholar] [CrossRef] [PubMed]
- Bressler, S.B.; Beaulieu, W.T.; Glassman, A.R.; Gross, J.G.; Jampol, L.M.; Melia, M.; Peters, M.A.; Rauser, M.E.; Diabetic Retinopathy Clinical Research Network. Factors Associated with Worsening Proliferative Diabetic Retinopathy in Eyes Treated with Panretinal Photocoagulation or Ranibizumab. Ophthalmology 2017, 124, 431–439. [Google Scholar] [CrossRef] [PubMed]
- Friberg, T.R.; Karatza, E.C. The treatment of macular disease using a micropulsed and continuous wave 810-nm diode laser. Ophthalmology 1997, 104, 2030–2038. [Google Scholar] [CrossRef] [PubMed]
- Lavinsky, D.; Wang, J.; Huie, P.; Dalal, R.; Lee, S.J.; Lee, D.Y.; Palanker, D. Nondamaging retinal laser therapy: Rationale and applications to the macula. Investig. Ophthalmol. Vis. Sci. 2016, 57, 2488–2500. [Google Scholar] [CrossRef]
- Luttrull, J.K.; Sramek, C.; Palanker, D.; Spink, C.J.; Musch, D.C. Long-term safety, high-resolution imaging, and tissue temperature modeling of subvisible diode micropulse photocoagulation for retinovascular macular edema. Retina 2012, 32, 375–386. [Google Scholar] [CrossRef]
- Luttrull, J.K.; Sinclair, S.H. Safety of transfoveal subthreshold diode micropulse laser for fovea-involving diabetic macular edema in eyes with good visual acuity. Retina 2014, 34, 2010–2020. [Google Scholar] [CrossRef]
- Kunbei, L.; Hongkun, Z.; Lijun, Z.; Chuangxin, H.; Xiaojing, Z.; Yajun, G.; Longhui, L.; Fabao, X.; Cong, L.; Lin, L.; et al. Subthreshold Pan-Retinal Photocoagulation Using Endpoint Management Algorithm for Severe Nonproliferative Diabetic Retinopathy: A Paired Controlled Pilot Prospective Study. Ophthalmic Res. 2021, 64, 648–655. [Google Scholar]
- Luttrull, J.K.; Musch, D.C.; Spink, C.A. Subthreshold diode micropulse panretinal photocoagulation for proliferative diabetic retinopathy. Eye 2008, 22, 607–612. [Google Scholar] [CrossRef]
- Gawęcki, M. Micropulse Laser Treatment of Retinal Diseases. J. Clin. Med. 2019, 8, 242. [Google Scholar] [CrossRef]
- Gozawa, M.; Takamura, Y.; Miyake, S.; Matsumura, T.; Morioka, M.; Yamada, Y.; Inatani, M. Photocoagulation of the Retinal Nonperfusion Area Prevents the Expression of the Vascular Endothelial Growth Factor in an Animal Model. Investig. Ophthalmol. Vis. Sci. 2017, 58, 5646–5653. [Google Scholar] [CrossRef]
- Yonekawa, Y.; Modi, Y.S.; Kim, L.A.; Skondra, D.; Kim, J.E.; Wykoff, C.C. American Society of Retina Specialists Clinical Practice Guidelines on the Management of Nonproliferative and Proliferative Diabetic Retinopathy without Diabetic Macular Edema. J. Vitreoretin. Dis. 2020, 4, 125–135. [Google Scholar] [CrossRef]


| Conventional Laser | Short-Pulse Laser | p | |
|---|---|---|---|
| Number of eyes | 6 | 7 | |
| Mean age, years old | 67.8 ± 7.6 | 61.6 ± 10.4 | 0.32 a |
| Male: Femal | 5:1 | 6:1 | 1.0 b |
| NPDR: PDR | 4:2 | 6:1 | 0.52 b |
| Phakik eyes: pseudophakic eyes | 5:1 | 7:0 | 1.0 b |
| Conventional Laser | Short-Pulse Laser | |
|---|---|---|
| Spot size (μm) | 200 | 200 |
| Spacing (spot) | 1 | 0.75 |
| Pulse duration (ms) | 200 | 20 |
| Power (mW) | 100–269 | 300–500 |
| Wavelength (nm) | 577 | 577 |
| Mean number of total PRP shots | 1124 ± 303 | 3757 ± 693 |
| 1 Month | 3 Months | 6 Months | 12 Months | 18 Months | |
|---|---|---|---|---|---|
| NPDR (n = 10) | 1.76 ± 0.21 | 1.37± 0.13 | 1.23 ± 0.06 | 1.09 ± 0.16 | 0.94 ± 0.06 |
| PDR (n = 3) | 1.64 ± 0.34 | 1.46 ± 0.25 | 1.25 ± 0.08 | 1.07 ± 0.15 | 0.92 ± 0.06 |
| p-value | 0.26 | 0.23 | 0.35 | 0.46 | 0.30 |
Disclaimer/Publisher’s Note: The statements, opinions and data contained in all publications are solely those of the individual author(s) and contributor(s) and not of MDPI and/or the editor(s). MDPI and/or the editor(s) disclaim responsibility for any injury to people or property resulting from any ideas, methods, instructions or products referred to in the content. |
© 2023 by the authors. Licensee MDPI, Basel, Switzerland. This article is an open access article distributed under the terms and conditions of the Creative Commons Attribution (CC BY) license (https://creativecommons.org/licenses/by/4.0/).
Share and Cite
Kimura, T.; Ogura, S.; Yasukawa, T.; Nozaki, M. Quantitative Evaluation of Fundus Autofluorescence in Laser Photocoagulation Scars for Diabetic Retinopathy: Conventional vs. Short-Pulse Laser. Life 2023, 13, 1901. https://doi.org/10.3390/life13091901
Kimura T, Ogura S, Yasukawa T, Nozaki M. Quantitative Evaluation of Fundus Autofluorescence in Laser Photocoagulation Scars for Diabetic Retinopathy: Conventional vs. Short-Pulse Laser. Life. 2023; 13(9):1901. https://doi.org/10.3390/life13091901
Chicago/Turabian StyleKimura, Toshiya, Shuntaro Ogura, Tsutomu Yasukawa, and Miho Nozaki. 2023. "Quantitative Evaluation of Fundus Autofluorescence in Laser Photocoagulation Scars for Diabetic Retinopathy: Conventional vs. Short-Pulse Laser" Life 13, no. 9: 1901. https://doi.org/10.3390/life13091901
APA StyleKimura, T., Ogura, S., Yasukawa, T., & Nozaki, M. (2023). Quantitative Evaluation of Fundus Autofluorescence in Laser Photocoagulation Scars for Diabetic Retinopathy: Conventional vs. Short-Pulse Laser. Life, 13(9), 1901. https://doi.org/10.3390/life13091901