Article

Comparing Methodologies for Stomatal Analyses in the Context of Elevated Modern CO2

by
Rebekah A. Stein
1,*,
Nathan D. Sheldon
2,* and
Selena Y. Smith
2,*
1
Department of Chemistry & Physical Sciences, Quinnipiac University, Hamden, CT 06518, USA
2
Department of Earth and Environmental Sciences, University of Michigan, Ann Arbor, MI 48109, USA
*
Authors to whom correspondence should be addressed.
Life 2024, 14(1), 78; https://doi.org/10.3390/life14010078
Submission received: 21 November 2023 / Revised: 19 December 2023 / Accepted: 30 December 2023 / Published: 2 January 2024
(This article belongs to the Section Plant Science)

Abstract

:
Leaf stomata facilitate the exchange of water and CO2 during photosynthetic gas exchange. The shape, size, and density of leaf pores have not been constant over geologic time, and each morphological trait has potentially been impacted by changing environmental and climatic conditions, especially by changes in the concentration of atmospheric carbon dioxide. As such, stomatal parameters have been used in simple regressions to reconstruct ancient carbon dioxide, as well as incorporated into more complex gas-exchange models that also leverage plant carbon isotope ecology. Most of these proxy relationships are measured on chemically cleared leaves, although newer techniques such as creating stomatal impressions are being increasingly employed. Additionally, many of the proxy relationships use angiosperms with broad leaves, which have been increasingly abundant in the last 130 million years but are absent from the fossil record before this. We focus on the methodology to define stomatal parameters for paleo-CO2 studies using two separate methodologies (one corrosive, one non-destructive) to prepare leaves on both scale- and broad-leaves collected from herbaria with known global atmospheric CO2 levels. We find that the corrosive and non-corrosive methodologies give similar values for stomatal density, but that measurements of stomatal sizes, particularly guard cell width (GCW), for the two methodologies are not comparable. Using those measurements to reconstruct CO2 via the gas exchange model, we found that reconstructed CO2 based on stomatal impressions (due to inaccurate measurements in GCW) far exceeded measured CO2 for modern plants. This bias was observed in both coniferous (scale-shaped) and angiosperm (broad) leaves. Thus, we advise that applications of gas exchange models use cleared leaves rather than impressions.

1. Introduction

The inverse relationship between the quantity of stomata on leaf surfaces and the concentration of atmospheric carbon dioxide ([CO2]) has been documented and established as a tool for reconstructing paleo-CO2 [1,2,3,4]. This inverse relationship is driven by the resource cost of stomata, as though there is active stomatal closure, these pores can be "leaky," and a higher density of the cells can result in higher transpiration rates [5,6,7]. Thus, in times of high CO2, leaves can reduce the number of stomata (i.e., lower the density of stomata on the leaf surface) and still assimilate sufficient CO2 [8,9,10,11]. However, other environmental factors (e.g., water stress) can impact stomatal density, and other stomatal features, such as their size (i.e., width, length, area, and shape), are not constant across plant groups and may be influenced by environmental factors as well [12]. As such, mechanistic models have been introduced to incorporate additional stomatal variables [13,14].
The inverse relationship between stomatal density and [CO2] has been tested on fossil plants and within highly controlled growth chamber experiments [13,15,16], but it is less clear how quickly plants respond to changes in atmospheric CO2 in the natural world [17]. For example, many plants show little or no change in C isotope assimilation over the period of Industrialization [18,19,20,21] in spite of increasing [CO2]. Due to anthropogenic climate change, it is imperative that we understand how adaptive plants are to rising CO2, such that we can quantify the biosphere’s potential as a carbon sink [22,23,24] and predict crop yields [25,26,27]. Excessively slow responses of stomatal parameters can be problematic because, in addition to being inlets for CO2, these stomata are outlets for water, which could result in excessive water leakage and limit plant growth, especially in water-limited environments [28].
In addition to density, stomatal cell parameters such as guard cell length (GCL) and guard cell width (GCW) are controlled by environmental conditions in the short term and by evolution over long time scales. Previous work has shown that CO2 reconstruction proxies based on stomata are most accurate when considering stomata size as well [29]. Genome size is strongly predictive of GCL in angiosperms [29,30], suggesting there could be an evolutionary component to the stomatal response to stress; genome downsizing may have played a role in the evolution of angiosperms, facilitating higher densities of smaller stomata [31,32]. However, environmental factors also drive guard cell size. GCL in Arabidopsis thaliana also responded to atmospheric CO2, relative humidity, irradiance, UV radiation, and pathogens [33]. Specifically, relative humidity increases from 45 to 85% in controlled growth experiments caused an increase in 3% GCL. A controlled increase in CO2 from 380 to 3000 ppm and water availability from 10 mL d−1 to constant saturation both resulted in an increase in GCL of 6%; high irradiation increased GCL by 7%; and increased pathogens increased GCL by 10% [33]. Stomatal size and stomatal density may not be independent, as some workers report an inverse relationship between stomatal density and size [34,35,36,37,38]. Therefore, considering the full picture of the total surface area covered by stomata (stomatal size × stomatal density) can elucidate the total potential gas exchange capacity of a given leaf.
In this study, we collected a suite of modern and historical specimens from the families Cupressaceae (cypresses, junipers, and relatives) and Salicaceae (poplar, willows, and relatives) and measured stomatal parameters using two methodologies. One newer, non-toxic methodology (stomatal impression) uses tape and nitrocellulose dissolved in ethyl acetate (i.e., nail polish) to examine stomatal parameters [39,40]. The other methodology uses toxic, corrosive chromium trioxide (CrO3 [41,42]) or sodium hydroxide (NaOH [43]), which have been the conventional approaches since 1949. The goal of this work is to identify the strengths and weaknesses of each method in determining inputs for stomatal density-based and gas exchange model-based paleo-CO2 reconstructions by examining discrepancies in measurement sizes and outputs from the Franks et al. (2014) [13] model. This expands upon work done by Smith et al. (2014) [44] examining the difference between CO2-reconstructions based on macerations and impressions for stomatal frequency in Ginkgo. We compared the reconstructed [CO2] based on each method with known values measured at Mauna Loa Observatory, further helping us to identify the limitations of the impression compared with more typical leaf-clearing methodologies.

2. Materials and Methods

2.1. Specimen Sampling and Preparation

One hundred and seven total specimens from four species were sampled from herbarium (MICH) and field collections across North America. The focal genera, Thuja and Populus, are common temperate woody plants found throughout North America. There was no overlap in sites for the two species, but the ranges overlapped. Thuja sp. (n = 24), including Thuja occidentalis and Thuja plicata, and Populus tremuloides (n = 82) leaves were sampled from across field and herbarium collections. Molds of the leaf surfaces of intact, dried specimens were prepared using polyvinyl siloxane (dental putty; Affinis® wash Light Body, Coltene, Altstätten, Switzerland). Clear nitrocellulose in ethyl acetate (i.e., nail polish) was applied to these dental putty molds, then stripped using packing tape and placed directly on a glass slide for microscope analysis, producing an impression of the surface of the leaf. A subset of Thuja leaves (n = 10) and Populus leaves (n = 20) was also cleared using a 20% CrO3 solution and a 5% NaOH solution, respectively, to emphasize morphological features such as stomata [45] for comparison. It was not possible to reuse the exact leaf surfaces for maceration and impressions, but the same leaves were used. Once cleared, specimens were rinsed and run through an ethanol dehydration series before being mounted on glass slides in glycerin or between cellulose acetate and cedarwood oil, respectively, for analysis. No cover slides were placed.

2.2. Microscopy

Photographs of the cuticular morphology of each leaf were taken on a NikonLV100 optical microscope in the Plant Evolution, Paleobotany, and Paleoecology Research Laboratory at the University of Michigan using Nikon Instrument’s NIS-Elements v.5.2 software. Approximately three images were taken per slide at either 200× or 400× magnification (Table S1). Following photography, stomatal parameters (density, GCL, and GCW) were measured in ImageJ (v1.54) software [46,47] in a field area of ~0.10 mm2, exceeding the minimum value required for density measurements [48]. Density was measured as number of stomata per area (mm2), then converted to m2 three times, and then the average was reported. We excluded areas where stomata were not present [13] to account for species-specific patterns of stomatal distribution. GCL and GCW were measured six times total in μm (two separate stomata per image, three images total) and converted into m and averaged [15].

2.3. C Isotope Measurements

Isotope measurements of each specimen were conducted in the Earth Systems Science Lab at the University of Michigan, Ann Arbor. Each leaf sample was run in duplicate with two International Atomic Energy Agency standards: IAEA-CH-6 (sucrose: −10.45‰) and IAEA-600 (caffeine: −27.77‰) in addition to internal laboratory standards (acetanilide: −26.58‰). See Stein et al. (2019; 2021) [20,21] for detailed isotope analysis approaches. Environmental variables, including δ13Catm and [CO2] as measured at Mauna Loa Observatory (MLO [49]), mean annual precipitation, and mean annual temperature, were collected using PRISM Climate Group (2004) data [50].

2.4. Gas Exchange Model

Gas exchange calculations were conducted on both genera (Thuja and Populus) similarly, using different constants for species as discussed below. Isotope and stomatal parameter data were input into the Franks et al. (2014) model [13] (Equation (1)), where ca is [CO2], An is total CO2 assimilation rate, gc(tot) is total leaf conductance to CO2, and Ci/Ca is the ratio of internal to atmospheric CO2. To solve for ci/ca, we input known constants “a”: carbon isotope fractionation due to diffusion of CO2 in air (4.4‰), and “b”: fractionation associated with RuBisCO (30‰), as well as measured isotope values. δ13Catm values were measured at Mauna Loa Observatory [43], and δ13Cleaf values were measured at University of Michigan.
c a = A n / ( g c t o t   1 C i C a )
c i c a = [ ( δ 13 C a t m o s p h e r e δ 13 C l e a f ) 1 + δ 13 C l e a f 1000 ] a b a
To calculate gc(tot), a necessary parameter to reconstruct atmospheric CO2 (see Equation (1)), the leaf conductance model incorporates total possible conductance, which includes leaf boundary layer conductance to CO2, operational conductance, and mesophyll conductance [13]. Practically speaking, this requires a measurement to calculate gc(max), or maximum stomatal conductance, which is dependent on both the number and size of stomata. The number of stomata, or SD (stomatal density), and stomatal size were measured in ImageJ. To estimate size (specifically, size for conductance capacity), total stomatal aperture (amax) and depth were used, which were determined with direct measurements of guard cell width, guard cell length, and stomatal pore length (see Equation (4), β is determined in Franks et al., 2014 [13]).
g c ( m a x ) = d v   S D × a m a x ( 1 + π 2 a m a x π )
a m a x = β   ( π p 2 4 )
Combined, these equations create the full model in Equation (5), where An, b, a, d, β , and v are constants as determined in Franks et al. (2014) [13] and by known kinetic and equilibrium carbon isotope fractionation in plants, as mentioned above [51]. Stomatal density (SD), p, δ13Catm, and δ13Cleaf values are input based on our measurements.
c a = A n   d v   S D × β   ( π p 2 4 ) ( 1 + π 2 β   ( π p 2 4 ) π )   1 [ ( δ 13 C a t m o s p h e r e δ 13 C l e a f ) 1 + δ 13 C l e a f 1000 ] a b a  
This model uses measured stomatal density, GCL on both adaxial and abaxial surfaces, GCW on abaxial and adaxial surfaces, pore length, isotopic value of the leaves, isotopic value of the atmosphere, and [CO2]. As GCW increases and as GCL and stomatal density decrease, model-based estimates of CO2 increase. As δ13Cleaf values become more positive, model-based estimates of CO2 increase. Additionally, the model uses prescribed boundary layer conductance to CO2, present-day ci/ca [13], and photosynthetic rate (A0), which we prescribe based on Franks et al. (2014) [13] supplemental methods (ci/ca = 0.62, A0 = 14.8 for angiosperms, Populus tremuloides; and ci/ca = 0.50, A0 = 7.9 for gymnosperms, genus Thuja). Inferring a starting A0 value increases a degree of uncertainty [13]. The standard error of 10% included in the mechanistic model addresses this, but nonetheless, it is worth noting that there are a number of assumptions made in choosing these values. We prescribed pore length (prescribed the code s1 in the gas exchange model) as 0.33 for gymnosperms [13] and 0.30 for small angiosperm leaves.

3. Results

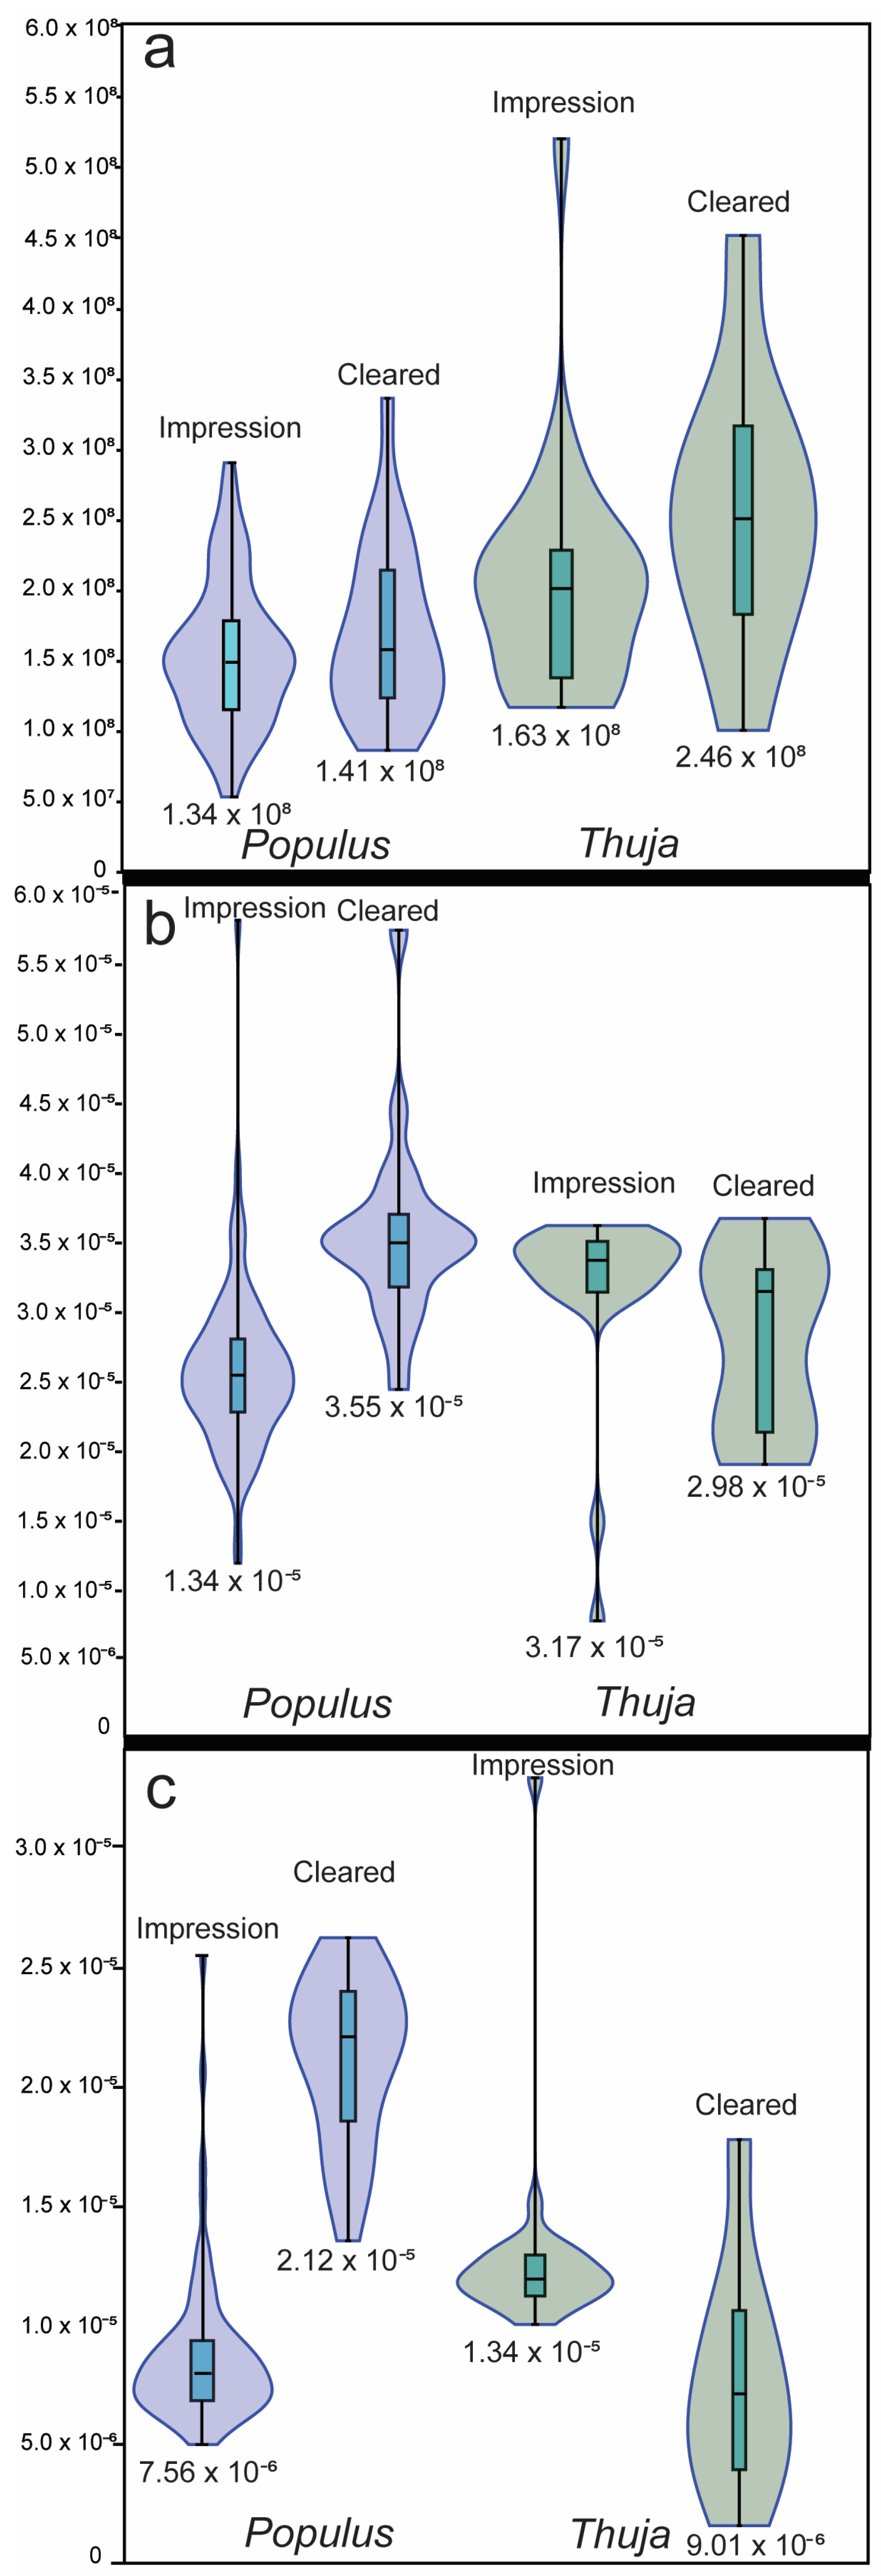
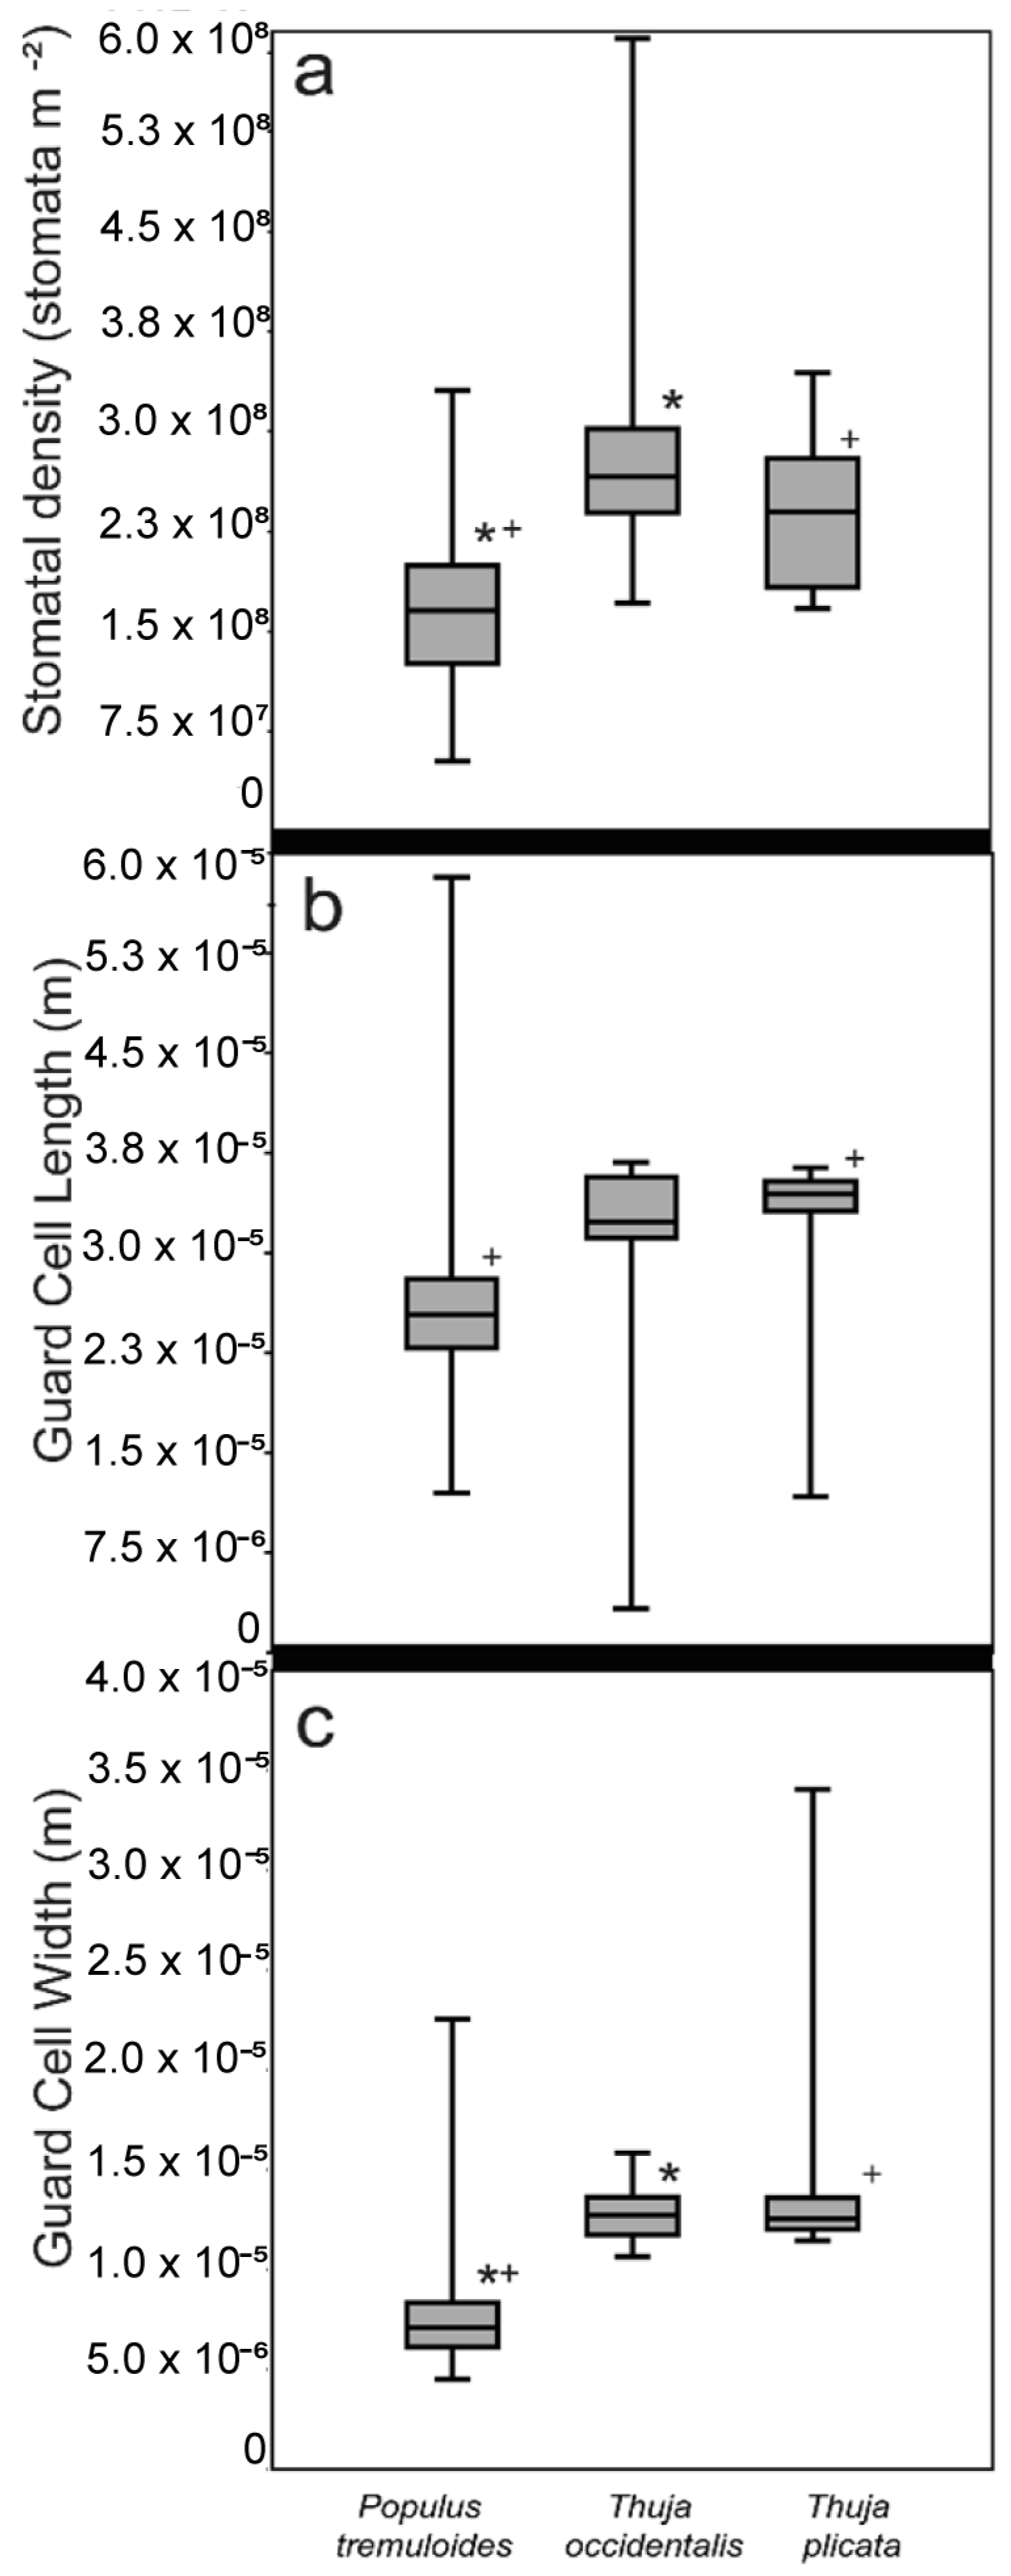
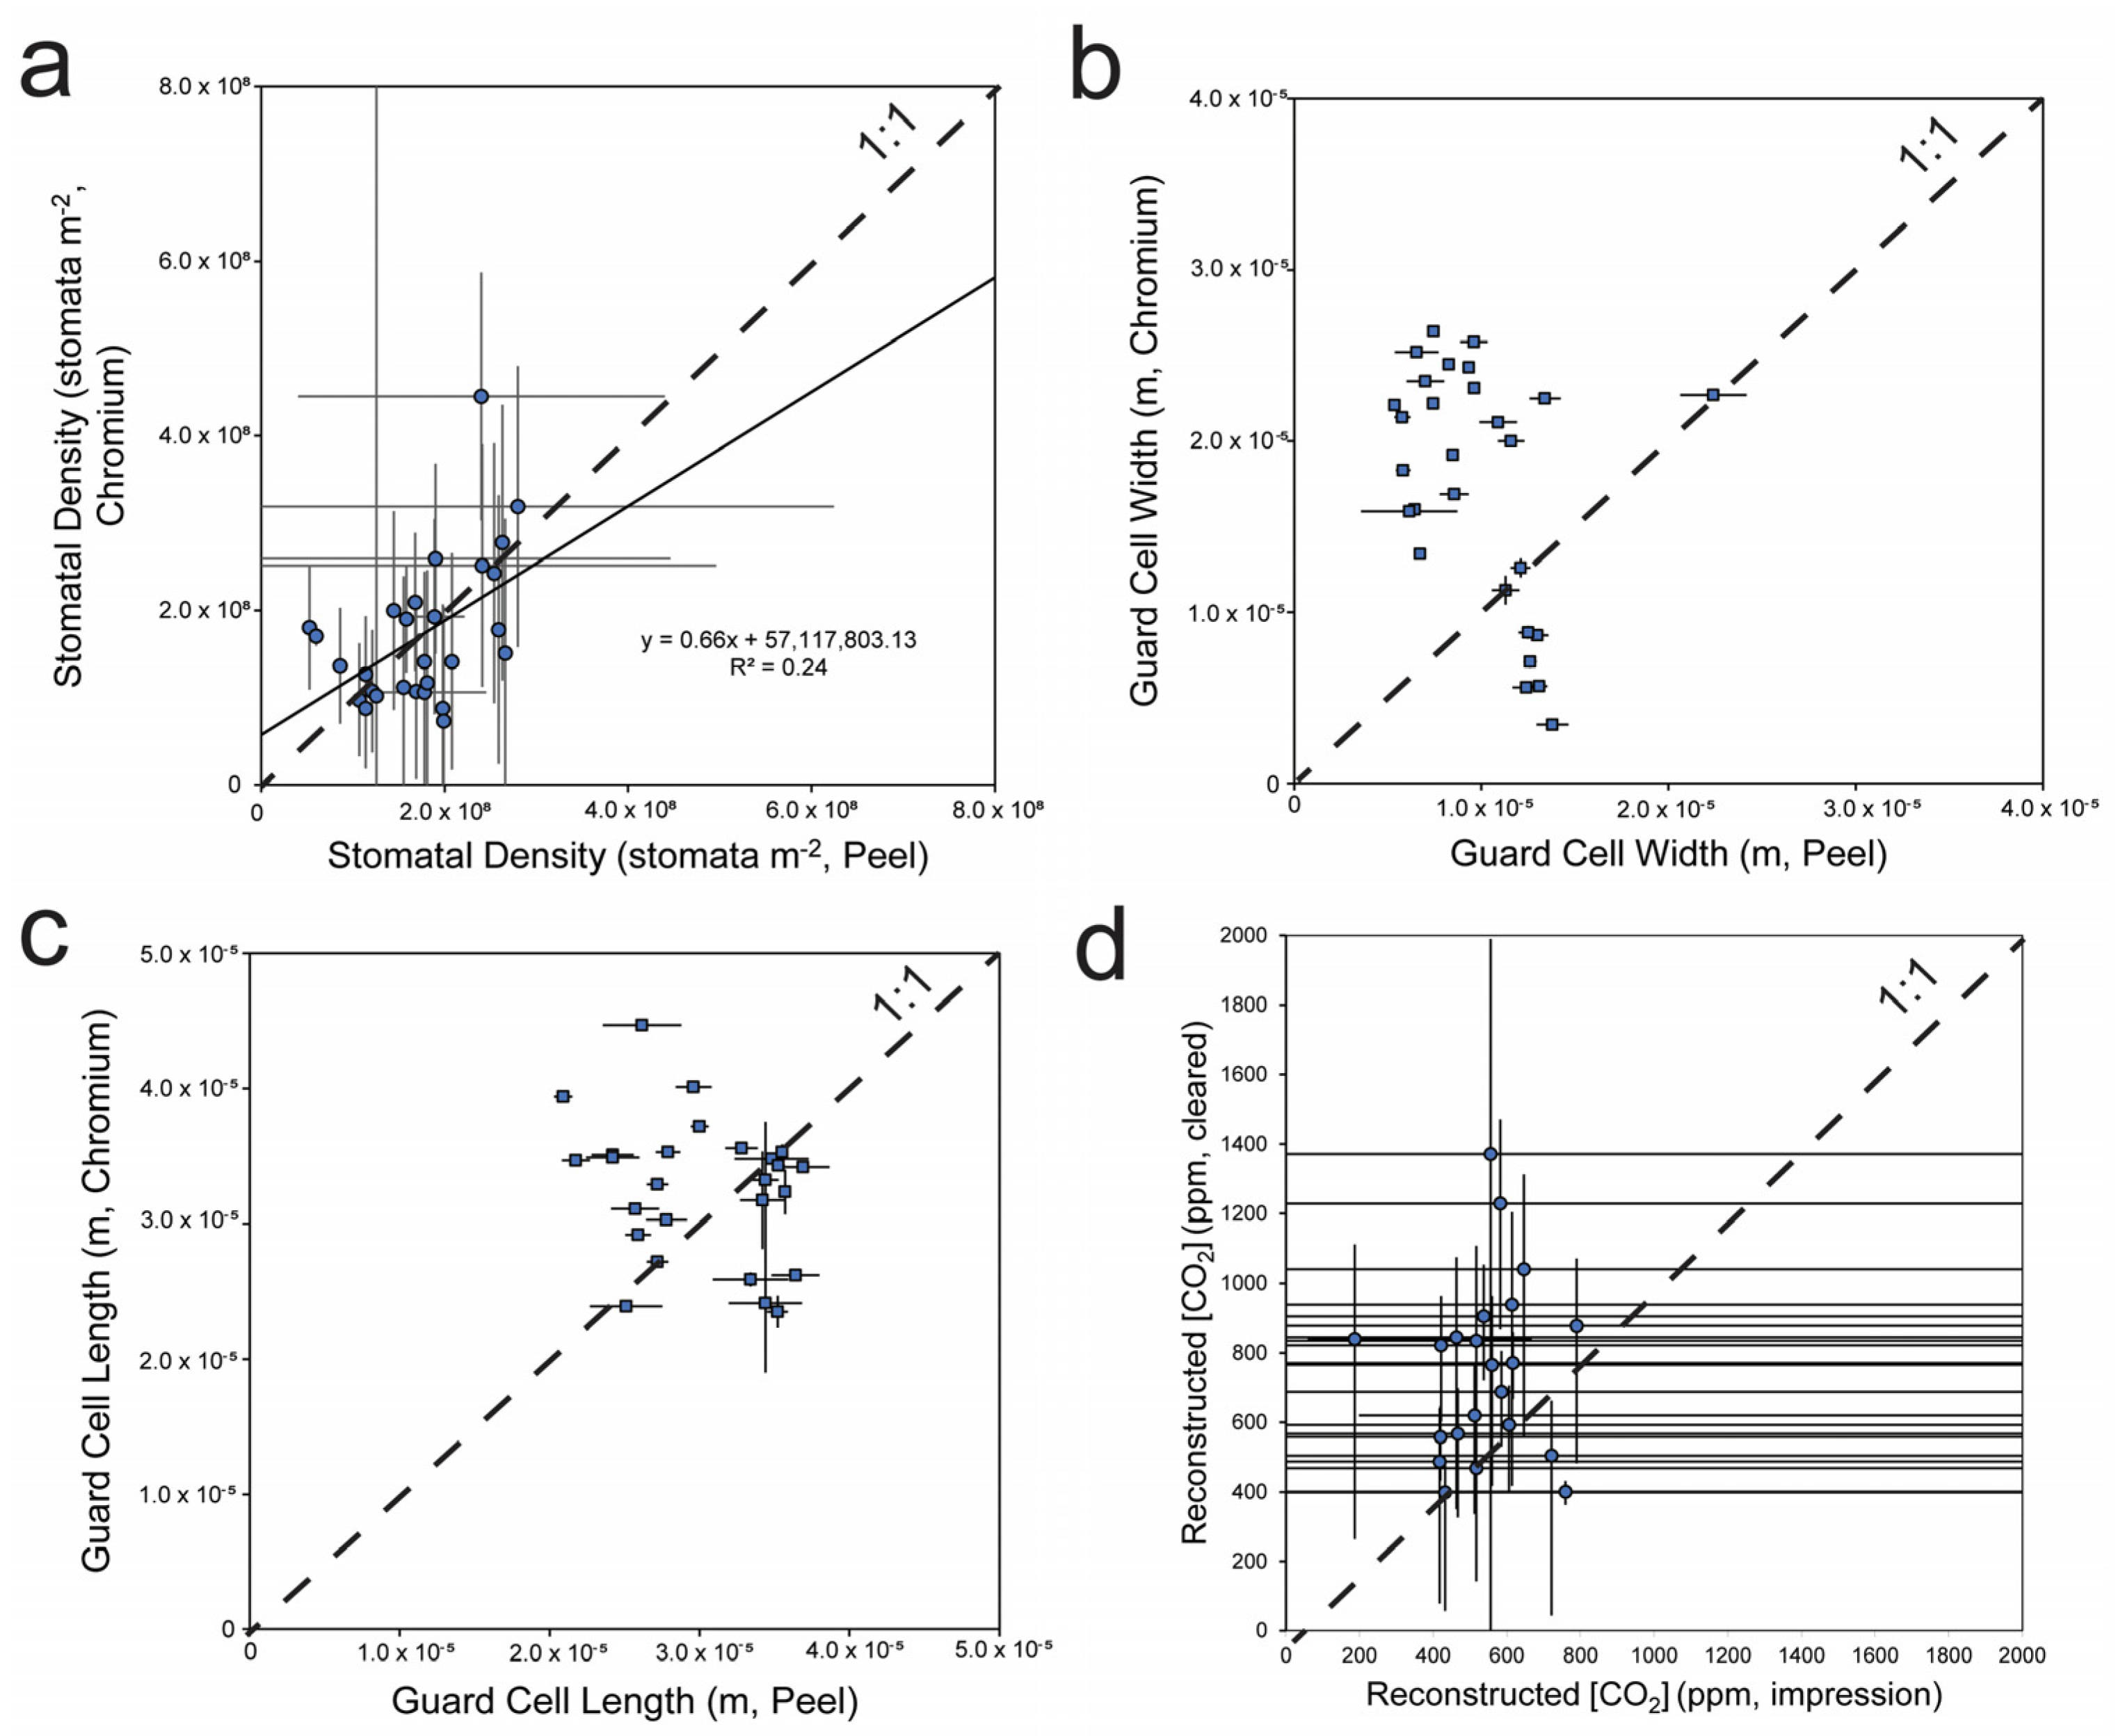
3.1. Method Comparisons

We report first lumped and then species-specific results in detail. Measured stomatal density from stomatal impressions for Thuja ranged from 5.28 × 10⁷ stomata m−2 to 5.95 × 10⁸ stomata m−2 (average of 2.60 × 10⁸ stomata m−2; Table 1; Figure 1), and for chromium-cleared Thuja leaves ranged from 1.06 × 10⁸ stomata m−2 to 4.45 × 10⁸ stomata m−2 (average of 2.46 × 10⁸ stomata m−2; Table 1; Figure 1).
For Thuja, GCL for impressions ranged from 1.17 × 10⁻⁵ m to 5.82 × 10⁻⁵ m (average of 3.17 × 10⁻⁵ m; Table 1; Figure 1) and chromium-cleared leaves ranged from 2.35 × 10⁻⁵ m to 3.53 × 10⁻⁵ m (average of 2.98 × 10⁻⁵ m; Table 1; Figure 2). GCW from impressions ranged from 4.38 × 10⁻⁶ m to 3.39 × 10⁻⁵ m (average of 1.34 × 10⁻⁵ m; Table 1; Figure 2) and chromium-cleared leaves ranged from 3.43 × 10⁻⁶ m to 1.87 × 10⁻⁵ m (average of 9.01 × 10⁻⁶ m; Figure 2, Figure 3, Figure 4 and Figure 5; Table 1).
Guard cell length, GCW, and stomatal density varied depending on the species (Figure 3). On impressions, guard cell length ranged from 1.20 × 10⁻⁵ m to 5.82 × 10⁻⁵ m for Populus (average = 2.58 × 10⁻⁵ m ± 6.07 × 10⁻⁶, standard deviation, n = 82). Guard cell length for Thuja ranged from 1.17 × 10⁻⁵ m to 3.68 × 10⁻⁵ m (average = 3.17 × 10⁻⁵ m ± 7.77 × 10⁻⁶, standard deviation, n = 24). GCW ranged from 4.38 × 10⁻⁶ m to 2.24 × 10⁻⁵ m for Populus (average = 7.60 × 10⁻⁶ m ± 2.78 × 10⁻⁶ m, standard deviation, n = 82), and from 1.05 × 10⁻⁵ m to 3.39 × 10⁻⁵ for Thuja (average = 1.34 × 10⁻⁵ m ± 4.50 × 10⁻⁶, standard deviation, n = 24). Stomatal density ranged from 5.28 × 10⁷ stomata m−2 to 3.31 × 10⁸ stomata m−2 for Populus (average = 1.71 × 10⁸ stomata m−2 ± 5.95 × 10⁷, standard deviation, n = 82), from 1.67 × 10⁸ stomata m−2 to 5.95 × 10⁸ stomata m−2 for Thuja (average = 2.60 × 10⁸ stomata m−2 ± 8.92 × 10⁷, n = 24). There was a statistically significant difference between stomatal density and GCW measured on Populus and Thuja impressions (Table 1 and Table 2; Figure 2 and Figure 7).

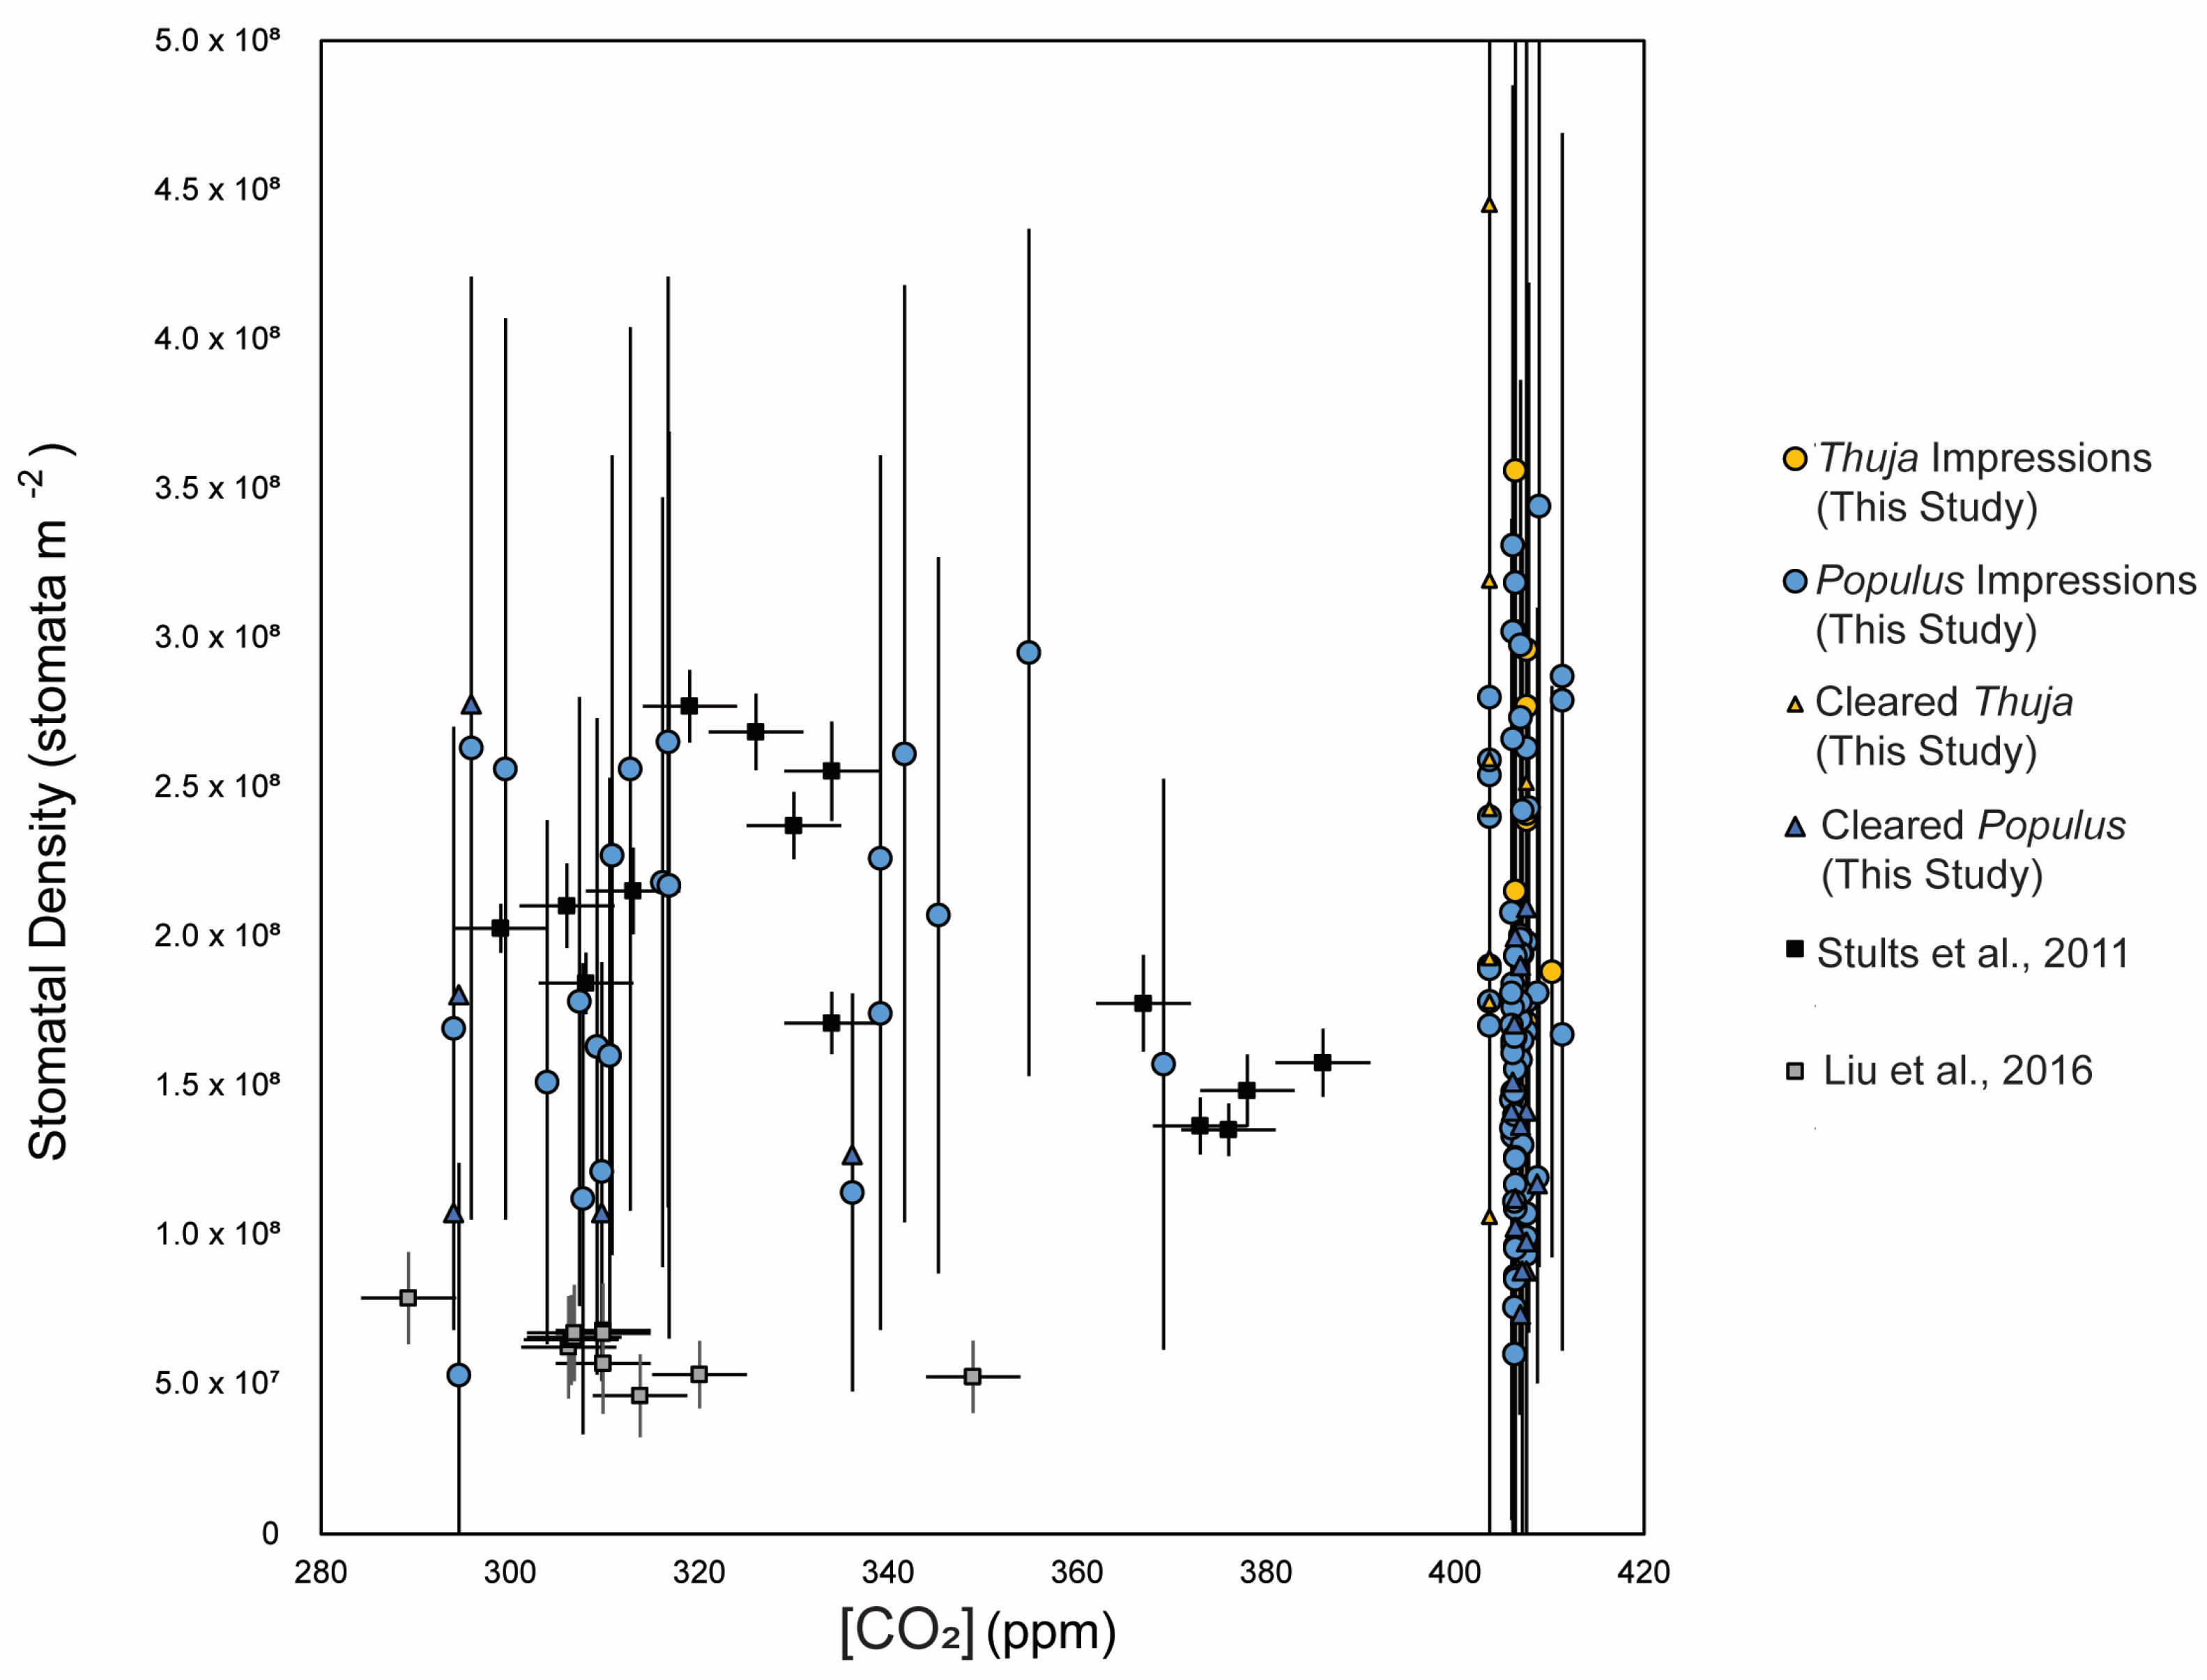
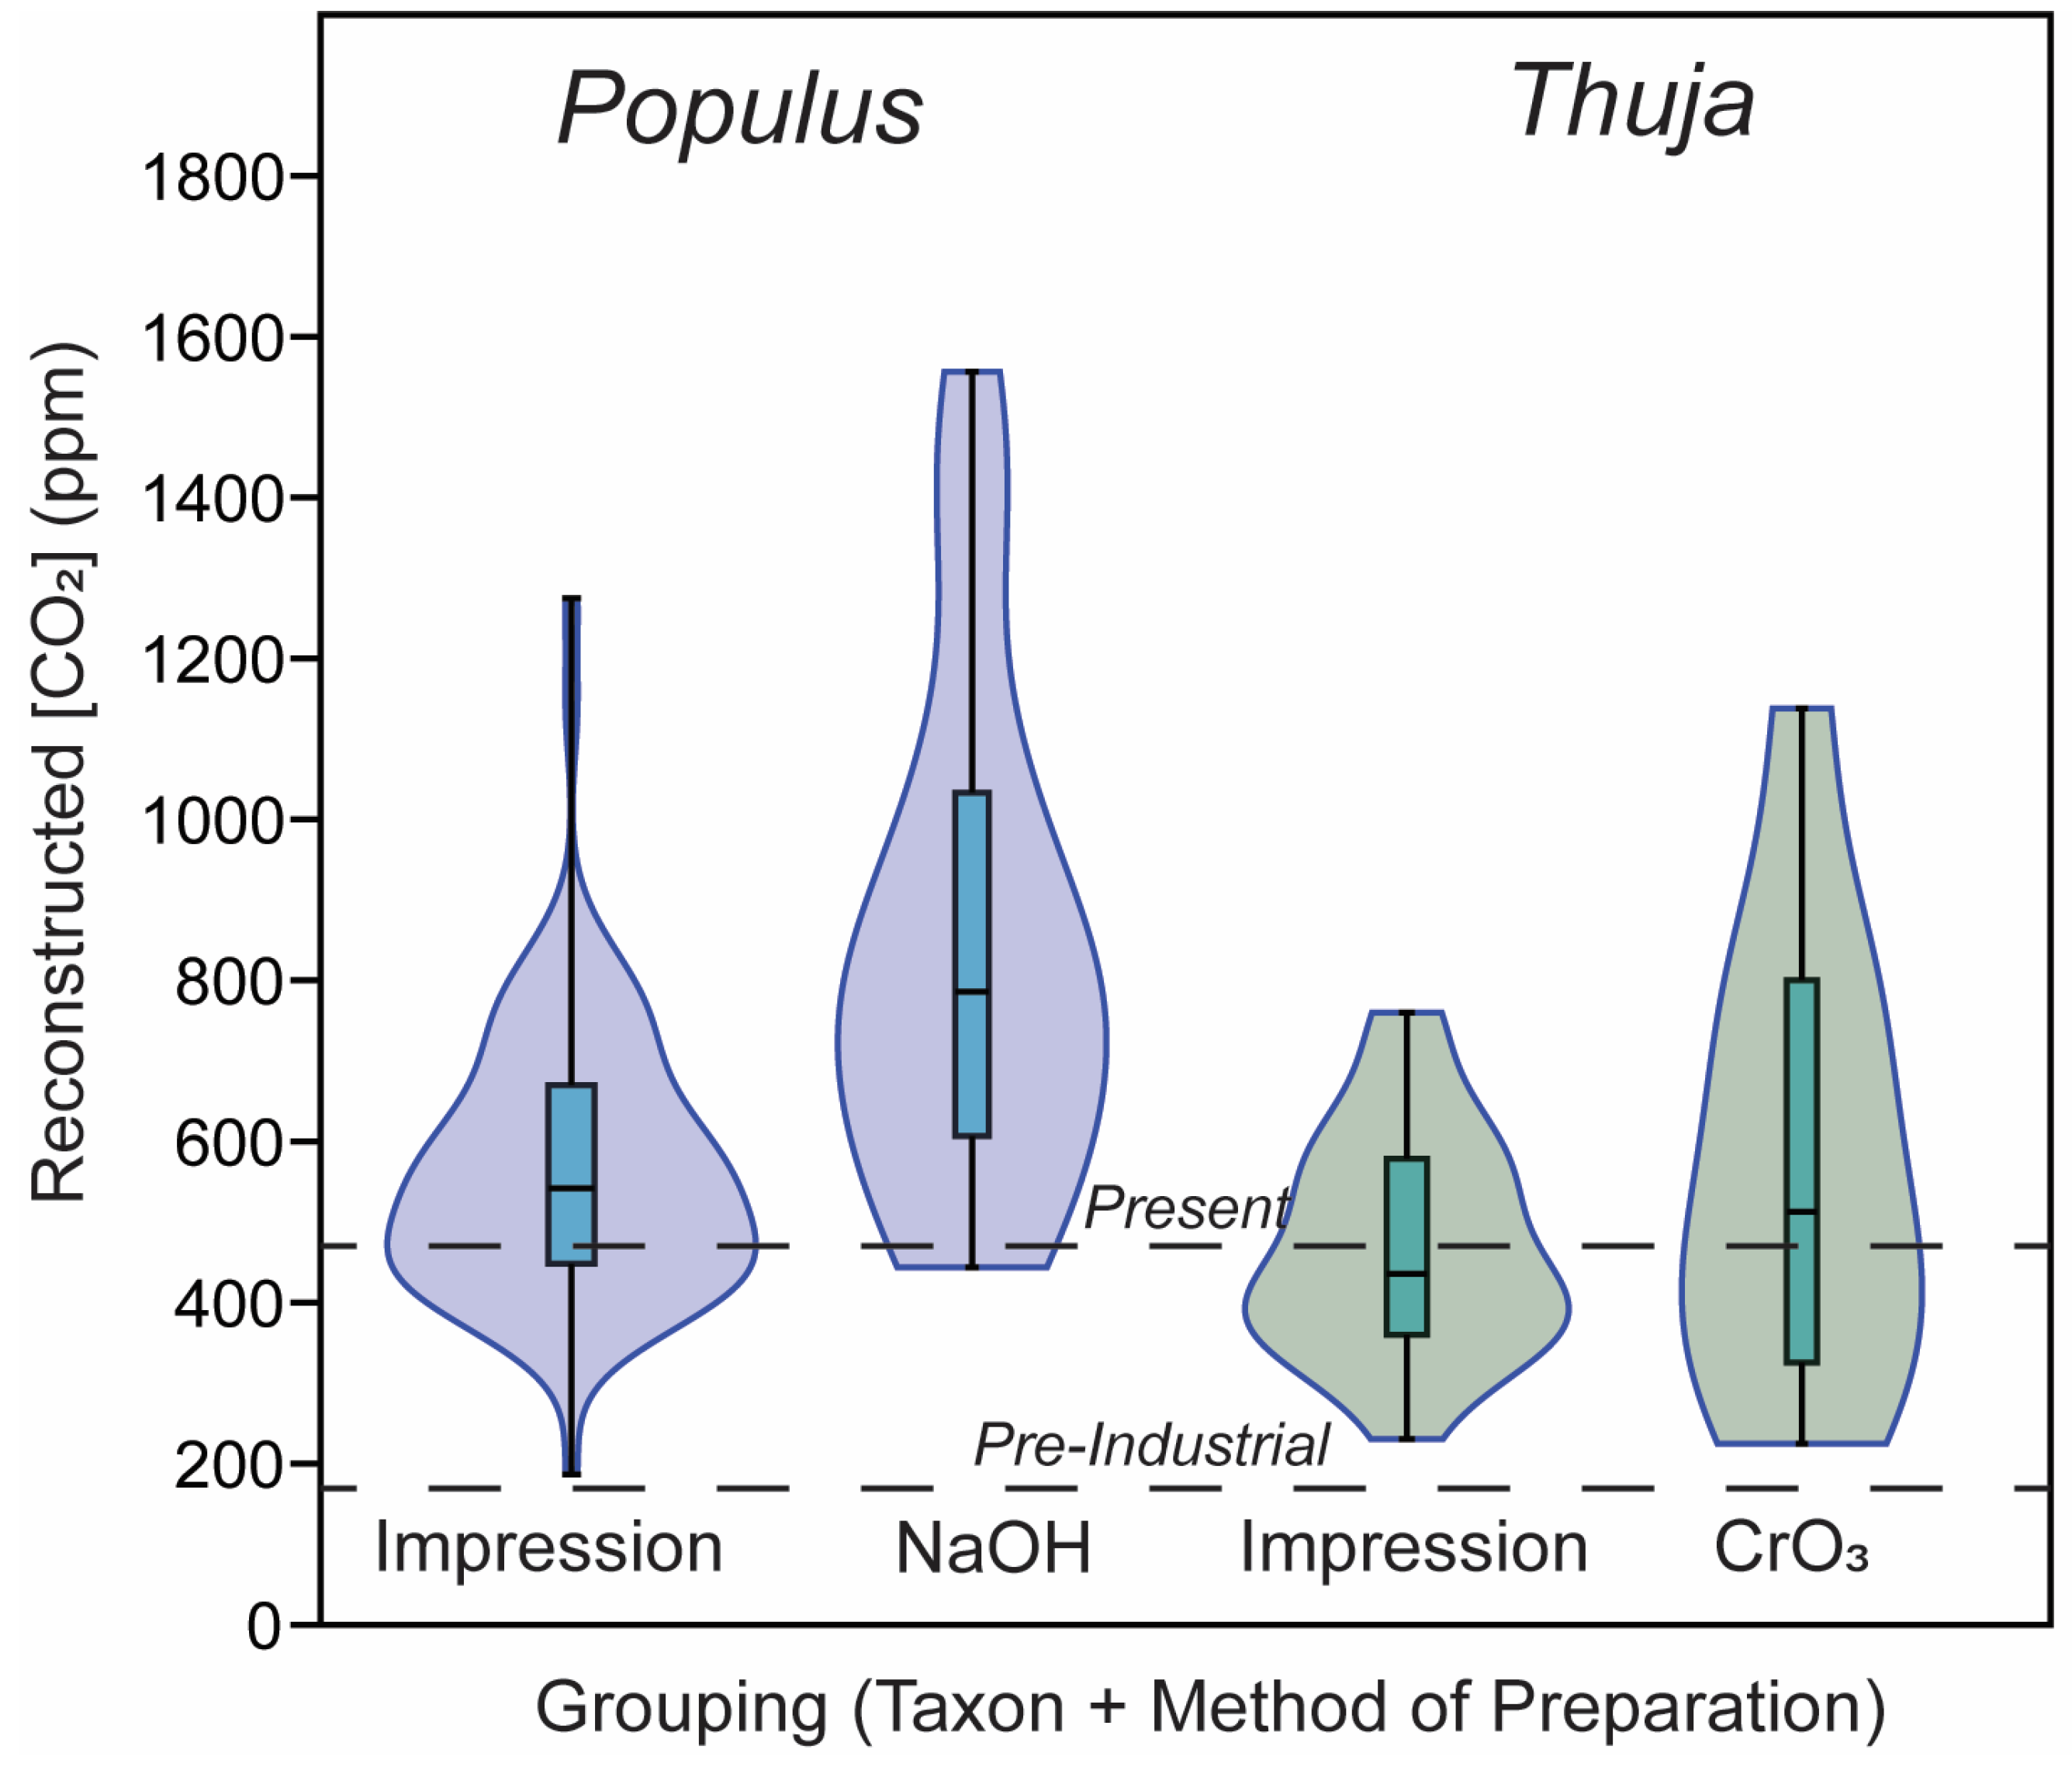
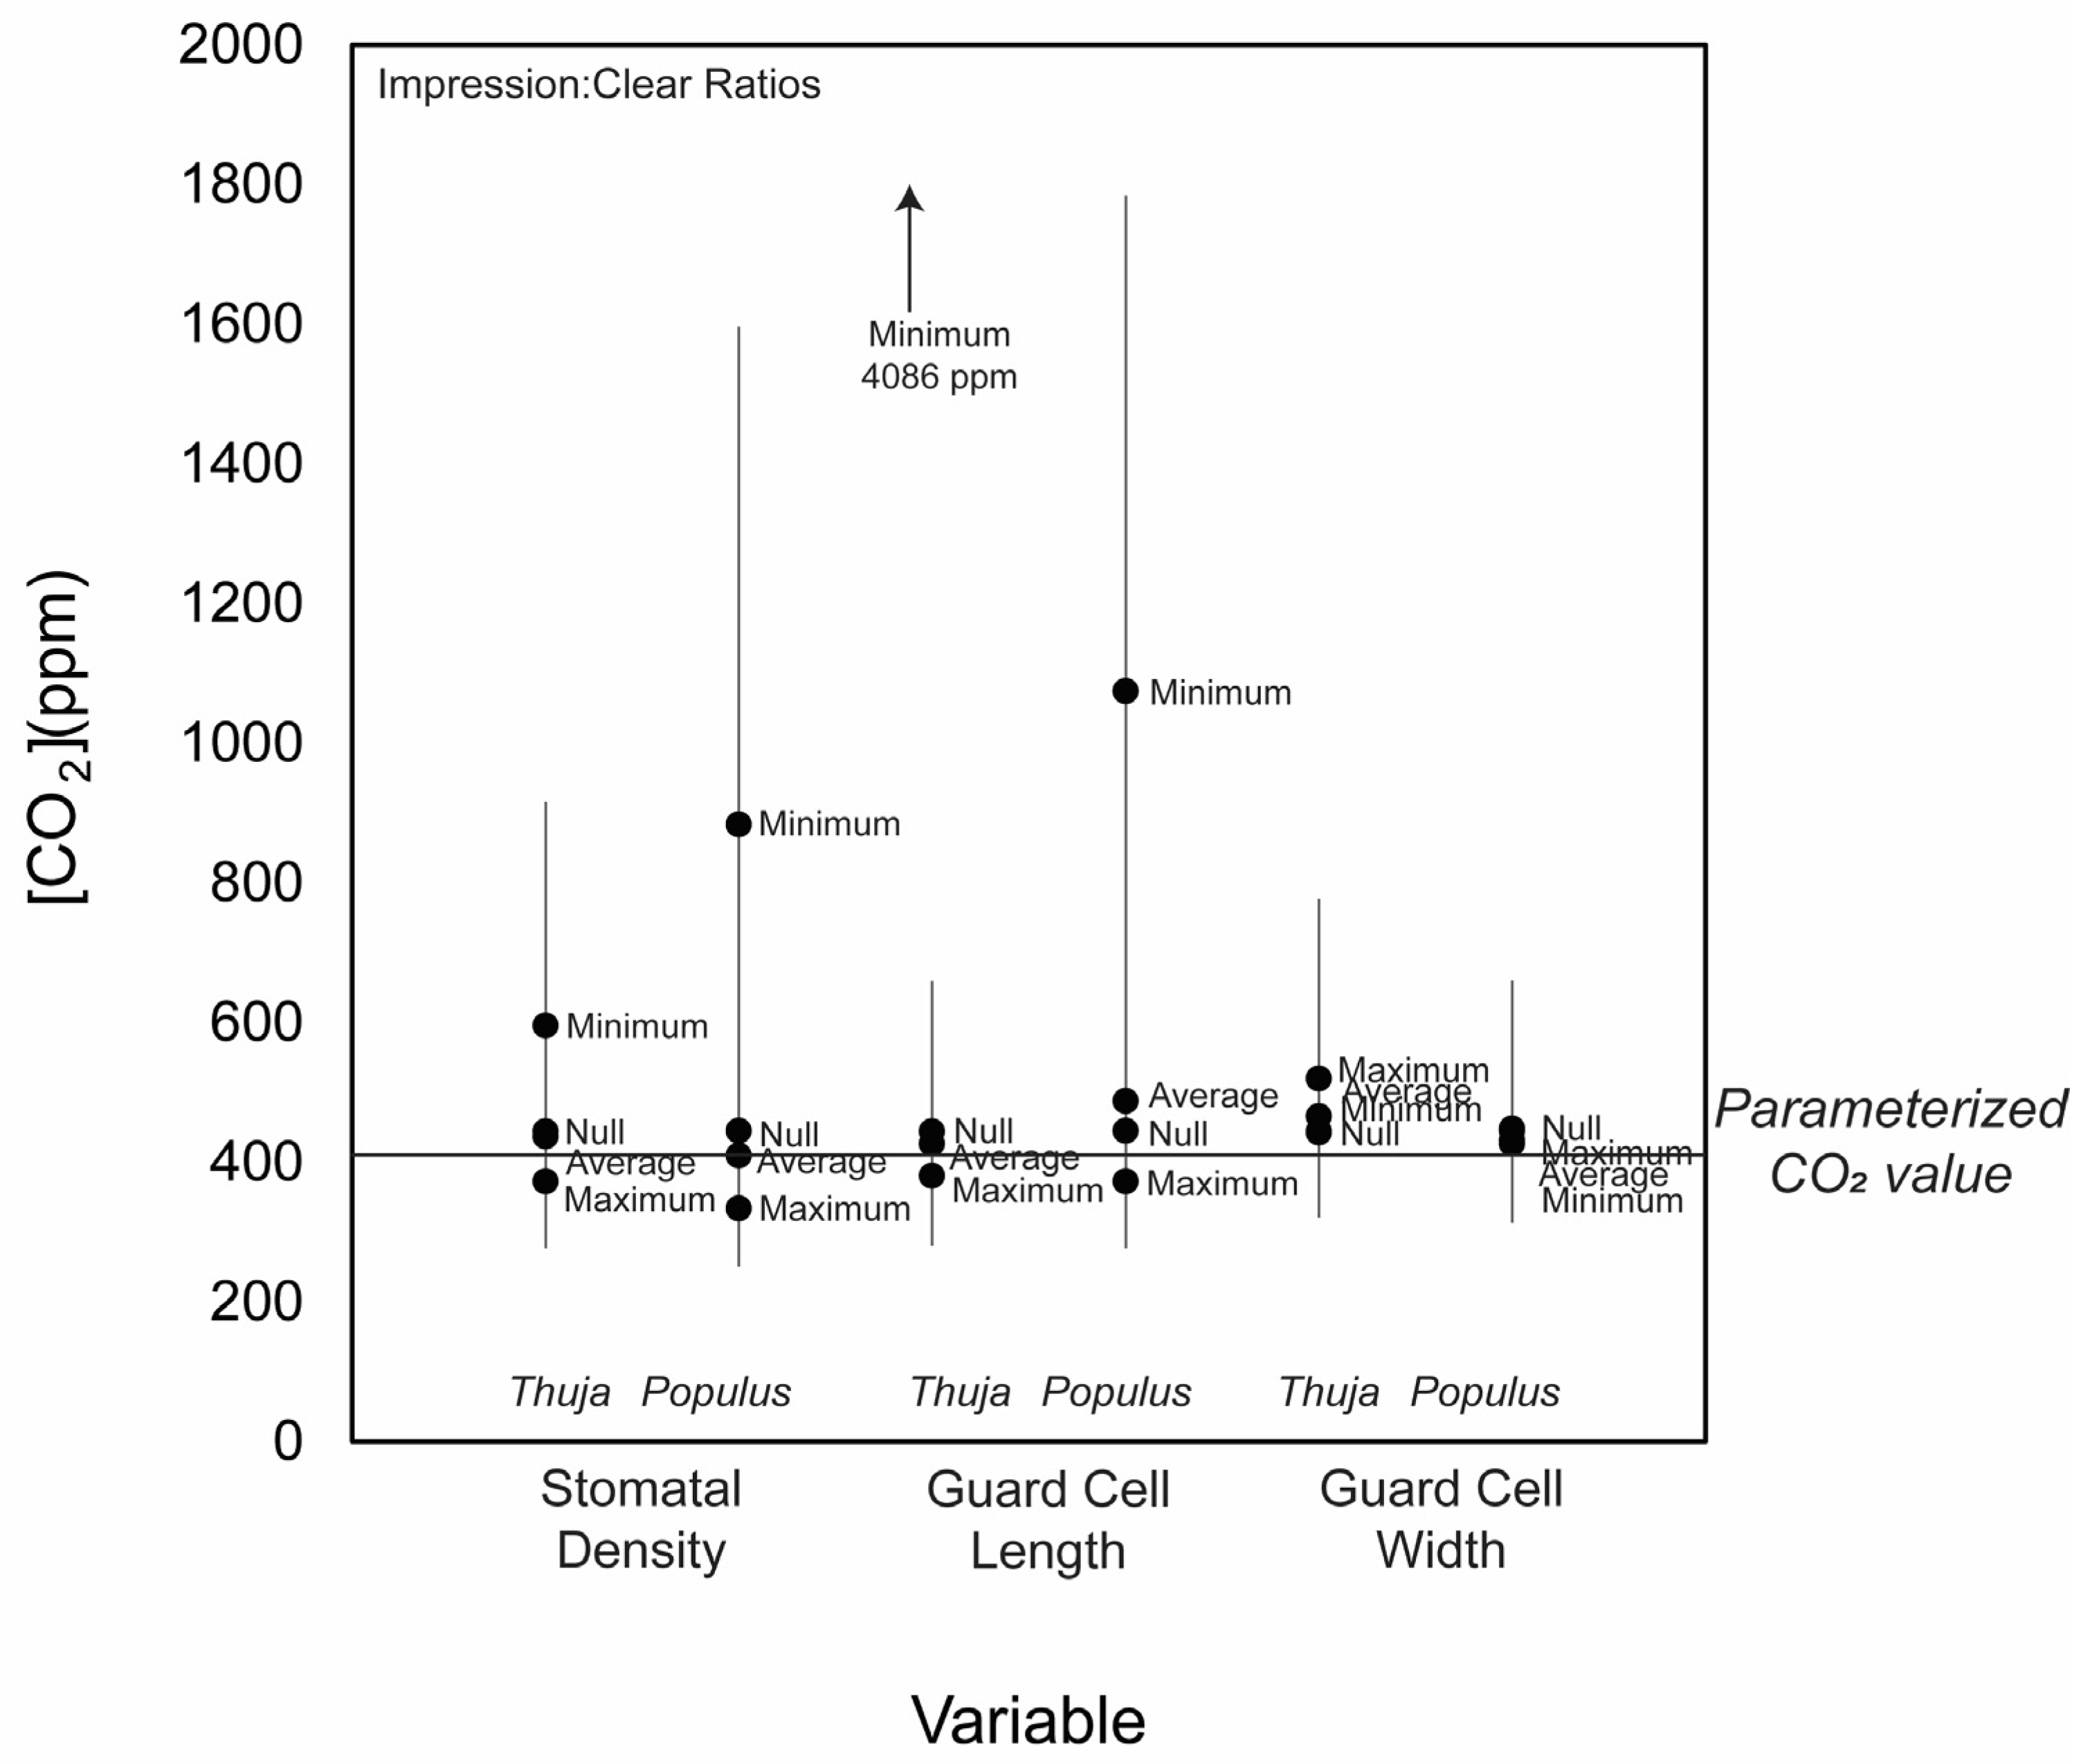
3.2. CO2 Reconstructions Using Both Methods

Stomatal density did not have any significant predictive relationship with [CO2] for any of the taxa measured in this study (Figure 2). Reconstructed [CO2] using the gas exchange model slightly exceeded actual atmospheric [CO2] for the impressions, with three outliers > 1500 ppm (the highest value measured throughout the Cenozoic [56]) and most other values ranging between 1 and 3× as much as actual [CO2] (Figure 4a,b). For all stomatal impression-based CO2 values below 1500 (n = 103, excluding the three outliers, Figure 4a,b and Figure 5), values ranged from 187 to 1275 ppm, with an average of 555 ppm (standard deviation = 165). For all chromium-based measurements, values ranged from 400 to 1229 ppm (average = 693, standard deviation = 293; Figure 5). For all sodium-hydroxide-based measurements, values ranged from 488 to 1483 ppm (average = 843, standard deviation = 283). For the ten Thuja leaves measured with both chromium and impression methodologies, reconstructed CO2 values from stomatal impressions ranged from 432 to 790 ppm (excluding the one value >>1500 ppm) and from cleared leaves ranged from 298 to 1229 ppm. For the fifteen Populus leaves measured with both cleared and impression methodologies, reconstructed CO2 values from stomatal impressions ranged from 187 to 721 and from cleared leaves ranged from 488 to 1372 ppm. Of these 103 samples with <1500 ppm reconstructed CO2, 29 of these samples fell within 50 ppm of the actual global [CO2] at the time (Figure 6d).

4. Discussion

As mentioned, we compared CrO3 and NaOH leaf clearing versus impression techniques on Thuja plicata, Thuja occidentalis, and Populus tremuloides leaf specimens. While stomatal density was comparable using the two methods (Figure 6a). These values are comparable to published values of stomatal parameters [54,55] on scale-shaped leaves (Cupressaceae and Podocarpaceae, respectively), which ranged from 1.35 × 10⁸ stomata m−2 to 2.77 × 10⁸ stomata m−2 (average = 1.98 × 10⁸ stomata m−2) and 4.59 × 10⁷ stomata m−2 to 7.86 × 10⁷ stomata m−2 (average 6.23 × 10⁷ stomata m−2), respectively (Figure 1). Each of these datasets mentioned has a substantial number of measurements (n > 10) with paired CO2 measurements [51,57].
GCL and GCW, two important measurements in the gas exchange model [15], were significantly different (p = 0.003 and p < 0.001, respectively, for the two-tailed t-test; Table 3; Figure 6b,c). When compared directly, GCL and GCW measurements either were not predictive or were negatively predictive (not a meaningful result) between cleared and impression samples (R2 < 0.01 and R2 = 0.54 with a negative correlation, respectively; Figure 6b,c). The significant differences as determined by the t-test (Table 3) and coefficients of determination show that one cannot use results from the impressions to predict results measured on cleared leaves. Because creating an impression requires using slight physical force to press the nitrocellulose-ethyl acetate onto the tape from the dental putty mold, if the nitrocellulose-ethyl acetate and tape are not pressed together sufficiently, the GCW will appear smaller. GCW is the finest scale measurement for the stomatal parameters input into the gas exchange model and, thus, the most sensitive to human error or shrinking dental putty.
We did not use the chromium-based methodology on the angiosperm group because this highly corrosive solution causes broad-leaved leaves like angiosperms to dissolve quickly [58], while tougher, scale-like leaves of Thuja require corrosive solutions [59,60]. We cleared Populus leaves using sodium hydroxide, a more common technique for angiosperms [43]. Measurements made using both clearing and impression methodologies reconstructed reasonable, if slightly high (<3×) CO2 values compared with known measured CO2 values at sampling time (Figure 7). Importantly, stomatal density measured on leaves cleared using CrO3 and dental putty impressions were comparable. This indicates that in cases where dental putty impressions are the only available options (due to fragile cuticles or other complications), CO2 estimations based on stomatal density and/or stomatal index measurements introduce much less error than those incorporating pore and guard cell length and width measurements. The slope of the relationship between stomatal density measurement made on impressions and clearing methodology was close to 0.66 and had an intercept (i.e., discrepancy) within the standard deviation of all samples (5.7 × 10⁷ stomata m−2; Figure 6a), with a coefficient of determination (R2) of 0.24.
The impression methodology is as accurate as the standard, corrosive methodology for stomatal density measurements. However, the impression methodology is not as accurate as clearing for any estimates that require nuanced measurements on the micrometer scale (i.e., GCW, GCL), possibly reflecting shrinkage in dried versus hydrated leaves. This includes gas-exchange models. Thus, for proxy reconstructions based on gas-exchange models [13], the more precise methodology of leaf clearing is encouraged.
While this creates limitations for the use of impressions for complex plant morphology-based models, there are logistical circumstances in which the impression-based methodology is more useful. Not only is the impression methodology as accurate as typically cleared leaves, but because these impressions were non-toxic and non-destructive, they contributed significantly less waste in the laboratory than using CrO3 or NaOH. This methodology is most appropriate for classroom settings, where it is quicker and safer than CrO3 and thus accessible to a wide array of learners.

5. Conclusions

Both impression-based and cleared-leaf-based measurements provided viable [CO2] estimates using the gas exchange model for measurements made on historical and modern leaves of both types of leaves evaluated: those of scale-leaf conifers (Thuja) and of broad-leaf angiosperms (Populus). Impression-based measurements were less accurate for GCW and GCL because of shrinkage due to drying and the imprecision of the physical mechanisms involved in making the impression (i.e., human error), but stomatal density measurements were comparable and correlated between the two methods. Furthermore, the parameters measured between broad-leaf angiosperms and scale-leaf conifers are different, demonstrating the importance of taxonomically diverse starting parameters when using the gas-exchange model to reconstruct paleo-CO2. However, the variability of parameters within the Thuja genus was not significant. Future work evaluating multiple closely related species from the same genus is needed to evaluate the extent to which subscribing to one equation for genera, such as one Thuja equation, is appropriate.
Based on these findings, we recommend that leaf clearing methodology (CrO3, NaOH) be employed as much as possible when using a gas exchange model, but if only stomatal density or index are available due to logistical parameters, either approach is potentially viable. Further work covering a wider time slice of Industrialization with a diversity of plant functional types can demonstrate the efficacy of this tool using the stomatal density and gas exchange models. Additionally, future work should include development on the methodology of creating impressions of stomata from fossils, as this is harder than in modern material.

Supplementary Materials

The following supporting information can be downloaded at: https://www.mdpi.com/article/10.3390/life14010078/s1, Supplemental Text; Figure S1: All Environmental Parameters versus Stomatal Parameters; Supplemental Data Tables: All Measurements—Data are available at Mendeley Data: 10.17632/gs6rn9tjxn.1 (accessed on 13 November 2023).

Author Contributions

Conceptualization, R.A.S., N.D.S. and S.Y.S.; methodology, R.A.S. and S.Y.S.; software, S.Y.S.; validation, R.A.S., N.D.S. and S.Y.S.; formal analysis, R.A.S.; investigation, R.A.S.; resources, N.D.S. and S.Y.S.; data curation, R.A.S.; writing—original draft preparation, R.A.S.; writing—review and editing, R.A.S., N.D.S. and S.Y.S.; visualization, R.A.S.; supervision, N.D.S. and S.Y.S.; project administration, N.D.S. and S.Y.S.; funding acquisition, R.A.S., N.D.S. and S.Y.S. All authors have read and agreed to the published version of the manuscript.

Funding

The field sampling for this study was funded by the Evolving Earth Grant, the Geological Society of America Graduate Student Research Fund, and the Scott Turner Fund by the University of Michigan. Partial support was also provided by NSF EAR-1949151 to SYS.

Institutional Review Board Statement

Not applicable.

Informed Consent Statement

Not applicable.

Data Availability Statement

Data available in a publicly accessible repository. The data presented in this study are openly available in Mendeley Data Repository at [doi: 10.17632/gs6rn9tjxn.1; accessed on 13 November 2023], reference number [61].

Acknowledgments

We thank Kelly Marin for his assistance in preparing the sodium hydroxide-cleared Populus leaves; Katherine Harpenau for her assistance in measuring the cleared Populus leaves; Aliah Wright-Johnson for her assistance in preparing chromium-cleared Thuja leaves; and Sarah Sturtz for her assistance in preparing and making measurements on leaf impressions. We thank Richard Rabeler and Anton Reznicek at the University of Michigan Herbarium (MICH) for help with collections, as well as Susana Fernandes (University of Michigan School for Environment and Sustainability) for assistance locating and sampling in Stinchfield Woods, Michigan.

Conflicts of Interest

The authors declare no conflicts of interest.

References

  1. Beerling, D.J.; McElwain, J.C.; Osborne, C.P. Stomatal responses of the ‘living fossil’ Ginkgo biloba L. to changes in atmospheric CO2 concentrations. J. Exp. Bot. 1998, 49, 1603–1607. [Google Scholar] [CrossRef]
  2. Beerling, D.J.; Royer, D.L. Reading a CO2 signal from fossil stomata. New Phytol. 2002, 153, 387–397. [Google Scholar] [CrossRef] [PubMed]
  3. Steinthorsdottir, M.; Jeram, A.J.; McElwain, J.C. Extremely elevated CO2 concentrations at the Triassic/Jurassic boundary. Palaeogeogr. Palaeoclimatol. Palaeoecol. 2011, 308, 418–432. [Google Scholar] [CrossRef]
  4. Franks, P.J.; Royer, D.L. Comment on “Was atmospheric CO2 capped at 1000 ppm over the past 300 million years?” by McElwain JC et al. [Palaeogeogr. Palaeoclimatol. Palaeoecol. 441 (2016) 653–658]. Palaeogeogr. Palaeoclimatol. Palaeoecol. 2017, 472, 256–259. [Google Scholar] [CrossRef]
  5. Bange, G.G.J. On the quantitative explanation of stomatal transpiration. Acta Bot. Neerl. 1953, 2, 255–297. [Google Scholar] [CrossRef]
  6. Jarvis, P.G.; McNaughton, K.G. Stomatal control of transpiration: Scaling up from leaf to region. In Advances in Ecological Research; Academic Press: Cambridge, MA, USA, 1986; Volume 15, pp. 1–49. [Google Scholar]
  7. Jones, H.G. Stomatal control of photosynthesis and transpiration. J. Exp. Bot. 1998, 49, 387–398. [Google Scholar] [CrossRef]
  8. Woodward, F.I. Stomatal numbers are sensitive to increases in CO2 from pre-industrial levels. Nature 1987, 327, 617–618. [Google Scholar] [CrossRef]
  9. Lin, J.; Jach, M.E.; Ceulemans, R. Stomatal density and needle anatomy of Scots pine (Pinus sylvestris) are affected by elevated CO2. New Phytol. 2001, 150, 665–674. [Google Scholar] [CrossRef]
  10. Teng, N.; Jin, B.; Wang, Q.; Hao, H.; Ceulemans, R.; Kuang, T.; Lin, J. No detectable maternal effects of elevated CO2 on Arabidopsis over 15 generations. PLoS ONE 2009, 4, e6035. [Google Scholar]
  11. Xu, Z.; Jiang, Y.; Jia, B.; Zhou, G. Elevated-CO2 response of stomata and its dependence on Environmental Factors. Front. Plant Sci. 2016, 7, 657. [Google Scholar] [CrossRef]
  12. Li, Y.; Li, X.; Yu, J.; Liu, F. Effect of the transgenerational exposure to elevated CO2 on the drought response of winter wheat: Stomatal control and water use efficiency. Environ. Exp. Bot. 2017, 136, 78–84. [Google Scholar] [CrossRef]
  13. Franks, P.J.; Royer, D.L.; Beerling, D.J.; Van de Water, P.K.; Cantrill, D.J.; Barbour, M.M.; Berry, J.A. New constraints on atmospheric CO2 concentration for the Phanerozoic. Geophys. Res. Lett. 2014, 41, 4685–4694. [Google Scholar] [CrossRef]
  14. Grein, M.; Konrad, W.; Wilde, V.; Utescher, T.; Roth-Nebelsick, A. Reconstruction of atmospheric CO2 during the early middle Eocene by application of a gas exchange model to fossil plants from the Messel Formation, Germany. Palaeogeogr. Palaeoclimatol. Palaeoecol. 2011, 309, 383–391. [Google Scholar] [CrossRef]
  15. Woodward, F.I.; Bazzaz, F.A. The responses of stomatal density to CO2 partial pressure. J. Exp. Bot. 1988, 39, 1771–1781. [Google Scholar] [CrossRef]
  16. Van de Water, P.K.; Leavitt, S.W.; Betancourt, J.L. Trends in stomatal density and 13C/12C ratios of Pinus flexilis needles during last glacial-interglacial cycle. Science 1994, 264, 239–243. [Google Scholar] [CrossRef] [PubMed]
  17. Liancourt, P.; Spence, L.A.; Song, D.S.; Lkhagva, A.; Sharkhuu, A.; Boldgiv, B.; Helliker, B.R.; Petraitis, P.S.; Casper, B.B. Plant response to climate change varies with topography, interactions with neighbors, and ecotype. Ecology 2013, 94, 444–453. [Google Scholar] [CrossRef] [PubMed]
  18. Kohn, M.J. Carbon isotope compositions of terrestrial C3 plants as indicators of (paleo) ecology and (paleo) climate. Proc. Natl. Acad. Sci. USA 2010, 107, 19691–19695. [Google Scholar] [CrossRef]
  19. Sheldon, N.D.; Smith, S.Y.; Stein, R.; Ng, M. Carbon isotope ecology of gymnosperms and implications for paleoclimatic and paleoecological studies. Glob. Planet. Chang. 2020, 184, 103060. [Google Scholar] [CrossRef]
  20. Stein, R.A.; Sheldon, N.D.; Smith, S. Rapid response to anthropogenic climate change by Thuja occidentalis: Implications for past climate reconstructions and future climate predictions. PeerJ 2019, 7, e7378. [Google Scholar] [CrossRef]
  21. Stein, R.A.; Sheldon, N.D.; Smith, S.Y. C3 plant carbon isotope discrimination does not respond to CO2 concentration on decadal to centennial timescales. New Phytol. 2021, 229, 2576–2585. [Google Scholar] [CrossRef]
  22. Field, C.B. Plant physiology of the “missing” carbon sink. Plant Physiol. 2001, 125, 25–28. [Google Scholar] [CrossRef] [PubMed]
  23. Scurlock, J.M.O.; Hall, D.O. The global carbon sink: A grassland perspective. Glob. Chang. Biol. 1998, 4, 229–233. [Google Scholar] [CrossRef]
  24. Phillips, O.L.; Lewis, S.L. Evaluating the tropical forest carbon sink. Glob. Chang. Biol. 2014, 20, 2039–2041. [Google Scholar] [CrossRef] [PubMed]
  25. Kimball, B.A.; Idso, S.B. Increasing atmospheric CO2: Effects on crop yield, water use and climate. Agric. Water Manag. 1983, 7, 55–72. [Google Scholar] [CrossRef]
  26. Rosenzweig, C.; Hillel, D. Climate Change and the Global Harvest: Potential Impacts of the Greenhouse Effect on Agriculture; Oxford University Press: Oxford, UK, 1998. [Google Scholar]
  27. Tubiello, F.N.; Donatelli, M.; Rosenzweig, C.; Stockle, C.O. Effects of climate change and elevated CO2 on cropping systems: Model predictions at two Italian locations. Eur. J. Agron. 2000, 13, 179–189. [Google Scholar] [CrossRef]
  28. Machado, R.; Loram-Lourenço, L.; Farnese, F.S.; Alves, R.D.F.B.; de Sousa, L.F.; Silva, F.G.; Filho, S.C.V.; Torres-Ruiz, J.M.; Cochard, H.; Menezes-Silva, P.E. Where do leaf water leaks come from? Trade-offs underlying the variability in minimum conductance across tropical savanna species with contrasting growth strategies. New Phytol. 2021, 229, 1415–1430. [Google Scholar] [CrossRef] [PubMed]
  29. Jordan, G.J.; Carpenter, R.J.; Koutoulis, A.; Price, A.; Brodribb, T.J. Environmental adaptation in stomatal size independent of the effects of genome size. New Phytol. 2015, 205, 608–617. [Google Scholar] [CrossRef] [PubMed]
  30. Beaulieu, J.M.; Leitch, I.J.; Patel, S.; Pendharkar, A.; Knight, C.A. Genome size is a strong predictor of cell size and stomatal density in angiosperms. New Phytol. 2008, 179, 975–986. [Google Scholar] [CrossRef]
  31. Zenil-Ferguson, R.; Ponciano, J.M.; Burleigh, J.G. Evaluating the role of genome downsizing and size thresholds from genome size distributions in angiosperms. Am. J. Bot. 2016, 103, 1175–1186. [Google Scholar] [CrossRef]
  32. Bhadra, S.; Leitch, I.J.; Onstein, R.E. From genome size to trait evolution during angiosperm radiation. Trends Genet. 2023, 39, 728–735. [Google Scholar] [CrossRef]
  33. Lomax, B.H.; Woodward, F.I.; Leitch, I.J.; Knight, C.A.; Lake, J.A. Genome size as a predictor of guard cell length in Arabidopsis thaliana is independent of environmental conditions. New Phytol. 2009, 181, 311–314. [Google Scholar] [CrossRef]
  34. Hetherington, A.M.; Woodward, F.I. The role of stomata in sensing and driving environmental change. Nature 2003, 424, 901–908. [Google Scholar] [CrossRef] [PubMed]
  35. Nejad, A.R.; van Meeteren, U. Stomatal response characteristics of Tradescantia virginiana grown at high relative air humidity. Physiol. Plant. 2005, 125, 324–332. [Google Scholar] [CrossRef]
  36. Pearce, D.W.; Millard, S.; Bray, D.F.; Rood, S.B. Stomatal characteristics of riparian poplar species in a semi-arid environment. Tree Physiol. 2006, 26, 211–218. [Google Scholar] [CrossRef] [PubMed]
  37. Camargo, M.A.B.; Marenco, R.A. Density, size and distribution of stomata in 35 rainforest tree species in Central Amazonia. Acta Amaz. 2011, 41, 205–212. [Google Scholar] [CrossRef]
  38. Haworth, M.; Marino, G.; Materassi, A.; Raschi, A.; Scutt, C.P.; Centritto, M. The functional significance of the stomatal size to density relationship: Interaction with atmospheric [CO2] and role in plant physiological behaviour. Sci. Total Environ. 2023, 863, 160908. [Google Scholar] [CrossRef] [PubMed]
  39. Sharma, N. Leaf clearing protocol to observe stomata and other cells on leaf surface. Bio-protocol 2017, 7, e2538. [Google Scholar] [CrossRef]
  40. Wu, S.; Zhao, B. Using clear nail polish to make Arabidopsis epidermal impressions for measuring the change of stomatal aperture size in immune response. In Plant Pattern Recognition Receptors; Humana Press: New York, NY, USA, 2017; pp. 243–248. [Google Scholar]
  41. Brown, R.; Rickless, P. A new method for the study of cell division and cell extension with some preliminary observations on the effect of temperature and of nutrients. Proc. R. Soc. Lond. B 1949, 136, 110–115. [Google Scholar] [PubMed]
  42. Dean, C.; Leech, R.M. Genome expression during normal leaf development. 1. Cellular and chloroplast numbers and DNA, RNA and protein levels in tissues of different ages within a seven-day old wheat leaf. Plant Physiol. 1982, 69, 904–910. [Google Scholar] [CrossRef]
  43. Ghouse, A.K.M.; Farooqui, F.; Sabir, D. Use of sodium hydroxide in the preparation of epidermal peels from certain coniferous leaves rich in resins and tannins. Stain Technol. 1974, 49, 125–128. [Google Scholar] [CrossRef]
  44. Smith, R.Y.; Greenwood, D.R.; Basinger, J.F. Estimating paleoatmospheric pCO2 during the early Eocene climatic optimum from stomatal frequency of ginkgo, Okanagan highlands, British Columbia, Canada. Palaeogeogr. Palaeoclimatol. Palaeoecol. 2010, 293, 120–131. [Google Scholar] [CrossRef]
  45. Stockey, R.A.; Taylor, T.N. Cuticular features and epidermal patterns in the genus Araucaria de Jussieu. Bot. Gaz. 1978, 139, 490–498. [Google Scholar] [CrossRef]
  46. Abràmoff, M.D.; Magalhães, P.J.; Ram, S.J. Image processing with Image J. Biophotonics Int. 2004, 11, 36–42. [Google Scholar]
  47. Collins, T.J. ImageJ for microscopy. Biotechniques 2007, 43 (Suppl. S1), S25–S30. [Google Scholar] [CrossRef]
  48. Poole, I. Stomatal density and index: The practice. In Fossil Plants and Spores: Modern Techniques; The Geological Society: London, UK, 1999; pp. 257–260. [Google Scholar]
  49. White, J.W.C.; Vaughn, B.H.; Michel, S.E. Stable Isotopic Composition of Atmospheric Carbon Dioxide (13C and 18O) from the NOAA ESRL Carbon Cycle Cooperative Global Air Sampling Network, 1990–2014; Version 2015-10-26; University of Colorado, Institute of Arctic and Alpine Research (INSTAAR): Boulder, CO, USA, 2015. [Google Scholar]
  50. PRISM Climate Group. Oregon State University. 2004. Available online: http://prism.oregonstate.edu (accessed on 23 March 2021).
  51. Farquhar, G.D.; Ehleringer, J.R.; Hubick, K.T. Carbon isotope discrimination and photosynthesis. Annu. Rev. Plant Biol. 1989, 40, 503–537. [Google Scholar] [CrossRef]
  52. Keeling, C.D.; Piper, S.C.; Bacastow, R.B.; Wahlen, M.; Whorf, T.P.; Heimann, M.; Meijer, H.A. Atmospheric CO2 and 13CO2 exchange with the terrestrial biosphere and oceans from 1978 to 2000: Observations and carbon cycle implications. In A History of Atmospheric CO2 and Its Effects on Plants, Animals, and Ecosystems; Springer: New York, NY, USA, 2005; pp. 83–113. [Google Scholar]
  53. Etheridge, D.M.; Steele, L.P.; Langenfelds, R.L.; Francey, R.J.; Barnola, J.M.; Morgan, V.I. Historical CO2 records from the Law Dome DE08, DE08-2, and DSS ice cores. In Trends: A Compendium of Data on Global Change; US Department of Energy: Washington, DC, USA, 1998; pp. 351–364. [Google Scholar]
  54. Stults, D.Z.; Wagner-Cremer, F.; Axsmith, B.J. Atmospheric paleo-CO2 estimates based on Taxodium distichum (Cupressaceae) fossils from the Miocene and Pliocene of Eastern North America. Palaeogeogr. Palaeoclimatol. Palaeoecol. 2011, 309, 327–332. [Google Scholar] [CrossRef]
  55. Liu, X.Y.; Gao, Q.; Han ME, N.G.; Jin, J.H. Estimates of late middle Eocene pCO2 based on stomatal density of modern and fossil Nageia leaves. Clim. Past 2016, 12, 241–253. [Google Scholar] [CrossRef]
  56. Rae, J.W.; Zhang, Y.G.; Liu, X.; Foster, G.L.; Stoll, H.M.; Whiteford, R.D. Atmospheric CO2 over the past 66 million years from marine archives. Annu. Rev. Earth Planet. Sci. 2021, 49, 609–641. [Google Scholar] [CrossRef]
  57. Lamont-Doherty Earth Observatory of Columbia University. 2023. Available online: www.paleo-co2.org (accessed on 10 November 2023).
  58. Upchurch, G.R. Dispersed angiosperm cuticles. In Proceedings of the Meeting of the Paleobotanical Section of the Botanical Society of America, Toronto, ON, Canada, 6 August 1989; pp. 65–92. [Google Scholar]
  59. Alvin, K.L.; Boulter, M.C. A controlled method of comparative study for taxodiaceous leaf cuticles. Bot. J. Linn. Soc. 1974, 69, 277–286. [Google Scholar] [CrossRef]
  60. Jellings, A.J.; Leech, R.M. The importance of quantitative anatomy in the interpretation of whole leaf biochemistry in species of Triticum, Hordeum and Avena. New Phytol. 1982, 92, 39–48. [Google Scholar] [CrossRef]
  61. Stein, R.A.; Sheldon, N.D.; Smith, S.Y. Supplemental data associated with this work. Available online: https://data.mendeley.com/datasets/gs6rn9tjxn/1 (accessed on 13 November 2023).
Figure 1. (a) violin plots of stomatal density for all species in impressions and cleared leaves (in stomata m−2), with average labeled. (b) violin plot of guard cell length (m) of all species in impressions and cleared leaves, with average labeled below each violin. (c) violin plot of guard cell width (m) of all species in impressions and cleared leaves, with average labeled below each violin. Whisker lengths are equivalent to 1 sigma (i.e., one standard deviation from the mean, representing 68% of all the data for each measurement).
Life 14 00078 g001
Figure 2. Stomatal parameter comparison of (a) stomatal density, (b) guard cell length, (c) guard cell width, for each species of all leaves prepared using the stomatal impression method. Asterisks (*) denote statistically significant difference between the parameters of Populus tremuloides and Thuja occidentalis (stomatal density and guard cell width) as determined by a 2-tailed t-test. Plus symbols (+) denote statistically significant differences between the parameters of Populus tremuloides and Thuja plicata (guard cell length and guard cell width). There were no statistically significant differences between any of the measured parameters of Thuja occidentalis and Thuja plicata.
Life 14 00078 g002
Figure 3. Global [CO2] for the sample date (by month and year) as measured at Mauna Loa Observatory after 1957 [52] and in ice cores before 1957 [53] compared with stomatal density measured on stomatal impressions and cleared leaves for Populus (blue circles for impressions, blue triangles for cleared leaves), and Thuja (yellow circles for impressions, yellow triangles for cleared leaves) and data using the same techniques as those in this study, presented by Stults et al. (2011, black squares) [54] and Liu et al. (2016, grey squares) [55]. For Thuja, there was a moderate correlation between stomatal density measured on stomatal impressions and chromium-cleared leaves (r = 0.49, R2 = 0.24; m = 0.66; p-value = 0.008; Figure 6a), but no correlation between GCL measured on the stomatal impressions and GCL measured on chromium-cleared leaves (r = 0.17; m = −0.16; Figure 6c). There was likewise no predictive relationship between GCW measured on impressions and chromium-cleared leaves; in fact, the slope between GCW measured on leaves treated in each way was negative (m = −0.67; Figure 6b).
Life 14 00078 g003
Figure 4. Actual CO2 compared with [CO2] reconstructed using the measurements in this study and gas-exchange model for parameters measured on cleared leaves (black circles) and stomatal impressions (white circles). Dashed lines demonstrating 10:1, 5:1, 2:1, and 1:1 relationships between actual and reconstructed values are shown in (a), while (b) shows all points excluding outliers over 1500 ppm (geologically reasonable for Cenozoic Era) values, including 3:1, 2:1, and 1:1 relationships in dashed lines.
Life 14 00078 g004
Figure 5. Reconstructed [CO2] value data distribution for impressions and cleared leaves. Dashed lines show Pre-Industrial [CO2] values (180 ppm) and modern [CO2] values (420 ppm). All values based on leave should fall between these lines.
Life 14 00078 g005
Figure 6. Stomatal parameter comparison for all (Populus and Thuja) leaves prepared with both chemical clearing and stomatal impressions. (a) Stomatal density (stomata m−2), (b) guard cell length (m), (c) guard cell width, and (d) reconstructed [CO2] are shown with standard errors calculated from the standard deviation of repeat measurements (s) divided by the square root of the number of measurements.
Life 14 00078 g006
Figure 7. Simulations of what changing parameters involved in the gas-exchange model (guard cell width, stomatal density, and guard cell length) do, according to measured impression and cleared leaf stomata. For each parameter, “Null” demonstrates an unaltered test case, as provided by Franks et al. (2014) supplemental text [13]. Each parameter also includes this unaltered case multiplied by the average ratio of impression: cleared leaf measurement (“Average Impression:Clear”), the maximum ratio of impression: cleared leaf measurement (“Max. Impression:Clear”), and the minimum ratio of impression: cleared leaf measurement (“Min. Impression:Clear”). For example, the minimum ratio of stomatal density on Thuja impressions as compared with chromium-cleared leaves is 0.54, thus the test-case stomatal density for Thuja was multiplied by 0.54, and for Populus, 0.29, and run through the model. The average ratio of stomata density on the Thuja stomatal impression as compared with the chromium-cleared leaf is 1.03, so the average impression: clear for stomatal density represents the model results when the stomatal density is multiplied by 1.03. For Populus, this ratio is 1.26.
Life 14 00078 g007
Table 1. The number of samples, average, and standard deviations of each parameter, measured for each species, divided by preparation method.
nAverage Stomata Density (Stomata m−2)Standard Deviation Stomata Density (Stomata m−2)Average Guard Cell Length (m)Guard Cell Length Standard Deviation (m)Average Guard Cell Width (m)Guard Cell Width Standard Deviation (m)
Populus tremuloides impressions821.71 × 1085.95 × 1072.58 × 10−56.07 × 10−67.56 × 10−62.78 × 10⁻⁶
Thuja impressions242.60 × 1088.92 × 1073.17 × 10−57.77 × 10−61.34 × 10−54.50 × 10⁻⁶
All impressions1061.91 × 1087.68 × 1072.71 × 10−56.91 × 10−68.92 × 10−64.05 × 10⁻⁶
CrO3-cleared Thuja102.46 × 1089.67 × 1072.98 × 10−54.35 × 10−69.01 × 10−64.36 × 10⁻⁶
NaOH-cleared Populus201.41 × 1085.10 × 1073.55 × 10−57.04 × 10−62.12 × 10−53.61 × 10⁻⁶
All cleared leaves301.76 × 1088.46 × 1073.36 × 10−56.76 × 10−61.72 × 10−56.98 × 10⁻⁶
Table 2. t-test p-values reported for comparisons of each species for stomatal density, guard cell length, and guard cell width in impressions (selected because of the higher number of samples). p-values < 0.01 are highlighted in green and bolded, demonstrating significant differences in mean values for the compared species.
Stomatal DensityPopulus tremuloidesThuja occidentalis
Populus tremuloides
Thuja occidentalis<0.01
Thuja plicata<0.010.13
Guard Cell LengthPopulus tremuloidesThuja occidentalis
Populus tremuloides
Thuja occidentalis0.13
Thuja plicata<0.010.56
Guard Cell WidthPopulus tremuloidesThuja occidentalis
Populus tremuloides
Thuja occidentalis<0.01
Thuja plicata<0.010.41
Table 3. Mean values reported for comparison measurements on cleared leaves and impressions, and the p-value for the two-tailed t-test comparing the means of both.
ValueStomatal Density (Stomata m−2)Guard Cell Length (m)Guard Cell Width (m)
Mean for impressions1.74 × 10 82.97 × 10−59.95 × 10−6
Mean for cleared leaves1.70 × 1083.37 × 10−51.72 × 10⁻⁵
p-value0.830.05<0.001
Disclaimer/Publisher’s Note: The statements, opinions and data contained in all publications are solely those of the individual author(s) and contributor(s) and not of MDPI and/or the editor(s). MDPI and/or the editor(s) disclaim responsibility for any injury to people or property resulting from any ideas, methods, instructions or products referred to in the content.

