Article

Genome-Wide Identification of the Remorin Gene Family in Poplar and Their Responses to Abiotic Stresses

1
College of Horticulture and Forestry Science, Hubei Engineering Technology Research Center for Forestry Information, Huazhong Agricultural University, Wuhan 430070, China
2
Research Institute of Non-Timber Forestry, Chinese Academy of Forestry, Zhengzhou 450003, China
*
Authors to whom correspondence should be addressed.
Life 2024, 14(10), 1239; https://doi.org/10.3390/life14101239
Submission received: 8 September 2024 / Revised: 24 September 2024 / Accepted: 24 September 2024 / Published: 27 September 2024
(This article belongs to the Special Issue Plant Biotic and Abiotic Stresses 2024)

Abstract

:
The Remorin (REM) gene family is a plant-specific, oligomeric, filamentous family protein located on the cell membrane, which is important for plant growth and stress responses. In this study, a total of 22 PtREMs were identified in the genome of Populus trichocarpa. Subcellular localization analysis showed that they were predictively distributed in the cell membrane and nucleus. Only five PtREMs members contain both Remorin_C- and Remorin_N-conserved domains, and most of them only contain the Remorin_C domain. A total of 20 gene duplication pairs were found, all of which belonged to fragment duplication. Molecular evolutionary analysis showed the PtREMs have undergone purified selection. Lots of cis-acting elements assigned into categories of plant growth and development, stress response, hormone response and light response were detected in the promoters of PtREMs. PtREMs showed distinct gene expression patterns in response to diverse stress conditions where the mRNA levels of PtREM4.1, PtREM4.2 and PtREM6.11 were induced in most cases. A co-expression network centered by PtREMs was constructed to uncover the possible functions of PtREMs in protein modification, microtube-based movement and hormone signaling. The obtained results shed new light on understanding the roles of PtREMs in coping with environmental stresses in poplar species.

1. Introduction

Remorin (REM) is a plant-specific protein associated with the plasma membrane (PM) microdomain (lipid raft) with strong hydrophilicity, which responds to oligogalacturonic acid signals [1,2,3]. REMs encode an oligomeric, filamentous protein family formed by coiled coils and are expressed in the leaves, branches, stems and roots of plants with strong division ability [4]. Recent studies have shown that REMs have a variety of biological functions in plant growth and development [5,6,7] and are also involved in hormone signaling pathways [8], disease resistance [9], stress response [10,11] and plant immunity [12,13]. Therefore, REMs could serve as molecular targets for improving plants’ adaptation to various abiotic and biotic stresses.
REM contains a highly conserved C-terminal domain and a significantly variable N-terminal domain [1]. The C-terminal domain of REM has a highly conserved coiled-coil structure with hydrophobicity [3]. The coiled-coil structure is a hypothetical membrane-anchored motif involved in the regulation of the spatial structure and oligomerization of the REM [14,15,16,17]. In addition, the C-terminal of REM also has a short sequence of REM-CA (REMORIN C-terminal Anchor), which mediates the binding of REM to PM and participates in protein-protein interactions [18,19]. REM also has a conserved region that is rich in proline [3]. Most REMs are rich in cysteine, which is a potential isoprene reaction site and mediates the interaction between REM and PM [1,20]. The N-terminal intrinsically disordered domain (IDD) is involved in protein aggregation and lipid interaction [19,21]. The sequence variations of REM proteins in the Remorin-N domain lead to diversity in their structure and biological functions [4].
In rice, the REM gene Grain setting defect1 (GSD1) inhibits the transport of carbohydrates from the photosynthetic site to the phloem and affects seed setting by regulating intercellular filament conduction [22,23]. REM1.2 can impair the movement of carrot mosaic virus cells by interacting with PM-associated Ca2+ binding protein 1 (PCaP1) [24]. Palmitoylation of NbREM1.5 can regulate plasmodesmata permeability and limit the movement of tobacco mosaic virus (TMV) [25,26]. CaREM1.4 can interact with CaRIN4 (RPM1-interacting protein 4) to promote cell death, thereby regulating the tolerance to Ralstonia solanacearum [27]. Heterologous expression of Solanum lycopersicum SlREM1 gene in Nicotiana benthamiana increased ROS accumulation and triggered programmed cell death in transgenic plants [28,29]. The symbiosis-specific SYMREM1 also plays an important role in stabilizing the topological structure of membranes [30]. However, information about REM in woody plants remains scarce.
Poplar, a deciduous tree belonging to the Salicaceae with high economic and ecological values, is widely used to produce wood, reduce soil erosion, purify air and water quality, and protect the environment and ecological ecosystems [31,32,33,34,35,36]. With the completion of the whole genomes of poplar species [37,38] and easy genetic transformation [39], poplar species have become the model plant for molecular breeding for woody plants [40,41]. Further, the functions of some REMs in poplar have been reported in recent years [42,43]. The systematic analysis of the poplar REM gene family and their roles in regulating poplar growth and development, as well as stress response, remain to be explored. In this study, the PtREM gene family was identified by bioinformatics methods using the newly released Populus trichocarpa genome (v4.1). Comprehensive bioinformatic analyses have been carried out to explore the potential roles of PtREMs in poplar growth and environmental adaptation. The results obtained from this study will provide a basis for improving tree growth and stress resistance by genetically manipulating PtREMs.

2. Materials and Methods

2.1. Identification of the PtREM Gene in P. trichocarpa

The identification of PtREMs in P. trichocarpa was conducted according to the methods of the previous reports [44,45]. First, the Arabidopsis thaliana database TAIR (https://www.arabidopsis.org/, accessed on 25 August 2024) was used to obtain the protein sequences of the AtREM gene family. The whole genome of P. trichocarpa (v4.1) and annotation files were taken from the Phytozome database (v13, https://phytozome-next.jgi.doe.gov/, accessed on 25 August 2024). A local BLASTP was conducted using the amino acid sequences of AtREM as queries against the P. trichocarpa protein database with an E-value less than 10−5. The PFAM database [46] was used to evaluate the conserved protein domains of AtREM, and the hidden Markov model (HMM) files for Remorin_C (PF03763) and Remorin_N (PF03766) were retrieved. Using HMMER3.0 (http://www.hmmer.org/, accessed on 25 August 2024), the HMM was built and then examined against the P. trichocarpa protein database. All relevant sequence data that had an E-value of less than 10−5 were retained. After the findings from HMMER and BLASTP were combined, candidates for REM protein members were submitted to the HMMER database and the NCBI database (CDD) to verify conserved protein domains [47,48].

2.2. Bioinformatics Analysis

Using the PhytoMine tool on the Phytozome website (https://jgi.doe.gov, accessed on 26 August 2024), amino acid sequence analyses of PtREMs were carried out [49]. The gene models of 22 PtREMs were entered to determine the loci, chromosome position and amino acid number of the PtREM gene family in P. trichocarpa. The physicochemical properties of PtREMs were calculated using the ProtParam (https://web.expasy.org/protparam/, accessed on 26 August 2024) based on their amino acid sequences. The subcellular location of PtREMs was predicted using Plant mPLoc (version 2.0) [50] and the gene and protein structures were visualized using Tbtools (v 2.099) [51,52].

2.3. Phylogenetic and Sequence Analysis

A total of 38 protein sequences from P. trichocarpa and A. thaliana were acquired to construct the phylogenetic tree [1]. The ClustalW tool was used for sequence alignment and the maximum likelihood method was used to build the phylogenetic tree in MEGA software (version 11.0.13) [53]. The phylogenetic tree was visualized on the iTOL website (https://itol.embl.de/, 26 August 2024) [54].

2.4. Analysis of Cis-Acting Element

The 2000 bp sequences upstream of the start codon of PtREM family members were retrieved from the Phytozome website (https://jgi.doe.gov, accessed on 1 September 2024) [49] and submitted to the PlantCARE online website (https://bioinformatics.psb.ugent.be/webtools/plantcare/html/, accessed on 1 September 2024) for cis-acting element analysis and prediction [55].

2.5. Gene Duplication Events Analysis

The MCScanX software [56] was employed to detect gene duplication pairs of PtREM family members in P. trichocarpa. The TBtools software (v 2.099) [51,52] was used to compute the Ka/Ks values of gene replication pairs. Using the Advanced Circos tool in TBtools (v 2.099) [51,52], the collinearity maps of the PtREM gene family members in P. trichocarpa and among several plant species were produced.

2.6. Analysis of Gene Expression

The gene expression levels of PtREM gene family members in different treatments and tissues were downloaded from the Phytozome database [49].
The transcriptomes of P. trichocarpa under different stress treatments were downloaded from the SRA database under accession of PRJEB19784 with treatment as described previously [57]. Analyses of these stress transcriptomes were provided in the previous study [58]. The heatmaps of gene expression were performed with the pheatmap package [59] in R Studio (version 2023.12.1 Build 402).

2.7. Co-Expression Network Analysis

The top 50 most correlated genes of each PtREM in P. trichocarpa GeneAtlas (V2) were retrieved from the Phytozome website and considered as co-expression genes to construct the transcriptional co-expression network of PtREM family members in P. trichocarpa. The co-expression network was then visualized using Cytoscape software (version 3.8.2) [60]. Using the clusterProfiler package (version 4.12.0) [61], analyses of Gene Ontology (GO) and Kyoto Encyclopedia of Genes and Genomes (KEGG) were carried out in R and displayed as bubble diagrams, as suggested in the previous publications [62,63].

3. Results

3.1. Identification and Physicochemical Properties of PtREM Members

A total of 22 PtREM proteins were identified in the P. trichocarpa (V4.1) genome using the BLASTP and HMMER techniques (Table 1). Variations in the number of amino acids, molecular weight (MW), isoelectric point, and other features were examined (Table 1). The 22 PtREMs had protein lengths ranging from 124 aa to 606 aa; PtREM5.1 and PtREM3.1, respectively, had the longest and shortest encoding proteins (Table 1). The MW of the PtREM proteins ranged from 14.47 to 66.83 kDa, and 87% of them had isoelectric points larger than 7, indicating that the majority of PtREM proteins were alkaline proteins (Table 1). Furthermore, subcellular localization analyses of PtREM in P. trichocarpa revealed that six PtREM proteins were predictively found in the cell membrane, three in the nucleus, and thirteen in both the nucleus and the cell membrane (Table 1).
The 22 PtREMs were evenly distributed on 11 of the 19 chromosomes in the P. trichocarpa genome, with 1–3 genes on each chromosome, according to the chromosome distributions of PtREMs (Table 1). For example, PtREM2.1, PtREM6.3, and PtREM6.2 were located on Chr01, PtREM6.1, PtREM6.6, and PtREM6.7 were located on Chr08, PtREM6.5, PtREM6.8 and PtREM6.10 were distributed on Chr10, and PtREM1.3, PtREM5.2, and PtREM6.11 were distributed on Chr14 (Table 1).

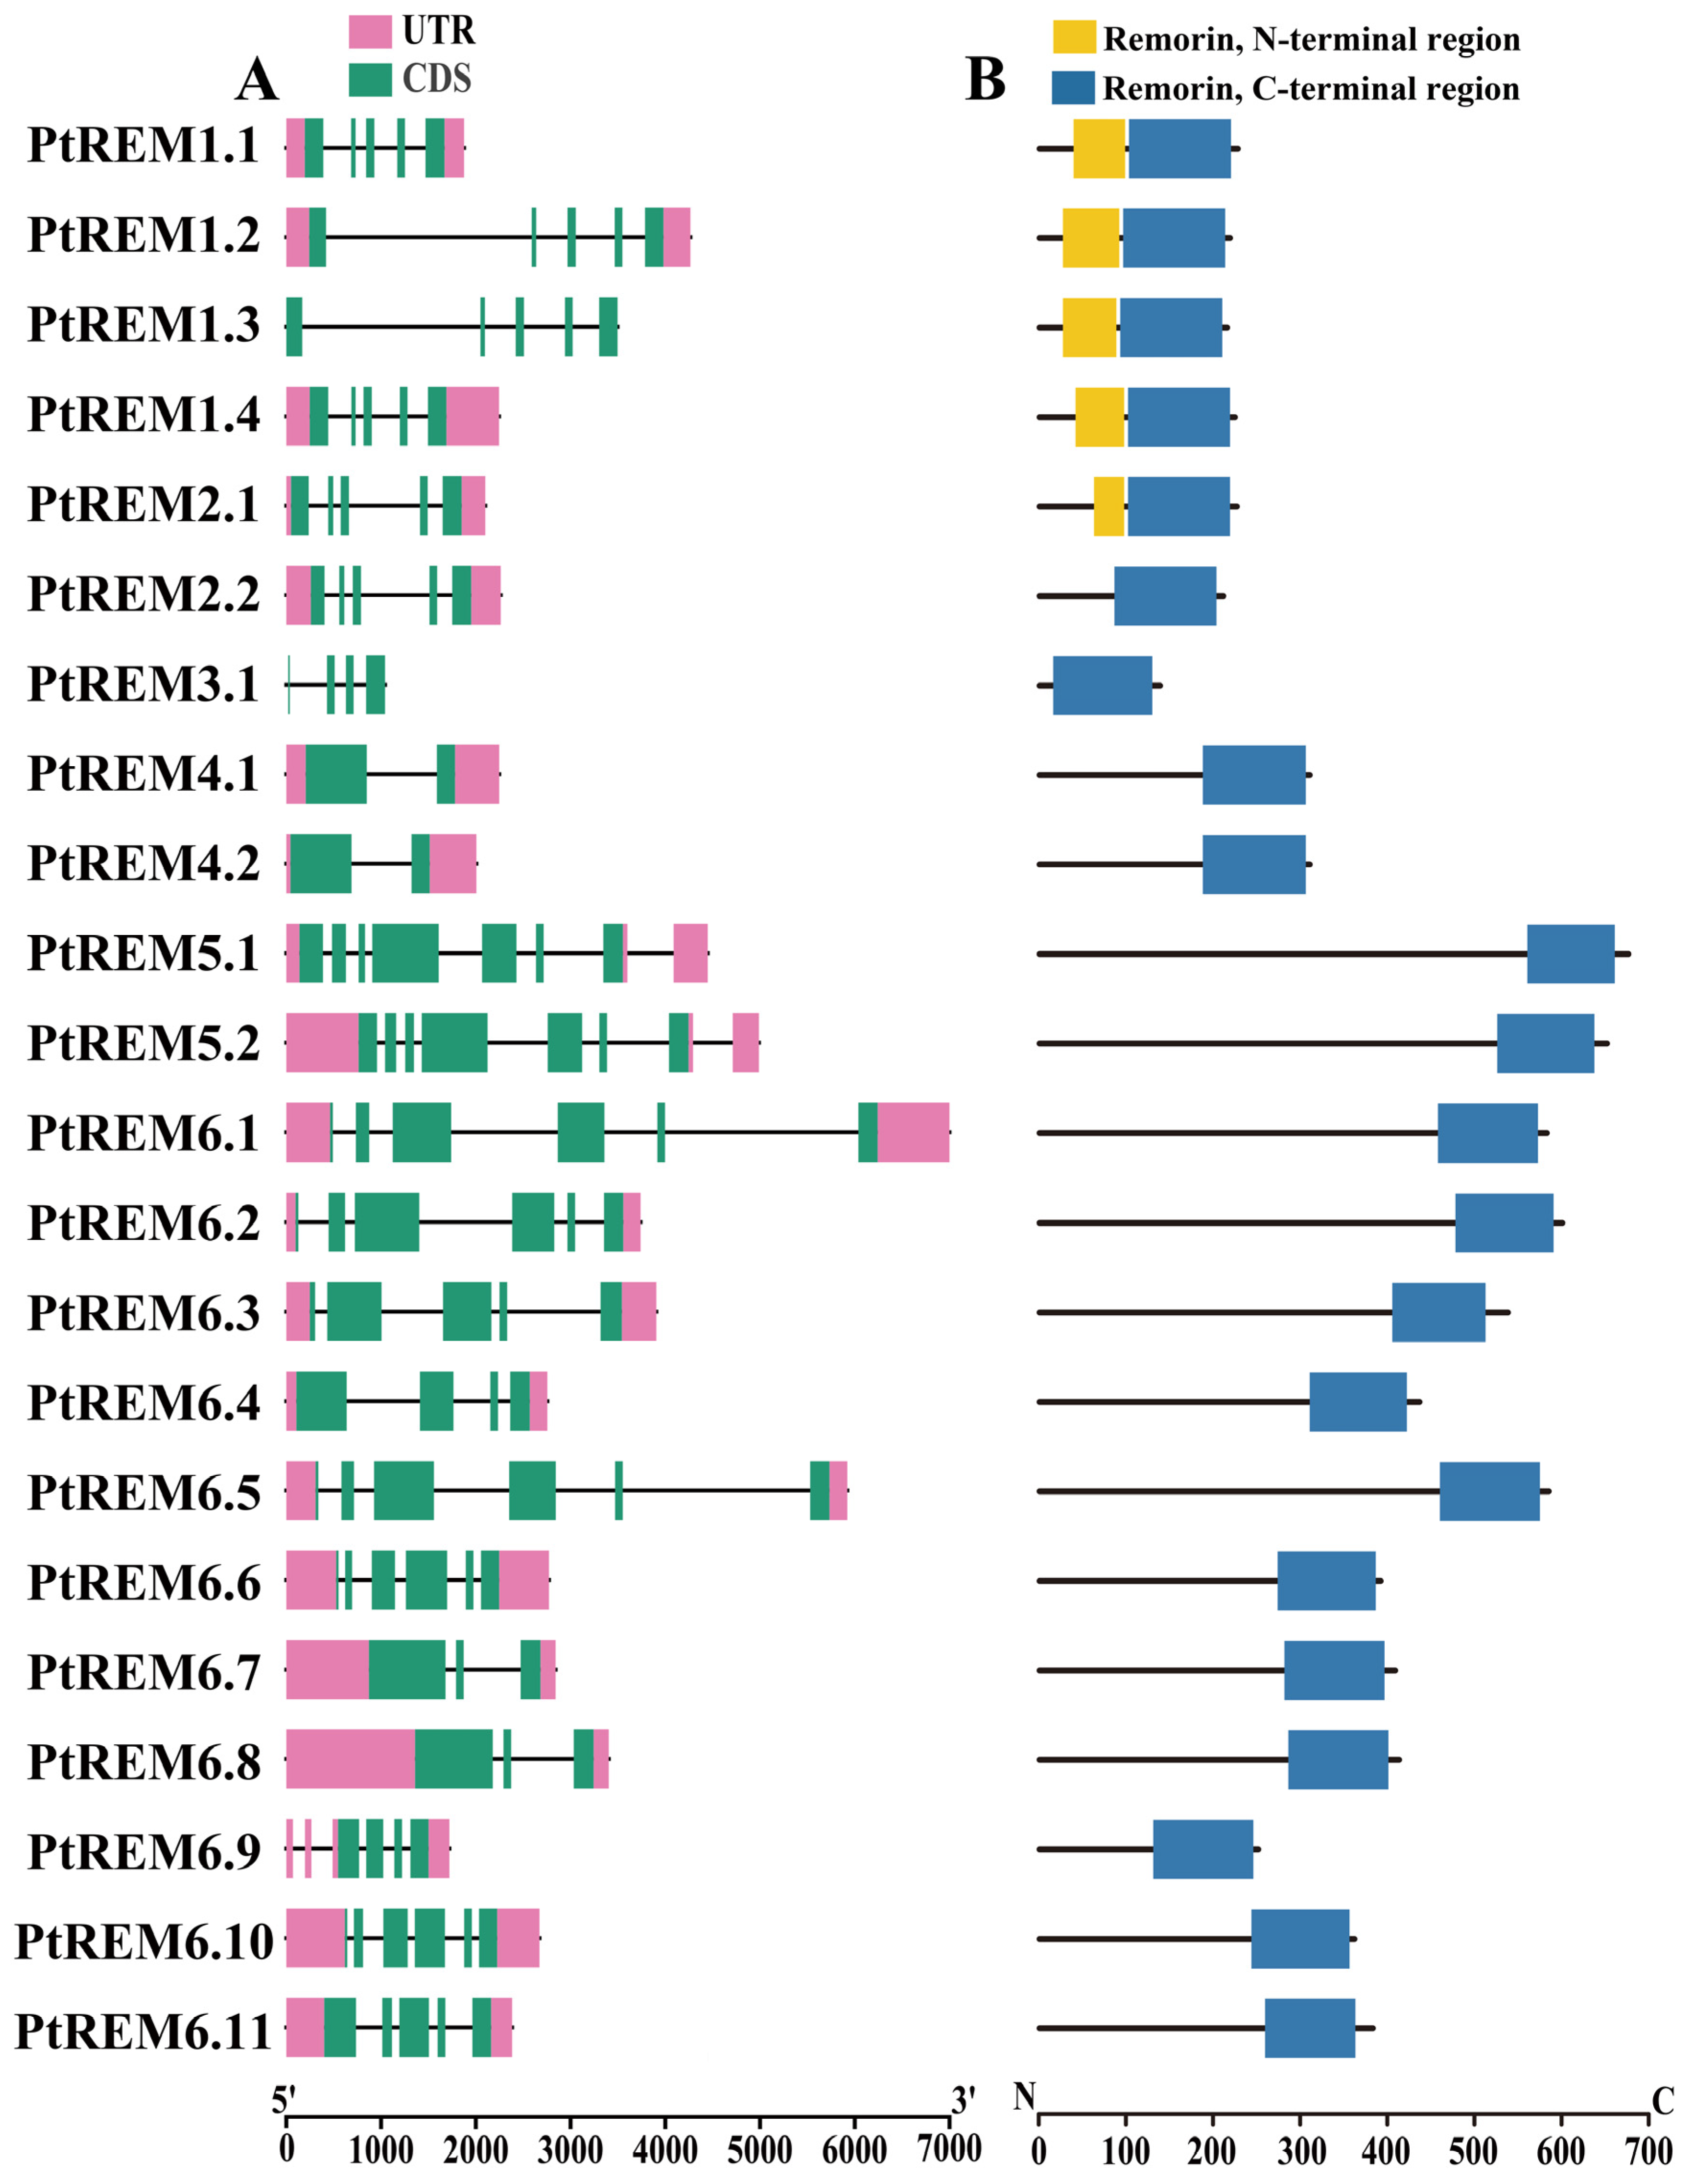
3.2. Structural and Phylogenetic Analysis of PtREMs

The gene architectures of the PtREM gene family varied greatly (Figure 1). Except for PtREM1.3 and PtREM3.1, the majority of PtREMs had 5′ and 3′ untranslated regions (UTR) (Figure 1A). While PtREM4.1 and PtREM4.2 only had one intron and two exons, PtREM3.1 only had 124 amino acids and the shortest coding sequences (CDS) (Figure 1A). PtREM5.1 and PtREM5.2 had the highest number of exons, whereas PtREM1.2, PtREM1.3, PtREM6.1, and PtREM6.5 had the longest introns (Figure 1A). The diverse gene structures of PtREMs implied that this gene family has experienced functional differentiation events during its evolutionary history. Regarding protein structures, the remaining PtREMs exclusively had Remorin-C regions; only PtREM1.1–1.4 and PtREM2.1 possessed both Remorin-C and Remorin-N domains (Figure 1). Consequently, the information implied that the Remorin-C regions of PtREM played important roles in their biological functions in poplar.
A maximum likelihood phylogenetic tree consisting of 38 REM proteins was constructed, with 22 and 16 REMs in P. trichocarpa and A. thaliana, respectively (Figure 2). In line with earlier research, the REM genes were categorized into six groups: PtREM1.1–PtREM1.4 were in group 1, PtREM2.1–PtREM2.2 were in group 2, PtREM3.1 were in group 3, PtREM4.1 and PtREM4.2 were assigned to group 4, PtREM5.1–PtREM5.2 were in group 5, and a total of eleven PtREM6s (PtREM6.1–PtREM6.11) were grouped in the same branch in group 6 (Figure 2). Groups 5 and 6 were tightly allocated together among the six groups, indicating that these two groupings had close phylogenetic ties (Figure 2).

3.3. Analysis of Gene Duplication Events

Gene duplication events are classified into two categories based on the physical location of replication pairs. Tandem duplications are defined as gene duplications that occur between adjacent positions on the same chromosome while segmental duplications are defined as gene duplications that occur at physical positions greater than 5 Mb or even on different chromosomes [64]. Chromosome mapping has revealed that 22 PtREM family members of P. trichocarpa are spread across 11 chromosomes, all of which belonged to fragment replication. The majority of PtREMs were found on Chr01, Chr10, and Chr14 (Table 1 and Figure 3).
The 22 PtREMs in the P. trichocarpa genome contained a total of 20 gene duplication pairs that belonged to segmental duplications according to the results of paralogous gene analysis (Figure 3A). Between Chr10 and Chr8, a total of three pairs of gene duplications were found: PtREM6.10/PtREM6.6, PtREM6.5/PtREM6.1, and PtREM6.8/PtREM6.7, respectively (Figure 3A). Based on the calculation of 20 gene duplication pairs of PtREMs, the Ka/Ks values ranged from 0.11 to 0.76 (Supplementary Table S1), suggesting that most PtREMs had experienced substantial purification selection during their evolutionary history. Furthermore, between P. trichocarpa and Arabidopsis, 24 collinearity gene pairs were discovered, and between Oryza sativa and P. trichocarpa, 16 REM collinearity gene pairs were discovered (Figure 3B).

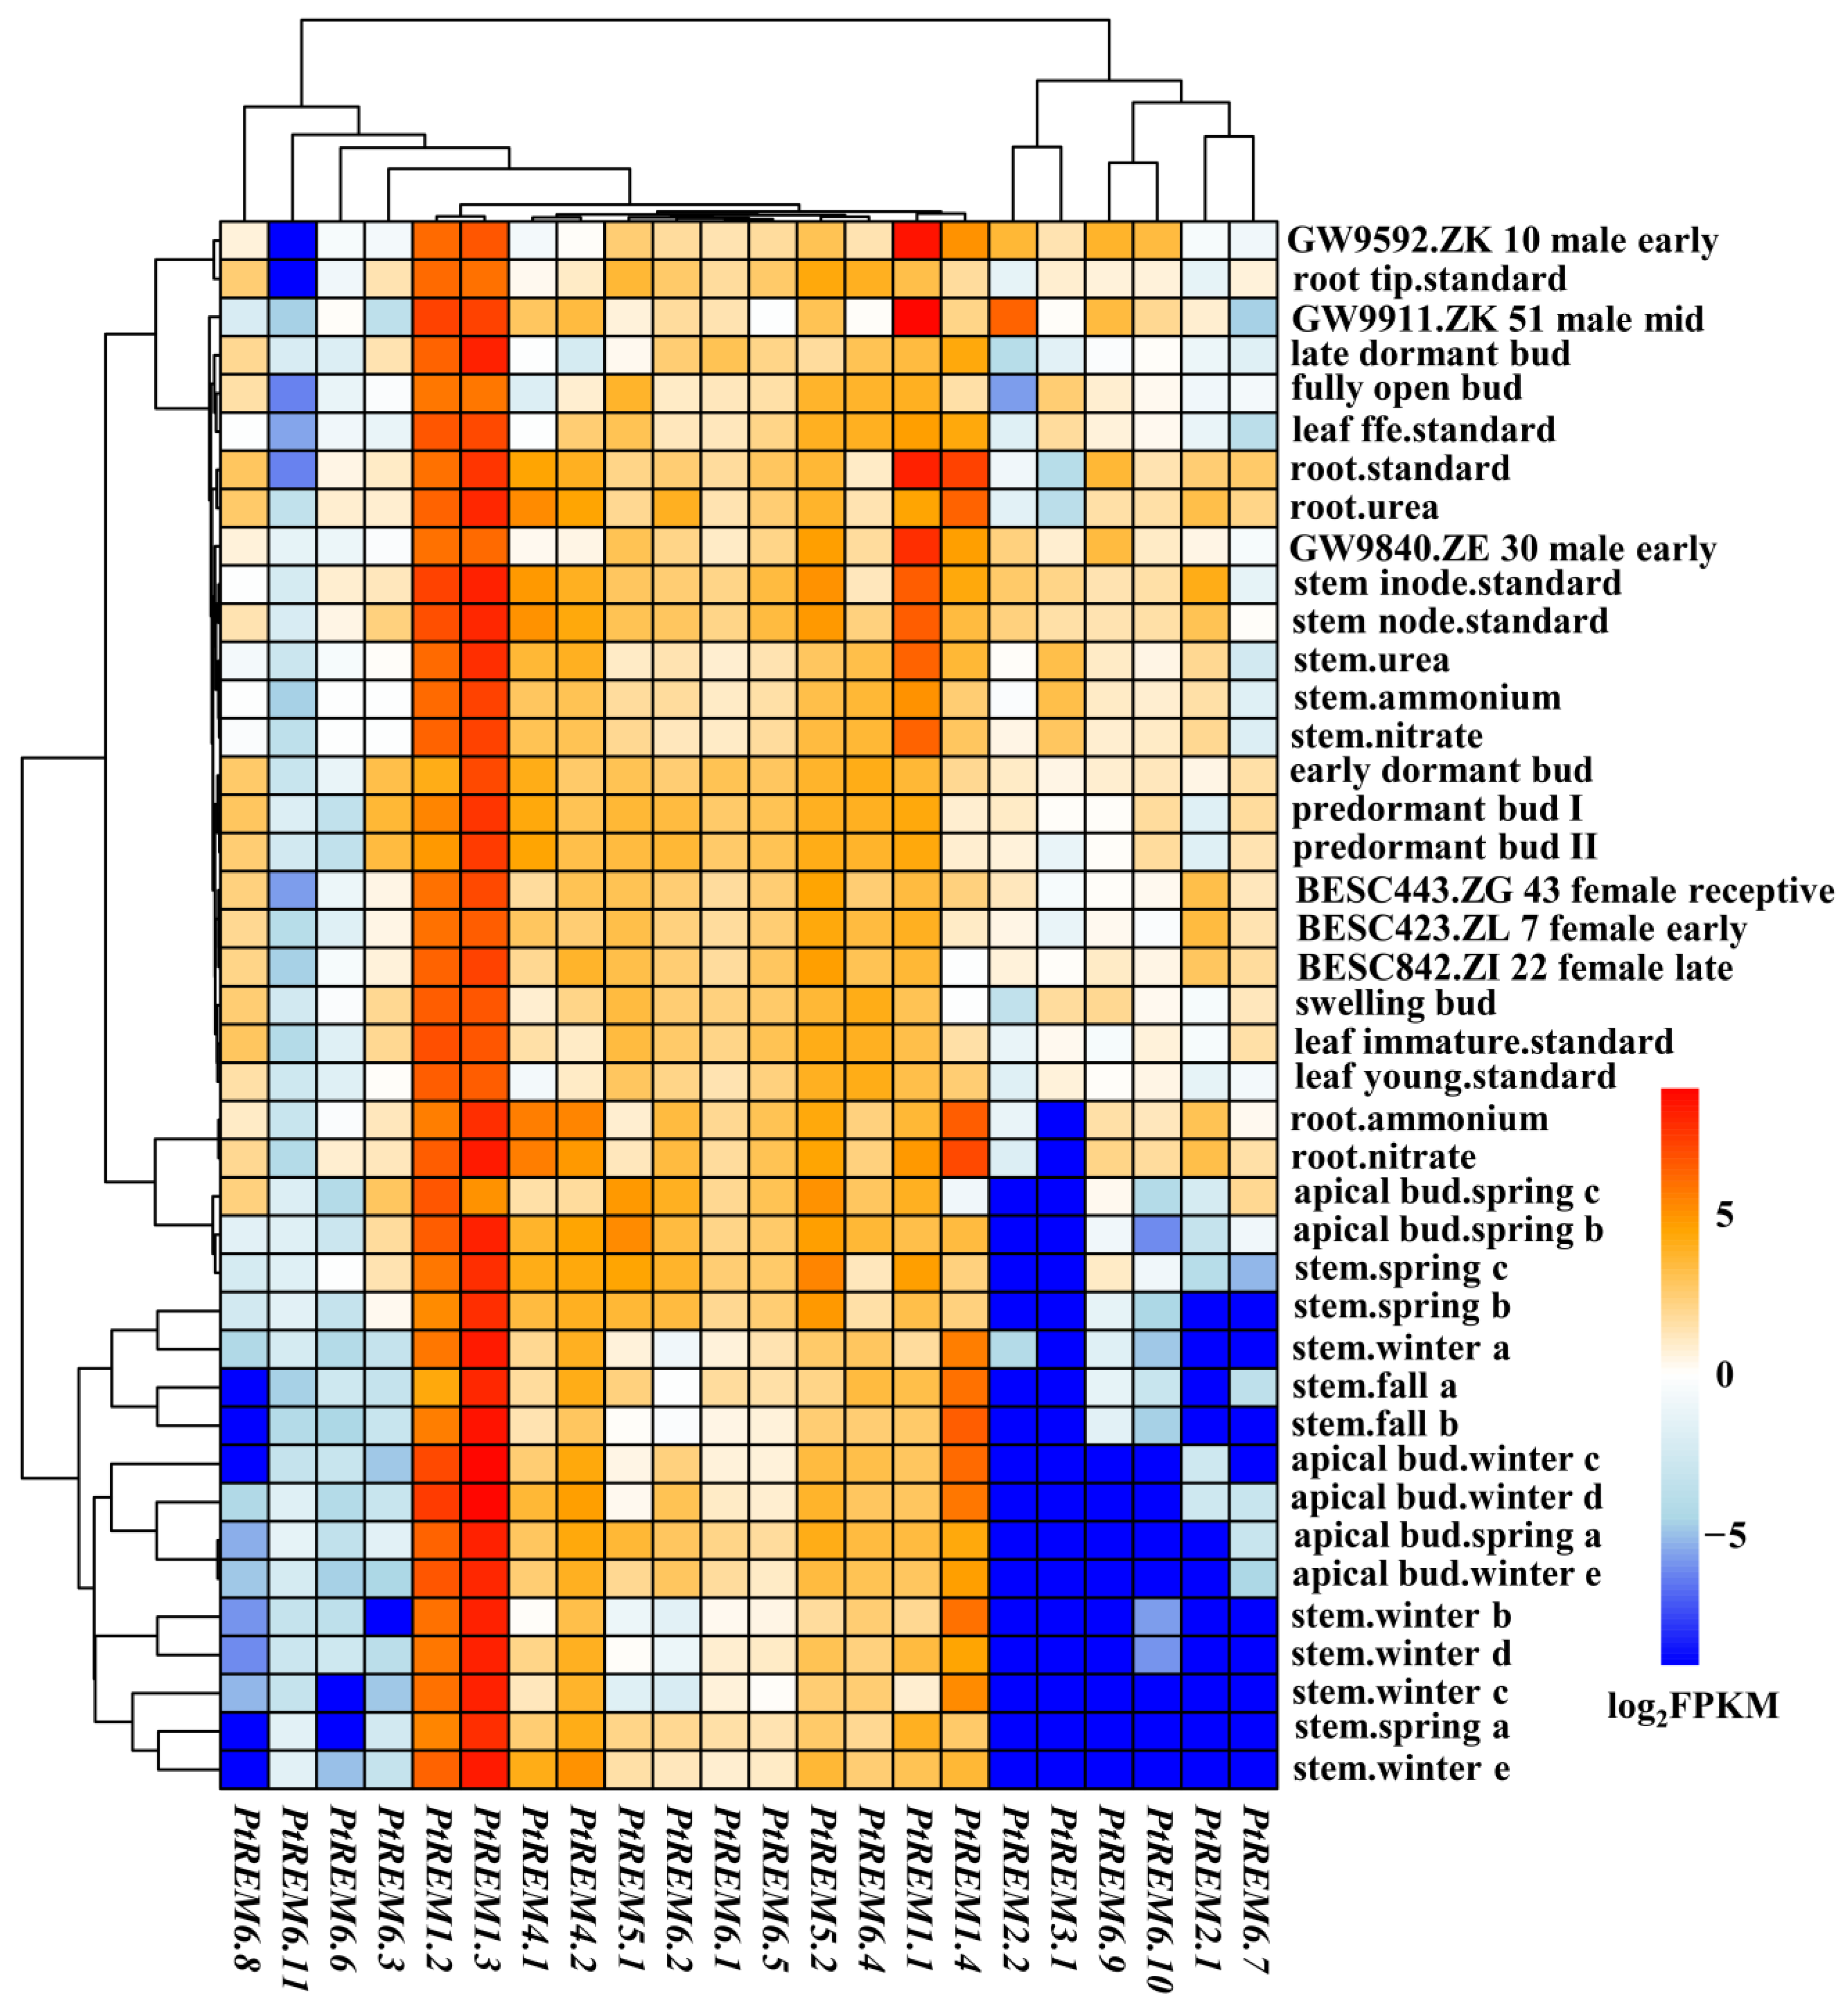
3.4. Tissue Specific Expression Analysis of PtREM Genes in P. trichocarpa

The expression levels of PtREMs in different tissues across growth seasons were retrieved from the Phytozome database (Figure 4). Tissue-specific expression profiles were detected for most PtREMs across the growth season (Figure 4). For instance, seven PtREM6s (i.e., PtREM6.3 and PtREM6.6–PtREM6.11), as well as PtREM2.1–PtREM3.1, were seldom expressed in stems and apical buds across the growth season while moderately expressed in the remaining tissues, except for PtREM6.6 and PtREM6.11 (Figure 4). PtREM1.2 and PtREM1.3 were highly expressed among all the detected different tissues (Figure 4); the remaining PtREMs showed no significant tissue specificity (Figure 4). This tissue-specific expression pattern provides a preliminary clue for the function of PtREMs in plants and lays the foundation for further exploration of the function of PtREMs.

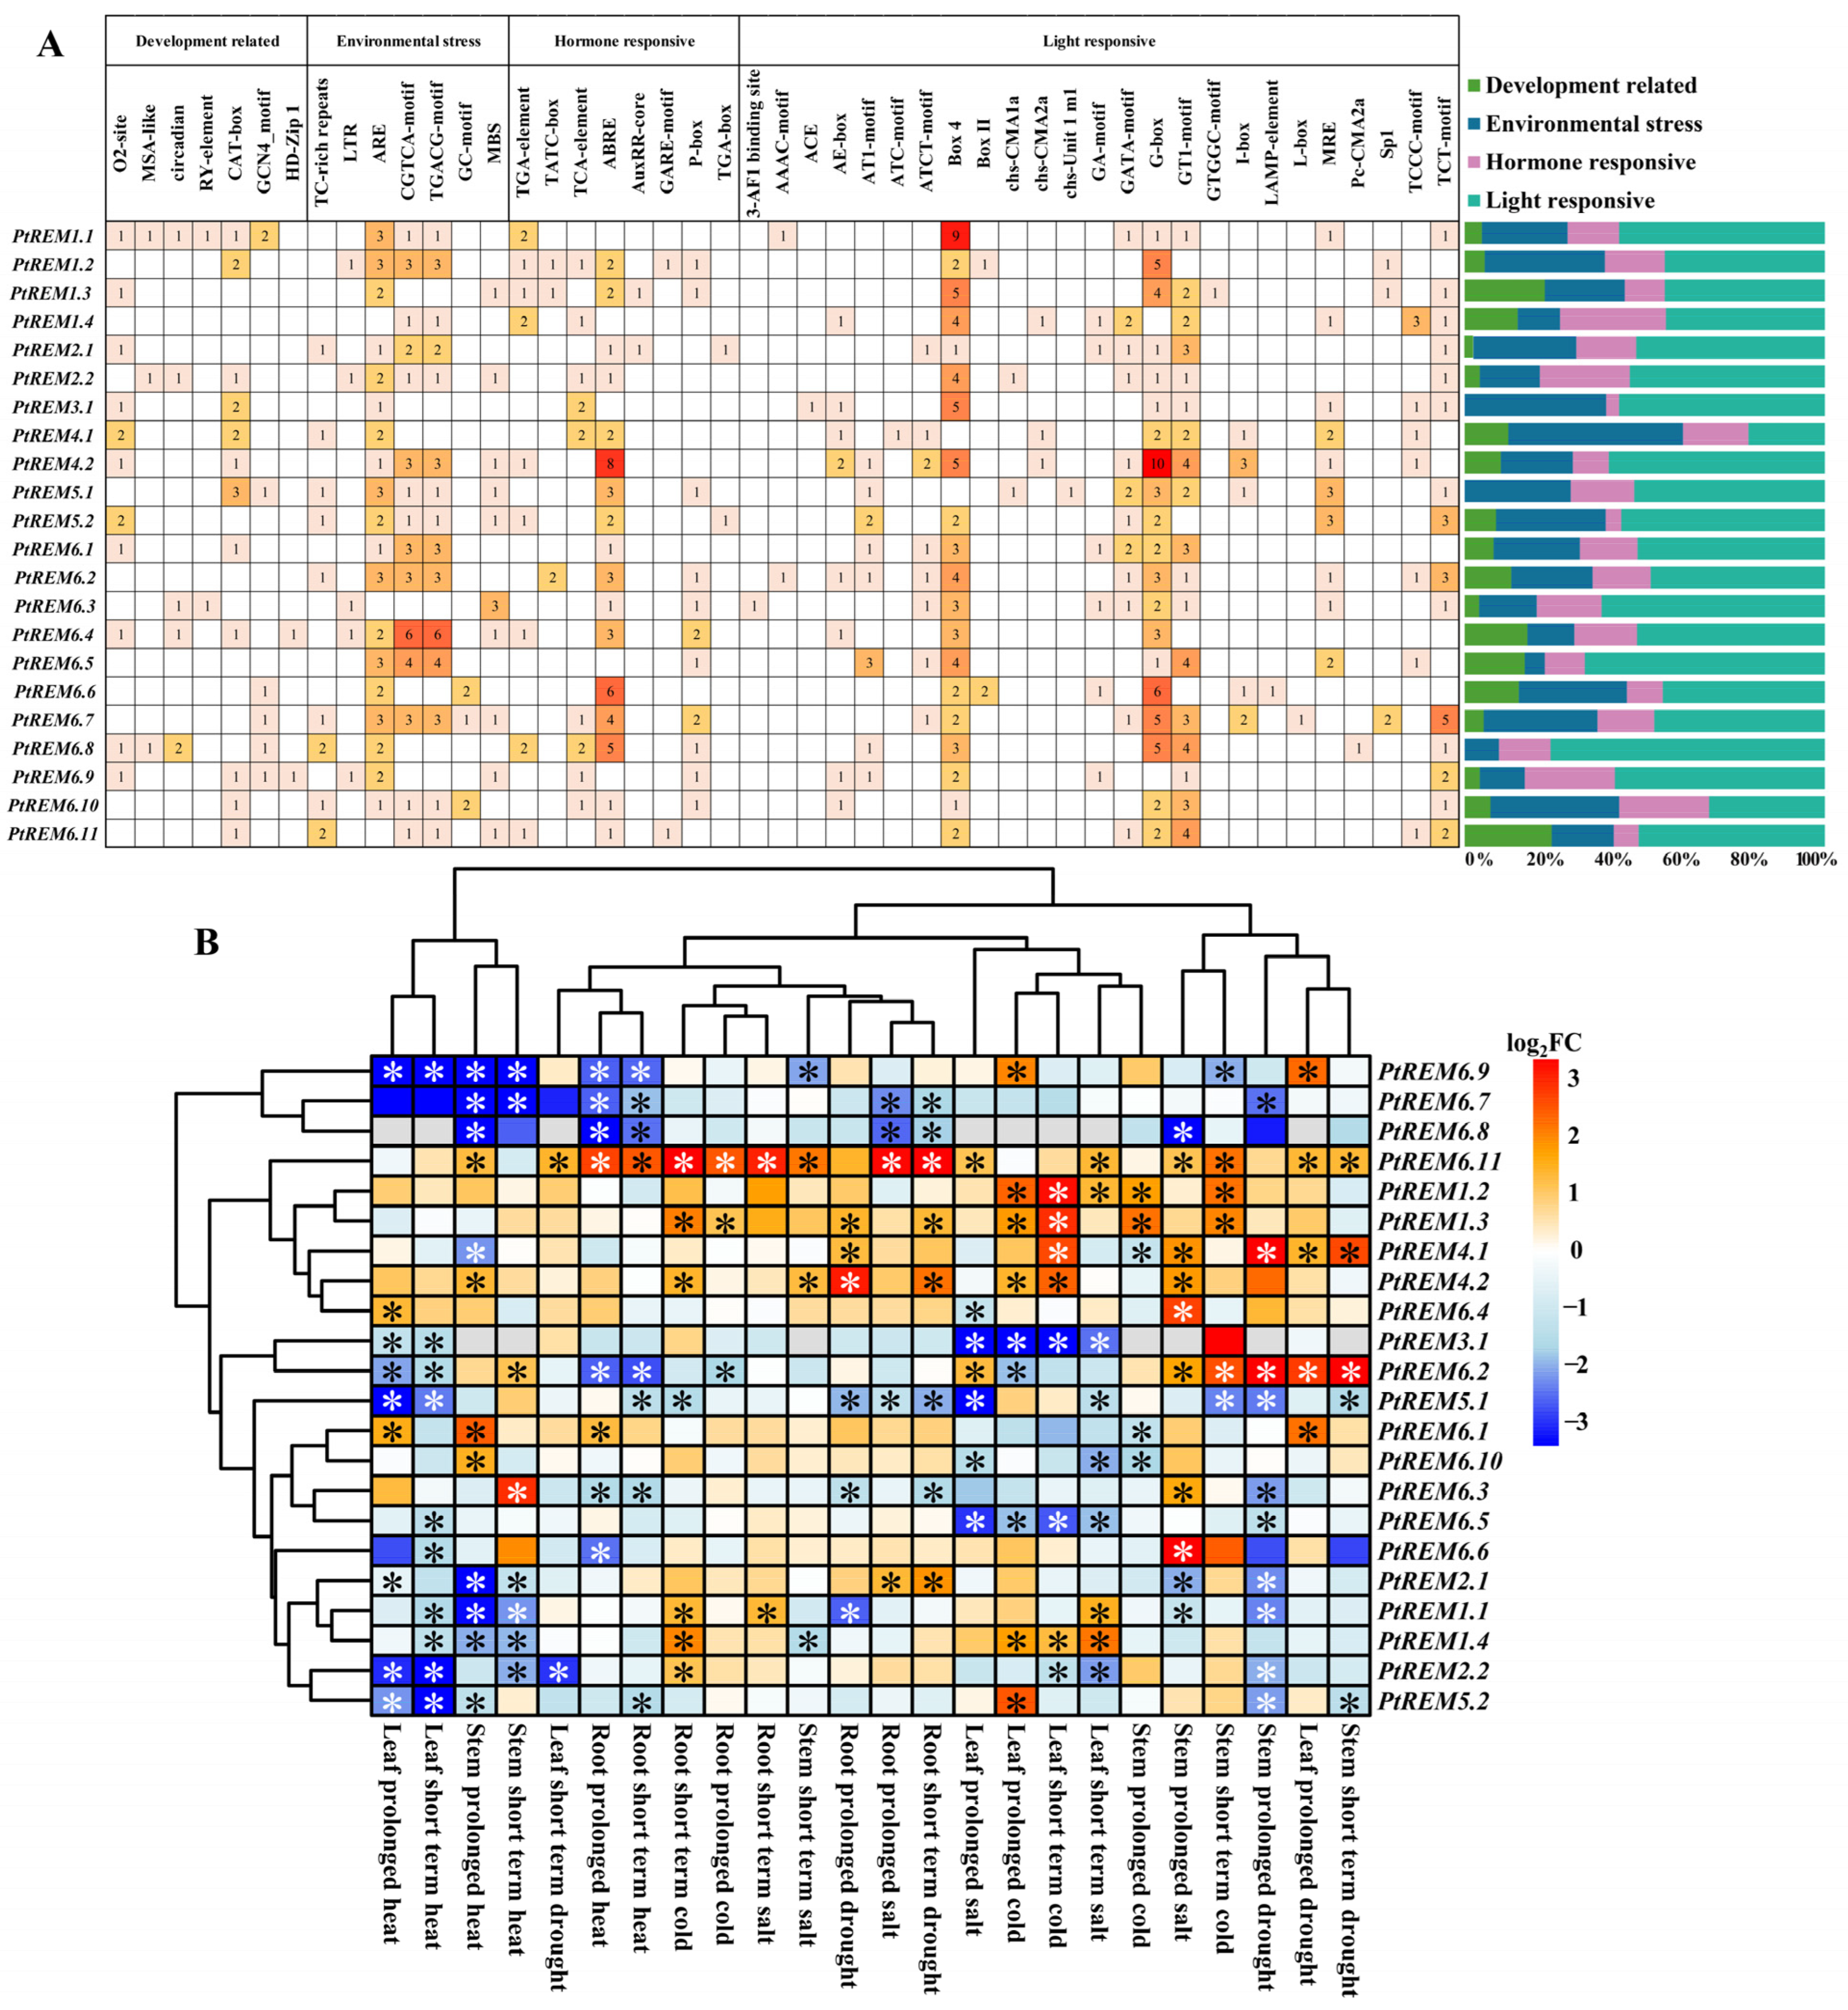
3.5. Cis-Acting Element Analysis

To study the possible regulation of PtREMs in P. trichocarpa, the cis-acting elements of PtREM promoters were analyzed (Figure 5A). The results showed that many cis-acting elements related to plant growth and development, stress, hormone response and light response were found in PtREM promoters (Figure 5A). For plant growth and development elements, most PtREMs contain O2 sites involved in the regulation of zein metabolism and in the cis-acting element CAT-box upstream of eukaryotic structural genes (Figure 5A). As for the stress response elements, the anaerobic induction essential element ARE and the CGTCA-motif and TGACG-motif involved in the MeJA response were ubiquitous in the promoters of PtREMs (Figure 5A), which implies that PtREM may be involved in stress response. As for hormone-responsive cis-elements, most PtREMs contain ABRE involved in abscisic acid response and TCA-element involved in salicylic acid response (Figure 5A), indicating that PtREM might be regulated by multiple hormone signaling pathways. The promoters of PtREM also generally contained Box4, G-Box and GT1-motif light-responsive cis-acting elements, implying that PtREMs may be regulated by light signaling (Figure 5A). Among the detected cis-acting elements, the cis-acting elements assigned as light responses occupied ca. 21.21–76.19% of all detected cis-acting elements for all the PtREMs (Figure 5A) while ca. 4.17–4.76% cis-acting elements belonging to development regulation were detected for PtREM1.3 and PtREM6.11 (Figure 5A), suggesting potential roles of these two genes in poplar development processes. Additionally, eight cis-acting elements of ABRE were detected in the promoter of PtREM4.2 (Figure 5A). Taken together, the obtained data suggest PtREMs play an important role in plant growth and development, stress, hormone responses and light responses.
As considerable cis-acting elements related to stress response, the transcriptional expression levels of PtREMs responding to diverse stress conditions in different tissues were analyzed using online transcriptome data (Figure 5B). PtREM6.7–PtREM6.9 showed similar expression profiles to diverse stress conditions, which were inhibited by prolonged and/or short-term heat stress in roots, stems and leaves for most cases (Figure 5B). The duplication gene pairs of PtREM1.2 and PtREM1.3 were significantly induced by prolonged and/or short-term cold stress in leaves and stems of P. trichocarpa (Figure 5B). In addition, the PtREM4.1/PtREM4.2 gene duplication pair, whose mRNA levels were significantly induced by prolonged salt in stems, short-term cold in leaves, and prolonged drought in roots, showed similar gene expression patterns in response to diverse stress conditions (Figure 5B). Additionally, the mRNA levels of PtREM6.11 were significantly stimulated by most detected stress conditions, while PtREM5.1 displayed the opposite responses (Figure 5B). The foliar mRNA levels of PtREM3.1 and PtREM6.5 were significantly downregulated to prolonged and/or short-term heat, salt and cold stresses (Figure 5B). Finally, two gene duplication pairs of PtREM1.1/PtREM1.4 and PtREM2.1/PtREM2.2, together with PtREM5.2, were assigned to the same cluster with significantly decreased mRNA levels under short-term drought in stems and under prolonged and/or short-term heat stresses in leaves and stems of P. trichocarpa (Figure 5B). Additionally, PtREM1.1 and PtREM1.4 were induced by short-term salt in leaves and by short-term cold in roots (Figure 5B).

3.6. Co-Expression Network Analysis of PtREMs

To uncover the possible biological functions played by PtREMs, a transcriptional co-expression network has been constructed by a total of 1035 genes with 1100 interactions (Figure 6A). Five PtREMs (i.e., PtREM2.1, PtREM5.2, PtREM6.1, PtREM6.3, and PtREM6.5) shared certain common co-expression genes to form the biggest module in the co-expression network (Figure 6A). Additionally, gene duplication pairs of PtREM4.1/PtREM4.2 and PtREM6.7/PtREM6.8 also had some common co-expressed genes (Figure 6A). Several genes from the same subgroup also shared lots of common co-expressed genes, such as PtREM2.2 and PtREM3.1, PtREM1.3 and PtREM1.4, as well as PtREM6.9 and PtREM6.10 (Figure 6A). None of the shared, co-expressed genes with other PtREMs were detected for PtREM1.1, PtREM2.1, PtREM6.4, PtREM6.6 and PtREM6.11 (Figure 6A). The GO and KEGG enrichment analysis of genes in the PtREMs co-expressed network implied roles of PtREMs in protein ubiquitination and modification, plant hormone signal transduction, ubiquitin-protein transferase activity, and microtubule-based movement (Figure 6B).

4. Discussion

REM is a plant-specific protein located on the PM, which plays an important role in plant growth and stress response [4]. In recent years, the REM gene family has been identified in many species, such as A. thaliana, O. sativa, Brassica napus, Setaria italica and Saccharum [1,10,65,66]. A total of 22 PtREMs were identified in poplar; 19 of them were predictively cellularly distributed on the cell membrane, which implied that PtREMs might affect the structure of the PM to a certain extent [20]. Two PtREM2 members were found in the genome of P. trichocarpa, which was consistent with the earlier findings that the REM2 members were only detected in legumes and poplar species [1,10].
Only five of the PtREMs contain both Remorin-C and Remorin-N domains while the rest ones only contain the Remorin-C conserved domain, suggesting that the Remorin-C conserved domain is essential for their functions. Consistent with existing knowledge, the C-terminal structure of REM proteins is stable while the N-terminal structure changes greatly [1]. The C-terminal region of the REM, as a signature region of the REM gene family, has a highly conserved coiled-coil structure and hydrophobicity [3] and plays an important role in both the binding of the REM to the PM and the interaction between the proteins [18,19]. Studies have shown that the C-terminal region of AtREM1.3 is essential for stable protein oligomerization, and its N-terminal region promotes the interaction with importin α isoforms (AtIMPα) [67]. Some PtREMs contained only one Remorin-C domain with large variations. Moreover, the differences in N-terminal structures may endow diverse biological functions for plants [19]. Although the members of PtREMs from Group 1 contained both Remorin-N and Remorin-C domains, they showed distinct transcriptional responses to diverse stress conditions, implying that functional differentiation among PtREM1 has occurred. Interestingly, only one (PtREM2.1) out of two PtREM2s contained the Remorin-N domain. Gene duplication analysis detected two duplication events for PtREM2.1 with PtREM1 members, suggesting that PtREM2.1 may originate from PtREM1.
Tissue-specific analysis of PtREMs showed that all the members of PtREM1, PtREM4 and PtREM5 were constitutively high or moderately expressed in different tissues, suggesting the essential roles played by these genes in normal plant growth and development. In line with this, PdREM from P. deltoides regulates vascular growth and wood properties [42]. Additionally, PtREM3.1 and PtREM6.7–PtREM6.11 showed low expression in apical buds and stems across the growth seasons. In the fruits of Mangifera indica L., the REM genes were stimulated by cold stress in a brassinolide-dependent manner [68], highlighting the importance of PM proteins in coping with cold stress for plants. In current studies, PtREM1.1–PtREM1.4, PtREM2.2, PtREM4.1, PtREM4.2, PtREM6.2, PtREM6.9 and PtREM6.11 were stimulated in at least one tissue by cold stress, suggesting that these genes played important roles in stabilizing PM structures to allow them to cope with cold stress. The expression levels of AtREM4.1 and AtREM4.2 significantly increased after stress treatment and plant hormone treatment [1]. Accordingly, the expression levels of PtREM4.1 and PtREM4.2 in the same group also increased after diverse stress treatments, and the PtREM4.2 promoter contains many stress and hormone response cis-acting elements. Therefore, the roles of PtREM4.1 and PtREM4.2 in improving the stress resistance in P. trichocarpa could be expected, though further studies are needed to verify this.
Upon different stress treatments, the gene expression patterns of the genes from the same phylogenetic branch were highly similar, especially for gene duplication pairs. For example, PtREM1.2 and PtREM1.3 were greatly affected by cold stress and the expression was significantly upregulated after cold stress treatment. PtREM4.1 and PtREM4.2 were upregulated after drought and cold stress treatment. The expression levels of PtREM6.4 and PtREM6.6 in stems were increased after long-term salt treatment. Gene co-expression network analysis also uncovered that gene duplication pairs of PtREM4.1/PtREM4.2 and PtREM6.7/PtREM6.8 shared certain common co-expressed genes. These results suggest that some gene duplication pairs of PtREMs from the same group may have similar functions in response to environmental stresses. However, the PtREM2.1 showed distinct gene expression profiles with its duplicate gene pairs (i.e., PtREM1.2 and PtREM1.3), suggesting that there are different roles played by PtREM2.1 and its duplicate pairs in the PtREM1 group in response to environmental stresses.
Salt stress is one of the most serious abiotic stresses, which has serious negative effects on plant growth and ecosystem productivity worldwide [69]. In foxtail millet (S. italica), the expression levels of SiREM6 were significantly induced by high salt stress, and overexpression of SiREM6 in Arabidopsis improved the plants’ tolerance to salt stress [70]. Similarly, overexpression of P. euphratica REM6.5 in Arabidopsis activates the activities of PM H+-ATPase to improve the tolerance to salt stress in transgenic plants [71]. Further, overexpression of mulberry (Morus indica) MiREM in Arabidopsis improved the growth performance under drought stress conditions [11]. Accordingly, the mRNA levels of PtREM4.1, PtREM4.2 and PtREM6.11 were significantly stimulated by the salt, drought and cold stresses together with several cis-acting elements related to stress response on the promoters of these genes, suggesting their potential roles in coping with salt stress. Therefore, PtREM4.1, PtREM4.2 and PtREM6.11 could serve as molecular targets for improving plants’ resistance to environmental stresses.

5. Conclusions

A total of 22 PtREM family members were identified in the genome of P. trichocarpa, which were evenly distributed on 11 chromosomes. All PtREM proteins contained the conserved Remorin-C domain and only PtREM1.1-PtREM1.4 and PtREM2.1 contained the Remorin-N domain. A total of 13 pairs of gene duplication events were identified in the PtREM gene family, all of which belonged to fragment duplication. All the Ka/Ks values of duplicated gene pairs were less than 1, suggesting purification selection has occurred during evolution. Considerable cis-acting elements were detected, which could be assigned to plant development, environmental stress, hormone responses and light responses. The transcriptional analysis showed distinct gene expression profiles of the PtREM gene family in response to diverse environmental stresses in different tissues. Several duplicated gene pairs of PtREMs showed similar gene expression patterns to environmental stresses, implying the functional redundancy of these duplicated gene pairs for environmental adaptation. A co-expression network centered by PtREMs was constructed to uncover the possible roles in protein ubiquitination, microtube-based processes and plant hormone signal transduction. Taken together, the obtained results lay a foundation for understanding the essential roles played by PtREMs in poplar growth and environmental adaptation, as well as the molecular targets of genetic improvements for abiotic stresses.

Supplementary Materials

The following supporting information can be downloaded at: https://www.mdpi.com/article/10.3390/life14101239/s1, Table S1. Molecular evolutionary analysis of the PtREM genes.

Author Contributions

Conceptualization, J.L. and H.L.; investigation, Z.L., H.W., C.L., H.L. and J.L.; data curation, Z.L., H.W., C.L., H.L. and J.L.; writing—original draft preparation, Z.L., H.W., H.L. and J.L.; writing—review and editing, Z.L., H.L. and J.L.; visualization, Z.L., H.W., H.L. and J.L.; supervision, H.L. and J.L.; project administration, J.L.; funding acquisition, J.L. All authors have read and agreed to the published version of the manuscript.

Funding

This study was jointly supported by the National Natural Science Foundation of China (Grant Nos. 32171768 and 31901282) and the Fundamental Research Funds for the Central Universities (Grant no. 2262022YLYJ007).

Institutional Review Board Statement

Not applicable.

Informed Consent Statement

Not applicable.

Data Availability Statement

Data will be available upon request.

Conflicts of Interest

The authors declare no conflicts of interest.

References

  1. Raffaele, S.; Mongrand, S.; Gamas, P.; Niebel, A.; Ott, T. Genome-wide annotation of remorins, a plant-specific protein family: Evolutionary and functional perspectives. Plant Physiol. 2007, 145, 593–600. [Google Scholar] [CrossRef] [PubMed]
  2. Peskan, T.; Westermann, M.; Oelmüller, R. Identification of low-density Triton X-100-insoluble plasma membrane microdomains in higher plants. Eur. J. Biochem. 2000, 267, 6989–6995. [Google Scholar] [CrossRef] [PubMed]
  3. Reymond, P.; Kunz, B.; PaulPletzer, K.; Grimm, R.; Eckerskorn, C.; Farmer, E.E. Cloning of a cDNA encoding a plasma membrane-associated, uronide binding phosphoprotein with physical properties similar to viral movement proteins. Plant Cell 1996, 8, 2265–2276. [Google Scholar] [PubMed]
  4. Bariola, P.A.; Retelska, D.; Stasiak, A.; Kammerer, R.A.; Fleming, A.; Hijri, M.; Franks, S.; Farmer, E.E. Remorins form a novel family of coiled coil-forming oligomeric and filamentous proteins associated with apical, vascular and embryonic tissues in plants. Plant Mol. Biol. 2004, 55, 579–594. [Google Scholar] [CrossRef]
  5. Cai, J.; Qin, G.; Chen, T.; Tian, S. The mode of action of remorin1 in regulating fruit ripening at transcriptional and post-transcriptional levels. New Phytol. 2018, 219, 1406–1420. [Google Scholar] [CrossRef]
  6. Raffaele, S.; Bayer, E.; Mongrand, S. Upregulation of the plant protein remorin correlates with dehiscence and cell maturation A link with the maturation of plasmodesmata? Plant Signal. Behav. 2009, 4, 915–919. [Google Scholar] [CrossRef]
  7. Son, S.; Oh, C.J.; Bae, J.-H.; Lee, H.; An, C.S. GmREM1.1 and GmREM2.1, which encode the remorin proteins in soybean, have distinct roles during root nodule development. J. Plant Biol. 2015, 58, 17–25. [Google Scholar] [CrossRef]
  8. Gui, J.; Zheng, S.; Liu, C.; Shen, J.; Li, J.; Li, L. OsREM4.1 Interacts with OsSERK1 to coordinate the interlinking between abscisic acid and brassinosteroid signaling in rice. Dev. Cell 2016, 38, 202–213. [Google Scholar] [CrossRef]
  9. Lefebvre, B.; Timmers, T.; Mbengue, M.; Moreau, S.; Herve, C.; Toth, K.; Bittencourt-Silvestre, J.; Klaus, D.; Deslandes, L.; Godiard, L.; et al. A remorin protein interacts with symbiotic receptors and regulates bacterial infection. Proc. Natl. Acad. Sci. USA 2010, 107, 2343–2348. [Google Scholar] [CrossRef]
  10. Wang, Y.; Li, J.; Li, M.; Li, Y.; Zhao, Z.; Li, C.; Yue, J. Genome-wide characterization of Remorin genes in terms of their evolution and expression in response to hormone signals and abiotic stresses in foxtail millet (Setaria italica). Diversity 2022, 14, 711. [Google Scholar] [CrossRef]
  11. Checker, V.G.; Khurana, P. Molecular and functional characterization of mulberry EST encoding remorin (MiREM) involved in abiotic stress. Plant Cell Rep. 2013, 32, 1729–1741. [Google Scholar] [CrossRef] [PubMed]
  12. Retelska, D.; Framer, E.E.; Fleming, A. Overexpression of remorin leads to cell defense and cell death in tobacco. Plant Biol. 2000, 2000, 32. [Google Scholar]
  13. Jamann, T.M.; Luo, X.; Morales, L.; Kolkman, J.M.; Chung, C.-L.; Nelson, R.J. A remorin gene is implicated in quantitative disease resistance in maize. Theor. Appl. Genet. 2016, 129, 591–602. [Google Scholar] [CrossRef] [PubMed]
  14. Raffaele, S.; Perraki, A.; Mongrand, S. The Remorin C-terminal Anchor was shaped by convergent evolution among membrane binding domains. Plant Signal. Behav. 2013, 8, e23207. [Google Scholar] [CrossRef] [PubMed]
  15. Perraki, A.; Cacas, J.-L.; Crowet, J.-M.; Lins, L.; Castroviejo, M.; German-Retana, S.; Mongrand, S.; Raffaele, S. Plasma membrane localization of Solanum tuberosum Remorin from Group 1, homolog 3 is mediated by conformational changes in a novel C-terminal anchor and required for the restriction of potato virus X movement. Plant Physiol. 2012, 160, 624–637. [Google Scholar] [CrossRef] [PubMed]
  16. Martinez, D.; Legrand, A.; Gronnier, J.; Decossas, M.; Gouguet, P.; Lambert, O.; Berbon, M.; Verron, L.; Grelard, A.; Germain, V.; et al. Coiled-coil oligomerization controls localization of the plasma membrane REMORINs. J. Struct. Biol. 2019, 206, 12–19. [Google Scholar] [CrossRef]
  17. Gronnier, J.; Crowet, J.-M.; Habenstein, B.; Nasir, M.N.; Bayle, V.; Hosy, E.; Platre, M.P.; Gouguet, P.; Raffaele, S.; Martinez, D.; et al. Structural basis for plant plasma membrane protein dynamics and organization into functional nanodomains. Elife 2017, 6, e26404. [Google Scholar] [CrossRef]
  18. Toth, K.; Stratil, T.F.; Madsen, E.B.; Ye, J.; Popp, C.; Antolin-Llovera, M.; Grossmann, C.; Jensen, O.N.; Schuessler, A.; Parniske, M.; et al. Functional domain analysis of the remorin protein LjSYMREM1 in Lotus japonicus. PLoS ONE 2012, 7, e30817. [Google Scholar] [CrossRef]
  19. Marin, M.; Ott, T. Phosphorylation of intrinsically disordered regions in remorin proteins. Front. Plant Sci. 2012, 3, 86. [Google Scholar] [CrossRef]
  20. Konrad, S.S.A.; Popp, C.; Stratil, T.F.; Jarsch, I.K.; Thallmair, V.; Folgmann, J.; Marin, M.; Ott, T. S-acylation anchors remorin proteins to the plasma membrane but does not primarily determine their localization in membrane microdomains. New Phytol. 2014, 203, 758–769. [Google Scholar] [CrossRef]
  21. Legrand, A.; G-Cava, D.; Jolivet, M.-D.; Decossas, M.; Lambert, O.; Bayle, V.; Jaillais, Y.; Loquet, A.; Germain, V.; Boudsocq, M.; et al. Structural determinants of REMORIN nanodomain formation in anionic membranes. Biophys. J. 2023, 122, 2192–2202. [Google Scholar] [CrossRef] [PubMed]
  22. Gui, J.; Liu, C.; Shen, J.; Li, L. Grain setting defect1, encoding a remorin protein, affects the grain setting in rice through regulating plasmodesmatal conductance. Plant Physiol. 2014, 166, 1463–1478. [Google Scholar] [CrossRef] [PubMed]
  23. Gui, J.; Zheng, S.; Shen, J.; Li, L. Grain setting defect1 (GSD1) function in rice depends on S-acylation and interacts with actin 1 (OsACT1) at its C-terminal. Front. Plant Sci. 2015, 6, 804. [Google Scholar] [CrossRef] [PubMed]
  24. Cheng, G.; Yang, Z.; Zhang, H.; Zhang, J.; Xu, J. Remorin interacting with PCaP1 impairs Turnip mosaic virus intercellular movement but is antagonised by VPg. New Phytol. 2020, 225, 2122–2139. [Google Scholar] [CrossRef]
  25. Ma, T.; Fu, S.; Wang, K.; Wang, Y.; Wu, J.; Zhou, X. Palmitoylation is indispensable for remorin to restrict tobacco mosaic virus cell-to-cell movement in Nicotiana benthamiana. Viruses 2022, 14, 1324. [Google Scholar] [CrossRef]
  26. Huang, D.; Sun, Y.; Ma, Z.; Ke, M.; Cui, Y.; Chen, Z.; Chen, C.; Ji, C.; Tuan Minh, T.; Yang, L.; et al. Salicylic acid-mediated plasmodesmal closure via Remorin-dependent lipid organization. Proc. Natl. Acad. Sci. USA 2020, 117, 8659. [Google Scholar] [CrossRef]
  27. Zhang, Y.; Guo, S.; Zhang, F.; Gan, P.; Li, M.; Wang, C.; Li, H.; Gao, G.; Wang, X.; Kang, Z.; et al. CaREM1.4 interacts with CaRIN4 to regulate Ralstonia solanacearum tolerance by triggering cell death in pepper. Hortic. Res. 2023, 10, uhad053. [Google Scholar] [CrossRef]
  28. Cai, J.; Chen, T.; Wang, Y.; Qin, G.; Tian, S. SlREM1 triggers cell death by activating an oxidative burst and other regulators. Plant Physiol. 2020, 183, 717–732. [Google Scholar] [CrossRef]
  29. Yu, Y. Remorins: Essential regulators in plant-microbe interaction and cell death induction. Plant Physiol. 2020, 183, 435–436. [Google Scholar] [CrossRef]
  30. Su, C.; Rodriguez-Franco, M.; Lace, B.; Nebel, N.; Hernandez-Reyes, C.; Liang, P.; Schulze, E.; Mymrikov, E.V.; Gross, N.M.; Knerr, J.; et al. Stabilization of membrane topologies by proteinaceous remorin scaffolds. Nat. Commun. 2023, 14, 323. [Google Scholar] [CrossRef]
  31. Dimitriou, I.; Mola-Yudego, B. Impact of Populus plantations on water and soil quality. Bioenergy Res. 2017, 10, 750–759. [Google Scholar] [CrossRef]
  32. Wood, J.; Aryal, N.; Subedi, K. Wastewater treatment using poplar plants: Processes. Water 2023, 15, 3812. [Google Scholar] [CrossRef]
  33. Fengmei, D.; Fadian, L.U.; Zhanyong, H.O.U.; Yan, G.A.O.; Kezhi, L.U. Analysis on the economic mature age and economic benefit of fast- growing and high -yield plantation of poplar. J. Shandong Agric. University. Nat. Sci. 2008, 39, 233–238,250. [Google Scholar]
  34. Lu, Y.; Zheng, B.; Zhang, C.; Yu, C.; Luo, J. Wood formation in trees responding to nitrogen availability. Ind. Crops Prod. 2024, 218, 118978. [Google Scholar] [CrossRef]
  35. Luo, J.; Zhou, J.-J. Growth performance, photosynthesis, and root characteristics are associated with nitrogen use efficiency in six poplar species. Environ. Exp. Bot. 2019, 164, 40–51. [Google Scholar] [CrossRef]
  36. Luo, J.; Zhou, J.-J.; Masclaux-Daubresse, C.; Wang, N.; Wang, H.; Zheng, B. Morphological and physiological responses to contrasting nitrogen regimes in Populus cathayana is linked to resources allocation and carbon/nitrogen partition. Environ. Exp. Bot. 2019, 162, 247–255. [Google Scholar] [CrossRef]
  37. Luo, J.; Wang, Y.; Li, Z.; Wang, Z.; Cao, X.; Wang, N. Haplotype-resolved genome assembly of poplar line NL895 provides a valuable tree genomic resource. For. Res. 2024, 4, e015. [Google Scholar] [CrossRef]
  38. Chen, S.; Yu, Y.; Wang, X.; Wang, S.; Zhang, T.; Zhou, Y.; He, R.; Meng, N.; Wang, Y.; Liu, W. Chromosome-level genome assembly of a triploid poplar Populus albaBerolinensis’. Mol. Ecol. Resour. 2023, 23, 1092–1107. [Google Scholar] [CrossRef]
  39. Li, H.; Wang, H.; Guan, L.; Li, Z.; Wang, H.; Luo, J. Optimization of high-efficiency tissue culture regeneration systems in gray poplar. Life 2023, 13, 1896. [Google Scholar] [CrossRef]
  40. Thakur, A.K.; Kumar, P.; Parmar, N.; Shandil, R.K.; Aggarwal, G.; Gaur, A.; Srivastava, D.K. Achievements and prospects of genetic engineering in poplar: A review. New For. 2021, 52, 889–920. [Google Scholar] [CrossRef]
  41. Kang, X.; Wei, H. Breeding polyploid Populus: Progress and perspective. For. Res. 2022, 2, 4. [Google Scholar] [CrossRef]
  42. Li, S.; Su, X.; Zhang, B.; Huang, Q.; Hu, Z.; Lu, M. Molecular cloning and functional analysis of the Populus deltoides remorin gene PdREM. Tree Physiol. 2013, 33, 1111–1121. [Google Scholar] [CrossRef]
  43. Hou, S.; Zhang, H.; Yao, J.; Zhang, Y.; Zhao, N.; Zhao, R.; Zhou, X.; Chen, S. Populus euphratica PeREM6.5 regulating tolerance mechanism to water stress in Arabidopsis thaliana. J. Beijing For. Univ. 2022, 44, 40–51. [Google Scholar]
  44. Luo, J.; Liang, Z.; Wu, M.; Mei, L. Genome-wide identification of BOR genes in poplar and their roles in response to various environmental stimuli. Environ. Exp. Bot. 2019, 164, 101–113. [Google Scholar] [CrossRef]
  45. Mu, X.; Luo, J. Evolutionary analyses of NIN-like proteins in plants and their roles in nitrate signaling. Cell. Mol. Life Sci. 2019, 76, 3753–3764. [Google Scholar] [CrossRef]
  46. Mistry, J.; Chuguransky, S.; Williams, L.; Qureshi, M.; Salazar, G.A.; Sonnhammer, E.L.L.; Tosatto, S.C.E.; Paladin, L.; Raj, S.; Richardson, L.J.; et al. Pfam: The protein families database in 2021. Nucleic Acids Res. 2021, 49, D412–D419. [Google Scholar] [CrossRef]
  47. Wang, J.; Chitsaz, F.; Derbyshire, M.K.; Gonzales, N.R.; Gwadz, M.; Lu, S.; Marchler, G.H.; Song, J.S.; Thanki, N.; Yamashita, R.A.; et al. The conserved domain database in 2023. Nucleic Acids Res. 2023, 51, D384–D388. [Google Scholar] [CrossRef]
  48. Potter, S.C.; Luciani, A.; Eddy, S.R.; Park, Y.; Lopez, R.; Finn, R.D. HMMER web server: 2018 update. Nucleic Acids Res. 2018, 46, W200–W204. [Google Scholar] [CrossRef]
  49. Goodstein, D.M.; Shu, S.; Howson, R.; Neupane, R.; Hayes, R.D.; Fazo, J.; Mitros, T.; Dirks, W.; Hellsten, U.; Putnam, N.; et al. Phytozome: A comparative platform for green plant genomics. Nucleic Acids Res. 2012, 40, D1178–D1186. [Google Scholar] [CrossRef]
  50. Chou, K.-C.; Shen, H.-B. Plant-mPLoc: A top-down strategy to augment the power for predicting plant protein subcellular localization. PLoS ONE 2010, 5, 11335. [Google Scholar] [CrossRef]
  51. Chen, C.; Wu, Y.; Li, J.; Wang, X.; Zeng, Z.; Xu, J.; Liu, Y.; Feng, J.; Chen, H.; He, Y.; et al. TBtools-II: A “one for all, all for one” bioinformatics platform for biological big-data mining. Mol. Plant 2023, 16, 1733–1742. [Google Scholar] [CrossRef] [PubMed]
  52. Chen, C.; Chen, H.; Zhang, Y.; Thomas, H.R.; Frank, M.H.; He, Y.; Xia, R. TBtools: An integrative toolkit developed for interactive analyses of big biological data. Mol. Plant 2020, 13, 1194–12029. [Google Scholar] [CrossRef] [PubMed]
  53. Kumar, S.; Stecher, G.; Li, M.; Knyaz, C.; Tamura, K. MEGA X: Molecular evolutionary genetics analysis across computing platforms. Mol. Biol. Evol. 2018, 35, 1547–1549. [Google Scholar] [CrossRef] [PubMed]
  54. Letunic, I.; Bork, P. Interactive Tree of Life (iTOL) v6: Recent updates to the phylogenetic tree display and annotation tool. Nucleic Acids Res. 2024, 52, W78–W82. [Google Scholar] [CrossRef] [PubMed]
  55. Lescot, M.; Déhais, P.; Thijs, G.; Marchal, K.; Moreau, Y.; Van de Peer, Y.; Rouzé, P.; Rombauts, S. PlantCARE, a database of plant cis-acting regulatory elements and a portal to tools for in silico analysis of promoter sequences. Nucleic Acids Res. 2002, 30, 325–327. [Google Scholar] [CrossRef]
  56. Wang, Y.; Tang, H.; DeBarry, J.D.; Tan, X.; Li, J.; Wang, X.; Lee, T.-h.; Jin, H.; Marler, B.; Guo, H. MCScanX: A toolkit for detection and evolutionary analysis of gene synteny and collinearity. Nucleic Acids Res. 2012, 40, e49. [Google Scholar] [CrossRef]
  57. Filichkin, S.A.; Hamilton, M.; Dharmawardhana, P.D.; Singh, S.K.; Sullivan, C.; Ben-Hur, A.; Reddy, A.S.; Jaiswal, P. Abiotic stresses modulate landscape of poplar transcriptome via alternative splicing, differential intron retention, and isoform ratio switching. Front. Plant Sci. 2018, 9, 5. [Google Scholar] [CrossRef]
  58. Li, Z.; Guan, L.; Zhang, C.; Zhang, S.; Liu, Y.; Lu, Y.; Luo, J. Nitrogen assimilation genes in poplar: Potential targets for improving tree nitrogen use efficiency. Ind. Crops Prod. 2024, 216, 118705. [Google Scholar] [CrossRef]
  59. Kolde, R.; Kolde, M.R. Package ‘pheatmap’. R package 2015, 1, 790. [Google Scholar]
  60. Shannon, P.; Markiel, A.; Ozier, O.; Baliga, N.S.; Wang, J.T.; Ramage, D.; Amin, N.; Schwikowski, B.; Ideker, T. Cytoscape: A software environment for integrated models of biomolecular interaction networks. Genome Res. 2003, 13, 2498–2504. [Google Scholar] [CrossRef]
  61. Wu, T.; Hu, E.; Xu, S.; Chen, M.; Guo, P.; Dai, Z.; Feng, T.; Zhou, L.; Tang, W.; Zhan, L. clusterProfiler 4.0: A universal enrichment tool for interpreting omics data. Innovation 2021, 2, 100141. [Google Scholar] [CrossRef] [PubMed]
  62. Luo, J.; Xia, W.; Cao, P.; Xiao, Z.a.; Zhang, Y.; Liu, M.; Zhan, C.; Wang, N. Integrated transcriptome analysis reveals plant hormones jasmonic acid and salicylic acid coordinate growth and defense responses upon fungal infection in poplar. Biomolecules 2019, 9, 12. [Google Scholar] [CrossRef]
  63. Luo, J.; Nvsvrot, T.; Wang, N. Comparative transcriptomic analysis uncovers conserved pathways involved in adventitious root formation in poplar. Physiol. Mol. Biol. Plants 2021, 27, 1903–1918. [Google Scholar] [CrossRef] [PubMed]
  64. Cannon, S.B.; Mitra, A.; Baumgarten, A.; Young, N.D.; May, G. The roles of segmental and tandem gene duplication in the evolution of large gene families in Arabidopsis thaliana. BMC Plant Biol. 2004, 4, 10. [Google Scholar] [CrossRef]
  65. Sun, N.; Zhou, J.; Liu, Y.; Li, D.; Xu, X.; Zhu, Z.; Xu, X.; Zhan, R.; Zhang, H.; Wang, L. Genome-wide characterization of Remorin gene family and their responsive expression to abiotic stresses and plant hormone in Brassica napus. Plant Cell Rep. 2024, 43, 155. [Google Scholar] [CrossRef]
  66. Yang, Z.; Cheng, G.; Yu, Q.; Jiao, W.; Zeng, K.; Luo, T.; Zhang, H.; Shang, H.; Huang, G.; Wang, F.; et al. Identification and characterization of the Remorin gene family in Saccharum and the involvement of ScREM1.5e-1/-2 in SCMV infection on sugarcane. Front. Plant Sci. 2024, 15, 1365995. [Google Scholar] [CrossRef]
  67. Marin, M.; Thallmair, V.; Ott, T. The intrinsically disordered N-terminal region of AtREM1.3 remorin protein mediates protein-protein interactions. J. Biol. Chem. 2012, 287, 39982–39991. [Google Scholar] [CrossRef]
  68. Li, B.; Zhang, C.; Cao, B.; Qin, G.; Wang, W.; Tian, S. Brassinolide enhances cold stress tolerance of fruit by regulating plasma membrane proteins and lipids. Amino Acids 2012, 43, 2469–2480. [Google Scholar] [CrossRef]
  69. Luo, J.; Shi, W.; Li, H.; Janz, D.; Luo, Z.-B. The conserved salt-responsive genes in the roots of Populus × canescens and Arabidopsis thaliana. Environ. Exp. Bot. 2016, 129, 48–56. [Google Scholar] [CrossRef]
  70. Yue, J.; Li, C.; Liu, Y.; Yu, J. A remorin gene SiREM6, the target gene of SiARDP, from foxtail millet (Setaria italica) promotes high salt tolerance in transgenic Arabidopsis. PLoS ONE 2014, 9, e100772. [Google Scholar] [CrossRef]
  71. Zhang, H.; Deng, C.; Wu, X.; Yao, J.; Zhang, Y.; Zhang, Y.; Deng, S.; Zhao, N.; Zhao, R.; Zhou, X.; et al. Populus euphratica remorin 6.5 activates plasma membrane H+-ATPases to mediate salt tolerance. Tree Physiol. 2020, 40, 731–745. [Google Scholar] [CrossRef]
Figure 1. The gene (A) and protein (B) structures of PtREMs in P. trichocarpa. (A) Exon–intron structure of PtREMs in P. trichocarpa. Purple represents the UTR; green denotes CDS; and the black line represents introns; (B) analysis of the conserved domains of PtREM proteins. Yellow indicates the Remorin_N domain and blue indicates the Remorin_C domain.
Life 14 01239 g001
Figure 2. Phylogenetic analysis of REMs in Arabidopsis and P. trichocarpa. Different colored lines represent different groups.
Life 14 01239 g002
Figure 3. Analysis of collinearity relationships of REM in P. trichocarpa (A) and among different plant species (B). (A) Collinearity analysis of PtREMs in P. trichocarpa. Repeated PtREM gene pairs were ligated with bluish-green lines. (B) Synteny analysis of REM genes in P. trichocarpa, A. thaliana, and O. sativa. The gray lines in the background represent the collinearity in the genomes of P. trichocarpa and other plant species, and the blue lines highlight the collinearity of the REM genes.
Life 14 01239 g003
Figure 4. The expression of PtREMs in different tissues and different treatments. Orange bars indicate upregulation and blue bars indicate downregulation.
Life 14 01239 g004
Figure 5. The cis-acting element analysis of PtREMs in P. trichocarpa (A) and the expression of PtREMs under different stresses (B). The number of different promoter elements in the PtREMs is represented by different intensity colors and numbers. The different colors in the histogram represent the percentage of cis-acting elements in the four functional categories. In the heatmap, orange and blue colors indicate upregulation and downregulation, respectively. The stars in cells indicate significance.
Life 14 01239 g005
Figure 6. Co-expression network of PtREMs in P. trichocarpa (A), as well as the GO and KEGG enrichment analyses of genes in the co-expression network (B). In the co-expression network, the red and green nodes represent PtREMs and their co-expressed genes, respectively. The edges of the network indicate the co-expression relationships between PtREMs and their co-expressed genes.
Life 14 01239 g006
Table 1. Physicochemical properties and subcellular localizations of the PtREM gene family.
Gene NameGene ModelProtein (aa)MW (kDa)Isoelectric PointSubcellular LocalizationChromosome Position
PtREM1.1Potri.012G14080020422.716.00Cell membraneChr12:15283828-15285704
PtREM1.2Potri.002G15770019621.319.13Cell membraneChr02:12028474-12032739
PtREM1.3Potri.014G08130019321.496.70Cell membraneChr14:5248038-5251534
PtREM1.4Potri.015G14360020122.235.09Cell membraneChr15:14900244-14902489
PtREM2.1Potri.001G10700020322.718.94Cell membraneChr01:8599505-8601605
PtREM2.2Potri.003G12440018921.057.69Cell membraneChr03:14441701-14443964
PtREM3.1Potri.012G14090012414.479.15Cell membrane, NucleusChr12:15289364-15290406
PtREM4.1Potri.006G05320027830.558.78Cell membrane, NucleusChr06:3708285-3710532
PtREM4.2Potri.016G05440027830.866.74Cell membrane, NucleusChr16:3577080-3579086
PtREM5.1Potri.002G12520060666.839.64Cell membrane, NucleusChr02:9533038-9537486
PtREM5.2Potri.014G02790058464.139.94Cell membrane, NucleusChr14:1748284-1753282
PtREM6.1Potri.008G14430052257.739.20NucleusChr08:9793769-9800768
PtREM6.2Potri.001G35860053860.568.24NucleusChr01:37441084-37444823
PtREM6.3Potri.001G16300048253.838.20Cell membrane, NucleusChr01:13838091-13841996
PtREM6.4Potri.005G13850039142.869.66Cell membrane, NucleusChr05:10893174-10895929
PtREM6.5Potri.010G09800052458.079.20NucleusChr10:12130727-12136648
PtREM6.6Potri.008G09330035139.079.83Cell membrane, NucleusChr08:5824430-5827202
PtREM6.7Potri.008G17830036640.619.03Cell membrane, NucleusChr08:12321723-12324565
PtREM6.8Potri.010G05680037041.019.04Cell membrane, NucleusChr10:8762054-8765457
PtREM6.9Potri.015G04970022526.2610.10Cell membrane, NucleusChr15:5217249-5218970
PtREM6.10Potri.010G16090032436.4210.00Cell membrane, NucleusChr10:16663990-16669562
PtREM6.11Potri.014G05890034338.579.51Cell membrane, NucleusChr14:3792409-3794792
Disclaimer/Publisher’s Note: The statements, opinions and data contained in all publications are solely those of the individual author(s) and contributor(s) and not of MDPI and/or the editor(s). MDPI and/or the editor(s) disclaim responsibility for any injury to people or property resulting from any ideas, methods, instructions or products referred to in the content.

