

Determining the Identity Nucleotides and the Energy of Binding of tRNAs to Their Aminoacyl-tRNA Synthetases Using a Simple Logistic Model


Abstract
1. Introduction
1.1. Background
1.2. Historical Perspective
1.3. The Goal and the Idea
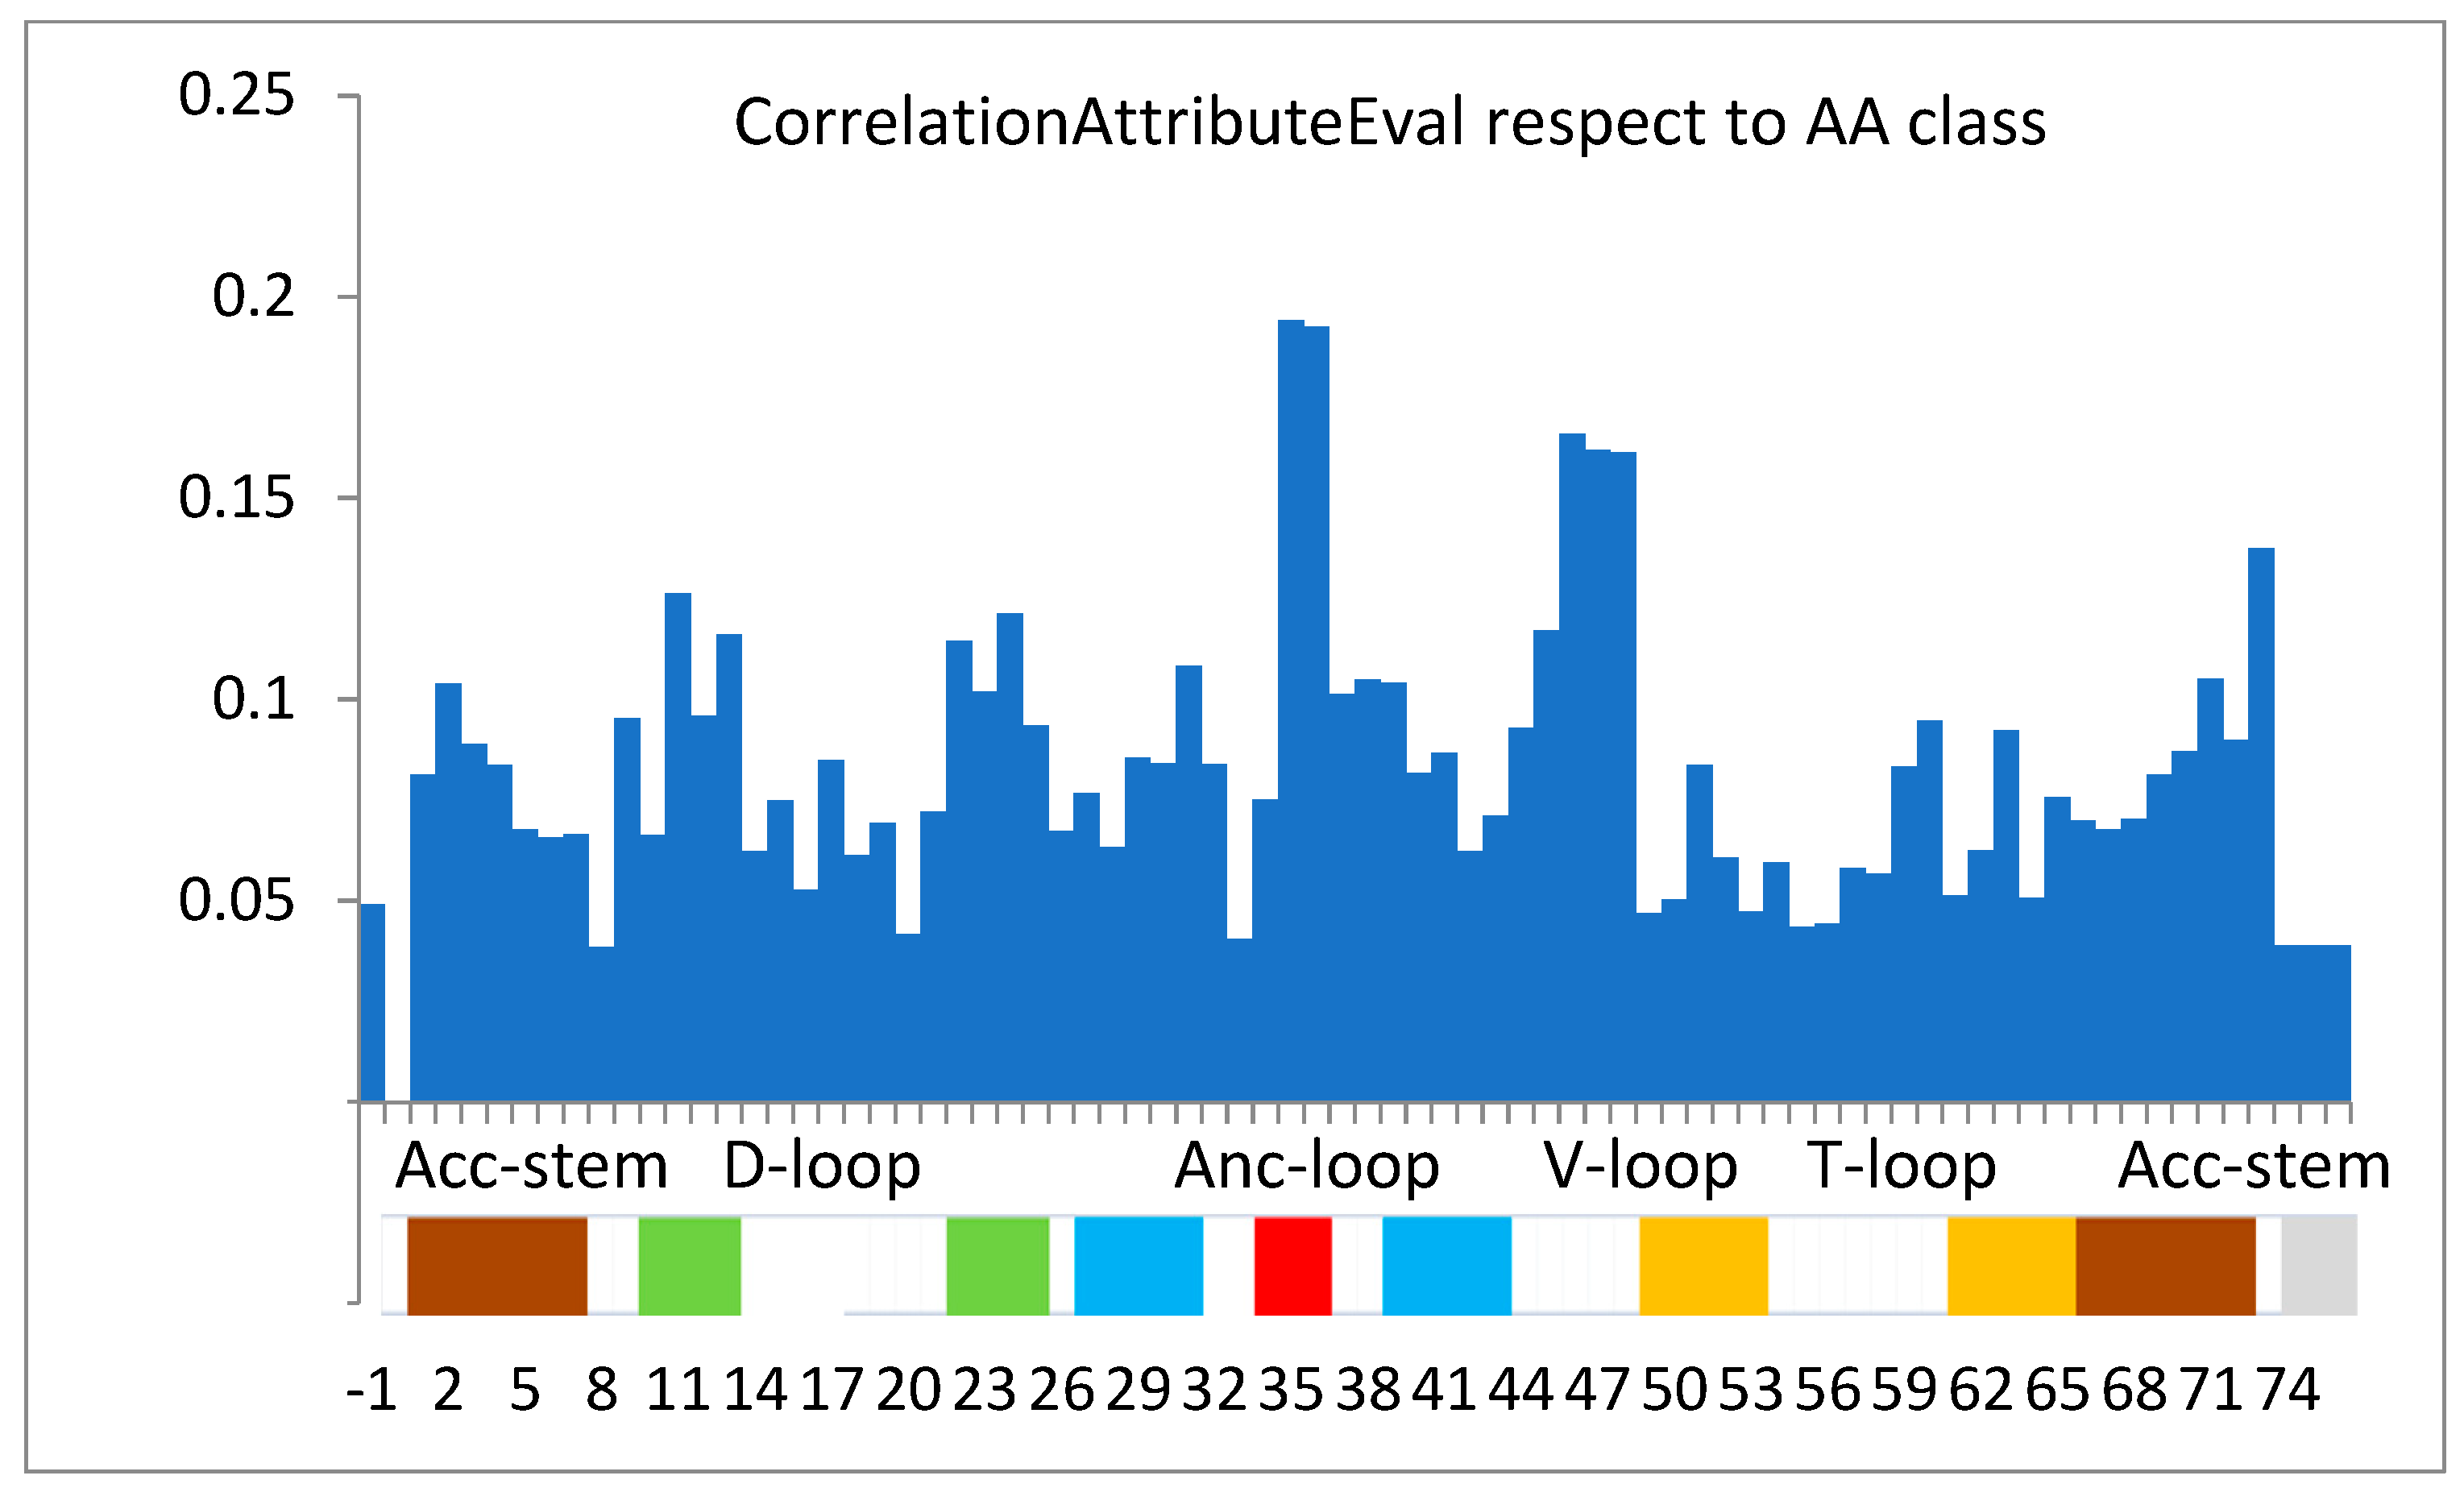
1.4. The Importance of Positions—Initial Findings
1.5. General Observations
1.6. Main Findings
2. Materials and Methods
2.1. Data Collection
2.2. Preliminary Experiments Methods
2.3. Final Experiments Methods
2.4. Statistical Analysis
2.5. The Theoretical Model of Machine Learning Simulation of tRNA Binding to Aminoacyl-tRNA Synthetase
3. Results
3.1. Preliminary Experiments
3.2. Final Classification Task
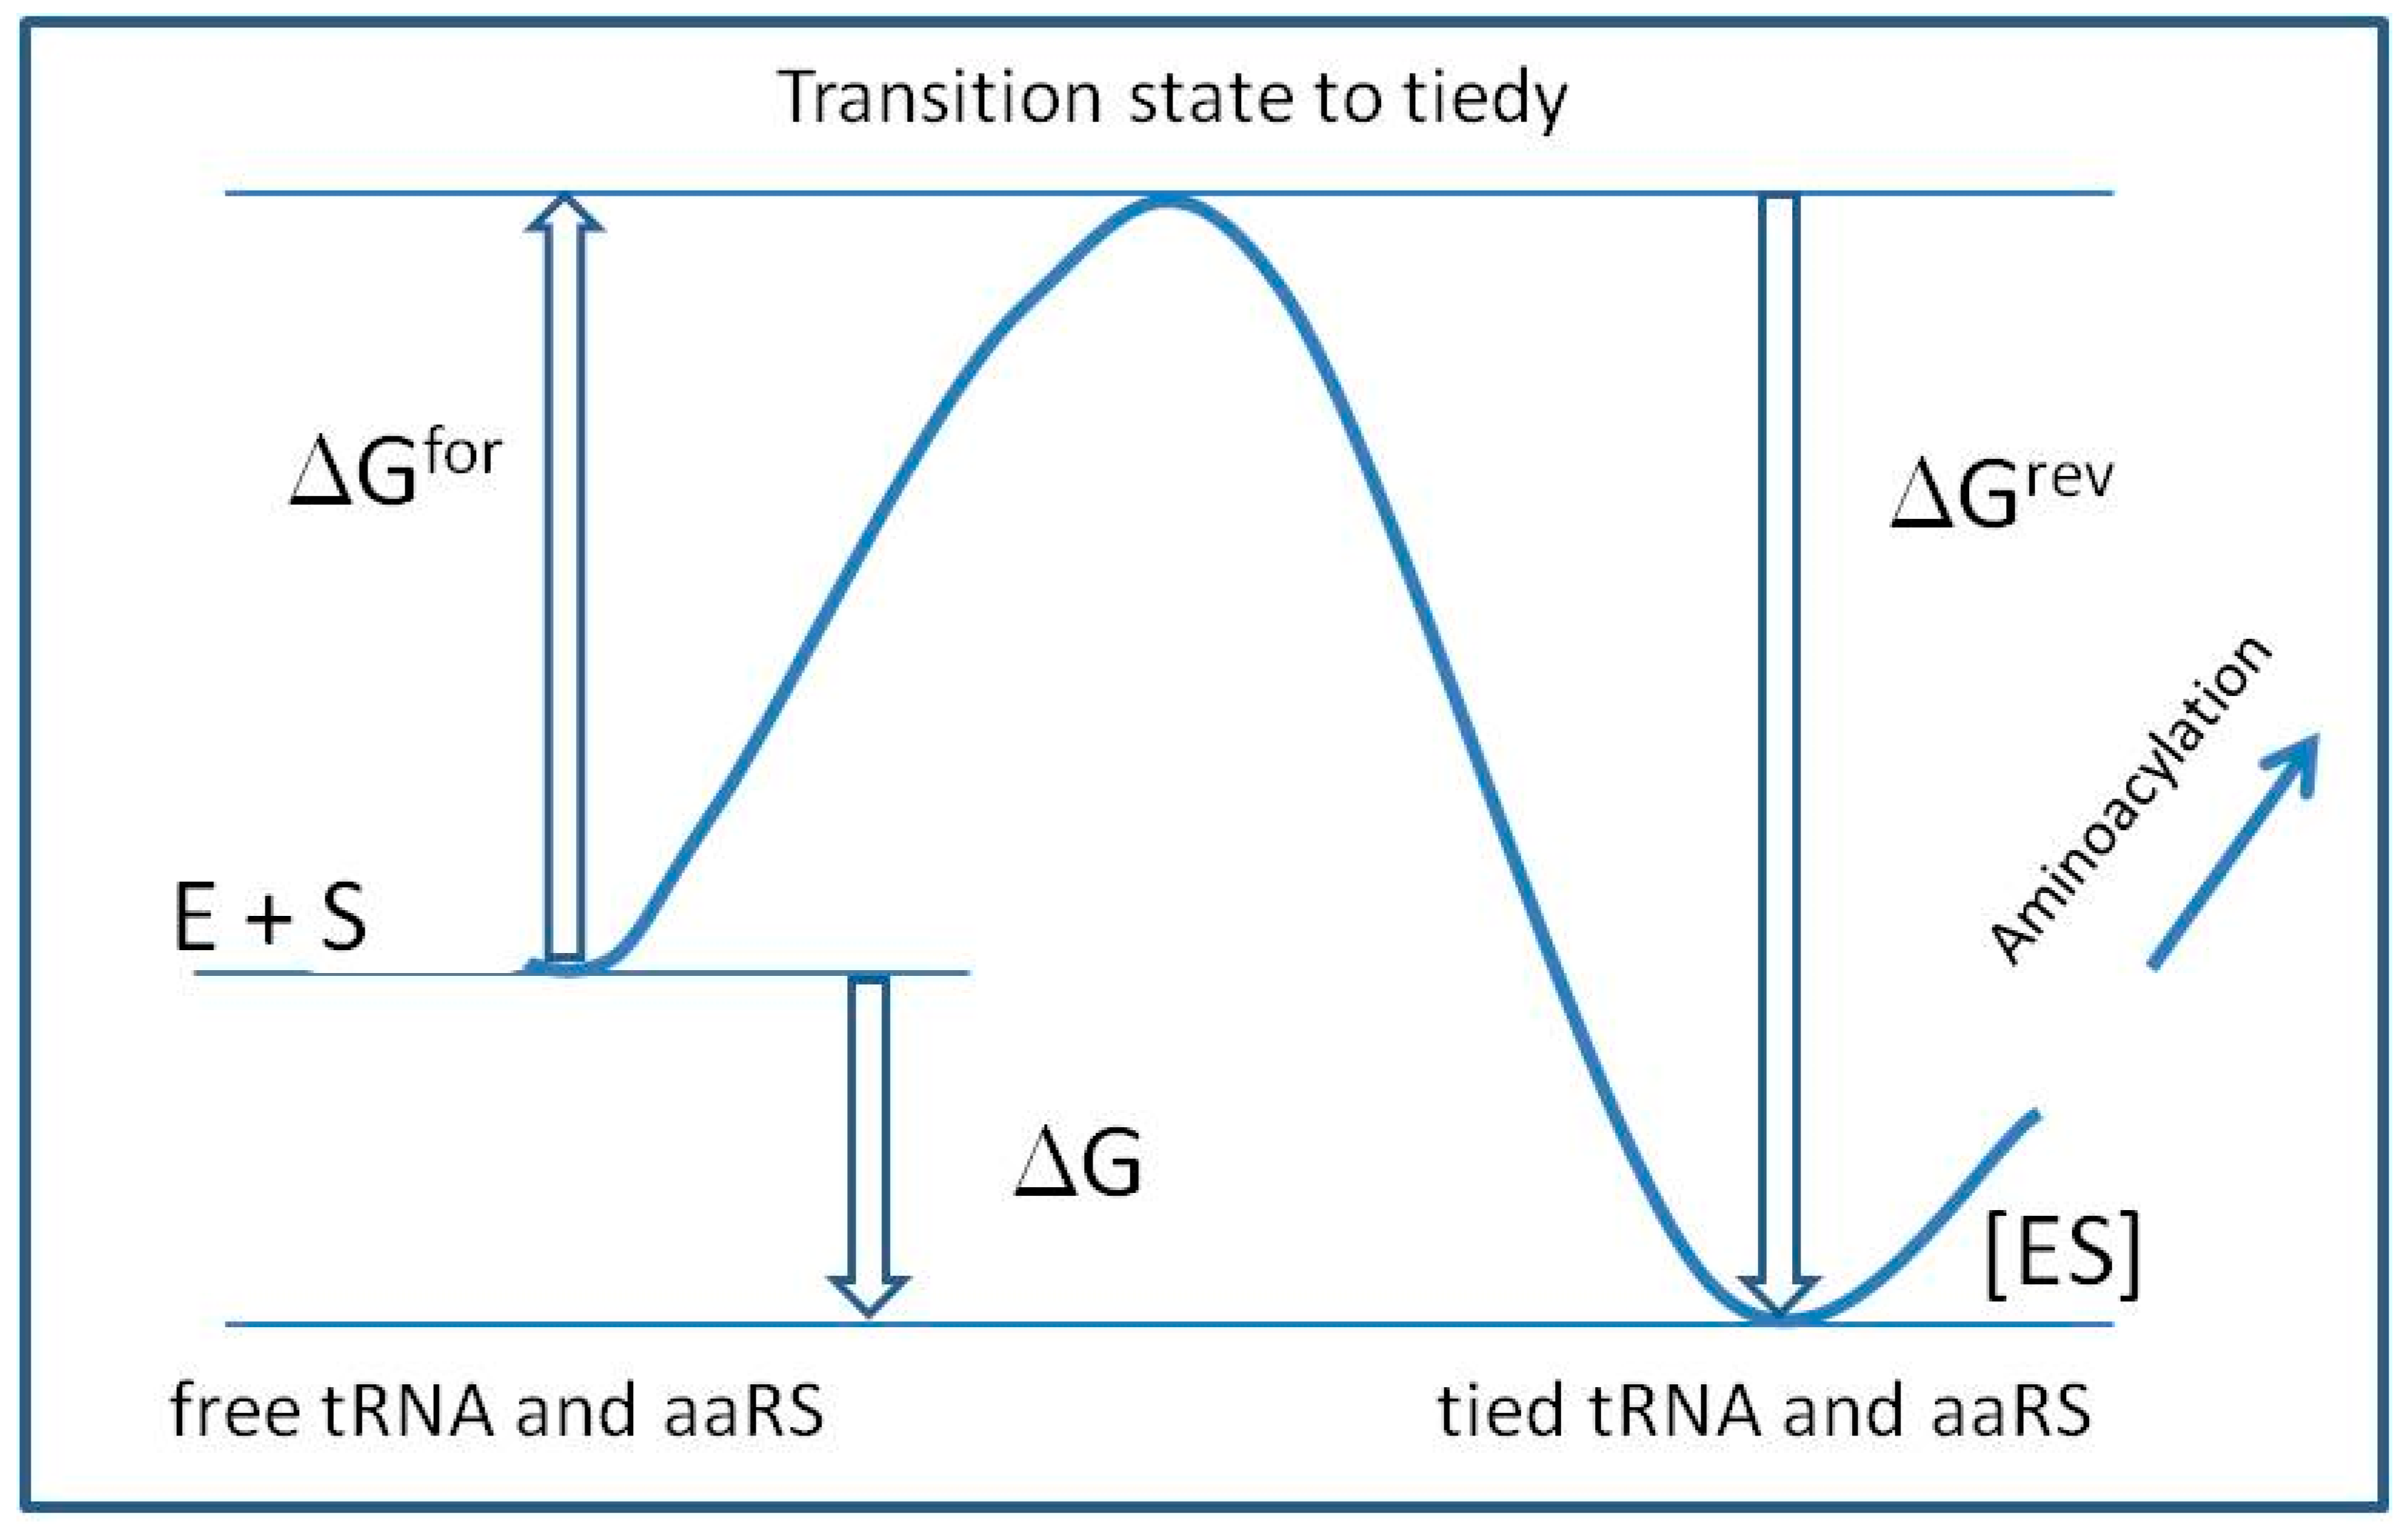
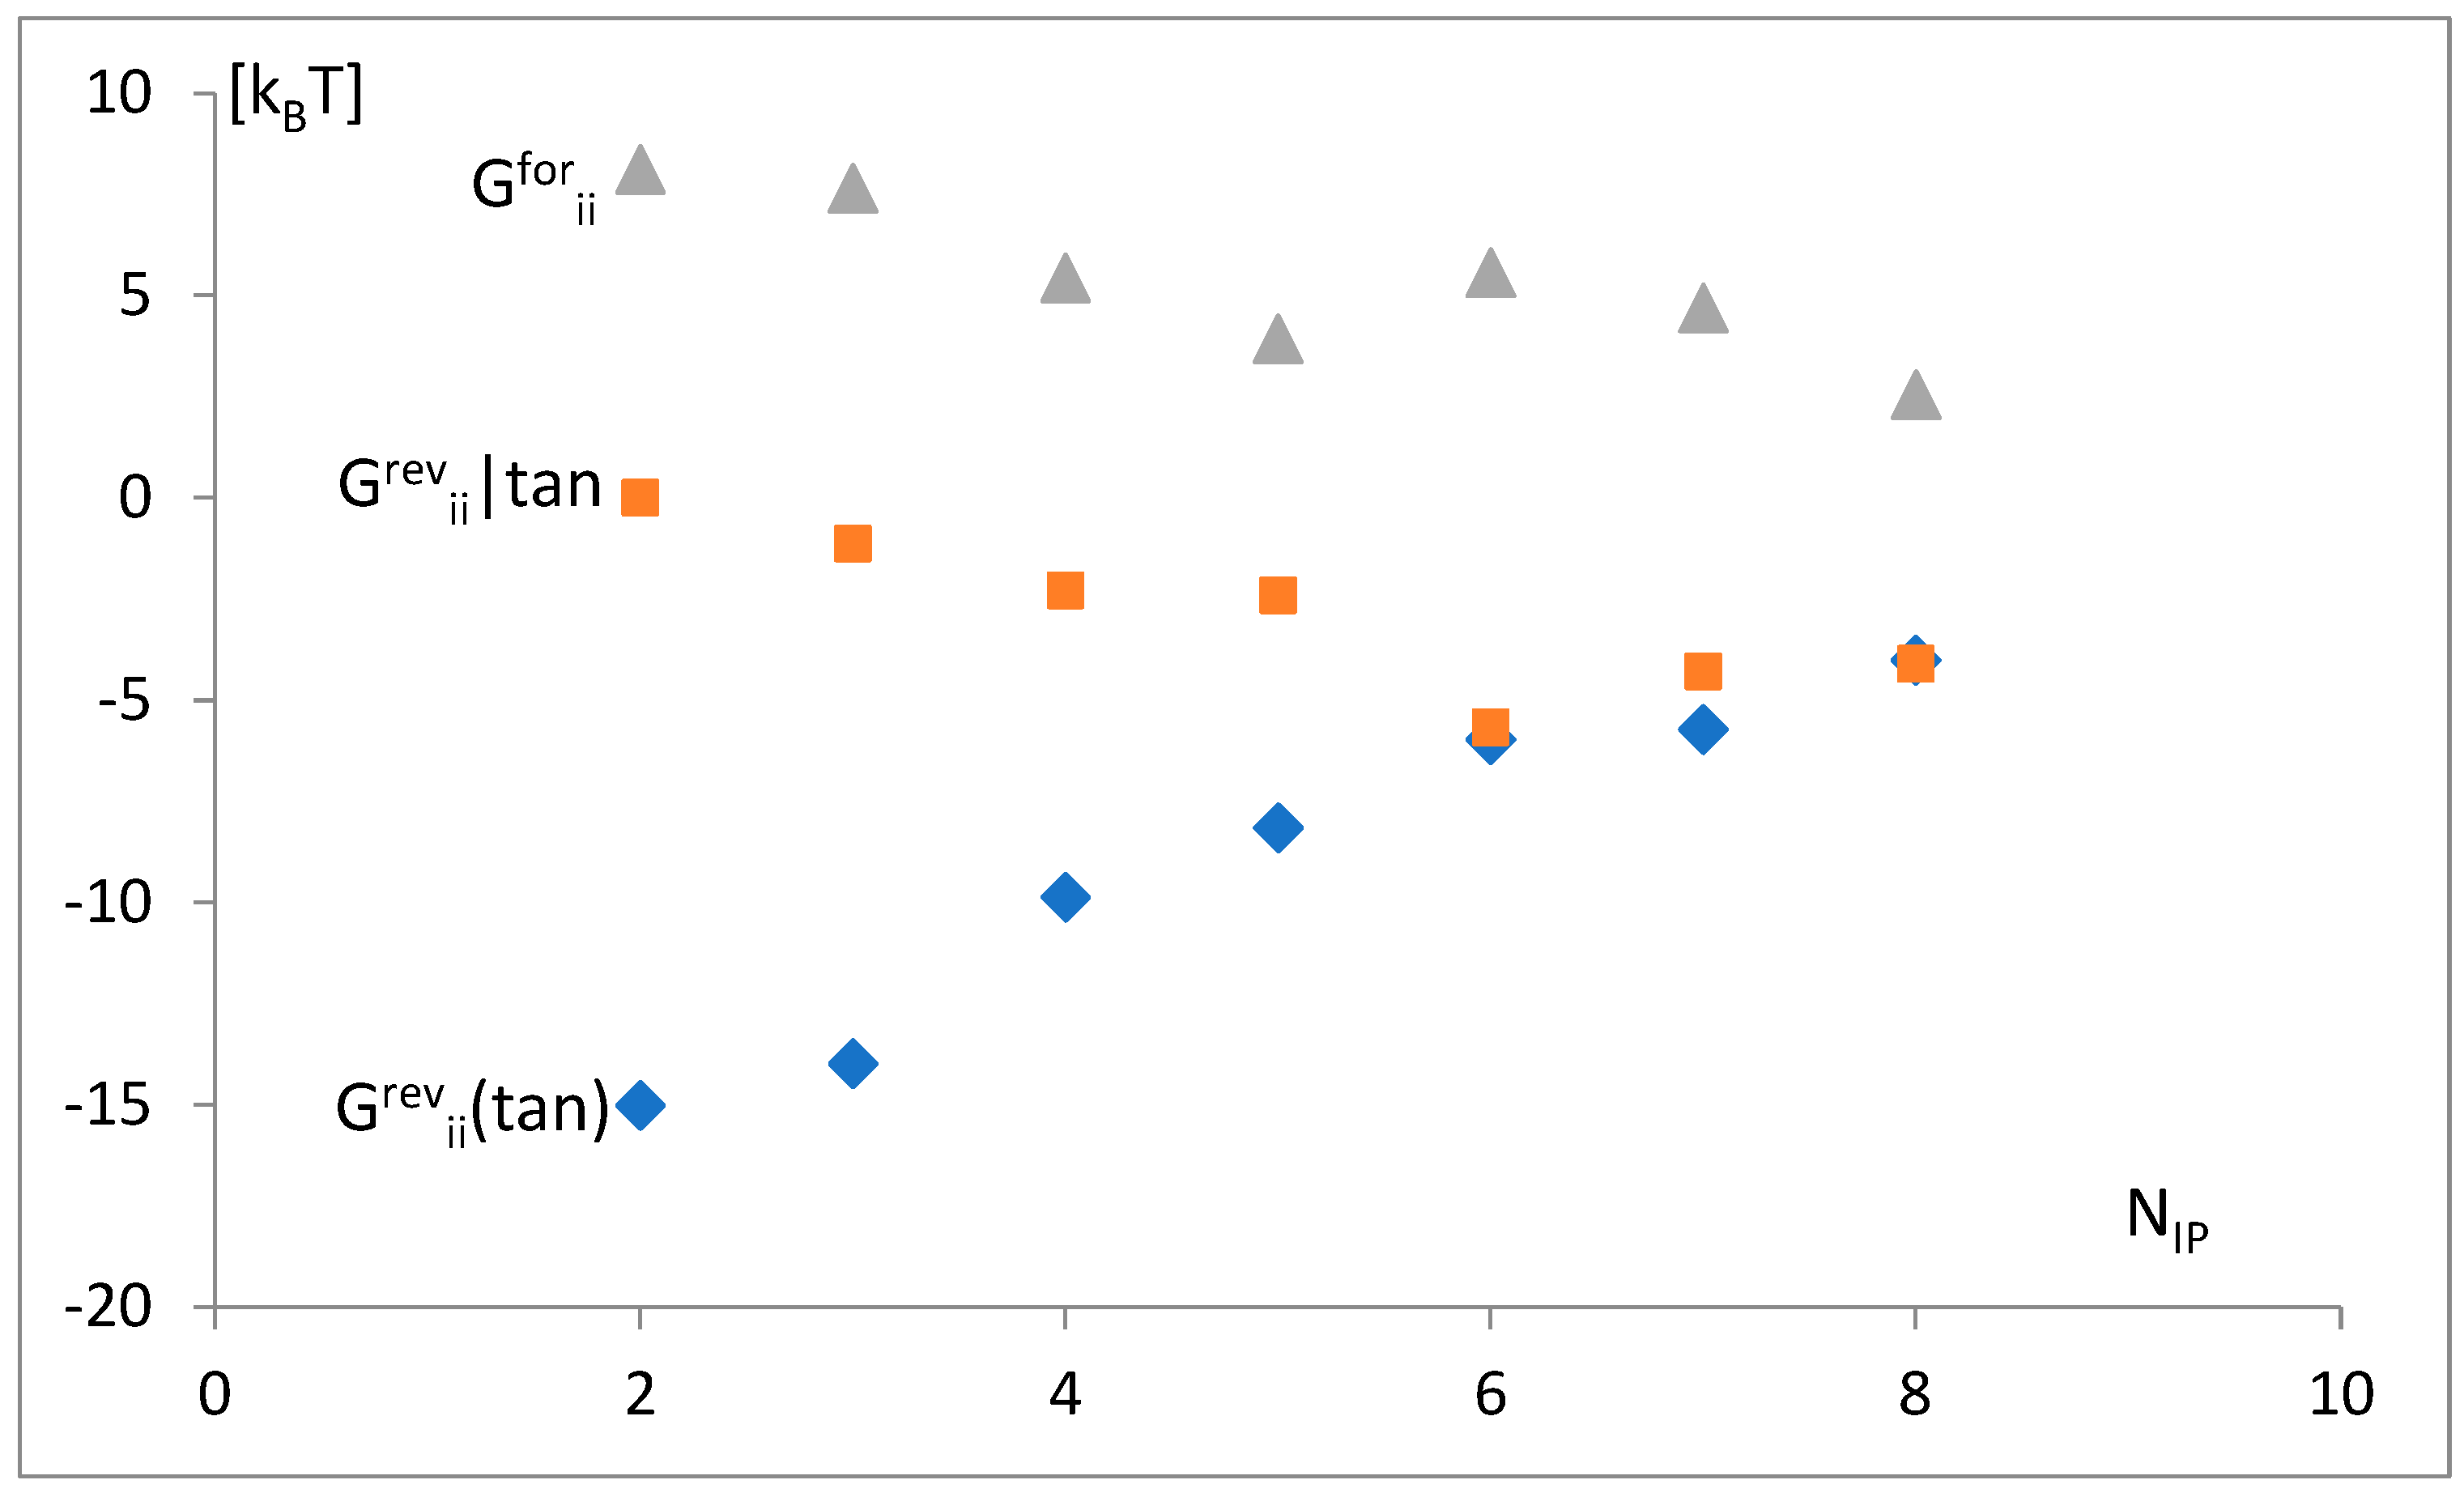
3.3. The Free Energy Considerations
3.4. The Analysis of the Attraction of Anticodon Tandem
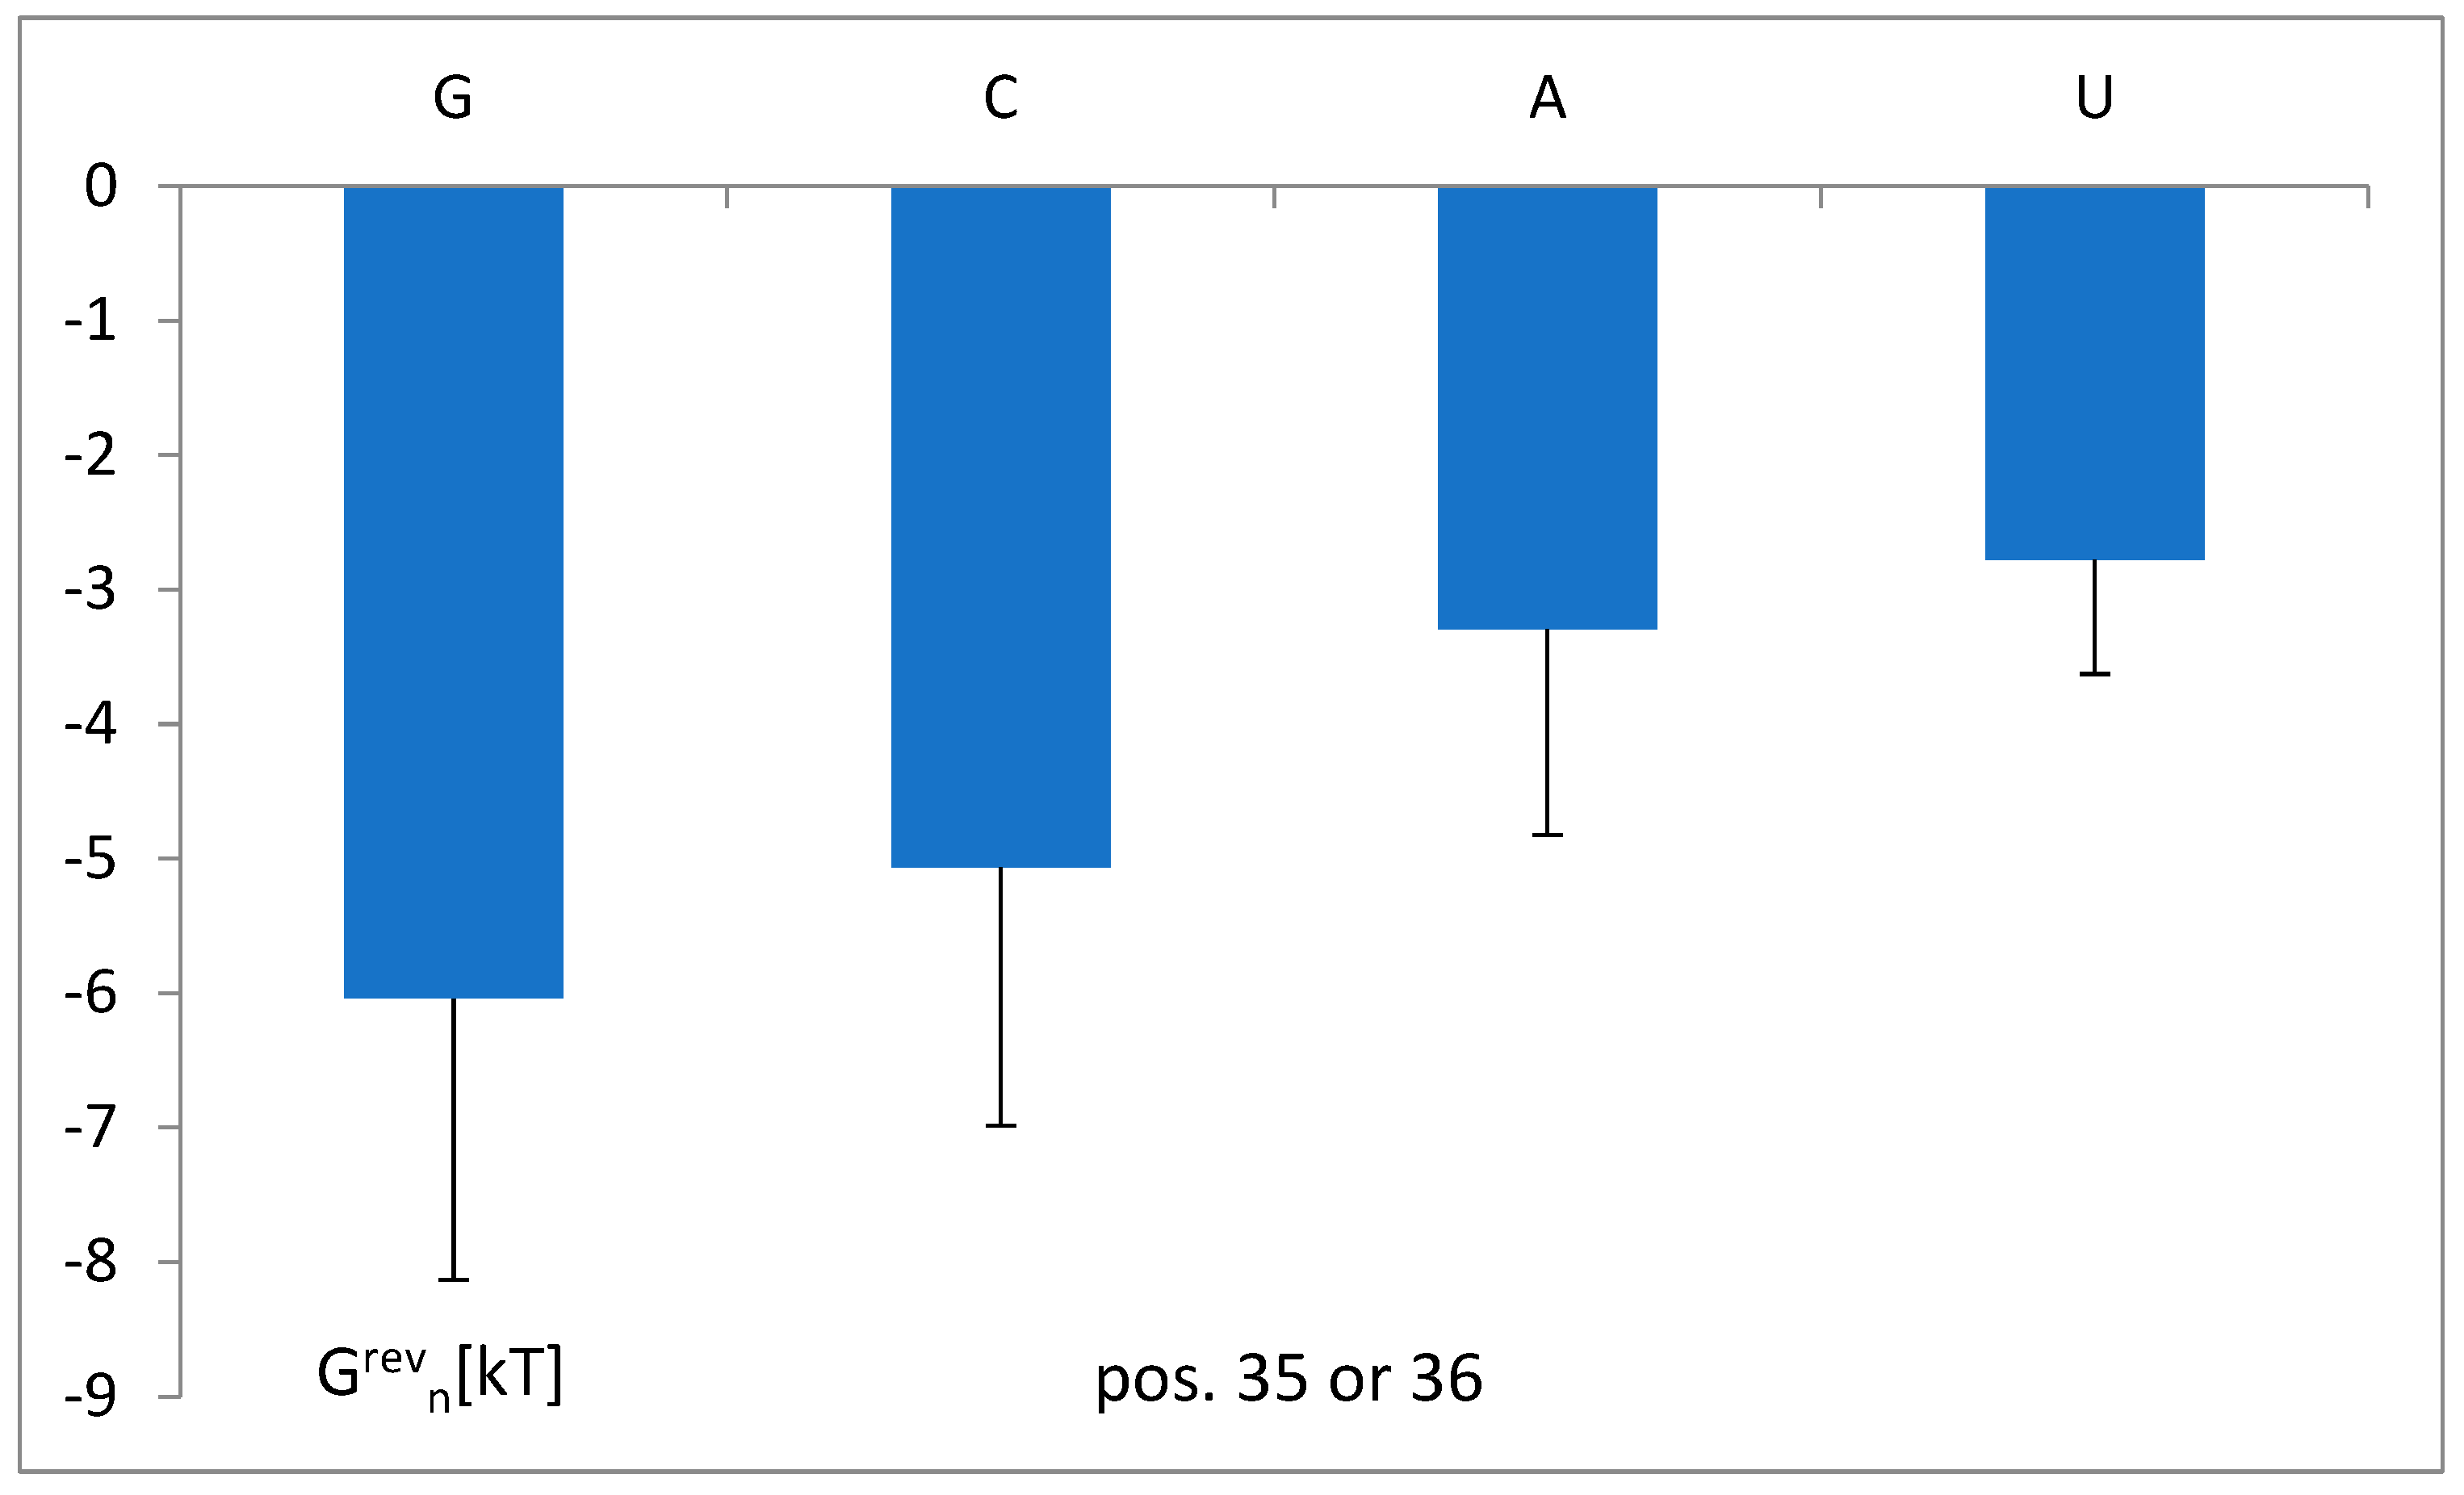
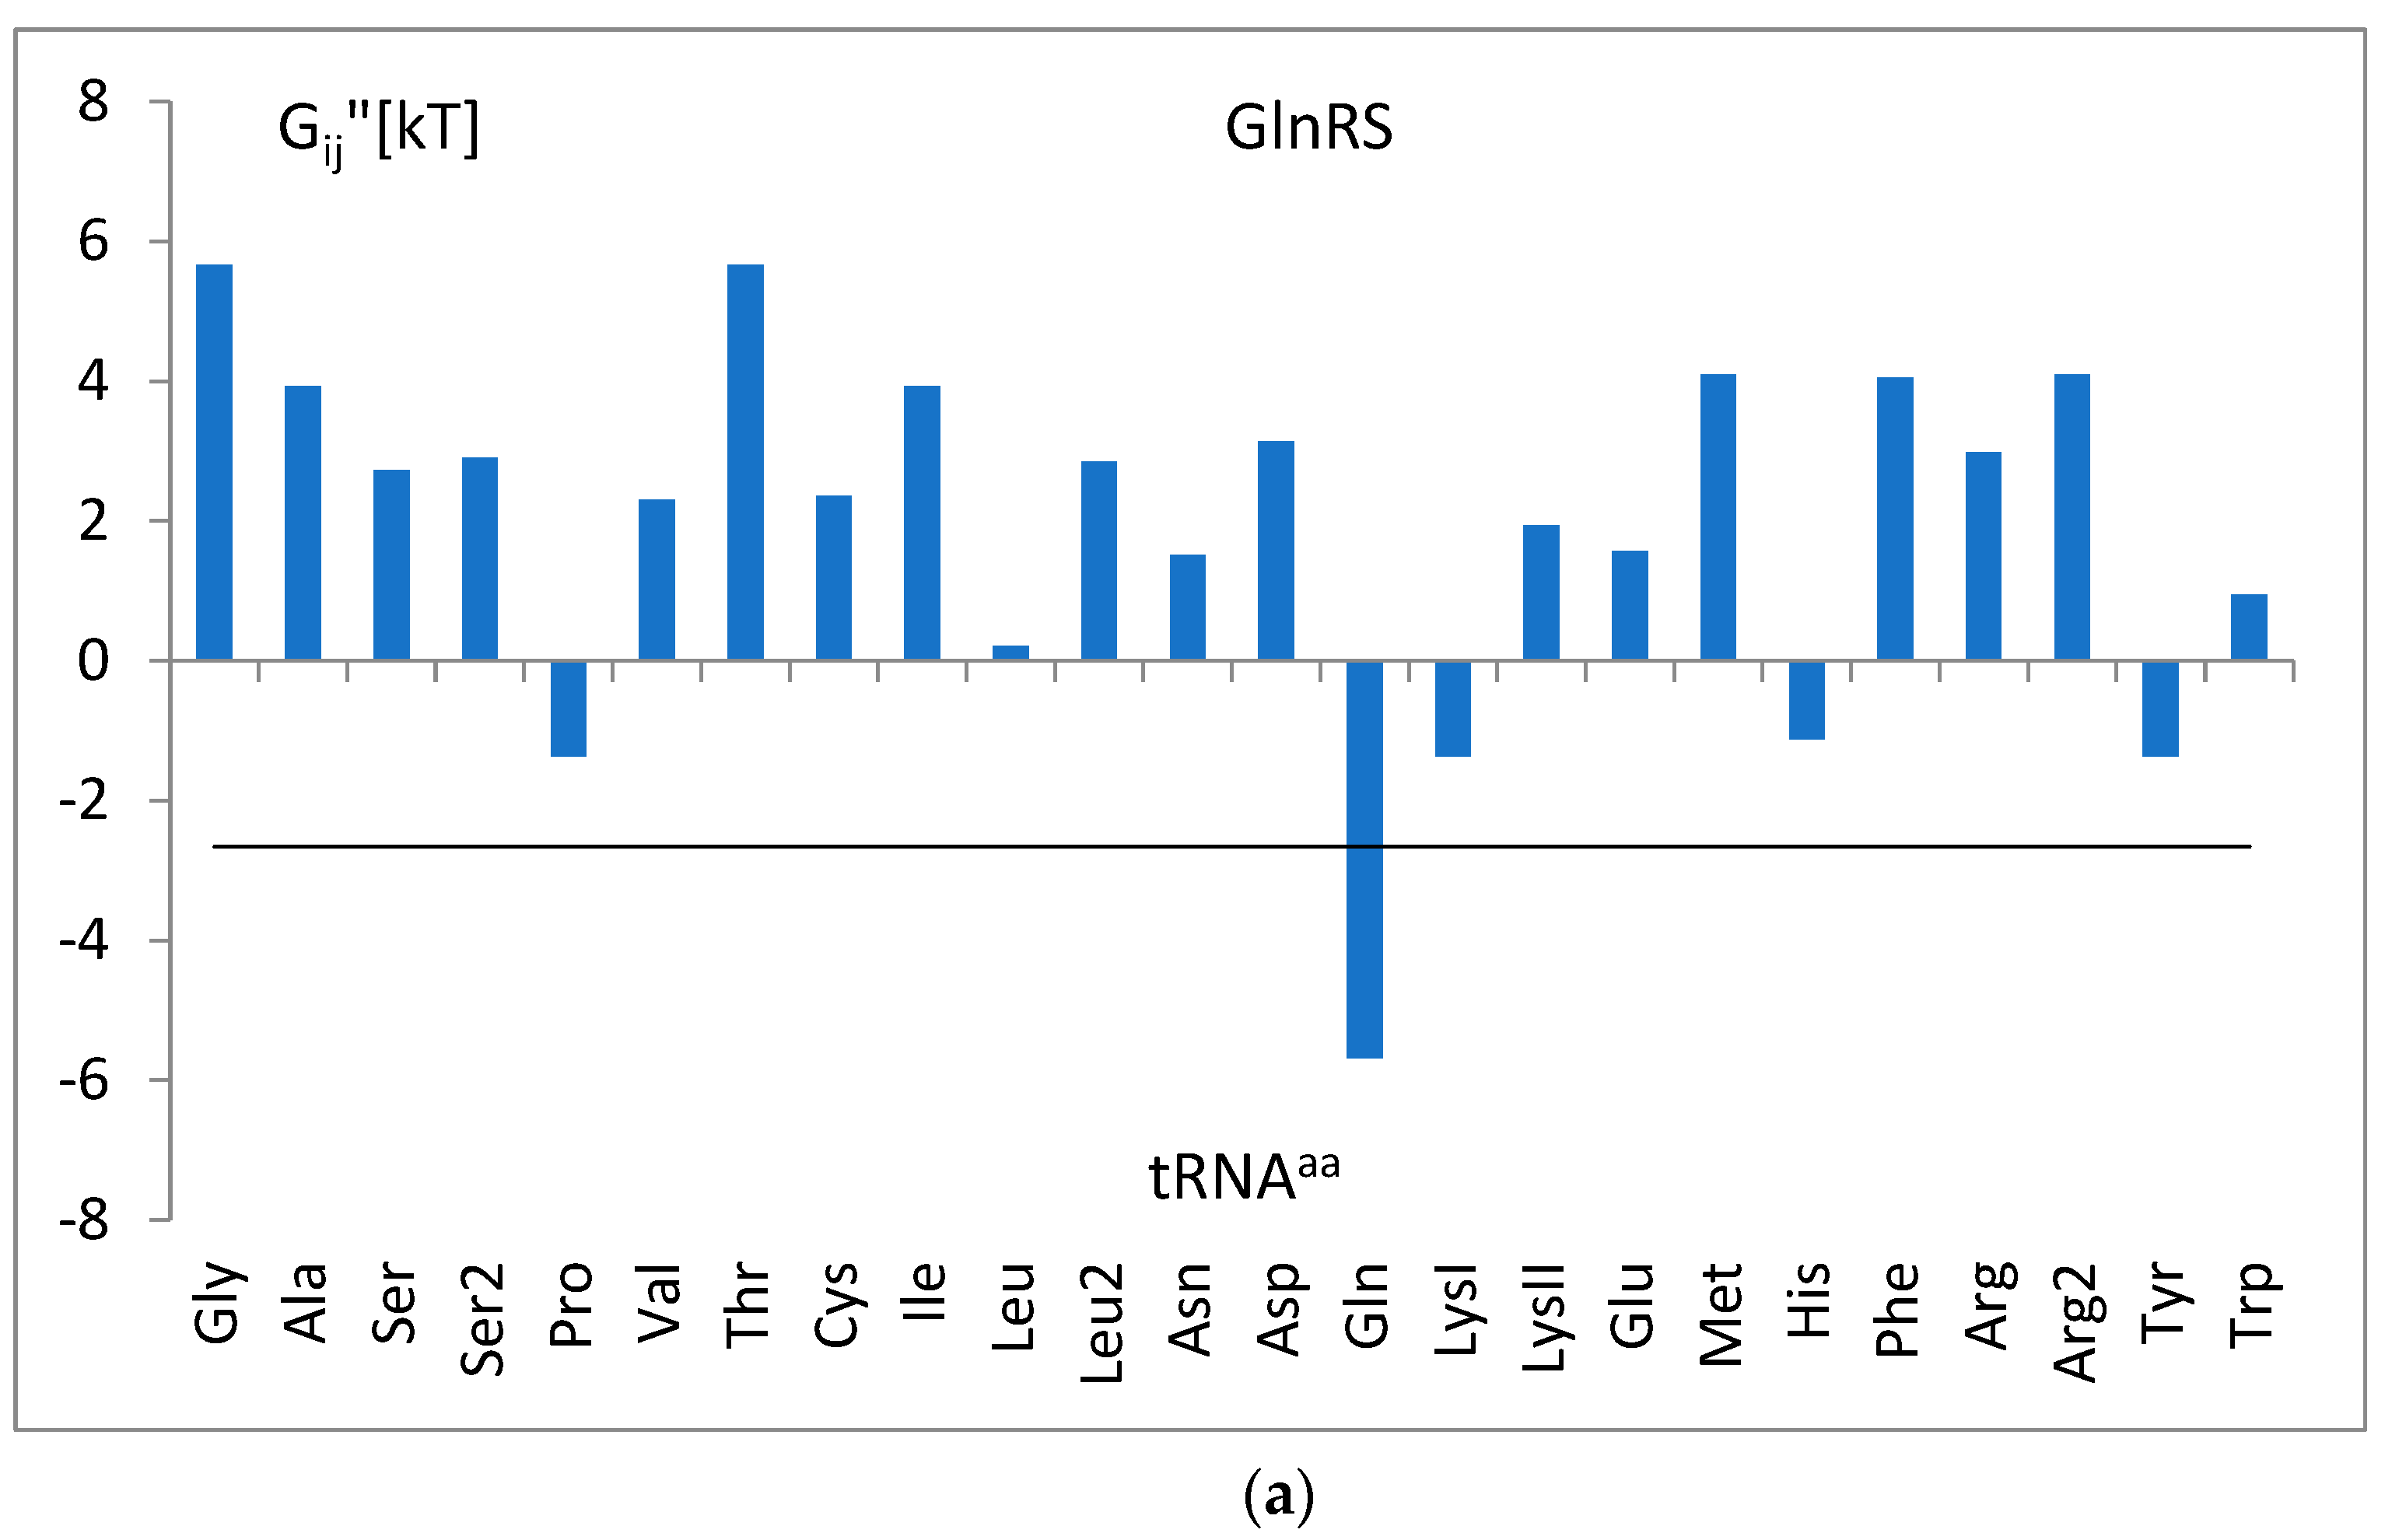
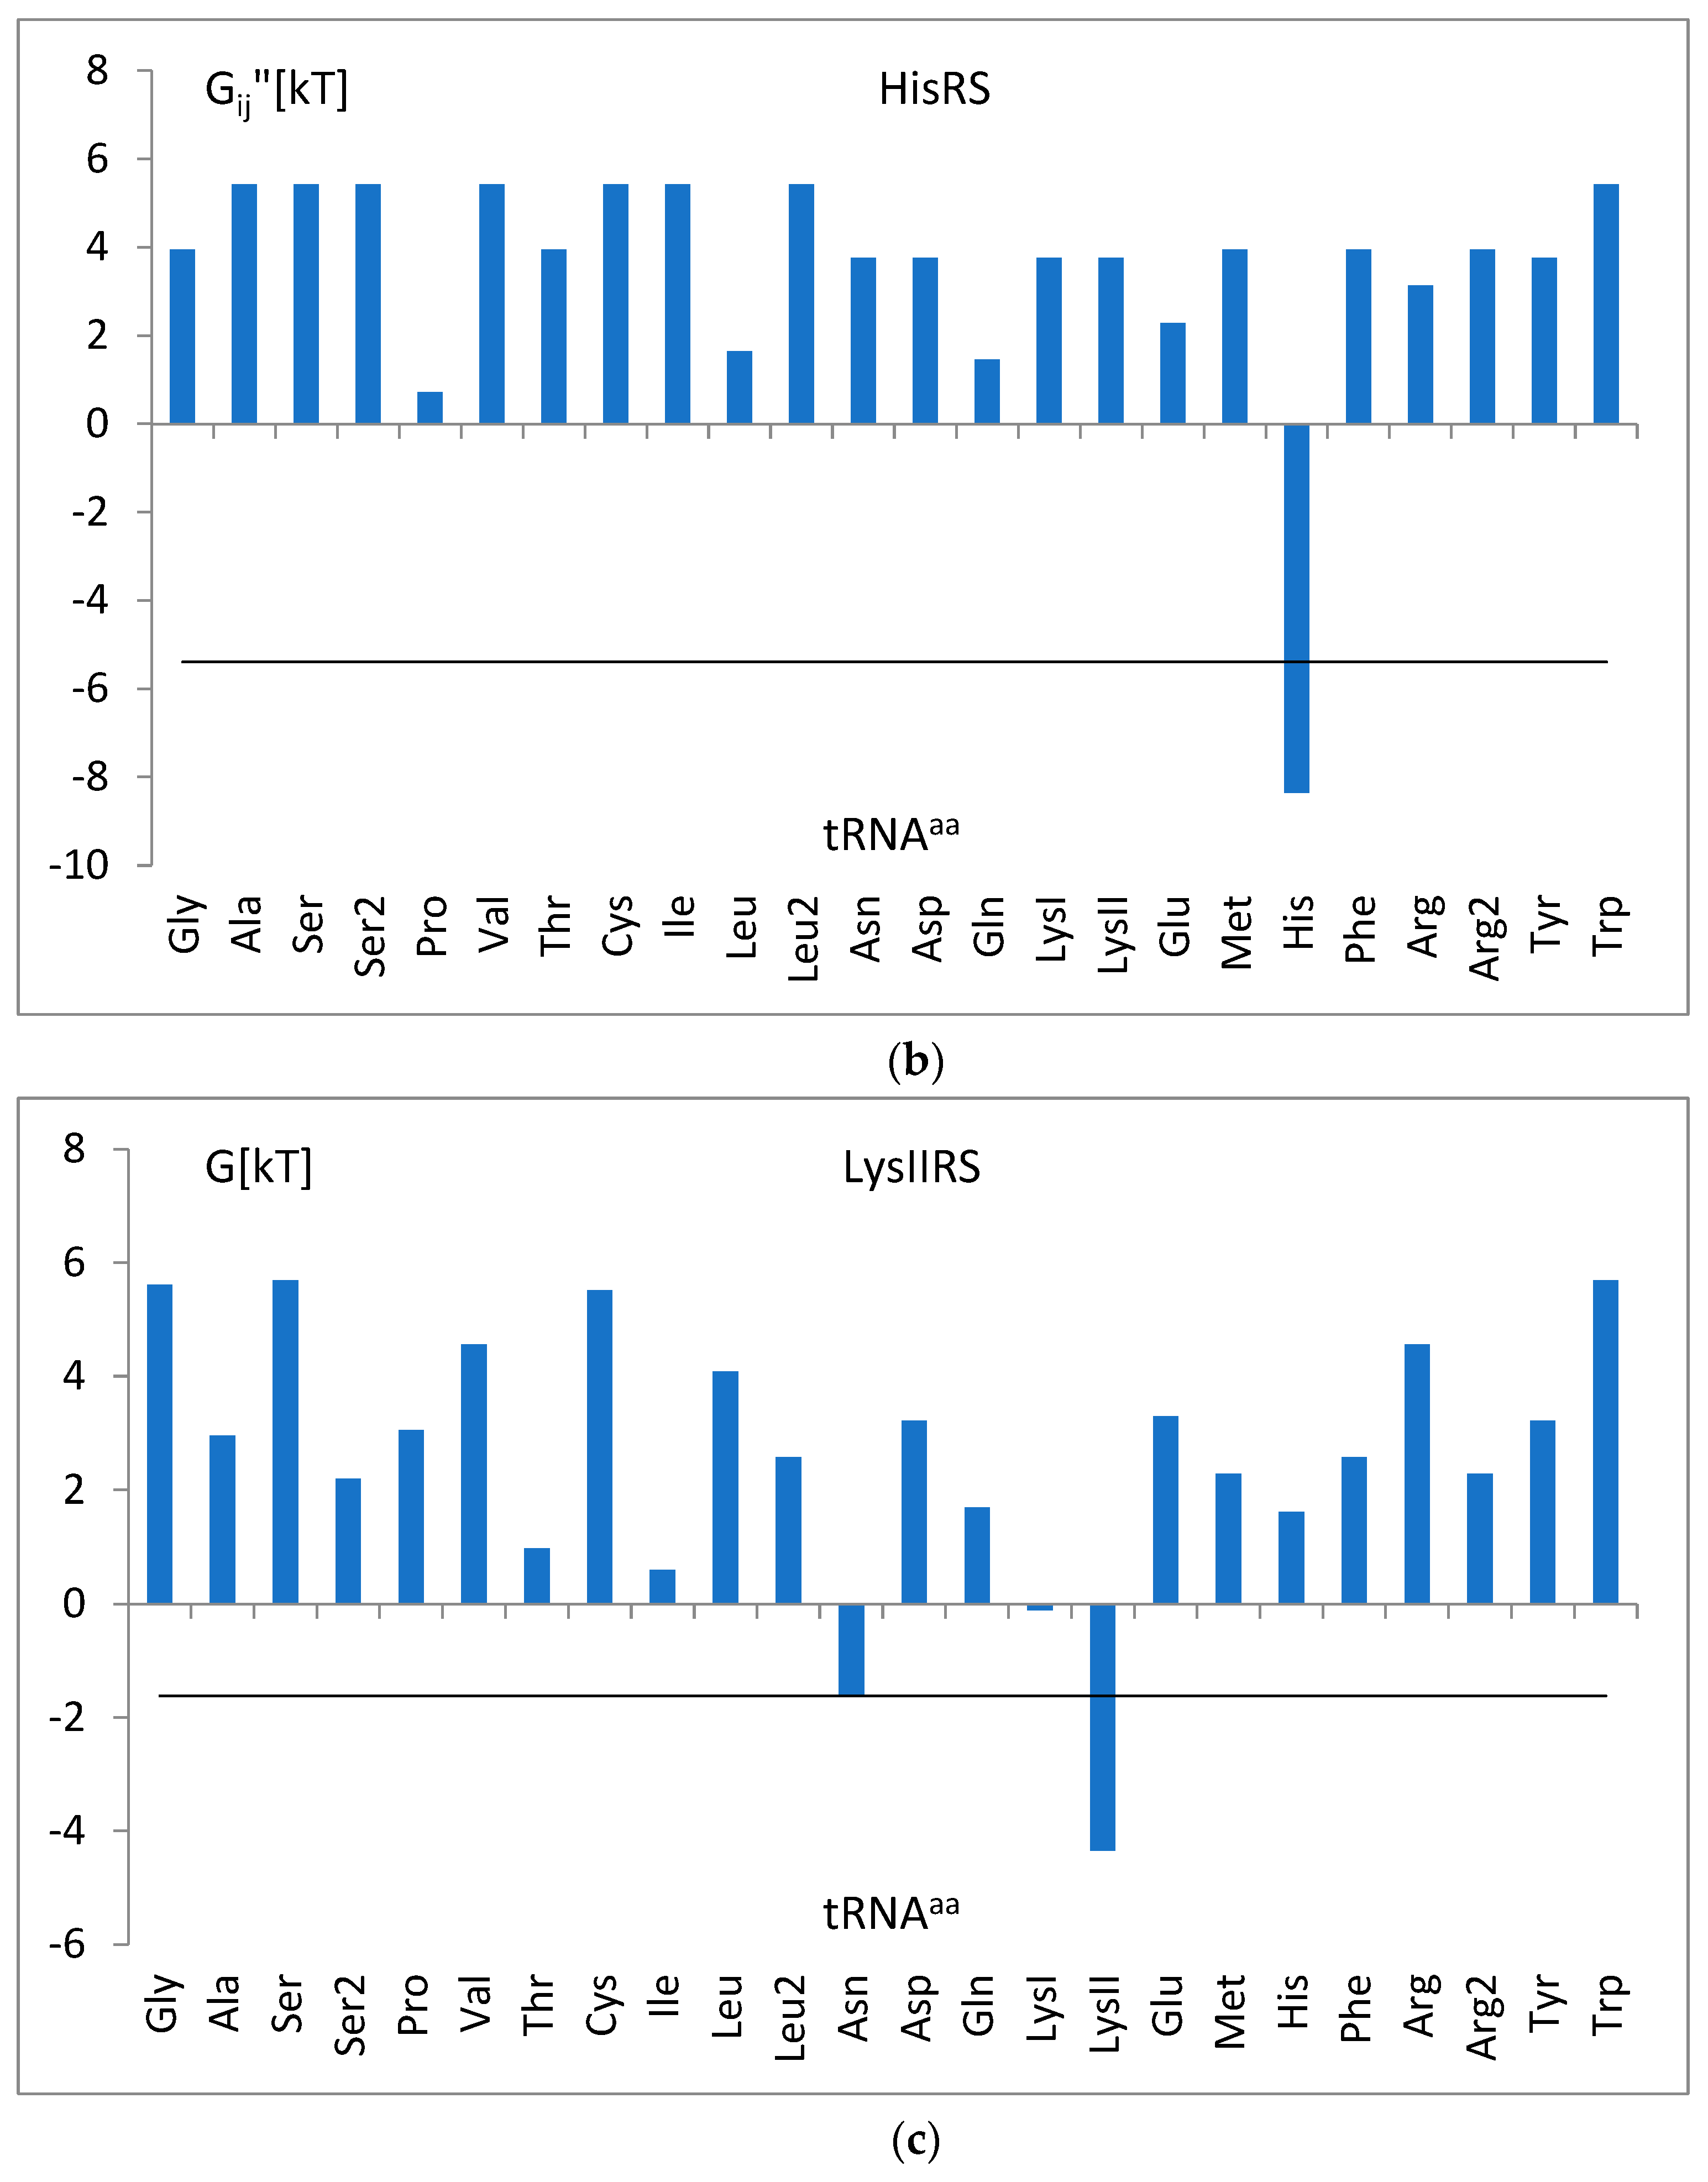
3.5. The Free Energy and Recognition
4. Discussion
5. Summary
6. Conclusions
Supplementary Materials
Author Contributions
Funding
Institutional Review Board Statement
Informed Consent Statement
Data Availability Statement
Conflicts of Interest
References
- Giegé, R.; Frugier, M. Transfer RNA Structure and Identity. In Madame Curie Bioscience Database [Internet]; Landes Bioscience: Austin, TX, USA, 2013. Available online: https://www.ncbi.nlm.nih.gov/books/NBK6236/ (accessed on 11 October 2024).
- Watson, J.D.; Crick, F.H. Genetical implications of the structure of deoxyribonucleic acid. Nature 1953, 171, 964–967. [Google Scholar] [CrossRef] [PubMed]
- Plescia, O.J.; Palczuk, N.C.; Cora-Figueroa, E.; Mukherjee, A.; Braun, W. Production of antibodies to soluble RNA (sRNA). Proc. Natl. Acad. Sci. USA 1965, 54, 1281–1285. [Google Scholar] [CrossRef] [PubMed]
- Palade, G.E. A small particulate component of the cytoplasm. J. Biophys. Biochem. Cytol. 1955, 1, 59–68. [Google Scholar] [CrossRef] [PubMed]
- Delarue, M. Aminoacyl-tRNA synthetases. Struct. Biol. 1995, 5, 48–55. [Google Scholar] [CrossRef] [PubMed]
- Ibba, M.; Hong, K.W.; Sherman, J.M.; Sever, S.; Söll, D. Interactions between tRNA identity nucleotides and their recognition sites in glutaminyl-tRNA synthetase determine the cognate amino acid affinity of the enzyme. Proc. Natl. Acad. Sci. USA 1996, 93, 6953–6958. [Google Scholar] [CrossRef] [PubMed]
- Lenhard, B.; Orellana, O.; Ibba, M.; Weygand-Durasevic, I. tRNA recognition and evolution of determinants in seryl-tRNA synthesis. Nucleic Acids Res. 1999, 27, 721–729. [Google Scholar] [CrossRef] [PubMed]
- McClain, W.H.; Foss, K. Changing the acceptor identity of a transfer RNA by altering nucleotides in a “variable pocket”. Science 1988, 241, 1804–1807. [Google Scholar] [CrossRef] [PubMed]
- Saks, M.E.; Sampson, J.R. Evolution of tRNA recognition systems and tRNA gene sequences. J. Mol. Evol. 1995, 40, 509–518. [Google Scholar] [CrossRef] [PubMed]
- Rould, M.A.; Perona, J.J.; Steitz, T.A. Structural basis of anticodon loop recognition by glutaminyl-tRNA synthetase. Nature 1991, 352, 213–218. [Google Scholar] [CrossRef] [PubMed]
- Rubio Gomez, M.A.; Ibba, M. Aminoacyl-tRNA synthetases. RNA 2020, 26, 910–936. [Google Scholar] [CrossRef] [PubMed]
- Ambrogelly, A.; Korencic, D.; Ibba, M. Functional annotation of class I lysyl-tRNA synthetase phylogeny indicates a limited role for gene transfer. J. Bacteriol. 2002, 184, 4594–4600. [Google Scholar] [CrossRef] [PubMed]
- Ribas de Pouplana, L.; Schimmel, P. Two Classes of tRNA Synthetases Suggested by Sterically Compatible Dockings on tRNA Acceptor Stem. Cell 2001, 104, 191–193. [Google Scholar] [CrossRef] [PubMed]
- Landwehr, N.; Hall, M.; Frank, E. Logistic Model Trees. Mach. Learn. 2005, 59, 161–205. [Google Scholar] [CrossRef]
- Sumner, M.; Frank, E.; Hall, M. Speeding up Logistic Model Tree Induction. In Proceedings of the 9th European Conference on Principles and Practice of Knowledge Discovery in Databases, Porto, Portugal, 3–7 October 2005; pp. 675–683. [Google Scholar]
- Jühling, F.; Mörl, M.; Hartmann, R.K.; Sprinzl, M.; Stadler, P.F.; Pütz, J. tRNAdb 2009: Compilation of tRNA sequences and tRNA genes. Nucleic Acids Res. 2009, 37, D159–D162. [Google Scholar] [CrossRef] [PubMed]
- Frank, E.; Hall, M.A.; Witten, I.H. The WEKA Workbench. In Data Mining: Practical Machine Learning Tools and Techniques, 4th ed.; Morgan Kaufmann: Cambridge, MA, USA, 2016. [Google Scholar]
- Berg, J.M.; Tymoczko, J.L.; Stryer, L. Aminoacyl-Transfer RNA Synthetases Read the Genetic Code. In Biochemistry, 5th ed.; Section 29.2.1; W.H. Freeman and Company: New York, NY, USA, 2001. [Google Scholar]
- Pienaar, E.; Viljoen, H.J. The tri-frame model. J. Theor. Biol. 2008, 251, 616–627. [Google Scholar] [CrossRef] [PubMed]
- Siwiak, M.; Zielenkiewicz, P. A Comprehensive, Quantitative, and Genome-Wide Model of Translation. PLoS Comput. Biol. 2010, 6, e1000865. [Google Scholar] [CrossRef] [PubMed]
- Pawłowski, P.H. The smooth evolution of the universal genetic code (main episodes). Int. J. Sci. 2019, 9, 28–51. [Google Scholar] [CrossRef]
- Giegé, R.; Eriani, G. The tRNA identity landscape for aminoacylation and beyond. Nucleic Acids Res. 2023, 51, 1528–1570. [Google Scholar] [CrossRef] [PubMed]
- Tworowski, D.; Safro, M. The long-range electrostatic interactions control tRNA-aminoacyl-tRNA synthetase complex formation. Protein Sci. 2003, 12, 1247–1251. [Google Scholar] [CrossRef] [PubMed]


| tRNAaa Class | |||
|---|---|---|---|
| aa | Charging Amino Acid | Positions 35 and 36 | Remarks |
| Ala | Alanine | G C | 2-letter gen. code |
| Arg | Arginine | C G | degenerate pos. 36 |
| Arg2 | Arginine | C U | degenerate pos. 36 |
| Asn | Asparagine | U U | 3-letter gen. code |
| Asp | Aspartic acid | U C | 3-letter gen. code |
| Cys | Cysteine | C A | 3-letter gen. code |
| Gln | Glutamine | U G | 3-letter gen. code |
| Glu | Glutamic acid | U C | 3-letter gen. code |
| Gly | Glycine | C C | 2-letter gen. code |
| His | Histidine | U G | 3-letter gen. code |
| Ile | Isoleucine | A U | 3-letter gen. code |
| Leu | Leucine | A G | degenerate pos. 36 |
| Leu 2 | Leucine | A A | degenerate pos. 36 |
| LysI | Lysine | U U | synthetase class I |
| LysII | Lysine | U U | synthetase class II |
| Met | Methionine | A U | 3-letter gen. code |
| Phe | Phenylalanine | A A | 3-letter gen. code |
| Pro | Proline | G G | 2-letter gen. code |
| Ser | Serine | G A | deg. pos. 35 36 |
| Ser2 | Serine | C U | deg. pos. 35 36 |
| Thr | Threonine | G U | 2-letter gen. code |
| Trp | Tryptophan | C A | 3-letter gen. code |
| Tyr | Tyrosine | U A | 3-letter gen. code |
| Val | Valine | A C | 2-letter gen. code |
| Rank Position | tRNA Sequence Position | Correlation Rank Value |
|---|---|---|
| 1 | 35 | 0.1942 |
| 2 | 36 | 0.1925 |
| 3 | 46 | 0.1659 |
| 4 | 47 | 0.162 |
| 5 | 48 | 0.1612 |
| 6 | 73 | 0.1375 |
| 7 | 11 | 0.1263 |
| 8 | 24 | 0.1213 |
| 9 | 45 | 0.1172 |
| 10 | 13 | 0.1162 |
| … | … | … |
| 41 | 34 | 0.0752 |
| Classifier | 10 Fold Cross-Validation | 66% Split | Full Training Set |
|---|---|---|---|
| SimpleLogistic | 94.5205 | 92.5287 | 100 |
| LibLINEAR | 93.9335 | 85.6322 | 100 |
| RandomForest | 93.9335 | 83.908 | 100 |
| SMO | 92.3679 | 81.0345 | 100 |
| Dl4jMlpClassifier | 86.6928 | 78.1609 | 100 |
| ZeroR | 8.0235 | 8.046 | 8.0235 |
| Ala | 3G | 17D | 35G | 36C | 70U | 71C | ||
|---|---|---|---|---|---|---|---|---|
| Arg | 21A | 35C | 36G | |||||
| Arg2 | 21A | 35C | 36U | 69G | 72U | |||
| Asn | 5C | 14U | 35U | 37 6 | 39C | 41G | 63~C | 73~A |
| Asp | 34G8Q | 35U | 36C | 73G | ||||
| Cys | 9G | 34G | 35C | 36A | 63G | 73U | ||
| Gln | 1~G | 35U | 36G | 41C | 44~A | 58~A | 70A | 71C |
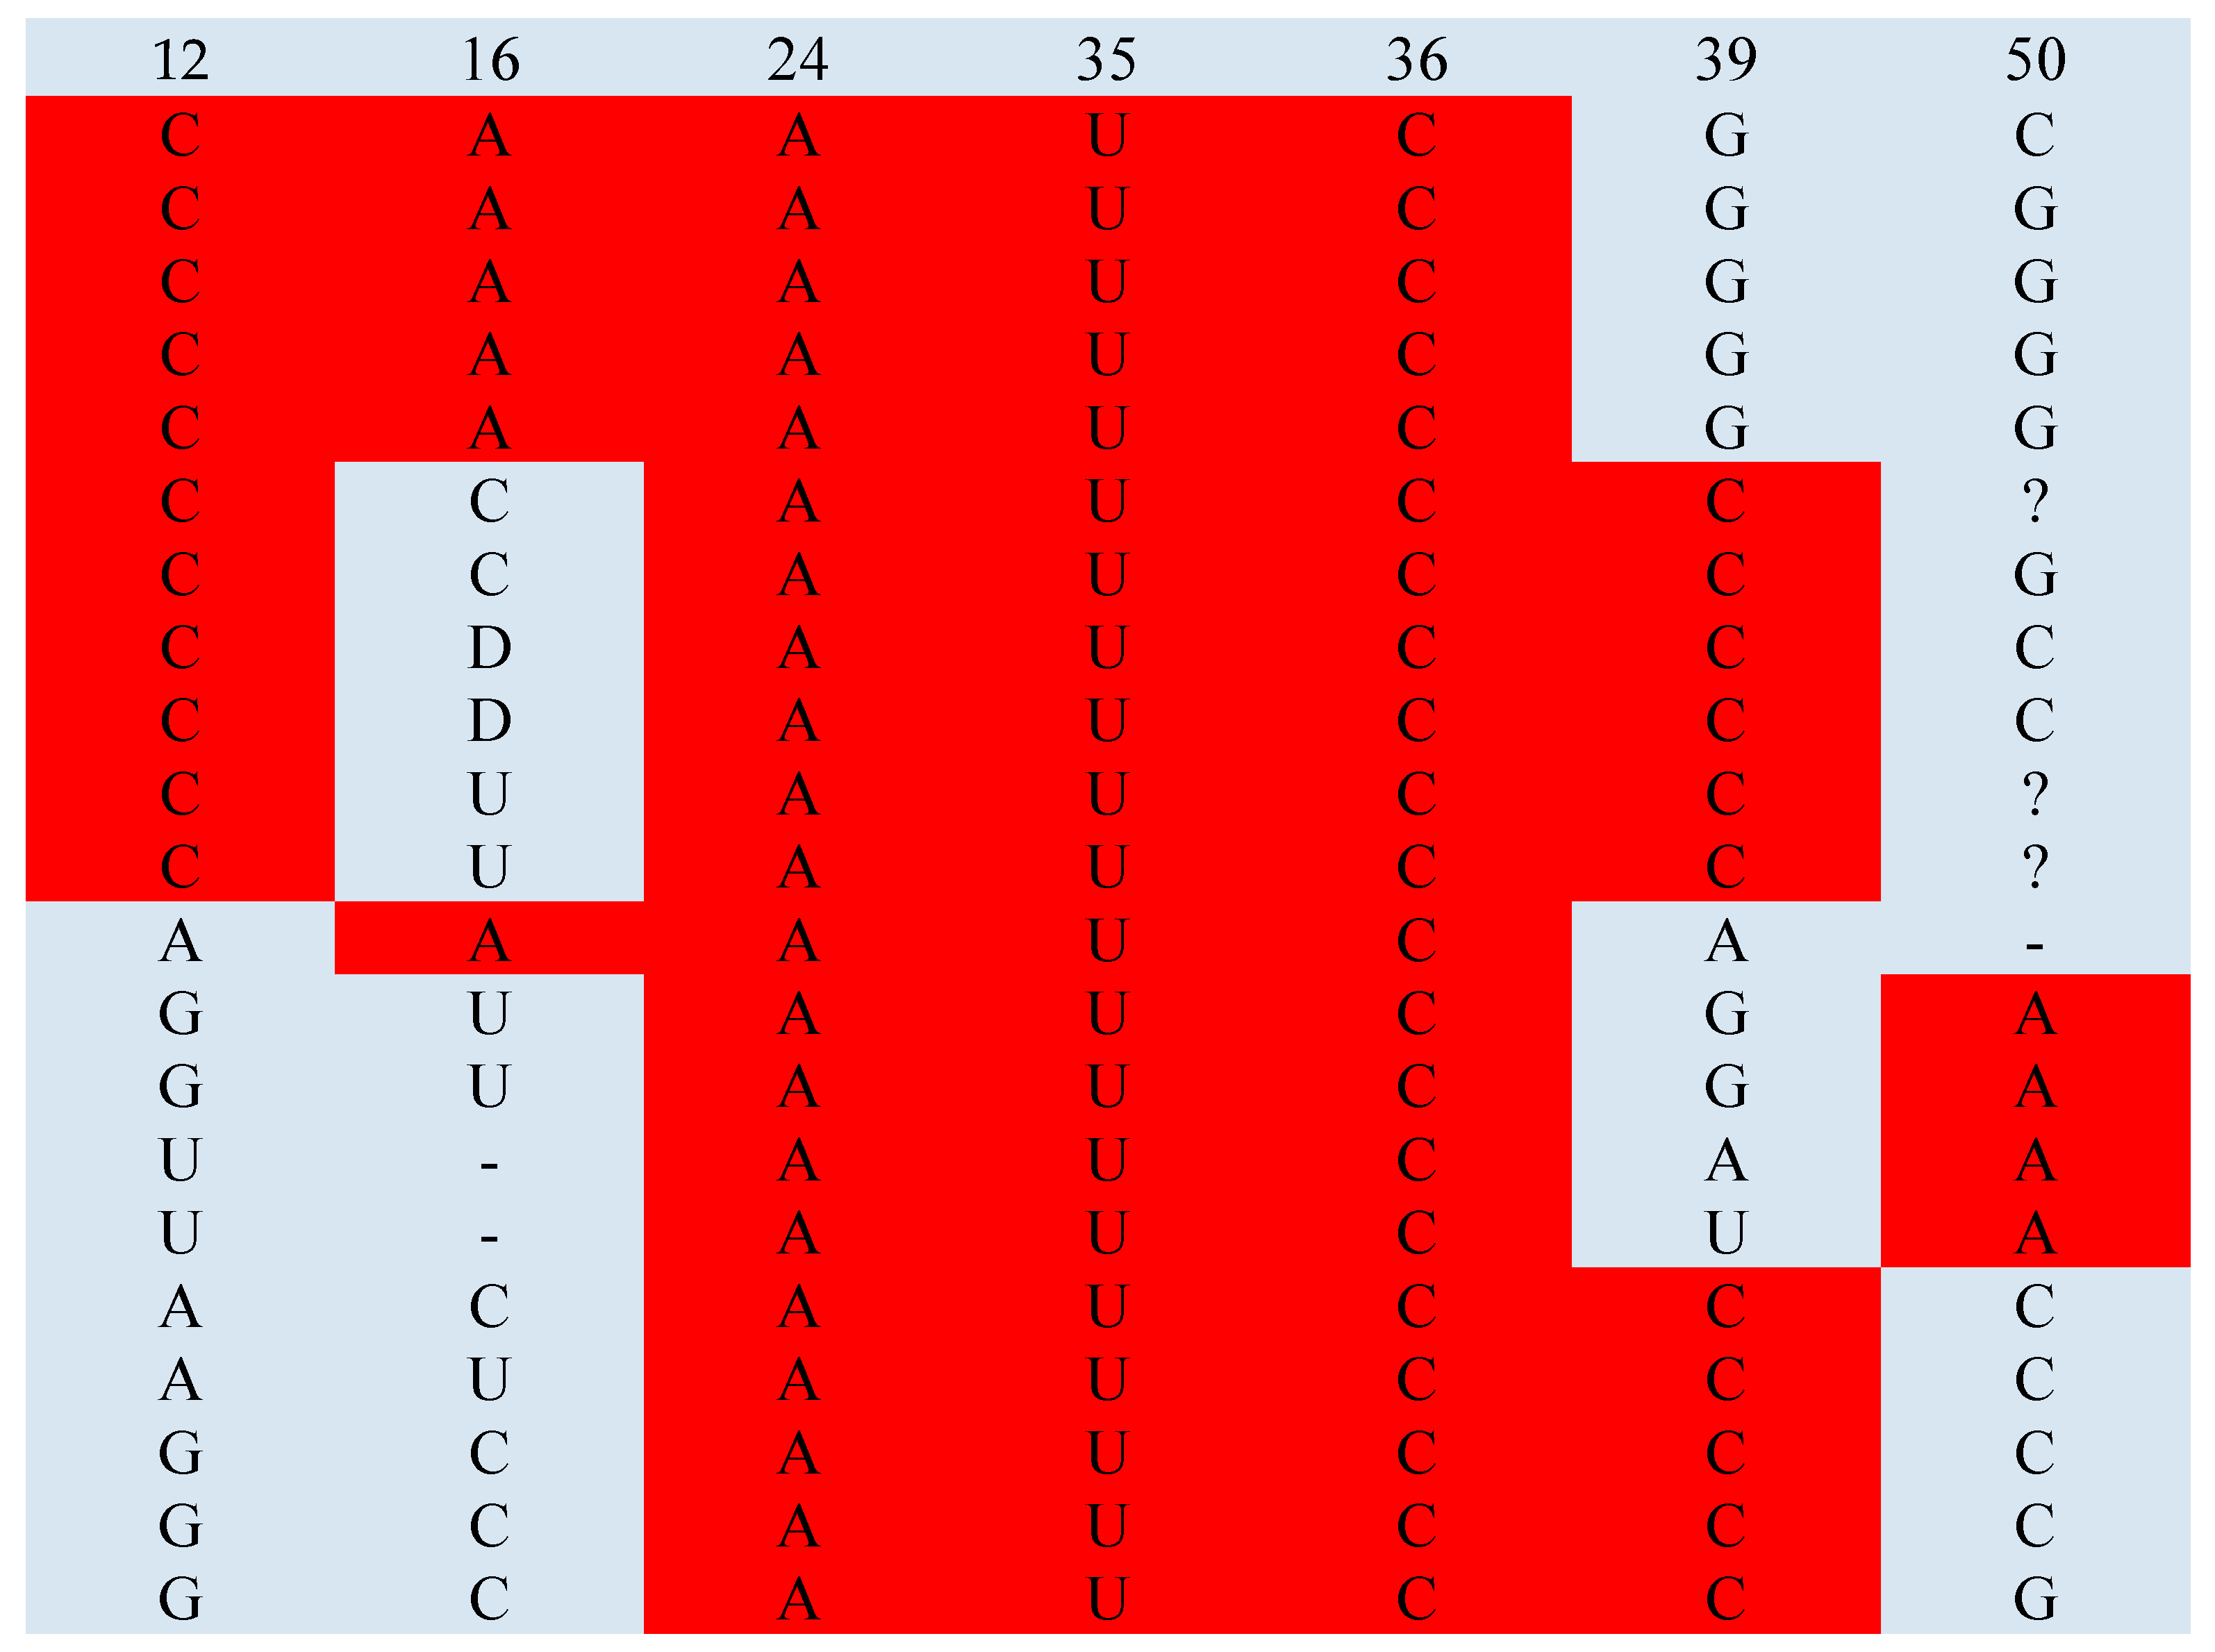
| Glu | 12C | 16A | 24A | 35U | 36C | 39C | 50A | |
| Gly | 35C | 36C | ||||||
| His | −1G | 2C | 17U | 35U | 36G | 37G | ||
| Ile | 2G | 7~G | 35A | 36U | 37 6 | 40G | 41G | 70~G |
| Leu | 35A | 36G | 48~- | 55G | ||||
| Leu2 | 12A | 13~C | 35A | 36A | 48~- | |||
| LysI | 4C | 18~- | 28C | 35U | 36U | 43~G | 71C | |
| LysII | 7~G | 29U | 34)~G | 35U | 36U | 67~G | ||
| Met | 7G | 11G | 31P | 34MCB | 35A | 36U | ||
| Phe | 21G | 23A | 34G# | 35A | 36A | 44G | ||
| Pro | 35G | 36G | 37K | |||||
| Ser | 25A | 35G | 36A | 48~- | 73G | |||
| Ser2 | 20- | 34 7G | 35C | 36U | 46~- | |||
| Thr | 2C | 35G | 36U | 73U | ||||
| Trp | 22G | 34B | 35C | 36A | 70C | 72U | 73~U | |
| Tyr | 21C | 34G | 35U | 36A | 45- | 63~C | ||
| Val | 35A | 36C |
| Ala | Arg | Arg2 | Asn | Asp | Cys | Gln | Glu | Gly | His | Ile | Leu | Leu2 | Lys1b | Lys2b | Met | Phe | Pro | Ser | Ser2 | Thr | Trp | Tyr | Val | |
|---|---|---|---|---|---|---|---|---|---|---|---|---|---|---|---|---|---|---|---|---|---|---|---|---|
| −1 | - | - | - | - | - | - | - | - | - | G | - | - | - | - | - | - | - | - | - | - | - | - | - | - |
| 1 | G | G | G | G | G | G | G | G | G | G | G | G | G | G | G | G | G | C | G | G | G | A | G | G |
| 2 | G | G | C | U | A | G | G | C | C | C | G | C | U | G | A | C | C | G | G | A | C | G | G | G |
| 3 | G | G | C | C | C | C | U | C | G | C | G | U | C | G | C | C | C | G | A | C | C | G | A | U |
| 4 | G | C | C | U | A | U | G | C | G | G | C | A | A | C | U | U | G | C | G | A | G | G | G | U |
| 5 | G | C | C | C | C | A | C | U | G | U | C | G | G | C | G | G | A | G | G | A | A | G | G | C |
| 6 | C | C | C | U | G | C | C | C | G | U | U | U | G | C | G | C | G | A | C | A | U | C | G | C |
| 7 | A | G | G | G | G | A | A | G | G | A | U | A | A | G | U | G | A | G | G | G | U | G | G | G |
| 8 | U | U | U | U | U | U | U | U | U | U | U | U | U | U | U | U | U | U | U | U | U | U | U | U |
| 9 | A | A | A | K | A | G | K | G | A | A | A | G | G | A | A | A | A | A | G | G | A | A | A | A |
| 10 | G | G | G | L | G | G | G | G | G | G | G | L | G | G | L | G | L | G | G | G | G | G | G | G |
| 11 | C | C | C | C | U | C | U | U | U | U | C | C | C | C | C | C | C | C | C | C | C | U | C | U |
| 12 | U | U | U | G | A | C | G | C | U | U | U | M | M | U | U | U | U | C | M | C | U | U | G | U |
| 13 | C | C | U | C | P | G | P | P | U | P | C | G | G | C | C | C | C | C | G | - | C | C | A | P |
| 14 | A | A | A | A | A | A | A | A | A | A | A | A | A | A | A | A | A | A | A | A | A | A | A | A |
| 15 | G | A | A | A | G | G | G | G | A | G | G | G | G | G | G | G | G | G | G | G | G | A | G | G |
| 16 | C | D | U | D | U | C | D | A | U | D | U | D | D | C | D | D | D | C | D | - | D | U | U | D |
| 17 | D | - | - | C | - | - | - | - | - | - | D | - | - | C | C | D | D | U | - | - | - | - | - | - |
| 18 | - | - | - | - | - | - | - | - | - | - | - | - | - | A | - | - | - | U | - | - | - | - | - | - |
| 19 | G | G | G | G | G | G | G | G | G | G | G | G | G | G | G | G | G | G | # | G | G | G | G | G |
| 20 | G | G | G | G | G | G | G | G | G | G | G | G | G | G | G | G | G | G | G | G | G | G | G | G |
| 21 | G | A | A | D | D | D | D | C | D | D | D | D | D | C | D | D | G | D | D | D | D | D | C | D |
| 22 | G | A | G | G | G | A | G | G | G | G | G | A | A | G | G | G | G | G | A | A | G | G | A | U |
| 23 | A | A | A | C | U | G | C | G | A | A | A | G | G | A | A | A | A | G | G | G | A | A | C | A |
| 24 | G | G | G | G | A | G | A | A | A | A | G | G | G | G | G | G | G | G | G | G | G | A | G | A |
| 25 | C | U | C | C | U | C | C | C | C | C | C | C | C | C | C | C | C | U | C | C | C | C | C | C |
| 26 | R | R | A | R | A | A | U | A | A | A | R | R | R | G | A | A | R | A | R | R | A | A | G | A |
| 27 | C | C | C | P | C | P | C | C | C | C | P | C | C | G | P | P | P | C | A | A | C | C | G | P |
| 28 | U | U | C | P | C | C | C | C | C | A | G | U | C | C | P | C | P | U | C | A | C | C | C | C |
| 29 | U | U | G | C | C | G | G | G | A | G | C | G | A | G | U | G | A | U | A | G | U | G | A | U |
| 30 | G | G | G | G | G | G | G | C | G | C | C | G | G | G | G | G | G | G | G | A | C | G | G | G |
| 31 | C | A | C | G | C | A | A | G | C | G | G | A | A | G | A | P | A | C | A | A | C | A | A | C |
| 32 | U | C | C | C | C | C | B | C | C | P | C | P | C | C | C | C | B | U | hc | C | C | C | C | U |
| 33 | U | U | U | U | U | U | U | U | U | U | U | U | U | U | U | U | U | U | U | U | U | U | U | U |
| 34 | I | I | { | Q | G | G | N | C | G | G | G | U | . | U | C | C | # | U | I | G | G | B | G | I |
| 35 | G | C | C | U | U | C | U | U | C | U | A | A | A | U | U | A | A | G | G | C | G | C | U | A |
| 36 | C | G | U | U | C | A | G | C | C | G | U | G | A | U | U | U | A | G | A | U | U | A | A | C |
| 37 | A | K | 6 | 6 | A | K | A | A | A | K | 6 | K | K | A | 6 | 6 | * | K | * | 6 | 6 | * | * | A |
| 38 | C | A | A | A | A | A | A | C | G | C | A | C | A | A | A | A | A | P | A | A | A | A | A | ? |
| 39 | G | P | G | C | G | P | P | C | G | C | C | P | P | C | P | P | P | G | P | G | P | P | P | G |
| 40 | C | C | C | C | G | C | C | G | C | G | G | C | C | C | C | C | ? | C | C | U | G | C | C | C |
| 41 | A | A | C | G | G | C | C | C | U | C | G | C | U | C | A | C | U | A | U | C | A | C | C | A |
| 42 | A | A | G | A | G | G | A | G | G | U | A | A | G | G | A | G | A | A | G | A | G | G | G | G |
| 43 | G | G | G | A | G | U | G | G | G | G | G | G | G | C | A | A | U | G | U | U | G | A | C | A |
| 44 | A | A | A | A | A | A | C | A | A | A | A | U | J | G | G | A | A | G | J | J | A | A | U | A |
| 45 | G | G | G | G | G | A | G | G | G | A | G | - | - | G | G | G | G | G | - | - | G | G | - | G |
| 46 | - | - | - | - | - | - | - | - | - | - | - | C | G | - | - | - | - | - | G | G | - | - | G | - |
| 47 | - | - | - | - | - | - | - | - | - | - | - | C | C | - | - | - | - | - | G | G | - | - | C | - |
| 48 | - | - | - | - | - | - | - | - | - | - | - | C | C | - | - | - | - | - | G | - | - | - | C | - |
| 49 | ? | ? | G | G | A | A | ? | ? | ? | ? | A | ? | G | C | A | A | ? | ? | G | G | G | G | G | ? |
| 50 | C | G | C | G | C | C | ? | ? | U | U | C | U | U | C | A | C | C | C | C | C | U | U | G | C |
| 51 | G | G | A | U | G | C | G | G | G | G | U | G | G | G | G | A | U | A | A | G | A | G | A | C |
| 52 | G | G | G | G | G | G | G | G | G | G | G | G | G | G | G | A | G | G | G | G | G | G | G | G |
| 53 | G | G | G | G | G | G | G | G | G | G | G | G | G | G | G | G | G | G | G | G | G | G | G | G |
| 54 | T | T | T | . | T | U | U | T | T | U | T | T | T | U | T | T | T | T | T | T | T | T | T | T |
| 55 | P | P | P | P | P | P | P | P | P | P | P | P | P | U | P | P | P | P | P | P | P | P | P | P |
| 56 | C | C | C | C | C | C | C | C | C | C | C | C | C | C | C | C | C | C | C | C | C | C | C | C |
| 57 | G | G | G | G | A | G | G | G | G | G | A | A | G | A | G | G | G | A | G | G | G | G | G | G |
| 58 | A | A | A | “ | A | A | A | A | A | A | A | A | “ | A | A | A | “ | A | A | A | A | A | A | A |
| 59 | U | A | A | G | U | A | A | A | U | A | G | A | A | A | G | A | U | A | A | A | U | A | A | A |
| 60 | U | U | U | C | U | U | U | U | U | U | U | U | U | U | U | U | ? | U | U | U | U | U | U | U |
| 61 | C | C | C | C | C | C | C | C | C | C | C | C | C | C | C | C | C | C | C | C | C | C | C | C |
| 62 | C | C | C | C | C | C | C | C | C | C | C | C | C | C | C | U | C | C | C | C | C | C | C | C |
| 63 | C | C | U | A | C | G | C | C | C | C | A | C | C | C | C | C | G | U | U | C | U | U | G | G |
| 64 | G | U | G | C | G | G | G | G | G | A | C | A | A | G | U | U | G | G | G | G | A | G | U | G |
| 65 | G | G | G | C | U | U | G | G | G | G | U | C | C | G | C | U | G | G | C | G | C | C | C | G |
| 66 | C | C | C | C | C | U | U | U | C | U | A | U | U | C | A | A | U | C | C | C | A | C | C | C |
| 67 | G | G | G | A | C | G | G | G | C | A | A | G | U | G | U | G | C | U | G | U | G | G | C | G |
| 68 | G | G | G | G | G | U | G | G | C | A | G | C | C | G | C | C | U | G | C | U | U | C | C | G |
| 69 | C | G | G | G | U | G | G | G | C | C | G | U | U | G | A | C | C | G | C | U | C | C | C | A |
| 70 | U | C | G | G | G | G | A | G | C | G | C | G | G | C | G | G | G | C | U | G | G | C | U | A |
| 71 | C | U | G | A | U | C | C | G | G | G | C | G | A | C | U | G | G | C | C | U | G | C | C | C |
| 72 | C | C | U | C | C | C | C | A | C | ? | C | C | C | C | C | C | C | G | C | C | C | U | C | C |
| 73 | A | G | A | G | G | U | U | A | A | A | A | A | A | G | A | A | A | A | G | G | A | G | A | A |
| 74 | C | C | C | C | C | C | C | C | C | C | C | C | C | C | C | C | C | C | C | C | C | C | C | C |
| 75 | C | C | C | C | C | C | C | C | C | C | C | C | C | C | C | C | C | C | C | C | C | C | C | C |
| 76 | A | A | A | A | A | A | A | A | A | A | A | A | A | A | A | A | A | A | A | A | A | A | A | A |
| Ala | 35G | 36C | 71C | ||
| Cys | 34G | 35C | 36A | 73U | |
| Glu | 24A | 35U | 36C | ||
| LysI | 4C | 28C | 35U | 36U | 71C |
| Ala | 3G | 17D | 70U | 71C | ||
|---|---|---|---|---|---|---|
| Arg2 | 21A | 69G | 72U | |||
| Asn | 5C | 39C | 41G | 63~C | 73~A | |
| Asp | 34 8 | 73G | ||||
| Cys | 9G | 34G | 63G | 73U | ||
| Glu | 12C | 16A | 24A | |||
| His | −1G | 2C | 17U | |||
| 2C | 17U | 37G | ||||
| Ile | 2G | 7~G | 37 6 | 40G | 41G | 70~G |
| Met | 7G | 31P | 34C | |||
| 7G | 31P | 34B | ||||
| Phe | 21G | 23A | 34# | |||
| 23A | 34# | 44G | ||||
| Ser | 25A | 48~- | 73G | |||
| Ser2 | 20- | 34G | 46~- | |||
| Trp | 22G | 34B | 70C | 72U | 73~U |
Disclaimer/Publisher’s Note: The statements, opinions and data contained in all publications are solely those of the individual author(s) and contributor(s) and not of MDPI and/or the editor(s). MDPI and/or the editor(s) disclaim responsibility for any injury to people or property resulting from any ideas, methods, instructions or products referred to in the content. |
© 2024 by the authors. Licensee MDPI, Basel, Switzerland. This article is an open access article distributed under the terms and conditions of the Creative Commons Attribution (CC BY) license (https://creativecommons.org/licenses/by/4.0/).
Share and Cite
Pawłowski, P.H.; Zielenkiewicz, P. Determining the Identity Nucleotides and the Energy of Binding of tRNAs to Their Aminoacyl-tRNA Synthetases Using a Simple Logistic Model. Life 2024, 14, 1328. https://doi.org/10.3390/life14101328
Pawłowski PH, Zielenkiewicz P. Determining the Identity Nucleotides and the Energy of Binding of tRNAs to Their Aminoacyl-tRNA Synthetases Using a Simple Logistic Model. Life. 2024; 14(10):1328. https://doi.org/10.3390/life14101328
Chicago/Turabian StylePawłowski, Piotr H., and Piotr Zielenkiewicz. 2024. "Determining the Identity Nucleotides and the Energy of Binding of tRNAs to Their Aminoacyl-tRNA Synthetases Using a Simple Logistic Model" Life 14, no. 10: 1328. https://doi.org/10.3390/life14101328
APA StylePawłowski, P. H., & Zielenkiewicz, P. (2024). Determining the Identity Nucleotides and the Energy of Binding of tRNAs to Their Aminoacyl-tRNA Synthetases Using a Simple Logistic Model. Life, 14(10), 1328. https://doi.org/10.3390/life14101328