
A Proof of Principle 2D Spatial Proteome Mapping Analysis Reveals Distinct Regional Differences in the Cardiac Proteome
 , , , and
Abstract
:1. Introduction
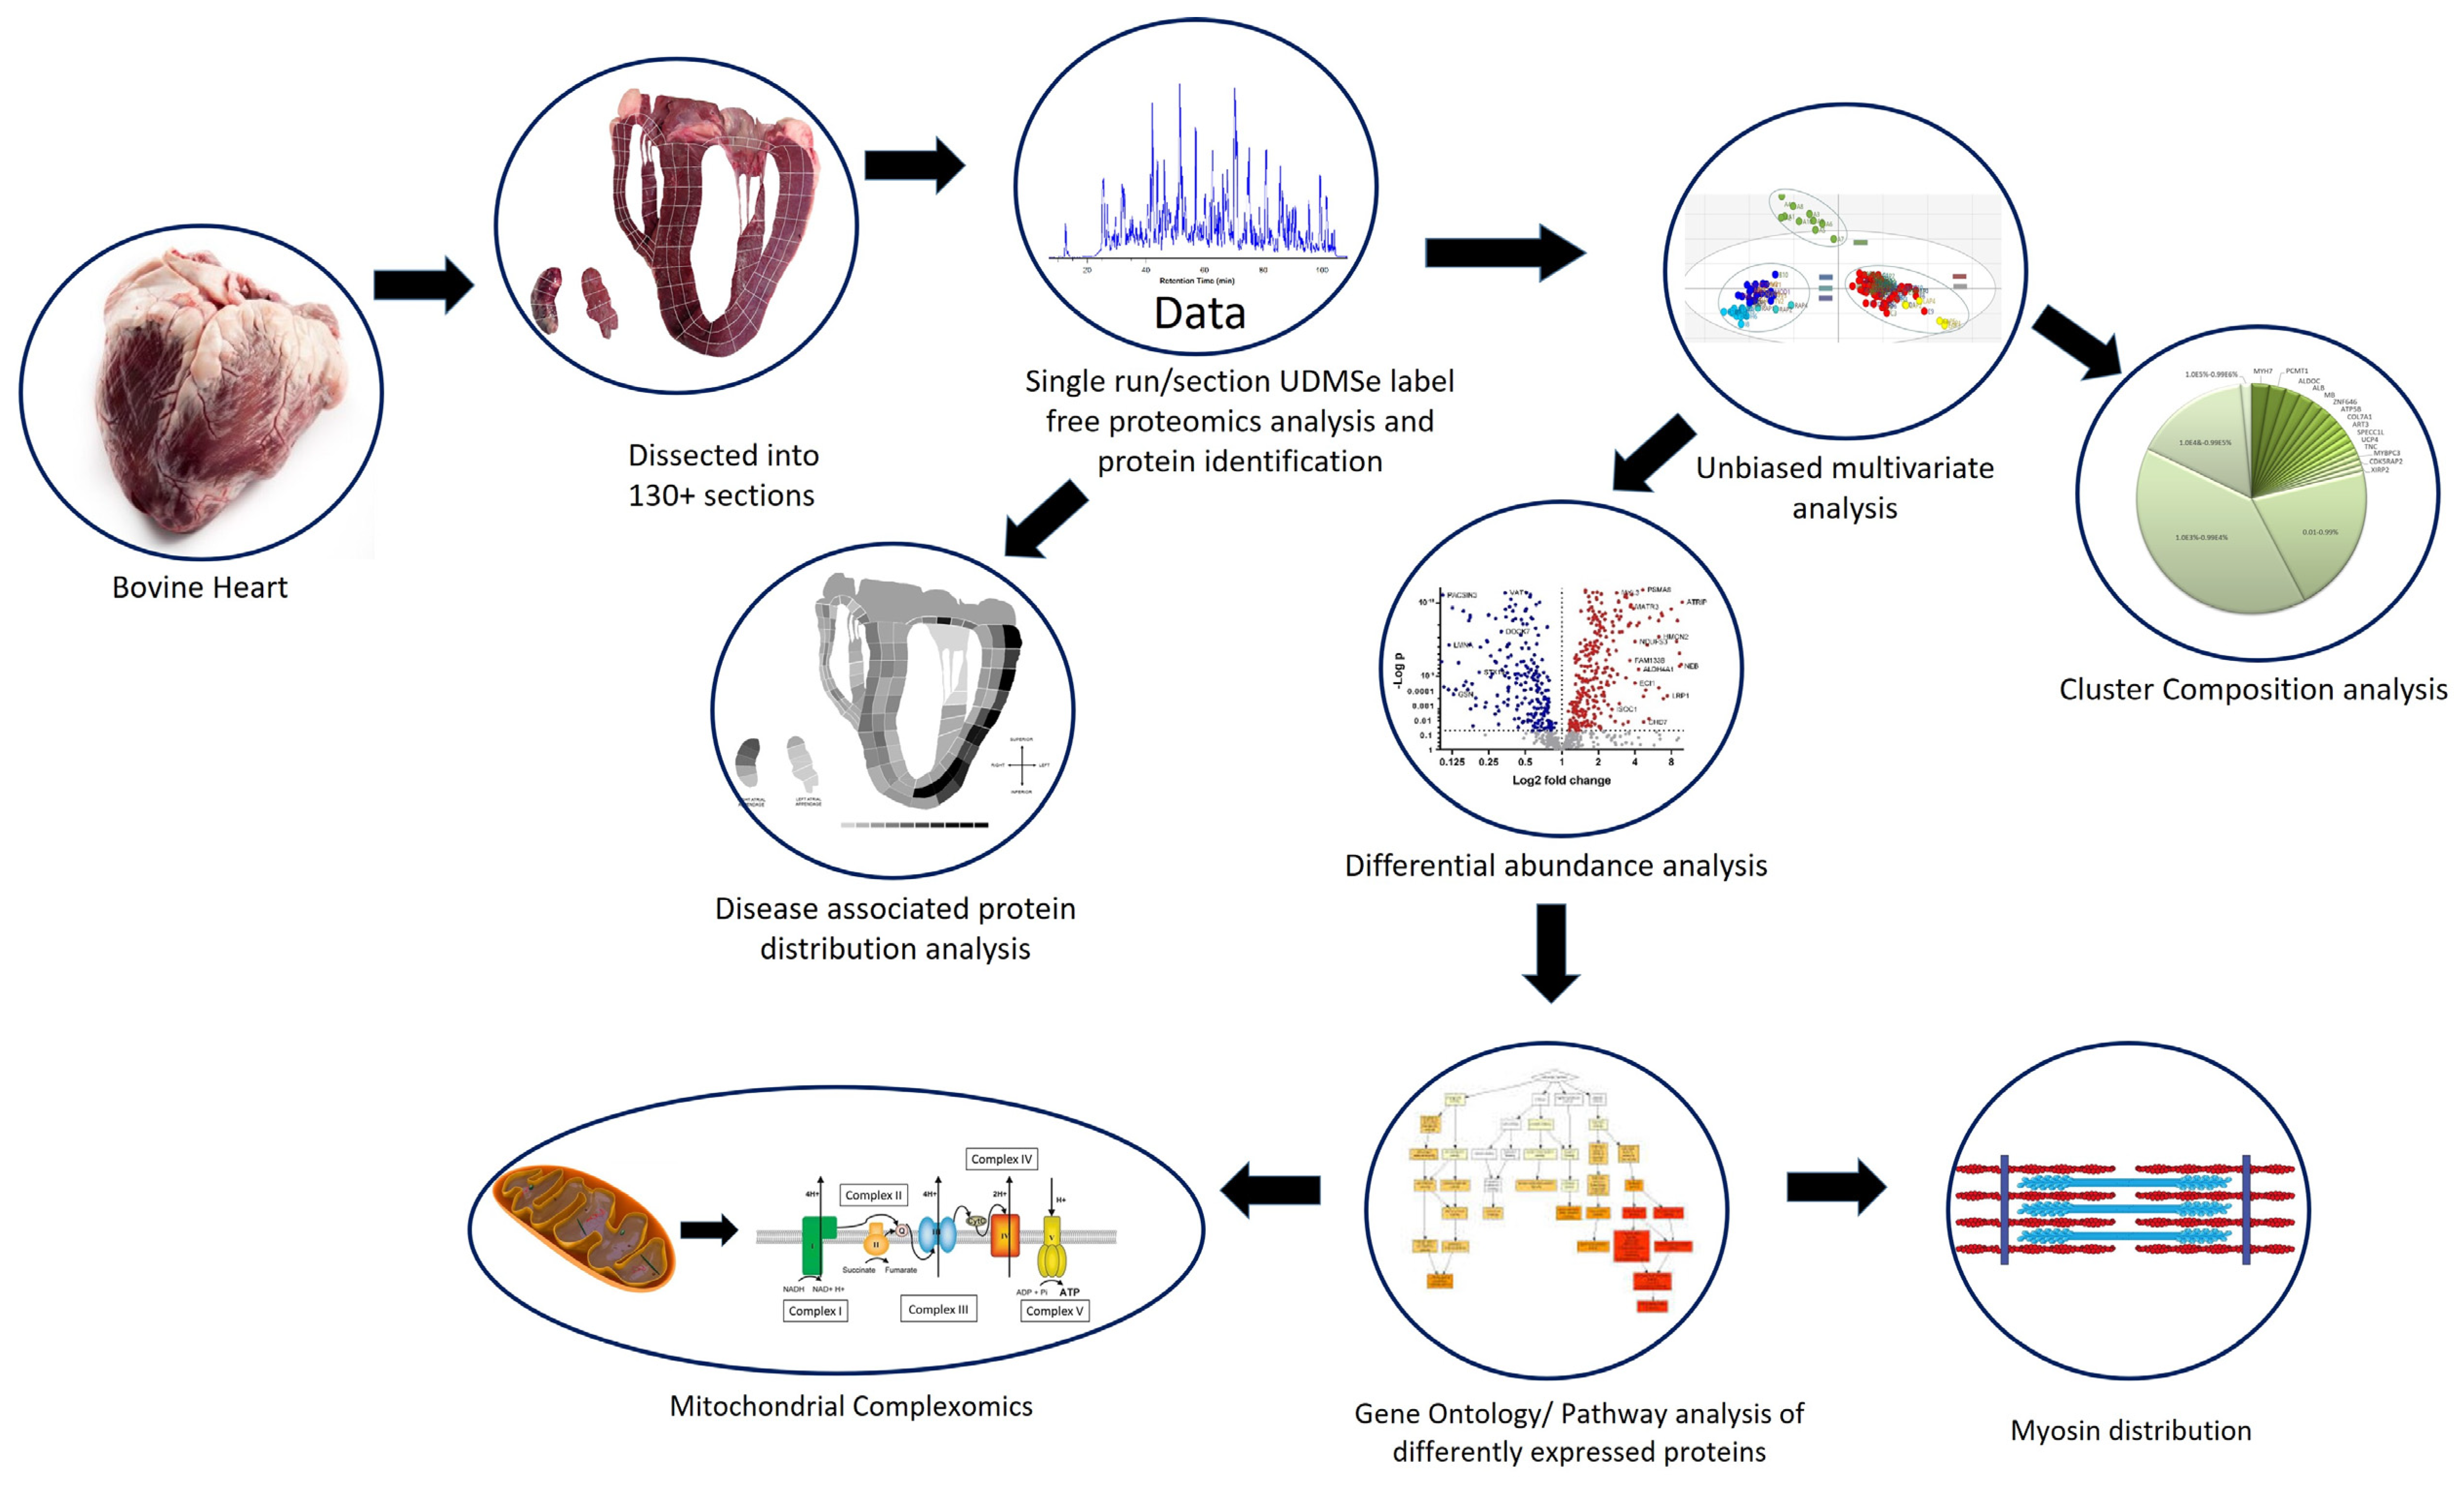
2. Methods
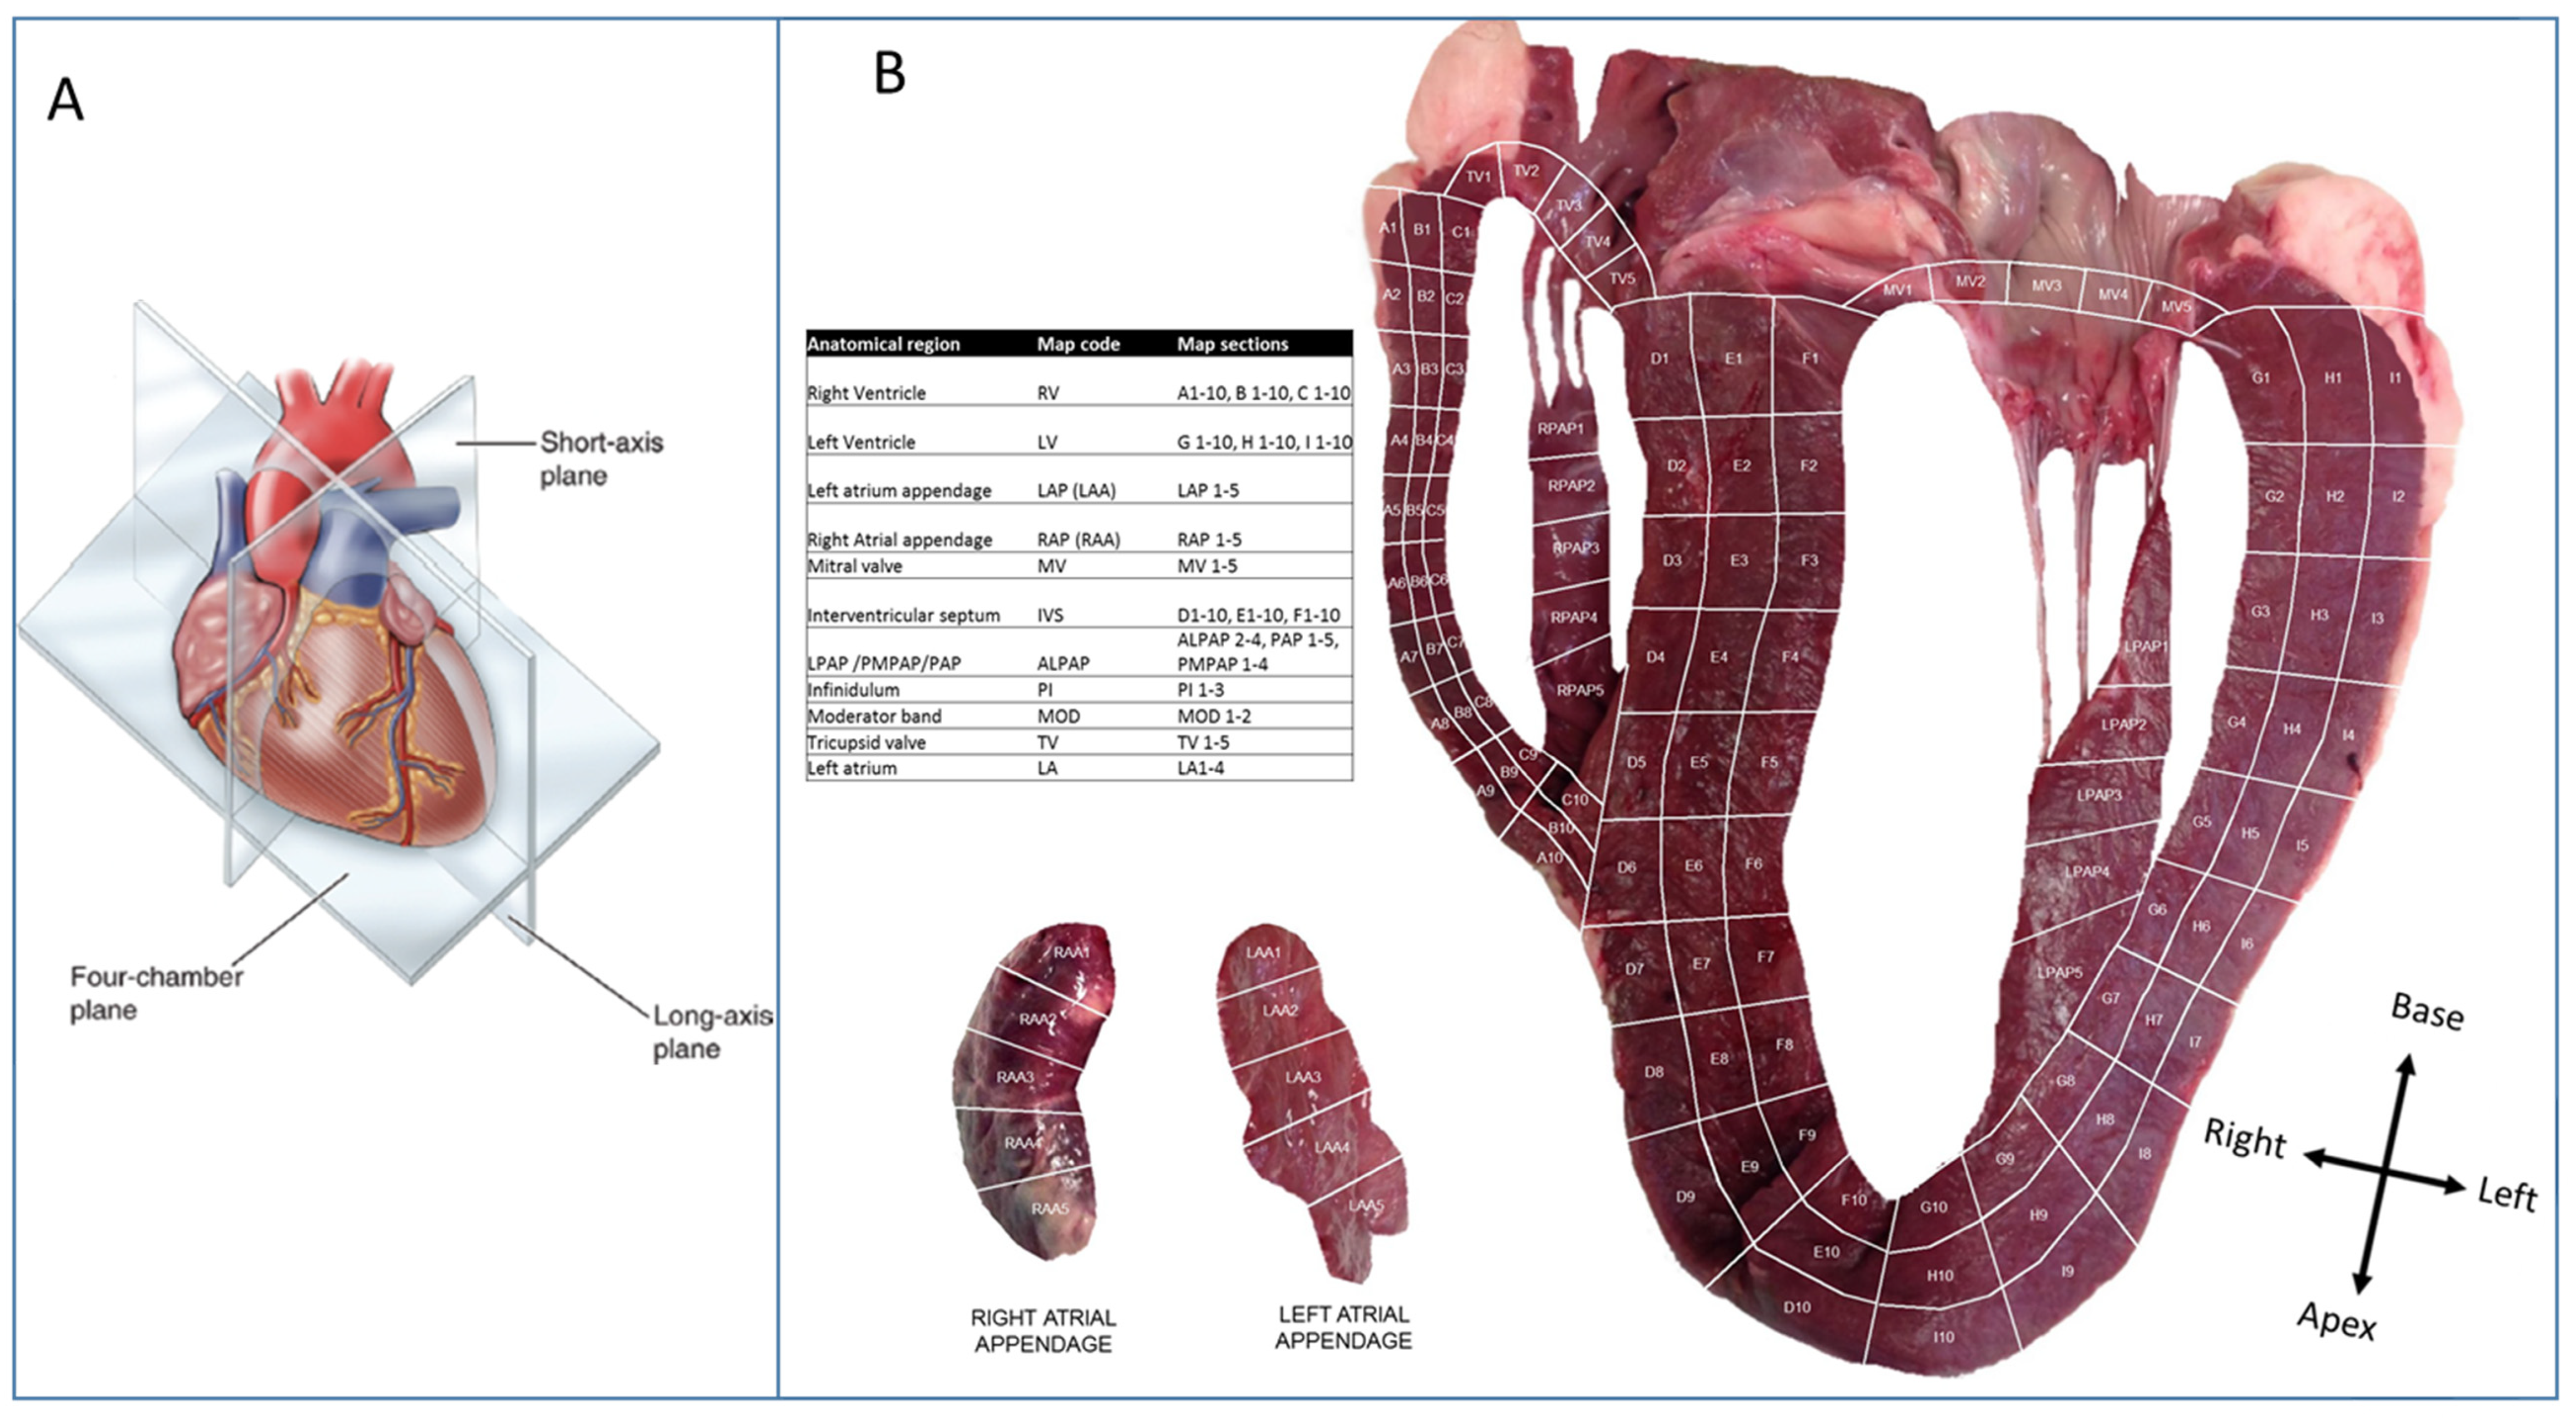
2.1. Heart Tissue Sectioning
2.2. Tissue Preparation
2.3. Sample Digestion
2.4. Label-Free Proteomics
2.5. Data Analysis
2.6. Data Visualisation
3. Results
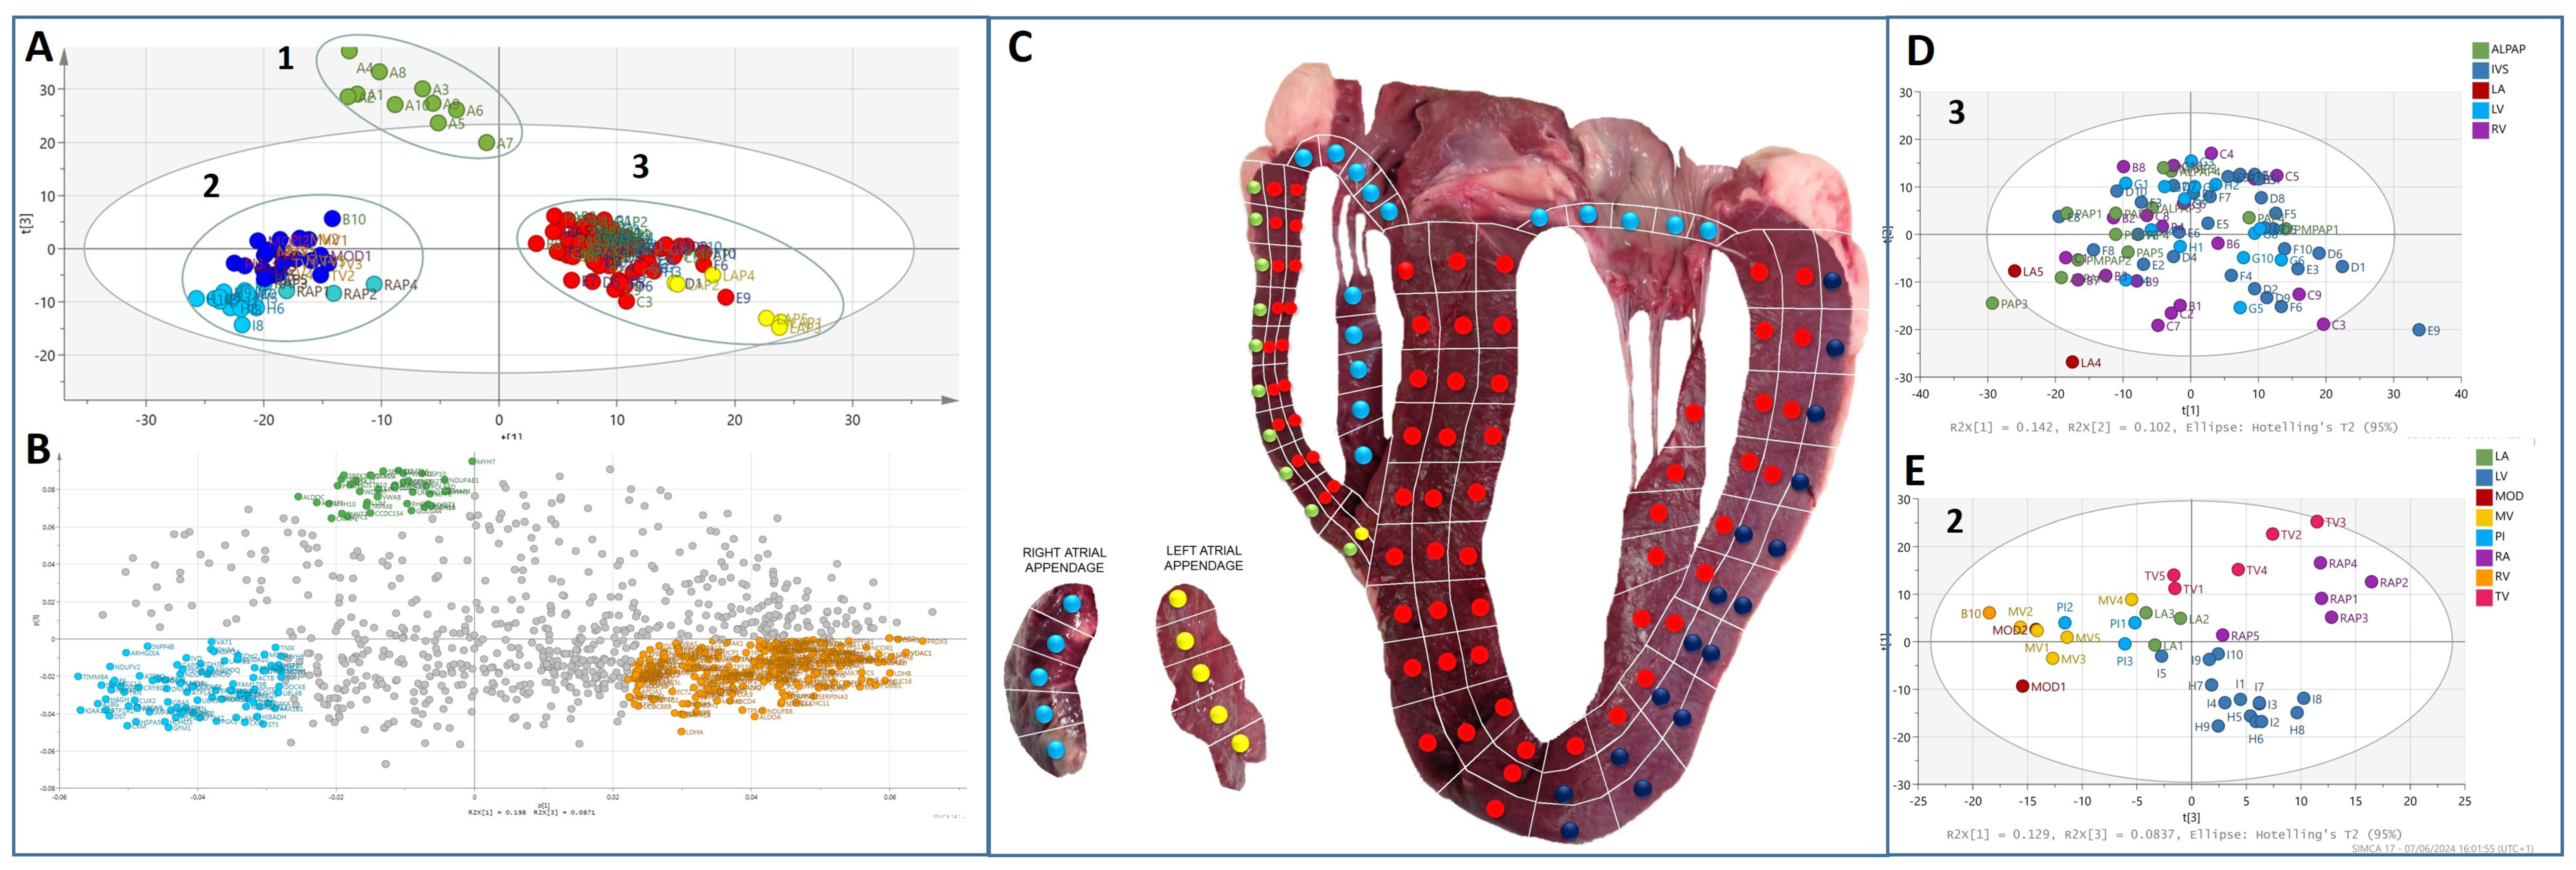
3.1. Multivariate Analysis of the Bovine Heart Proteome
3.2. Protein Composition of the Heart Proteomes
3.3. Myosin/Sarcomere Protein Distribution in the Heart
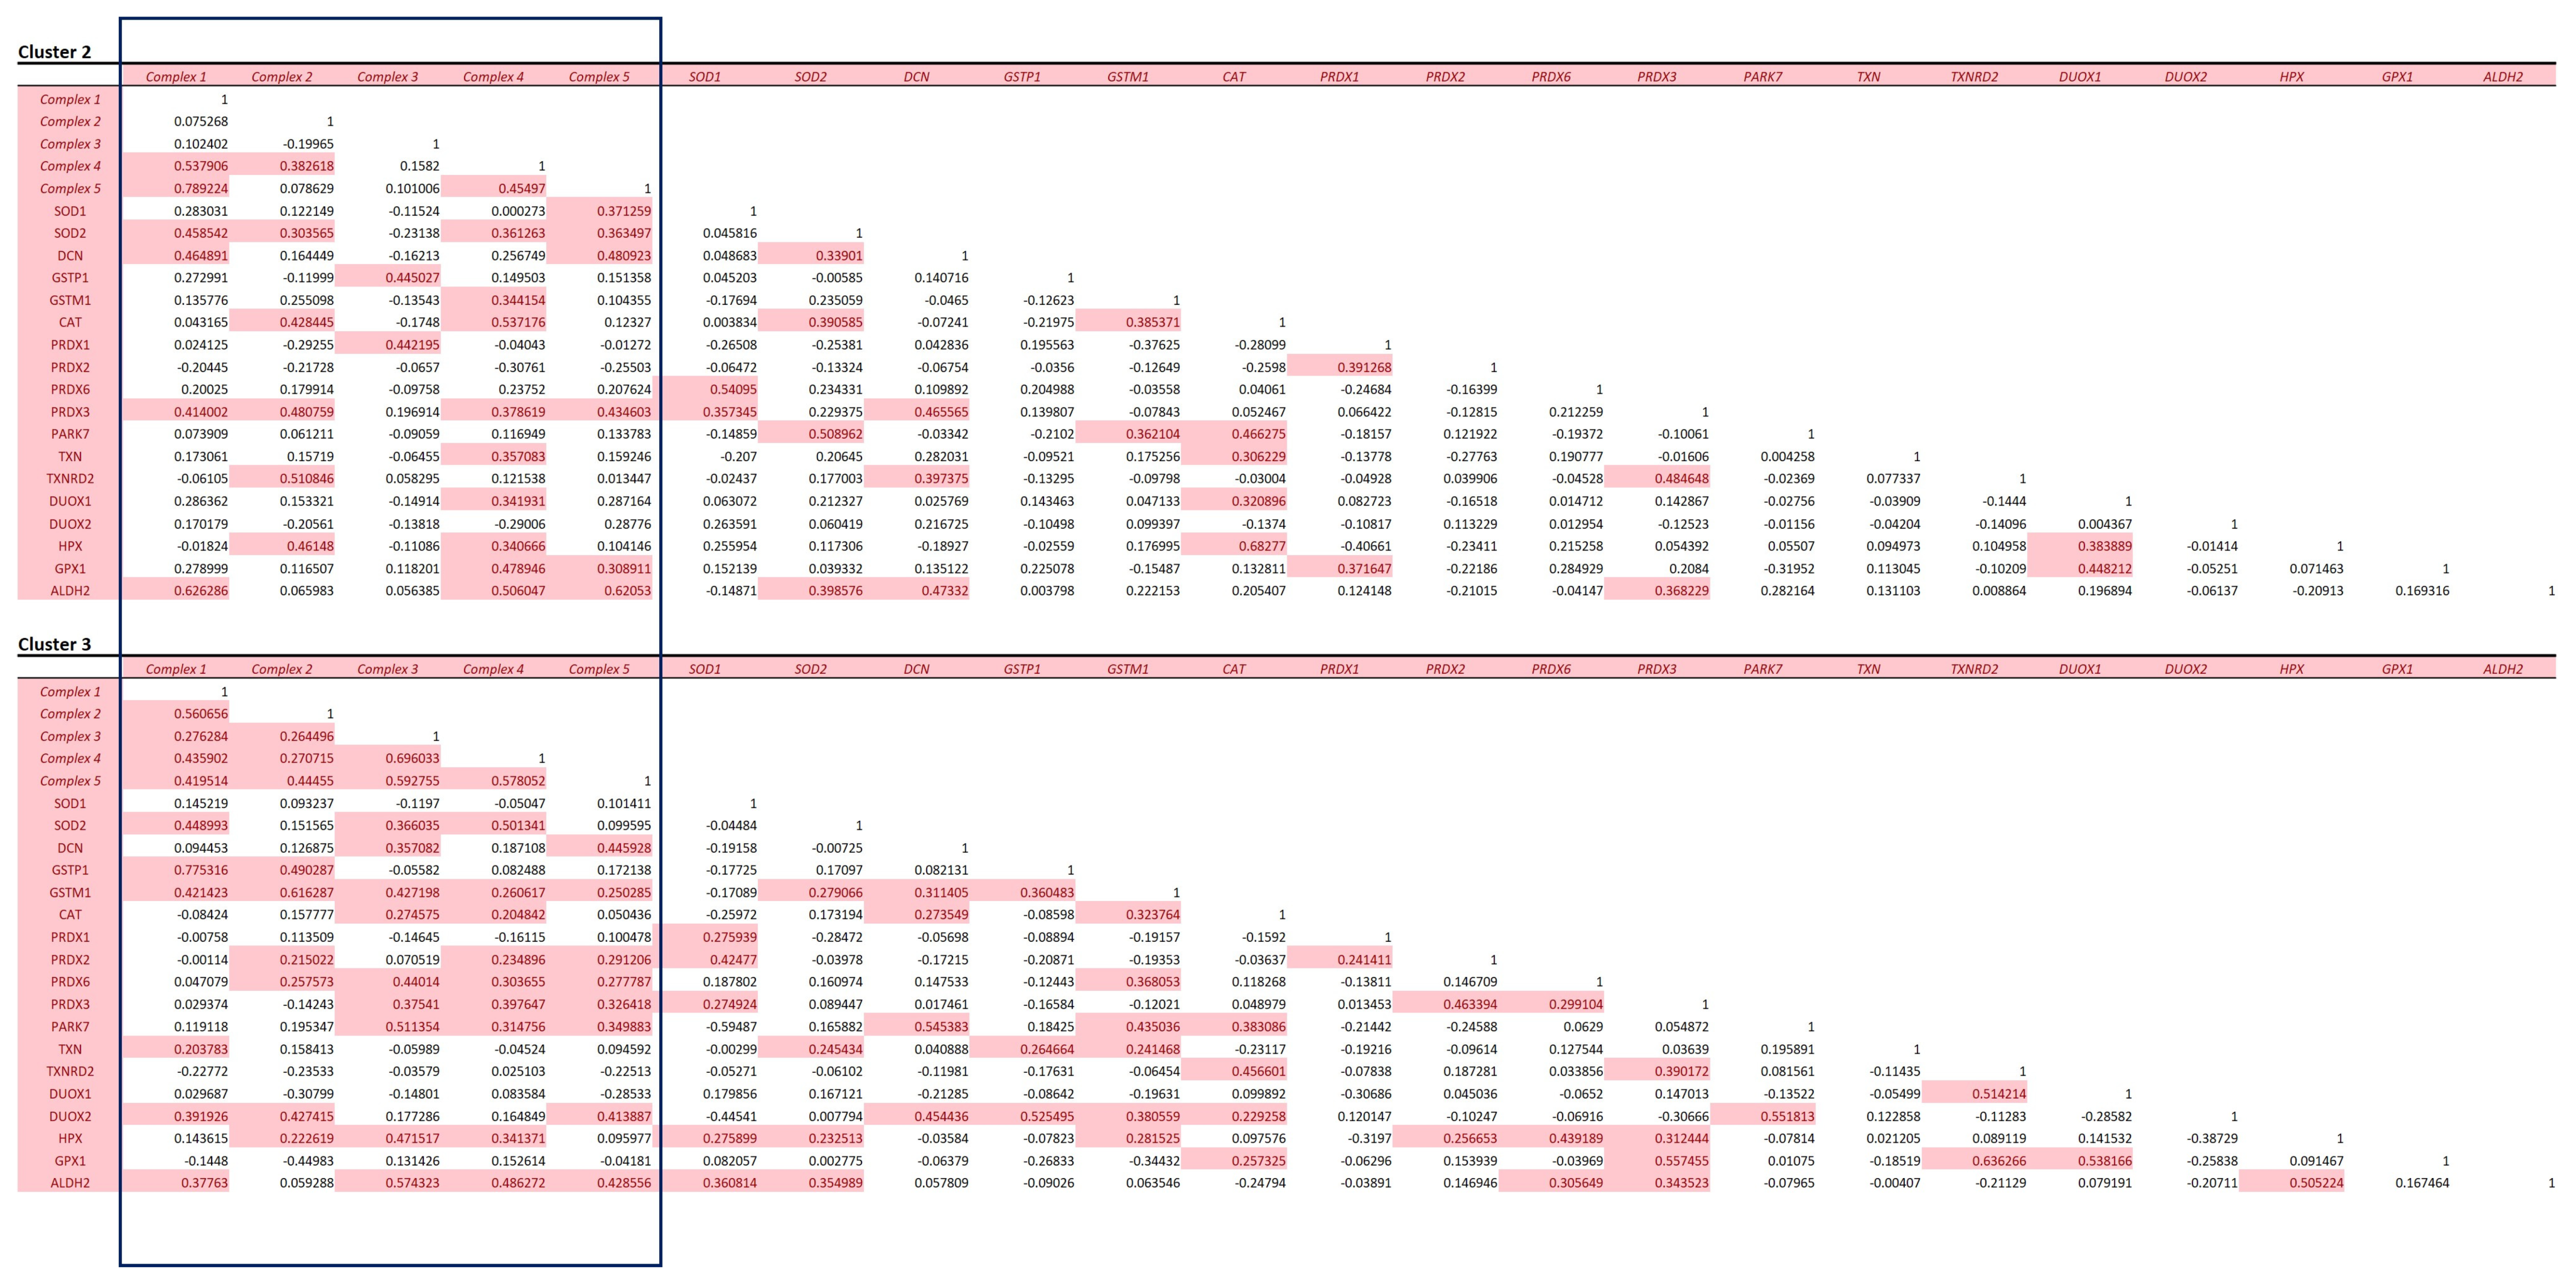
3.4. Mitochondrial Protein Analysis
3.5. Distribution of Disease-Associated Proteins across the Heart
4. Discussion and Conclusions
Supplementary Materials
Author Contributions
Funding
Institutional Review Board Statement
Informed Consent Statement
Data Availability Statement
Acknowledgments
Conflicts of Interest
References
- Kim, M.-S.; Pinto, S.M.; Getnet, D.; Nirujogi, R.S.; Manda, S.S.; Chaerkady, R.; Madugundu, A.K.; Kelkar, D.S.; Isserlin, R.; Jain, S.; et al. A draft map of the human proteome. Nature 2014, 509, 575–581. [Google Scholar] [CrossRef] [PubMed]
- Mayr, M.; Zhang, J.; Greene, A.S.; Gutterman, D.; Perloff, J.; Ping, P. Proteomics-based development of biomarkers in cardiovascular disease: Mechanistic, clinical, and therapeutic insights. Mol. Cell. Proteom. (MCP) 2006, 5, 1853–1864. [Google Scholar] [CrossRef] [PubMed]
- Bozek, K.; Wei, Y.; Yan, Z.; Liu, X.; Xiong, J.; Sugimoto, M.; Tomita, M.; Pääbo, S.; Sherwood, C.C.; Hof, P.R.; et al. Organization and Evolution of Brain Lipidome Revealed by Large-Scale Analysis of Human, Chimpanzee, Macaque, and Mouse Tissues. Neuron 2015, 85, 695–702. [Google Scholar] [CrossRef] [PubMed]
- Osetrova, M.; Tkachev, A.; Mair, W.; Larraz, P.G.; Efimova, O.; Kurochkin, I.; Stekolshchikova, E.; Anikanov, N.; Foo, J.C.; Cazenave-Gassiot, A.; et al. Lipidome atlas of the adult human brain. Nat. Commun. 2024, 15, 4455. [Google Scholar] [CrossRef]
- Jaeger, C.; Glaab, E.; Michelucci, A.; Binz, T.M.; Koeglsberger, S.; Garcia, P.; Trezzi, J.-P.; Ghelfi, J.; Balling, R.; Buttini, M. The mouse brain metabolome: Region-specific signatures and response to excitotoxic neuronal injury. Am. J. Pathol. 2015, 185, 1699–1712. [Google Scholar] [CrossRef] [PubMed]
- Angel, P.M.; Baldwin, H.S.; Sen, D.G.; Su, Y.R.; Mayer, J.E.; Bichell, D.; Drake, R.R. Advances in MALDI imaging mass spectrometry of proteins in cardiac tissue, including the heart valve. Biochim. Biophys. Acta 2017, 1865, 927–935. [Google Scholar] [CrossRef] [PubMed]
- Gessel, M.; Spraggins, J.M.; Voziyan, P.; Hudson, B.G.; Caprioli, R.M. Decellularization of intact tissue enables MALDI imaging mass spectrometry analysis of the extracellular matrix. J. Mass Spectrom. 2015, 50, 1288–1293. [Google Scholar] [CrossRef] [PubMed]
- Friehs, I.; Cowan, D.B.; Choi, Y.-H.; Black, K.M.; Barnett, R.; Bhasin, M.K.; Daly, C.; Dillon, S.J.; Libermann, T.A.; McGowan, F.X.; et al. Pressure-overload hypertrophy of the developing heart reveals activation of divergent gene and protein pathways in the left and right ventricular myocardium. Am. J. Physiol. Heart Circ. Physiol. 2013, 304, H697–H708. [Google Scholar] [CrossRef]
- Comunian, C.; Rusconi, F.; De Palma, A.; Brunetti, P.; Catalucci, D.; Mauri, P.L. A comparative MudPIT analysis identifies different expression profiles in heart compartments. Proteomics 2011, 11, 2320–2328. [Google Scholar] [CrossRef]
- Bond, A.; Iacobazzi, D.; Abdul-Ghani, S.; Ghorbel, M.; Heesom, K.; George, S.; Caputo, M.; Suleiman, M.-S.; Tulloh, R. The cardiac proteome in patients with congenital ventricular septal defect: A comparative study between right atria and right ventricles. J. Proteom. 2019, 191, 107–113. [Google Scholar] [CrossRef]
- Barbarics, B.; Eildermann, K.; Kaderali, L.; Cyganek, L.; Plessmann, U.; Bodemeyer, J.; Paul, T.; Ströbel, P.; Urlaub, H.; Tirilomis, T.; et al. Proteomic mapping of atrial and ventricular heart tissue in patients with aortic valve stenosis. Sci. Rep. 2021, 11, 24389. [Google Scholar] [CrossRef] [PubMed]
- Doll, S.; Dreßen, M.; Geyer, P.E.; Itzhak, D.N.; Braun, C.; Doppler, S.A.; Meier, F.; Deutsch, M.-A.; Lahm, H.; Lange, R.; et al. Region and cell-type resolved quantitative proteomic map of the human heart. Nat. Commun. 2017, 8, 1469. [Google Scholar] [CrossRef] [PubMed]
- Coats, C.J.; Heywood, W.E.; Virasami, A.; Ashrafi, N.; Syrris, P.; Dos Remedios, C.; Treibel, T.A.; Moon, J.C.; Lopes, L.R.; McGregor, C.G.A.; et al. Proteomic Analysis of the Myocardium in Hypertrophic Obstructive Cardiomyopathy. Circ. Genom. Precis. Med. 2018, 11, e001974. [Google Scholar] [CrossRef] [PubMed]
- Distler, U.; Kuharev, J.; Navarro, P.; Levin, Y.; Schild, H.; Tenzer, S. Drift time-specific collision energies enable deep-coverage data-independent acquisition proteomics. Nat. Methods 2014, 11, 167–170. [Google Scholar] [CrossRef] [PubMed]
- Bliss, E.; Heywood, W.E.; Benatti, M.; Sebire, N.J.; Mills, K. An optimised method for the proteomic profiling of full thickness human skin. Biol. Proced. Online 2016, 18, 15. [Google Scholar] [CrossRef] [PubMed]
- Perez-Riverol, Y.; Csordas, A.; Bai, J.; Bernal-Llinares, M.; Hewapathirana, S.; Kundu, D.J.; Inuganti, A.; Griss, J.; Mayer, G.; Eisenacher, M.; et al. The PRIDE database and related tools and resources in 2019: Improving support for quantification data. Nucleic Acids Res. 2019, 47, D442–D450. [Google Scholar] [CrossRef] [PubMed]
- Babicki, S.; Arndt, D.; Marcu, A.; Liang, Y.; Grant, J.R.; Maciejewski, A.; Wishart, D.S. Heatmapper: Web-enabled heat mapping for all. Nucleic Acids Res. 2016, 44, W147–W153. [Google Scholar] [CrossRef] [PubMed]
- Agger, P.; Ilkjær, C.; Laustsen, C.; Smerup, M.; Frandsen, J.R.; Ringgaard, S.; Pedersen, M.; Partridge, J.B.; Anderson, R.H.; Hjortdal, V. Changes in overall ventricular myocardial architecture in the setting of a porcine animal model of right ventricular dilation. J. Cardiovasc. Magn. Reson. 2017, 19, 93. [Google Scholar] [CrossRef] [PubMed]
- Agger, P.; Lakshminrusimha, S.; Laustsen, C.; Gugino, S.; Frandsen, J.R.; Smerup, M.; Anderson, R.H.; Hjortdal, V.; Steinhorn, R.H. The myocardial architecture changes in persistent pulmonary hypertension of the newborn in an ovine animal model. Pediatr. Res. 2016, 79, 565–574. [Google Scholar] [CrossRef]
- Agger, P.; Gleesborg, D.M.; Ramsing, M.; Hjortdal, V. The human fetal right ventricular myocardium appears without a sub-epicardial base-apex oriented layer of myocytes. Pediatr. Res. 2017, 81, 396–397. [Google Scholar] [CrossRef]
- Koenig, A.L.; Shchukina, I.; Amrute, J.; Andhey, P.S.; Zaitsev, K.; Lai, L.; Bajpai, G.; Bredemeyer, A.; Smith, G.; Jones, C.; et al. Single-cell transcriptomics reveals cell-type-specific diversification in human heart failure. Nat. Cardiovasc. Res. 2022, 1, 263–280. [Google Scholar] [CrossRef] [PubMed]
- Yan, G.; Qin, Q.; Yi, B.; Chuprun, K.; Sun, H.; Huang, S.; Sun, J. Protein-L-isoaspartate (D-aspartate) O-methyltransferase protects cardiomyocytes against hypoxia induced apoptosis through inhibiting proapoptotic kinase Mst1. Int. J. Cardiol. 2013, 168, 3291–3299. [Google Scholar] [CrossRef] [PubMed]
- Smith, E.F. Hydin seek: Finding a function in ciliary motility. J. Cell Biol. 2007, 176, 403–404. [Google Scholar] [CrossRef] [PubMed]
- Klena, N.T.; Gibbs, B.C.; Lo, C.W. Cilia and Ciliopathies in Congenital Heart Disease. Cold Spring Harb. Perspect. Biol. 2017, 9, a028266. [Google Scholar] [CrossRef] [PubMed]
- Liu, Y.; Cao, Y.; Li, Y.; Lei, D.; Li, L.; Hou, Z.L.; Han, S.; Meng, M.; Shi, J.; Zhang, Y.; et al. Novel Genetic Variants of Sporadic Atrial Septal Defect (ASD) in a Chinese Population Identified by Whole-Exome Sequencing (WES). Med. Sci. Monit. 2018, 24, 1340–1358. [Google Scholar] [CrossRef] [PubMed]
- Zhou, P.; Pu, W.T. Recounting Cardiac Cellular Composition. Circ. Res. 2016, 118, 368–370. [Google Scholar] [CrossRef] [PubMed]
- Chu, M.; Gregorio, C.C.; Pappas, C.T. Nebulin, a multi-functional giant. J. Exp. Biol. 2016, 219, 146–152. [Google Scholar] [CrossRef] [PubMed]
- Kurabayashi, M.; Komuro, I.; Tsuchimochi, H.; Takaku, F.; Yazaki, Y. Molecular cloning and characterization of human atrial and ventricular myosin alkali light chain cDNA clones. J. Biol. Chem. 1988, 263, 13930–13936. [Google Scholar] [CrossRef] [PubMed]
- Leinwand, L.A.; Saez, L.; McNally, E.; Nadal-Ginard, B. Isolation and characterization of human myosin heavy chain genes. Proc. Natl. Acad. Sci. USA 1983, 80, 3716–3720. [Google Scholar] [CrossRef]
- Schiaffino, S.; Reggiani, C. Molecular diversity of myofibrillar proteins: Gene regulation and functional significance. Physiol. Rev. 1996, 76, 371–423. [Google Scholar] [CrossRef]
- Cohen-Haguenauer, O.; Barton, P.J.R.; Van Cong, N.; Cohen, A.; Masset, M.; Buckingham, M.; Frézal, J. Chromosomal assignment of two myosin alkali light-chain genes encoding the ventricular/slow skeletal muscle isoform and the atrial/fetal muscle isoform (MYL3, MYL4). Hum. Genet. 1989, 81, 278–282. [Google Scholar] [CrossRef] [PubMed]
- Woolner, S.; Bement, W.M. Unconventional myosins acting unconventionally. Trends Cell Biol. 2009, 19, 245–252. [Google Scholar] [CrossRef] [PubMed]
- Lopez-Fabuel, I.; Le Douce, J.; Logan, A.; James, A.M.; Bonvento, G.; Murphy, M.P.; Almeida, A.; Bolaños, J.P. Complex I assembly into supercomplexes determines differential mitochondrial ROS production in neurons and astrocytes. Proc. Natl. Acad. Sci. USA 2016, 113, 13063–13068. [Google Scholar] [CrossRef] [PubMed]
- Yamada, T.; Takakura, H.; Jue, T.; Hashimoto, T.; Ishizawa, R.; Furuichi, Y.; Kato, Y.; Iwanaka, N.; Masuda, K. Myoglobin and the regulation of mitochondrial respiratory chain complex IV. J. Physiol. 2016, 594, 483–495. [Google Scholar] [CrossRef] [PubMed]
- Chen, Y.-R.; Zweier, J.L. Cardiac Mitochondria and Reactive Oxygen Species Generation. Circ. Res. 2014, 114, 524–537. [Google Scholar] [CrossRef] [PubMed]
- Raza, H. Dual localization of glutathione S-transferase in the cytosol and mitochondria: Implications in oxidative stress, toxicity and disease. FEBS J. 2011, 278, 4243–4251. [Google Scholar] [CrossRef] [PubMed]
- Kurian, G.A.; Rajagopal, R.; Vedantham, S.; Rajesh, M. The Role of Oxidative Stress in Myocardial Ischemia and Reperfusion Injury and Remodeling: Revisited. Oxid. Med. Cell. Longev. 2016, 2016, 1656450. [Google Scholar] [CrossRef] [PubMed]
- Roberts, B.J.; Svoboda, R.A.; Overmiller, A.M.; Lewis, J.D.; Kowalczyk, A.P.; Mahoney, M.G.; Johnson, K.R.; Wahl, J.K. Palmitoylation of Desmoglein 2 Is a Regulator of Assembly Dynamics and Protein Turnover. J. Biol. Chem. 2016, 291, 24857–24865. [Google Scholar] [CrossRef] [PubMed]
- Syrris, P.; Ward, D.; Asimaki, A.; Evans, A.; Sen-Chowdhry, S.; Hughes, S.E.; McKenna, W.J. Desmoglein-2 mutations in arrhythmogenic right ventricular cardiomyopathy: A genotype-phenotype characterization of familial disease. Eur. Heart J. 2007, 28, 581–588. [Google Scholar] [CrossRef]
- Arad, M.; Penas-Lado, M.; Monserrat, L.; Maron, B.J.; Sherrid, M.; Ho, C.Y.; Barr, S.; Karim, A.; Olson, T.M.; Kamisago, M.; et al. Gene Mutations in Apical Hypertrophic Cardiomyopathy. Circulation 2005, 112, 2805–2811. [Google Scholar] [CrossRef]
- Erdmann, J.; Raible, J.; Maki-Abadi, J.; Hammann, J.; Wollnik, B.; Frantz, E.; Fleck, E.; Regitz-Zagrosek, V.; Hummel, M.; Hetzer, R. Spectrum of clinical phenotypes and gene variants in cardiac myosin-binding protein C mutation carriers with hypertrophic cardiomyopathy. J. Am. Coll. Cardiol. 2001, 38, 322–330. [Google Scholar] [CrossRef] [PubMed]
- Litviňuková, M.; Talavera-López, C.; Maatz, H.; Reichart, D.; Worth, C.L.; Lindberg, E.L.; Kanda, M.; Polanski, K.; Heinig, M.; Lee, M.; et al. Cells of the adult human heart. Nature 2020, 588, 466–472. [Google Scholar] [CrossRef] [PubMed]
- Wang, D.; Eraslan, B.; Wieland, T.; Hallström, B.; Hopf, T.; Zolg, D.P.; Zecha, J.; Asplund, A.; Li, L.; Meng, C.; et al. A deep proteome and transcriptome abundance atlas of 29 healthy human tissues. Mol. Syst. Biol. 2019, 15, e8503. [Google Scholar] [CrossRef] [PubMed]
- Kreimer, S.; Binek, A.; Chazarin, B.; Cho, J.H.; Haghani, A.; Hutton, A.; Marbán, E.; Mastali, M.; Meyer, J.G.; Mesquita, T.; et al. High-Throughput Single-Cell Proteomic Analysis of Organ-Derived Heterogeneous Cell Populations by Nanoflow Dual-Trap Single-Column Liquid Chromatography. Anal. Chem. 2023, 95, 9145–9150. [Google Scholar] [CrossRef] [PubMed]


Disclaimer/Publisher’s Note: The statements, opinions and data contained in all publications are solely those of the individual author(s) and contributor(s) and not of MDPI and/or the editor(s). MDPI and/or the editor(s) disclaim responsibility for any injury to people or property resulting from any ideas, methods, instructions or products referred to in the content. |
© 2024 by the authors. Licensee MDPI, Basel, Switzerland. This article is an open access article distributed under the terms and conditions of the Creative Commons Attribution (CC BY) license (https://creativecommons.org/licenses/by/4.0/).
Share and Cite
Heywood, W.E.; Searle, J.; Collis, R.; Doykov, I.; Ashworth, M.; Sebire, N.; Bamber, A.; Gautel, M.; Eaton, S.; Coats, C.J.; et al. A Proof of Principle 2D Spatial Proteome Mapping Analysis Reveals Distinct Regional Differences in the Cardiac Proteome. Life 2024, 14, 970. https://doi.org/10.3390/life14080970
Heywood WE, Searle J, Collis R, Doykov I, Ashworth M, Sebire N, Bamber A, Gautel M, Eaton S, Coats CJ, et al. A Proof of Principle 2D Spatial Proteome Mapping Analysis Reveals Distinct Regional Differences in the Cardiac Proteome. Life. 2024; 14(8):970. https://doi.org/10.3390/life14080970
Chicago/Turabian StyleHeywood, Wendy E., Jon Searle, Richard Collis, Ivan Doykov, Michael Ashworth, Neil Sebire, Andrew Bamber, Mathias Gautel, Simon Eaton, Caroline J. Coats, and et al. 2024. "A Proof of Principle 2D Spatial Proteome Mapping Analysis Reveals Distinct Regional Differences in the Cardiac Proteome" Life 14, no. 8: 970. https://doi.org/10.3390/life14080970