Abstract
This study aims to design improved inhibitors targeting the thymidylate kinase (TMK) of Mycobacterium tuberculosis (Mtb), the causative agent of infectious disease tuberculosis that is associated with high morbidity and mortality in developing countries. TMK is an essential enzyme for the synthesis of bacterial DNA. We have performed computer-aided molecular design of MtbTMK inhibitors by modification of the reference crystal structures of the lead micromolar inhibitor TKI1 1-(1-((4-(3-Chlorophenoxy)quinolin-2-yl)methyl)piperidin-4-yl)-5-methylpyrimidine-2,4(1H,3H)-dione bound to TMK of Mtb strain H37Rv (PDB entries: 5NRN and 5NR7) using the computational approach MM-PBSA. A QSAR model was prepared for a training set of 31 MtbTMK inhibitors with published inhibitory potencies () and showed a significant correlation between the calculated relative Gibbs free energies of the MtbTMK–TKIx complex formation and the observed potencies. This model was able to explain approximately 95% of the variation in the in vitro inhibition data and validated our molecular model of MtbTMK inhibition for the subsequent design of new TKI analogs. Furthermore, we have confirmed the predictive capacity of this complexation QSAR model by generating a 3D QSAR PH4 pharmacophore-based model. A satisfactory correlation was also obtained for the validation PH4 model of MtbTMK inhibition (R2 = 0.84). We have extended the hydrophobic m-chloro-phenoxyquinolin-2-yl group of TKI1 that can occupy the entry into the thymidine binding cleft of MtbTMK by alternative larger hydrophobic groups. Analysis of residue interactions at the enzyme binding site made it possible to select suitable building blocks to be used in the preparation of a virtual combinatorial library of 28,900 analogs of TKI1. Structural information derived from the complexation model and the PH4 pharmacophore guided the in silico screening of the library of analogs and led to the identification of new potential MtbTMK inhibitors that were predicted to be effective in the low nanomolar concentration range. The QSAR complexation model predicted an inhibitory concentration of 9.5 nM for the best new virtual inhibitor candidate TKI 13_1, which represents a significant improvement in estimated inhibitory potency compared to TKI1. Finally, the stability of the MtbTMK–inhibitor complexes and the flexibility of the active conformation of the inhibitors were assessed by molecular dynamics for five top-ranking analogs. This computational study resulted in the discovery of new MtbTMK inhibitors with predicted enhanced inhibitory potencies, which also showed favorable predicted pharmacokinetic profiles.
1. Introduction
Tuberculosis is a highly contagious airborne disease and one of the top causes of death worldwide [1]. In 2024, the World Health Organization estimated that 10.8 million people developed tuberculosis worldwide, including 2.55 million in the African region countries [2]. The disease affects people of all ages and is prevalent in many developing countries. The tuberculosis incidence rate of 134 new cases per 100,000 population per year in 2024 has increased from 129 cases in the year 2020 [2]. In the Ivory Coast, the incidence of tuberculosis is 103 cases per 100,000 inhabitants, including all forms of the disease. In 2015, a total of 23,000 cases of tuberculosis were detected, of which 24% were formed by co-infections of tuberculosis and HIV. Despite the efforts to treat tuberculosis made by the Ivorian government, the incidence of the disease continues to grow [3]. Therefore, tuberculosis represents the leading opportunistic infection and cause of death among people infected with HIV living in the Ivory Coast. Multidrug-resistant tuberculosis remains a threat to the public health in the country and beyond the borders of Ivory Coast. Only one-third of individuals with drug-resistant tuberculosis received appropriate treatment in 2021 [4].
Tuberculosis is caused by Mycobacterium tuberculosis (Mtb), a bacterium that belongs to the genus Mycobacterium, the family Mycobacteriaceae, and the order Actinomycetales. Mycobacteria are strict or microaerophilic aerobic bacilli that are nonmotile and nonsporulating. They are characterized by a unique cell wall structure that confers specific staining properties and acid-alcohol resistance. Under optical microscopy, Mtb appears as a slender, slightly curved rod measuring 2 to 5 μm in length and 0.2 to 0.3 μm in width. It can be distinguished from other bacterial species by its specific culture requirements and slow growth rate [5]. The available antituberculotic agents face drug resistance from Mycobacterium tuberculosis, which can develop mechanisms to evade the antibacterial effect. The intrinsic resistance of Mtb to antibiotics is caused by a less permeable cell wall rich in lipids and the activity of efflux pumps that transport extrinsic substances out of the cell [6]. Multidrug-resistant tuberculosis (MDR-TB) refers to Mtb strains resistant to isoniazid and rifampicin, while extensively drug-resistant tuberculosis (XDR-TB) is also resistant to at least one of injectable antibiotics, such as capreomycin, kanamycin, or amikacin [7]. Treatment of drug-resistant forms of tuberculosis requires the development of new therapeutic alternatives. New antituberculotic agents should act on both active and dormant Mtb to prevent relapse of the disease during resuscitation of the bacteria to the growth phase [8]. Therefore, the identification of new potential pharmacological targets within the pathogen and the design of new bioactive compounds that act on these novel targets is urgently needed [1,9]. Among such targeted enzymes are those involved in vital processes, such as NAD supply and ATP phosphorylation. Drugs acting via novel mechanisms of action are preferred, as they are less amenable to drug cross-resistance with existing antituberculotics. Recently, the synthesis and testing of a new series of non-nucleoside inhibitors of MtbTMK were reported [10,11,12]. The MtbTMK is an essential enzyme involved in the biochemical pathway of deoxythymidine triphosphate synthesis. It catalyzes the conversion of deoxythymidine monophosphate to deoxythymidine diphosphate using ATP as a high-energy phosphate donor. The micromolar non-nucleoside thymidine analog 1 identified earlier [12] was further modified into three novel chemical series [10,12]. The first was represented by the phenoxylbenzyl analog 2, the second truncated series was represented by the quinolin-2-yl analog 35, and the third phenoxylquinolin-2-yl series was represented by derivative 43 (further denoted as TKI1) (Figure 1) with potent inhibitory activity toward MtbTMK and an improved antibacterial MIC [10].
The availability of the crystal structure of MtbTMK bound to deoxythymidine monophosphate (dTMP) [11] opened the possibility of designing new antituberculotic agents [13] based on theoretical approaches, such as molecular modelling and structure-based drug design, which can lead to the prediction of the binding mode and improve the binding affinity of new ligands to MtbTMK. These computational approaches provide a means to describe intermolecular interactions and predict the inhibitory potency of new compounds based on calculated thermodynamic quantities, such as the free energy of drug–receptor complex formations [14]. The crystal structure of the MtbTMK–TKI1 complex [11] showed that the entry into the thymidine binding cleft is relatively large and of a complex shape (Figure 1C–E). An extension of the m-chloro-phenoxy group and the quinolin-2-yl group of TKI1 by proper substituents filling parts of the entry could enhance the binding affinity as well as specificity of new TKI analogs towards the MtbTMK.


Figure 1.
(A) Schematic drawing of compound 43 (TKI1) [10] at the MtbTMK binding site showing residues in direct contact with the inhibitor [10,12]. (B) Three-dimensional structure of the MtbTMK binding site with bound ligand compound 43 ( 0.95 μM, μM, PDB crystal structure 5NR7 [11]). The ligand and side chains of the interacting residues are represented as sticks. Carbon atoms are yellow (ligand) and green (enzyme), respectively. (C) Solid molecular surface of MtbTMK modelled in Insight-II [15] shows the relatively large size of the entry into the thymidine binding cleft, which is partially filled by the m-chloro-phenoxyquinolin-2-yl group of the inhibitor 43. (D) Another view of the binding cleft in the quinoline group direction. (E) The molecular surface (blue mesh) defines the volume occupied by the inhibitor 43.


In this work, we have performed computer-aided molecular design of new MtbTMK inhibitors by in situ modification of the reference inhibitor 43 TKI1 [10] 5-methyl-1-[1-[(6-phenoxypyridin-2-yl)methyl]piperidin-4-yl]pyrimidine-2,4-dione bound to the MtbTMK of strain H37Rv (PDB entries: 5NRN and 5NR7 [10,11]) using the MM-PBSA approach [16]. We have explored the replacement of the m-chloro-phenoxyquinolin-2-yl group of inhibitor 43 studied by Song et al. [10], which fills the entry into the thymidine binding cleft of MtbTMK lined with hydrophobic residues, using alternative larger hydrophobic groups. Our goal was to identify new non-nucleoside thymidine derivatives originating from compound 43 that display improved affinity and specificity of binding to a new protein target MtbTMK with decreased cross-resistance with existing antituberculotics and show favorable ADME-related properties, especially elevated hydrophobicity, which improves permeation across the bacterial cell wall of Mtb. The presented new inhibitors could be developed as drugs candidates with antibacterial activity toward Mtb and could eventually lead to the creation of new antituberculotic medication.
2. Materials and Methods
Scheme 1 presents the TKI discovery workflow outlining sequential steps of combinatorial ligand design and the in silico approach for generating new TKI analogs with enhanced affinity for MtbTMK.
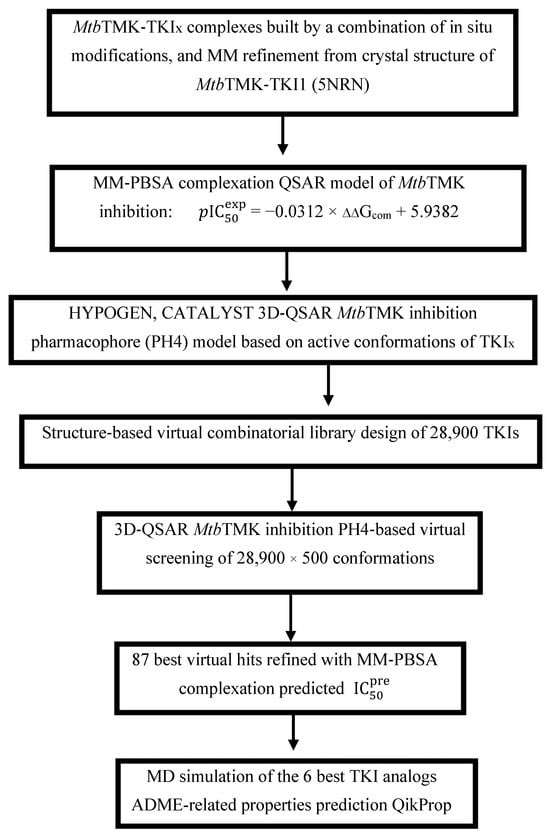
Scheme 1.
Workflow describing the sequence of steps taken to design new TKI analogs deriving from TKI1 [10] with higher predicted potencies towards MtbTMK.
2.1. Training and Validation Sets
The chemical structures and observed inhibitory potencies () of the training and validation sets of TKIs used in this study (Table 1) were taken from the literature [10,12]. The inhibitory potencies of these compounds span a wide range of half-maximal inhibitory concentrations (0.95 μM ≤ ≤ 2000 μM) which allows the construction of the QSAR model. The TS contains 31 TKIs and the VS contains 6 TKIs.

Table 1.
Training set and validation set of MtbTMK inhibitors (TKI) used for the preparation of QSAR models of the enzyme inhibition. The experimental activities were taken from references [10,12].
2.2. Model Building
The molecular models of the enzyme–inhibitor complexes MtbTMK–TKIx, the apo-enzyme thymidylate kinase (E), and the unbound inhibitors (I) were generated based on the high-resolution crystal structure of the reference complex MtbTMK–TKI1 obtained from the Protein Data Bank (PDB entry code 5NRN) at a resolution of 2.2 Å [10]. For this purpose, the Insight-II molecular modelling program [15] was used to build MtbTMK–TKIx complexes for the inhibitors included in the training and validation sets by in situ structural modifications of TKI1.
To generate the TKI inhibitors included in TS and VS, the derivatized groups of the TKI1 moiety were replaced by appropriate substituents. A comprehensive conformational search was conducted for all rotatable bonds in the substituted functional group. This was followed by a gradual energy optimization of the modified inhibitor and the active site of MtbTMK, which involved residues located within a 5 Å distance from the inhibitor. The goal of this process was to identify low-energy bound conformations of the modified inhibitors. The resulting structures of the enzyme–inhibitor complexes were further refined through protein-wide energy minimization. This methodology has previously been successfully used in the construction of models for viral, bacterial, and protozoal protease inhibitor complexes. It has also been used in the design of inhibitors based on peptidomimetic, hydroxyl naphthoic, and thymidine scaffolds [17,18,19].
The structures of the enzyme (E) and the enzyme–inhibitor complexes (E-Is) were considered at a physiologically relevant pH of 7. Neutral N- and C-terminal residues were capped, and all protonated and ionized residues were assigned appropriate formal and atomic charges. The crystallographic water molecules present in the reference complex MtbTMK–TKI1 were excluded from the molecular models.
2.3. Molecular Mechanics
The inhibitors, thymidylate kinase of Mtb, and E-I complexes were modelled using molecular mechanics (MM) based on the previously described methodology [20,21,22]. Molecular mechanics was used to simulate the interactions between molecules. The systems were represented using a second-generation consistent force-field (CFF) [23,24], incorporating parameters, such as atomic charges and interatomic equilibrium distances. A CFF is a force field that accurately reproduces quantum mechanical energy surfaces, covers relatively large number of differing functional groups, is applicable in various phases and molecular environments, and is suitable for describing the interaction of protein active sites with different ligands or with solvents [23,24]. Therefore, the CFF approach is suitable for a study concerning a library of 9000 analogs.
Geometry optimization calculations were carried out to minimize the potential energy, employing methods, such as steepest descent and conjugate gradient. The dielectric constant was adjusted to reflect the protein environment, ensuring a realistic representation of molecular interactions.
2.4. Conformational Search
The free inhibitor conformations were derived from their bound configurations in the E-I complexes by gradual relaxation to the nearest local energy minimum as previously described [20,25,26,27]. The conformational search method involves systematically exploring the potential energy landscape of a molecular system to identify its stable conformations. This is achieved by varying dihedral and bond angles and bond lengths while employing energy minimization techniques to assess the stability of each conformation [20,25]. Various algorithms, such as Monte Carlo or simulated annealing, may be used to enhance sampling efficiency. The search parameters, including temperature, step size, and energy thresholds, are crucial for ensuring thorough exploration and convergence to low-energy conformations.
2.5. Solvation Gibbs Free Energies
The electrostatic component of Gibbs free energy (GFE) [28], which includes the effects of ionic strength by solving the nonlinear Poisson–Boltzmann equation [29,30], was computed by the DelPhi module in Discovery Studio [31] as previously described [16,29,30,32,33,34]. The Gibbs free energy of the solvation method quantifies the stability of molecules in solution by considering solute–solvent interactions. It relies on thermodynamic calculations and force field models to estimate enthalpic and entropic contributions, taking into account key parameters, such as the dielectric constant and temperature. The resulting free energies of solvation allow for the prediction of the solubility and biological activity of compounds in aqueous environments.
2.6. Entropic Contribution
The entropic contribution to the binding affinity of the enzyme–inhibitor complex was calculated by the normal mode analysis of the vibrational energy of the inhibitor at the active site of the ‘frozen’ enzyme and in the free state, as previously described [33].
The calculation of the entropic contribution involves assessing the configurational entropy of a molecular system, which reflects the number of accessible microstates. This is typically performed using statistical mechanics principles, such as the Boltzmann equation, to relate entropy to the probabilities of different configurations. Parameters, such as temperature, volume, and the nature of the molecular interactions, are essential for accurate calculations. Additionally, computational methods, like molecular dynamics or Monte Carlo simulations, can be employed to sample conformational space and obtain a more precise estimation of the entropic contribution.
2.7. PH4 Pharmacophore Generation
The PH4 pharmacophore model, derived from the bound TKI conformations at the Thymidylate kinase active site, was employed to query libraries, as reported earlier [21,35,36,37]. The generation of the pharmacophore PH4 involves identifying the spatial and electronic features essential for the biological activity of a compound. This process begins with the collection of data on active and inactive molecules, allowing for the extraction of common functional groups and structural motifs. Using computational tools, these features are arranged in three dimensions to create a pharmacophore model that reflects interactions with the target site. Key parameters, such as the types of interactions (hydrogen bonds, hydrophobicity) and their spatial orientations, are crucial for ensuring the accuracy and predictive power of the model in virtual screening applications.
2.8. ADME-Related Properties
The ADME properties from the bound TKI conformations at the Thymidylate kinase active site were employed to query libraries, as reported earlier [25,38,39,40]. ADME-related properties refer to the absorption, distribution, metabolism, and excretion characteristics of a compound, which are critical for evaluating its pharmacokinetic profile. This assessment involves computational and experimental methods to predict how a drug behaves in the body, including its permeability across biological membranes, plasma protein binding, metabolic stability, and clearance rates. Understanding these properties helps to optimize drug design and improve the efficacy and safety of pharmaceutical candidates.
2.9. Virtual Combinatorial Library
The virtual library was generated using a previously established protocol [20,27,41,42]. The generation of virtual libraries involves creating a diverse collection of molecular structures using the library design protocol in Discovery Studio 2.5 [31]. This process allows for the systematic exploration of chemical space by generating new compounds based on predefined scaffolds and functional groups. The resulting virtual library can then be screened for potential biological activity, thereby facilitating the identification of lead compounds for further development.
2.10. Inhibitory Potency Prediction
The conformer with the best mapping on the PH4 pharmacophore in each cluster of the focused library subset was used for ∆∆Gcom calculation and estimation by the complexation QSAR model, as previously described [29]. The rGFE of formation of the E–I complex in water ∆∆Gcom was computed for each selected new analog and then used to predict the MtbTMK inhibitory potencies () of the focused virtual library of TKI analogs by inserting this parameter into the target-specific scoring function. The scoring function, which is specific for the Mtb Thymidylate kinase receptor, is as follows: = a × ∆∆Gcom+ b. It was parameterized using the QSAR model described in Section 3.1.
2.11. Molecular Dynamics
The conformational stability of the co-crystallized ligand (TKI1) and the five selected top-ranking designed TKI analogs (13_1, 13_4, 13_6, 149_5, 21_5) was examined by 200 ns-long MD simulations in NPT statistical ensemble (300 K, 1 bar) and analyzed using Desmond [43]. A periodic box with 10 Å buffer containing the MtbTMK–TKI complex was filled with approx. 12,000 TIP3P water molecules and neutralized by adding ions to reach a state of electro-neutrality. During the simulation, an OPLS3e forcefield, 1.5 fs integration step, and coulombic interaction cut-off of 14 Å were used. After initial heating and relaxation, the productive simulation trajectory was recorded and analyzed for ligand–receptor interactions every 400 ps. Further details of the MD simulations are described in ref. [44].
3. Results and Discussion
3.1. QSAR Model of Thymidylate Kinase Inhibition
The training set (TS) of 31 and the validation set (VS) of 6 MtbTMK inhibitors (TKI, Table 1) used in this study were selected from the literature [10,12]. The inhibitory potencies of these derivatives cover a sufficiently broad range of values (0.950 μM ≤ ≤ 2000 μM) to allow preparation of a QSAR model of MtbTMK inhibition. Molecular mechanics (MM) was used to calculate the enzyme–inhibitor binding affinities.
For each of the 37 TKIs (Table 1), the enzyme–inhibitor complex MtbTMK–TKIx was constructed by in situ modifications of the refined template crystal structure of the MtbTMK–TKI1 complex (PDB entry code 5NRN [10,11]), as described in the Methods section. Furthermore, the relative Gibbs free energy values of the formation of the MtbTMK–TKIx complex (∆∆Gcom) and its components were calculated for each geometry-optimized complex (Table 2). A QSAR model was prepared that correlates the computed ∆∆Gcom with the experimental in vitro inhibitory potencies of TKIs (= −), which explained 95% of the variation in the observed TKI potencies and validated our molecular model of MtbTMK inhibition for the subsequent design of new TKI analogs. The resulting linear regression equation is shown in Table 3 (Equation (2)). The relatively high values of the regression coefficient R2, leave-one-out cross-validated regression coefficient R2xv, and Fischer F-test of the correlation suggest a strong relationship between the 3D model of TKI binding and the observed inhibitory potencies. Therefore, structural information derived from the 3D models of the MtbTMK–TKIx complexes can be expected to lead to a reliable prediction of the inhibitory potencies of MtbTMK for new TKI analogs using Equation (2) (Table 3).
Table 2.
Relative complexation Gibbs free energy and its components for the training set of the MtbTMK inhibitors TKI1–TKI31 and the validation set inhibitors TKIV1–TKIV6.
Table 3.
Regression analysis of computed binding affinities ∆∆Gcom, its enthalpic component ∆∆HMM, and experimental half-maximal inhibitory concentrations = − of TKIs towards MtbTMK [10,12].
To gain a better structural understanding of the binding affinity of TKIs to MtbTMK, we also analyzed the enthalpy of complex formation in the gas phase ∆∆HMM by correlating it with the . The validity of the resulting linear correlation (for statistical data of this regression, see Table 3, Equation (1)) allowed the assessment of the contribution of enzyme–inhibitor interatomic interactions (∆∆HMM) to the ligand binding affinity when the solvent effect and loss of inhibitor entropy upon binding to the enzyme were neglected. This correlation explained about 89% of the data variation and underlined the dominant role of alterations in the chemical structure of the ligands in improving the binding site interactions of the TKIs. These statistically significant correlations confirmed the correctness of the bound conformation of TKIs modelled at the MtbTMK binding site and allowed the definition of TKI PH4 pharmacophore.
The statistical data confirmed the validity of the correlation Equations (1) and (2) shown in Figure 2. The ratio / ≈ 1 calculated for the validation set inhibitors TKIV1–TKIV6 documents the substantial predictive power of the QSAR model. The values were estimated from the calculated ∆∆Gcom using the correlation Equation (2), Table 3.
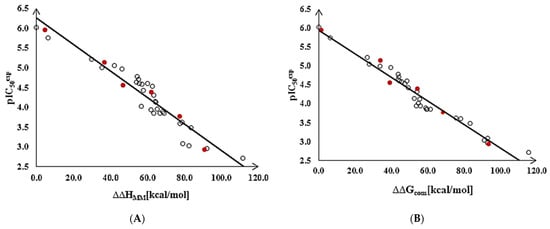
Figure 2.
(A) Graph of the correlation Equation (1) (Table 3) between [10] and the relative enthalpic contributions ∆∆HMM. (B) Graph of the correlation Equation (2) between and the relative Gibbs free energies ∆∆Gcom of the MtbTMK–TKIx complex formation. Training set—open circles; validation set—red circles.
Thus, the validated QSAR model, regression equation Equation (2), and the calculated ∆∆Gcom quantities of the MtbTMK–TKIx complexes (Table 2) can be used to predict inhibitory potencies of the new analogs of TKI towards MtbTMK, if they share the same binding mode as the TKI training set, which implies considering only the restricted modifications of the TKI scaffold.
3.2. Binding Mode of TKIs
Song et al. reported several comprehensive studies on the development of non-nucleoside inhibitors of MtbTMK [10,11,12,17]. The thymine ring of these substrate-based TKI interacts with residues of the catalytic pocket in a configuration similar to the previously described crystal structure of dTMP bound to MtbTMK and thymine-like inhibitors [10,17,18,19]. The thymine ring is stabilized by π-π stacking interaction [45,46], with Phe70 and hydrogen bonds linking the O4 and N3 of the thymine with Arg74 and Asn100, respectively [10,11,17]. The p-piperidine ring, modelled in a chair conformation, protrudes from the active site and is located in a position similar to the deoxyribose of dTMP [18], engaging in a π-alkyl interaction with the aromatic side chain of Tyr103 [45,46]. The phenoxypyridyl ring does not seem to establish any specific interaction with the enzyme except for the closure of the hydrophobic entry to the thymine pocket because of the solvent effect.
The binding mode of TKIs was adopted from the crystal structure 5NR7 [10,11], which contains the largest and most potent inhibitor TKI1 (43) [10]. Enzyme–inhibitor interactions at the active site of the MtbTMK–TKI1 complex and the 3D structure of TKI1 at the kinase binding site are shown in Figure 1. One of the main contributions to the binding of TKI1 to the enzyme involves a hydrophobic pocket formed by the residues Phe36, His53, Phe70, Ala48, Ala60, Gly124, Asn100, Gly124, Arg153, Ala154, Gln155, Leu52, Arg107, Gly152, and Ser61 [10,12]. As can be seen in Figure 1, for inhibitor TKI1, the m-chloro-phenoxyquinolin-2-yl substituent reaches the hydrophobic entry to the binding cleft and contributes significantly to stabilizing the interactions at the active site of MtbTMK. The introduction of new TKI1 analogs with a preserved binding mode to MtbTMK and variation in the structure of the hydrophobic R-group can further enhance stabilizing enzyme–inhibitor interactions, resulting in the improved potency of the designed compounds. At the same time, the more hydrophobic character of TKIs can enhance the permeation of the lipid-rich Mtb cell wall and the antibacterial effect.
The inhibitor TKI1 with the largest R-group (Table 1), which fills the hydrophobic cavity at the entry of the thymidylate binding cleft, displayed the highest inhibitory potency to MtbTMK. Therefore, we have explored the chemical space of larger hydrophobic groups by extending the m-chloro-phenoxyquinolin-2-yl group of the inhibitor 43 [10] at two other substitution sites.
3.3. D-QSAR Pharmacophore Model
The ligand interaction protocol of Discovery Studio [31] generates receptor-based pharmacophore features of the active site of a protein–ligand complex. MtbTMK predominantly exhibits hydrophobic features at the active site of a protein–ligand complex (Figure 3), as confirmed by previous studies [22,47]. The 3D-QSAR pharmacophore generation protocol, which uses the Catalyst HypoGen algorithm [15,31], was applied to construct the PH4 pharmacophore for MtbTMK inhibition [22,47].
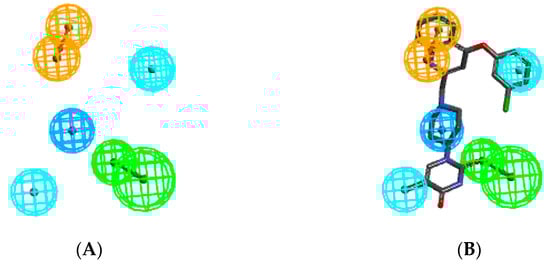
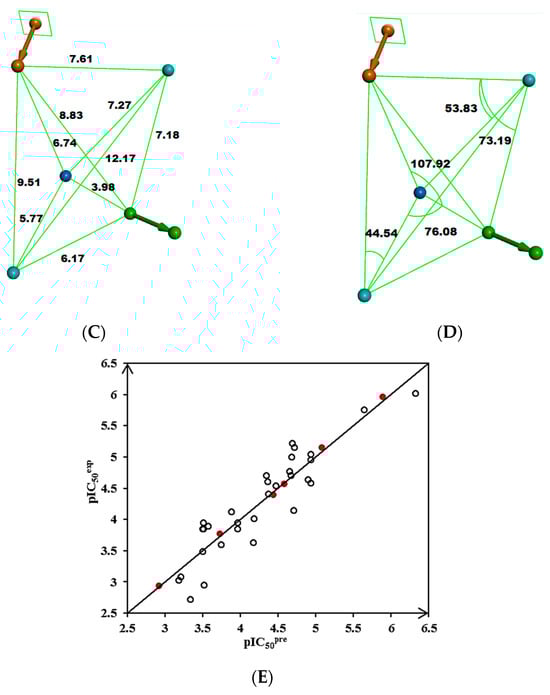
Figure 3.
(A) Pharmacophore features, their centers, and vectors; HYDA = hydrophobic aliphatic (blue), HYD = hydrophobic (cyan), Ar = ring aromatic (orange), and HBA = hydrogen bond acceptor (green). (B) Features overlayed with inhibitor TKI1 (43 [10]). (C) Distances between the centers of pharmacophoric features in [Å]. (D) Angles between the centers. The R-group of TKI1 is occupied by Ar and HYD features. (E) Correlation plot of vs. obtained for the PH4 pharmacophore model. Training set—open circles; validation set—red circles.
For each of the 10 hypotheses, a confidence level S of 98% was selected. The number of scrambled runs (Y) required to satisfy the relation S = [1 − (1 + X)/(1 + Y)] × 100%, where the number of hypotheses (X) with a total cost below that of Hypothesis 1 (Hypo1), was set at 0 (X = 0). Then, the total number of HypoGen runs (initial one + random runs) should be equal to 1 + Y = 50. The use of these values of X and Y results in the required S = 98%.
Validation of the statistical significance of each hypothesis model is carried out using Fisher’s randomization of the observed biological for the 31 training set compounds. It checks whether the PH4 model is not a result of an incidental correlation between and the properties of the TKI1–TKI31 samples (CatScramble program). From the lowest cost among the 49 hypotheses for each of the 10 PH4 (Hypo1–Hypo10) listed in Table 4 (closest random), none shows a cost lower than the 277.92 of Hypo1. Randomization confirmed that Hypo1 is not produced by chance and is a true correlation supported by a statistically robust pharmacophore model for the inhibition of MtbTMK by TKI with a confidence level of 98%. The PH4 pharmacophore model shows predictive power comparable to the QSAR complexation model using the ligand binding affinity descriptor ∆∆Gcom (R2 = 0.95, Table 3).
Table 4.
Parameters of ten generated PH4 pharmacophoric hypotheses for the MtbTMK inhibitor after passing the CatScramble validation procedure. Each hypothesis was subjected to 49 random runs at a selected confidence level of 98%.
We will use the QSAR modes for the prediction of the inhibitory potencies of new TKI ligands which explore the hydrophobic substitutions of the m-chloro-phenoxyquinolin-2-yl group (the hydrophobic feature HYD, Figure 3B).
3.4. Virtual Combinatorial Library of TKIs
Our previous research on inhibitor design demonstrated that the use of in silico screening of a virtual combinatorial library can result in the identification of promising hits [20,22,47]. In a previous study focused on the antituberculotic effect of MtbTMK inhibitors [20,22,41,48], we introduced a targeted virtual combinatorial subset. To do this, we carefully selected 40 diverse smaller polar and nonpolar, larger aliphatic, and aromatic hydrophobic building blocks for R1 of the TKI scaffold IV (Table 5). Additionally, for the R2 group, we also chose the same fragments as the R1 group that can be accommodated by the corresponding binding pocket of MtbTMK.
Table 5.
List of R1 and R2 groups used in the design of the initial diversity library of extended TKI analogs.
To further explore structural variations in TKIs, we have prepared a virtual combinatorial library of new TKI analogs by extending the hydrophobic phenoxyquinolin-2-yl group of the most potent inhibitor TKI1 by substitutions at positions R1 and R2 (TKI scaffold IV in Table 5). The TKI scaffold IV is based on the published results of Song et al. [10], who showed that compounds of this type (42, 43, and 44) displayed potent inhibitory potencies toward MtbTMK ( from 0.95 to 1.8 µM) [10]. The R-groups taken from Available Chemicals Directory [49] listed in Table 5 were attached to the R1 and R2 positions of the TKI scaffold IV and formed a combinatorial library of R1 × R2 = 170 × 170 = 28,900 TKI analogs. This virtual library was generated with the help of the enumerate library module of Discovery Studio [31].
To identify new TKIs with a strong binding affinity to the MtbTMK target, the virtual combinatorial library of 28,900 TKI analogs was subjected to in silico screening against the PH4 pharmacophore model. During the virtual screening, 1000 conformers were generated for each analog. As a result of the screening, 10,498 TKIs were found to match at least 2 pharmacophoric features of the Hypo1 hypothesis of the PH4 pharmacophore model of MtbTMK inhibition (Figure 3A,B). These matching analogs, known as PH4 hits, were then subjected to further evaluation using the complexation QSAR model. The complexation model used the relative Gibbs free energy of the formation of the MtbTMK–TKIx complex and predicted corresponding (Table 6) values using correlation Equation (2) (Table 3).
Table 6.
The calculated relative Gibbs free energies of the formation (ΔΔGcom) of the MtbTMK–TKI complex and its components were calculated for the best TKI analogs identified through the in silico screening of the virtual combinatorial library. The code names of the analogs are combined.
3.5. New Inhibitors of MtbTMK
The findings of the in silico screening of the virtual library of novel TKI analogs were further investigated by analyzing the frequency of occurrence of each individual fragment within the R-groups of the 10,498 virtual hits that matched the PH4 model. Analysis revealed that R1 substituents, which occupy the hydrophobic pocket associated with the HYD pharmacophoric feature (m-chloro-phenoxy group in TKI1), play a dominant role in increasing the potency of new TKIs.
We have predicted half-maximal inhibitory concentrations for a series of the most promising new TKI analogs by calculating the binding affinity (∆∆Gcom) to MtbTMK using the MM/PBSA approach [16] and estimated the corresponding from Equation (2) (Table 3). The results are shown in Table 6. The predicted values of the best new TKIs obtained from the QSAR model (Table 3) rest in the low nanomolear concentration range and exceed the range of experimental activity values of training and validation sets of TKI [10,12]. Therefore, we do not consider the exact but rather a strong indication that further extension of the phenoxyquinolin-2-yl group of TKI by suitable predominantly hydrophobic substituents in positions R1 and R2 leads to more potent inhibitors of MtbTMK than the best reference compound 43 (TKI1) [10]. The calculated values help us to pick the appropriate substituents.
One of the most active TKI analogs 5_149 ( = 15.5 nM, Table 6) contains m-pentyl-phenoxy and 7-formamide-quinolin-2-yl groups that occupy the entry into the thymidine-binding cleft of MtbTMK. The R2 pentyl chain (5, Table 5) makes hydrophobic contact with the side chains of GLN155 and ARG151, the R1 formamide (149) group cross-links the His53 and Arg107 residues with 2 hydrogen bonds, while the thymidine building block of the analog essentially preserves the binding mode seen in the crystal structure of the MtbTMK–TKI1 complex [10] (Figure 4). The main improvement in the predicted Gibbs free energy of MtbTMK–TKI_5_149 complex formation ∆∆Gcom comes from the enthalpic contribution of ∆∆HMM, which includes the formation of additional two hydrogen bonds.
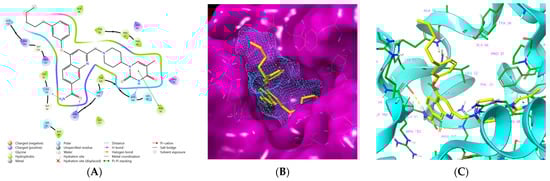
Figure 4.
(A) Two-dimensional interaction diagram of the most active TKI analog 149_5. (B) Molecular volume of the hydrophobic substituted mR2 -phenoxy-7R1-quinolin-2-yl group. (C) Three-dimensional structure of MtbTMK binding site with the bound TKI analog 149_5.
Analysis of the computational results shown in Table 6 suggests that attachment of various R1 and R2 groups to the TKI scaffold IV (Table 5) leads to enhanced predicted binding affinity of analogs the MtbTMK compared to the reference inhibitor TKI1 [10]. However, the most promising new TKI analogs 5_149, 13_4, 13_6, 13_1, 149_5, and 5_21 contain predominantly aliphatic chains in the R1 position and shorter polar structures capable of hydrogen bond formation in the R2 position. The predicted activity of the best new TKI 5_149 is more than 60 times lower than that of the reference inhibitor TKI1 [10]. It is, therefore, worth exploring the further derivatization of the TKI scaffold IV in the R1 and R2 positions when development of more potent antituberculotic agents is desired. The calculated Gibbs free energies of complex formation (Table 6) suggest that the best designed analogs will bind the MtbTMK more strongly than the reference compound 43 (TKI1) [10] and exert a higher pharmacodynamic effect.
3.6. ADME-Related Properties of New TKI Analogs
The pharmacokinetic profile of the new TKI analogs was predicted using the QikProp software (version 6.5) [38,39,50] (Table 7) and used for the selection of drug-like inhibitor candidates [22,40,47]. The 10 new TKI analogs included in Table 7 show favorable pharmacokinetic profiles, as documented by the global descriptor #starts, which indicates the number of ADME-related descriptors that fall outside the optimal range of values obeyed by 95% of known drugs out of the 24 calculated main QikProp descriptors [38,39,50]. The ADME properties of the TKI analogs are more promising than most of the reference antibiotics included in Table 7, especially in terms of lipophilicity and oral bioavailability.
Table 7.
Computed ADME-related properties of new TKI analogs and reference antituberculotic agents using QikProp [50].
The addition of the R1 and R2 groups to TKI1 affects not only ligand binding but also the solubility, metabolic stability, and other ADME-related properties of the new analogs. It is worth mentioning that of the six most promising new TKI analogs 5_149, 13_4, 13_6, 13_1, and 5_21, all compounds display a predicted #stars parameter equal to 0 (Table 7). This global drug-likeness descriptor shows that the new TKIs are predicted to possess favorable ADME properties and represent drug-like molecules. Furthermore, the enhanced hydrophobic character of the new TKIs (elevated hydrophobic molecular surface area Smol,hfo as compared to TKI1, Table 7) can help increase the permeation of the inhibitors across the lipid-rich Mtb cell wall and facilitate the antibacterial effect.
3.7. Molecular Dynamics Simulations
We have performed molecular dynamics (MD) simulations to check the stability of MtbTMK–TKIx complexes and the flexibility of the bound conformations at the active site of MtbTMK for the native ligand TKI1[10] and five best designed TKI analogs. The structures of the complexes obtained from combinatorial design approach and subsequent MM refinement were used as starting geometries for MD simulations using Desmond [43,44]. Figure 5 shows the periodic box with a solvated MtbTMK–TKI1 complex. The ensemble averages of the total and potential energy of MtbTMK–TKIx complexes for the TKI1 and the best new inhibitor candidates are shown in Table 8. Figure 6 shows the time evolution of the properties of the bound inhibitors, which documents that the inhibitors remain in their bound conformations, while their pose is slightly affected by thermal fluctuations.
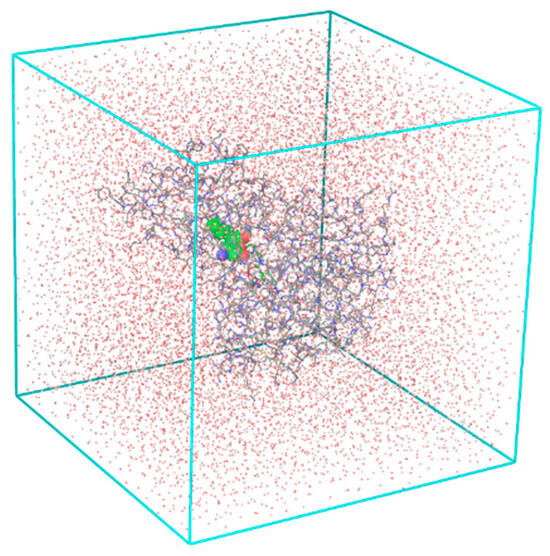
Figure 5.
The periodic cubic box used in the MD simulations contains a solvated MtbTMK–TKI1 complex.
Table 8.
Ensemble averages of the total and potential energy of complexes MtbTMK–TKIx for the TKI1 [10] and best new inhibitor candidates.
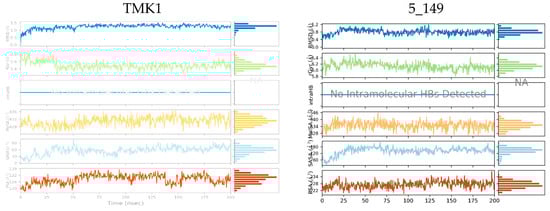
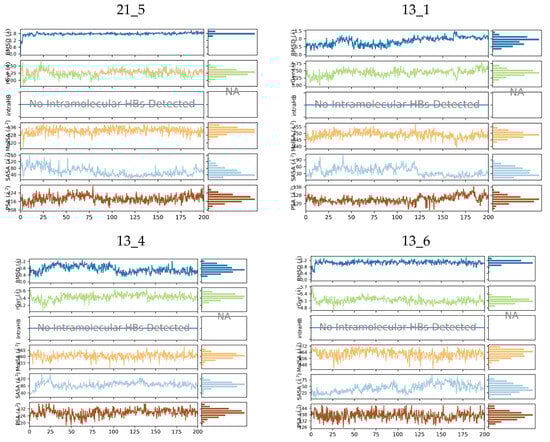
Figure 6.
Molecular properties of six TKIs (Table 8) bound to MtbTMK were monitored over 200 ns of MD simulation time. For each inhibitor root mean square deviation (RMSD) with respect to the initial conformation of the TKI, the radius of gyration (rGyr), number of intramolecular hydrogen bonds (intraHB), molecular surface area (molSA), solvent-accessible surface area (SASA), and polar surface area (PSA) were plotted (top to bottom in each diagram).
Interactions between the protein and TKI were observed throughout the MD trajectory to identify specific residue–inhibitor interactions maintained during the time evolution (Figure 7). Hydrophobic interactions seem to dominate the TKI1 binding to MtbTMK. The new TKI analogs show higher contribution of hydrogen bonding and polar interactions with active site residues compared to TKI1, which indicates an increase in specificity of these inhibitor candidates for the MtbTMK target. Finally, the interactions that occur over more than 20.0% of the simulation time are plotted in a 2D schematic representation (Figure 8). Moreover, we have superimposed averaged conformations of ligands obtained from MD simulation after MM minimization on those prepared by in situ modification and MM refinement of the TKI1 [10]. Figure 9 illustrates these superimposed structures and gives the respective RMSD.
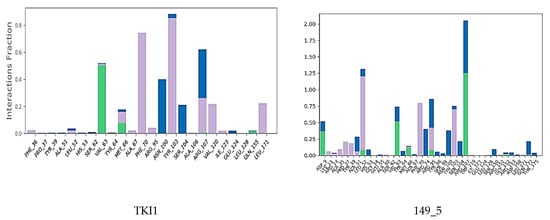
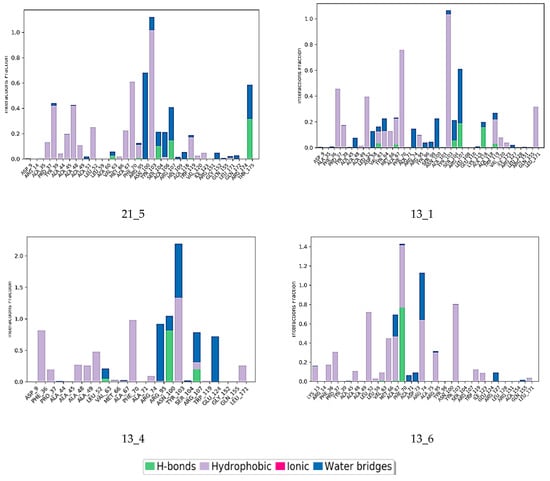
Figure 7.
Contribution of individual active site residues to inhibitor binding in MtbTMK–TKIx complexes present during at least 20% of the MD simulation time.
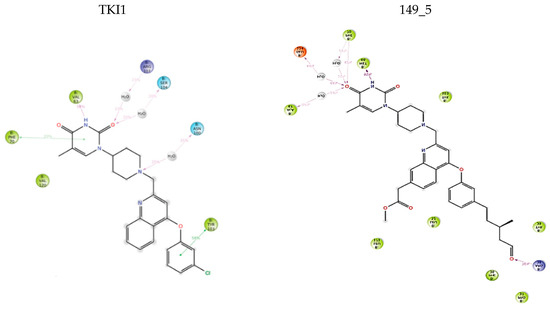
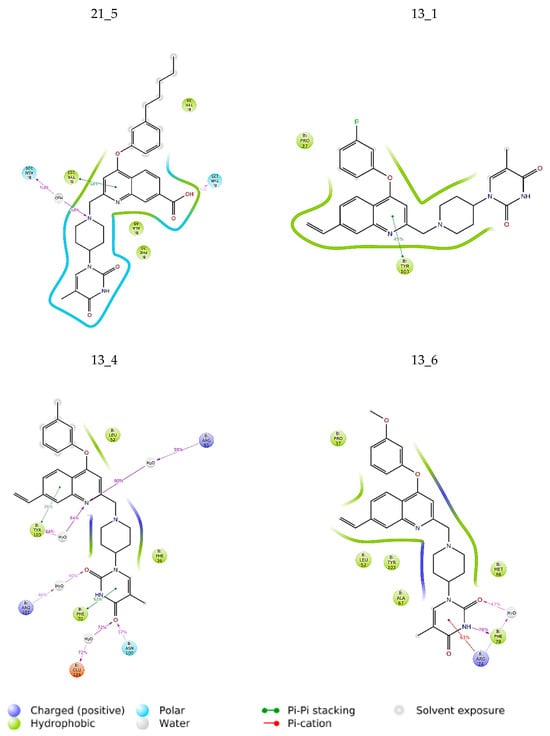
Figure 8.
The 2D scheme presents attractive interactions prevalent between the functional groups of the six inhibitor candidates and the individual residues of the active site of MtbTMK. These interactions were observed in at least 20% of the analyzed 500 frames of the MD trajectory (160 ns, 400 frames).
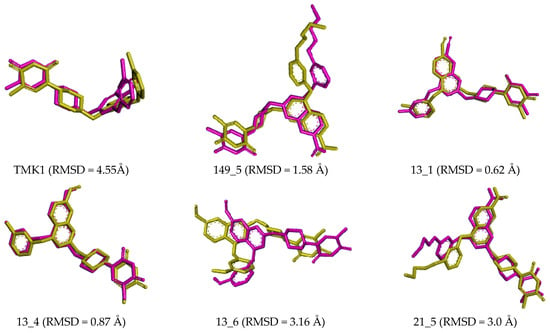
Figure 9.
Overlay of the averaged bound conformation of the TKI from MD simulation (purple color) and MM-refined complexes (yellow color).
Small deviations observed between the superimposed active conformations of new MtbTMK inhibitors (except 14_115 and 5_58), which were modelled by in situ modification of TKI1 and MM-PBSA refinement, and those derived from averaging the MD simulation snapshots over the simulation time interval (Figure 9), indicate the stability of the modelled MtbTMK–TKIx complexes. MD simulations preserved the binding mode of the TKIs observed in the crystal structure of MtbTMK complexes [10,11,12].
4. Conclusions
In this study, new derivatives of TKI that are predicted to inhibit MtbTMK at low nanomolar inhibitory concentrations were investigated (Table 8). A PH4 pharmacophore model of MtbTMK inhibition, prepared with the help of a training set of 31 TKIs, was used to screen in silico a virtual combinatorial library consisting of more than 28,900 new TKI analogs. More than 89 top-scoring virtual hits were docked into the active site of MtbTMK adopted from the crystal structure of the MtbTMK–TKI1 complex [11,12,17,18,19]. The inhibitory potency of the designed compounds toward MtbTMK was predicted based on the relative Gibbs free energies ∆∆Gcom calculated for the formation of the enzyme–inhibitor complex (Table 6). In silico screening of the virtual library based on the match with the PH4 pharmacophore helped to identify appropriate R1 and R2 groups from the 170 substituents considered (Table 5) which are recommended for their derivatization of the TKI scaffold IV. Most of the 89 promising new TKI analogs (Table 6) with the hydrophobic m-chloro-phenoxyquinolin-2-yl group extended at positions R1 and R2 were predicted to inhibit the MtbTMK better than the reference inhibitor TKI1 (43) ( 950 nM) [10]. These novel TKI analogs, namely 4_19 ( = 41.1 nM), 115_14 ( = 17.2 nM), 149_5 ( = 15.5 nM), 13_1 ( = 9.5 nM), 13_4 ( = 9.9 nM), 13_6 ( = 10.8 nM) and 21_5 ( = 10.1 nM), 115_14 ( = 17.2 nM), and 46_16 ( = 26.2 nM), exhibit strong predicted binding affinities to MtbTMK, (Table 6) in the low nanomolar concentrations range (TKI 13_1 is predicted to be 100 times more potent than TKI1) and possess favorable ADME-related properties (Table 7). Although our predictions of inhibitory potencies might be somewhat too optimistic, they clearly suggest that further extension of the hydrophobic cap of the MtbTMK active site by the addition of small polar and nonpolar R1 and R2 groups to TKI is useful and leads to further improvement of binding affinity.
Thus, these novel derivatives show potential as possible candidates for reversible inhibitors that inactivate the proven pharmacological target MtbTMK. This target is different from those related to the drug resistance of Mycobacterium tuberculosis to conventional antituberculotics. Molecular dynamics simulations confirmed stable enzyme–inhibitor complexes for these new inhibitor candidates. In conclusion, we suggest the synthesizing and testing of these new molecules to assess their inhibitory capabilities and their eventual development into potential antitubercular agents.
Author Contributions
Methodology, V.F.; Investigation, S.K., K.N.P.G.A., I.F., R.K.N. and E.M.; Writing—original draft, E.M.; Writing—review & editing, S.M. and V.F. All authors have read and agreed to the published version of the manuscript.
Funding
This research was partially funded by Slovak Research and Development Agency grant number APVV-21-0108.
Institutional Review Board Statement
Not applicable.
Informed Consent Statement
Not applicable.
Data Availability Statement
The original contributions presented in this study are included in the article. Further inquiries can be directed to the corresponding author.
Conflicts of Interest
The authors declare no conflict of interest.
Abbreviations
| 2D | Two-dimensional |
| 3D | Three-dimensional |
| ADME | Absorption, distribution, metabolism, and excretion |
| ATP | Adenosine triphosphate |
| GFE | Gibbs free energy |
| ∆∆Gcom | Relative GFE of formation of enzyme–inhibitor complex |
| ∆∆Gsol | Solvation component of the relative GFE |
| HBA | Hydrogen bond acceptor |
| HBD | Hydrogen bond donor |
| ∆∆HMM | Enthalpy component of the relative GFE |
| HOA | Human oral absorption |
| HYD | Hydrophobic |
| HYDA | Hydrophobic aliphatic |
| Observed half-maximal inhibitory concentration | |
| Predicted half-maximal inhibitory concentration | |
| IE | Interaction energy |
| LHP | Large hydrophobic pocket |
| MD | Molecular dynamics |
| MM | Molecular mechanics |
| MM-PBSA | Molecular mechanics–Poisson–Boltzmann surface area |
| NAD | Nicotinamide adenine dinucleotide |
| Mtb | Mycobacterium tuberculosis |
| MtbTMK | Mycobacterium tuberculosis thymidylate kinase |
| PDB | Protein Data Bank |
| PH4 | Pharmacophore model |
| QSAR | Quantitative structure–activity relationships |
| RMSD | Root mean square deviation |
| TB | Tuberculosis |
| TKIx | Inhibitors included in TS |
| TKIVx | Inhibitors included in VS |
| TS | Training set |
| VS | Validation set |
References
- Alsayed, S.S.R.; Gunosewoyo, H. Tuberculosis: Pathogenesis, Current Treatment Regimens and New Drug Targets. Int. J. Mol. Sci. 2023, 24, 5202. [Google Scholar] [CrossRef]
- World Health Organization (WHO). Global Tuberculosis Report 2024; WHO: Geneva, Switzerland, 2024; Available online: https://iris.who.int/bitstream/handle/10665/379339/9789240101531-eng.pdf?sequence=1 (accessed on 10 December 2024).
- Ministère de la Santé et de l’Hygiène Publique (MSHP). Rapport annuel du Programme National de Lutte contre la Tuberculose (PNLT); WHO: Geneva, Switzerland, 2015.
- World Health Organization (WHO). Guidelines for the Treatment of Drug-Resistant Tuberculosis; WHO: Geneva, Switzerland, 2019. [Google Scholar]
- Murray, P.R.; Rosenthal, K.S.; Pfaller, M.A. Medical Microbiology, 9th ed.; Elsevier: Philadelphia, PA, USA, 2020; ISBN 9780323673228. [Google Scholar]
- Nikaido, H. Preventing drug access to targets: Cell surface permeability barriers and active efflux in bacteria. Semin. Cell Dev. Biol. 2001, 12, 215–223. [Google Scholar] [CrossRef]
- Falzon, D.; Gandhi, N.; Migliori, G.B.; Sotgiu, G.; Cox, H.S.; Holtz, T.H.; Hollm-Delgado, M.-G.; Keshavjee, S.; DeRiemer, K.; Centis, R.; et al. Resistance to fluoroquinolones and second-line injectable drugs: Impact on multidrug-resistant TB outcomes. Eur. Respir. J. 2013, 42, 156–168. [Google Scholar] [CrossRef] [PubMed]
- Diacon, A.H.; Pym, A.; Grobusch, M.; de los Rios, J.M.; Gotuzzo, E.; Vasilyeva, I.; Leimane, V.; Andries, K.; Bakare, N.; De Marez, T.; et al. Multidrug-resistant tuberculosis and culture conversion with bedaquiline. N. Engl. J. Med. 2014, 371, 723–732. [Google Scholar] [CrossRef]
- Zumla, A.; Nahid, P.; Cole, S.T. Advances in the development of new tuberculosis drugs and treatment regimens. Nat. Rev. Drug Discov. 2013, 12, 388–404. [Google Scholar] [CrossRef] [PubMed]
- Song, L.; Merceron, R.; Gracia, B.; Quintana, A.L.; Risseeuw, M.D.P.; Hulpia, F.; Cos, P.; Aínsa, J.A.; Munier-Lehmann, H.; Savvides, S.N.; et al. Structure guided lead generation toward nonchiral M. tuberculosis thymidylate kinase inhibitors. J. Med. Chem. 2018, 61, 2753–2775. [Google Scholar] [CrossRef]
- Merceron, R.; Song, L.; Munier-Lehmann, H.; Van Calenbergh, S.; Savvides, S.; Mtb TMK Crystal Structure in Complex with Compound LS3080. Crystal Structure in the Protein Data Bank, Entry 5NRN, Released 8-8-2018. Available online: https://www.rcsb.org (accessed on 22 January 2025).
- Song, L.; Risseeuw, M.P.D.; Froeyen, M.; Karalic, I.; Goeman, J.; Cappoen, D.; Van der Eycken, J.; Cos, P.; Munier-Lehmann, H.; Van Calenbergh, S. Elaboration of a proprietary thymidylate kinase inhibitor motif towards anti-tuberculosis agents. Bioorg. Med. Chem. 2016, 24, 5172–5182. [Google Scholar] [CrossRef] [PubMed]
- Gupta, A.K.; Kaul, M.; Zhang, Y. New antituberculosis drugs and regimens: 2015 update. Expert Rev. Anti. Infect. Ther. 2015, 13, 1065–1080. [Google Scholar] [CrossRef]
- Kitchen, D.B.; Decornez, H.; Furr, J.R.; Bajorath, J. Docking and scoring in virtual screening for drug discovery: Methods and applications. Nat. Rev. Drug Discov. 2004, 3, 935–949. [Google Scholar] [CrossRef]
- Insight-II and Discover Molecular Modeling and Simulation Package; Release 2005; Accelrys Inc.: San Diego, CA, USA, 2005.
- Massova, I.; Kollman, P.A. Combined molecular mechanical and continuum solvent approach (MM-PBSA/GBSA) to predict ligand binding. Perspect. Drug Discov. Des. 2000, 18, 113–135. [Google Scholar] [CrossRef]
- Song, L.; Merceron, R.; Hulpia, F.; Lucía, A.; Gracia, B.; Jian, Y.; Risseeuw, M.D.; Verstraelen, T.; Cos, P.; Aínsa, J.A.; et al. Structure-aided optimization of non-nucleoside M. tuberculosis thymidylate kinase inhibitors. Eur. J. Med. Chem. 2021, 225, 113784. [Google Scholar] [CrossRef] [PubMed]
- Van Calenbergh, S.; Pochet, S.; Munier-Lehmann, H. Drug design and identification of potent leads against Mycobacterium tuberculosis thymidine monophosphate kinase. Curr. Top. Med. Chem. 2012, 12, 694–705. [Google Scholar] [CrossRef]
- Munier-Lehmann, H.; Chaffotte, A.; Pochet, S.; Labesse, G. Thymidylate kinase de Mycobacterium tuberculosis: Une chimère partageant des propriétés communes aux enzymes eucaryotes et bactériennes. Protein Sci. 2001, 10, 1195–1205. [Google Scholar] [CrossRef] [PubMed]
- Frecer, V.; Seneci, P.; Miertus, S. Computer-assisted combinatorial design of bicyclic thymidine analogs as inhibitors of Mycobacterium tuberculosis thymidine monophosphate kinase. J. Comput.-Aided Mol. Des. 2011, 25, 31–49. [Google Scholar] [CrossRef] [PubMed]
- Lin, S.K. Pharmacophore perception, development and use in drug design. Edited by O.F. Güner. Molecules 2000, 5, 987–989. [Google Scholar] [CrossRef]
- Kouassi, A.F.; Kone, M.; Keita, M.; Esmel, A.; Megnassan, E.; N’Guessan, Y.T.; Frecer, V.; Miertus, S. Computer-aided design of orally bioavailable pyrrolidine carboxamide inhibitors of Enoyl-Acyl Carrier Protein Reductase of Mycobacterium tuberculosis with favorable pharmacokinetic profiles. Int. J. Mol. Sci. 2015, 16, 29744–29771. [Google Scholar] [CrossRef]
- Maple, J.R.; Hwang, M.-J.; Stockfisch, T.P.; Dinur, U.; Waldman, M.; Ewig, C.S.; Hagler, A.T. Derivation of class II force fields. I. Methodology and quantum force field for the alkyl functional group and alkane molecules. J. Comput. Chem. 1994, 15, 162–182. [Google Scholar] [CrossRef]
- Dauber-Osguthorpe, P.; Hagler, A.T. Biomolecular force fields: Where have we been, where are we now, where do we need to go and how do we get there? J. Comput.-Aided Mol. Des. 2019, 33, 133–203. [Google Scholar] [CrossRef] [PubMed]
- Frecer, V.; Berti, F.; Benedetti, F.; Miertus, S. Design of peptidomimetic inhibitors of aspartic protease of HIV-1 containing –PheΨPro– core and displaying favourable ADME-related properties. J. Mol. Graph. Model. 2008, 27, 376–387. [Google Scholar] [CrossRef]
- Keita, M.; Kumar, A.; Dali, B.; Megnassan, E.; Siddiqi, M.I.; Frecer, V.; Miertus, S. Quantitative structure–activity relationships and design of thymine-like inhibitors of thymidine monophosphate kinase of Mycobacterium tuberculosis with favourable pharmacokineticprofiles. RSC Adv. 2014, 4, 55853–55866. [Google Scholar] [CrossRef]
- Frecer, V.; Burello, E.; Miertus, S. Combinatorial design of nonsymmetrical cyclic urea inhibitors of aspartic protease of HIV-1. Bioorg. Med. Chem. 2005, 13, 5492–5501. [Google Scholar] [CrossRef]
- Gilson, M.K.; Honig, B. The inclusion of electrostatic hydration energies in molecular mechanics calculations. J. Comput.-Aided Mol. Des. 1991, 5, 5–20. [Google Scholar] [CrossRef] [PubMed]
- Rocchia, W.; Sridharan, S.; Nicholls, A.; Alexov, E.; Chiabrera, A.; Honig, B. Rapid grid-based construction of the molecular surface and the use of induced surface charge to calculate reaction field energies: Applications to the molecular systems and geometric objects. J. Comput. Chem. 2002, 23, 128–137. [Google Scholar] [CrossRef]
- Böttcher, C.J.F. Theory of Electric Polarization; eBook; Elsevier: Amsterdam, The Netherlands, 1973; ISBN 9780444600066. [Google Scholar]
- Discovery Studio Molecular Modeling and Simulation Program, version 2.5; Accelrys, Inc.: San Diego, CA, USA, 2009.
- Miertus, S.; Frecer, V. Continuum models of environmental effects on molecular structure and mechanisms in chemistry and biology. J. Math. Chem. 1992, 10, 183–204. [Google Scholar] [CrossRef]
- Fischer, S.; Smith, J.C.; Verma, C.S. Dissecting the vibrational entropy change on protein/ligand binding: Burial of a water molecule in bovine pancreatic trypsin inhibitor. J. Phys. Chem. B 2001, 105, 8050–8055. [Google Scholar] [CrossRef]
- Frecer, V.; Majekova, M.; Miertus, S. Approximate methods for solvent effect calculations on biomolecules. J. Mol. Struct. THEOCHEM 1989, 52, 403–419. [Google Scholar] [CrossRef]
- Güner, O.F.; Bowen, J.P. Setting the record straight: The origin of the pharmacophore concept. J. Chem. Inf. Model. 2014, 54, 1269–1283. [Google Scholar] [CrossRef]
- Schueler, F.W. Chemobiodynamics and Drug Design; McGraw-Hill: New York, NY, USA, 1960. [Google Scholar]
- Güner, O.F. History and Evolution of the Pharmacophore Concept in Computer-Aided Drug Design. Curr. Med. Chem. 2002, 2, 1321–1332. [Google Scholar] [CrossRef]
- Jorgensen, W.L.; Duffy, E.M. Prediction of drug solubility from Monte Carlo simulations. Bioorg. Med. Chem. Lett. 2000, 10, 1155–1158. [Google Scholar] [CrossRef] [PubMed]
- Jorgensen, W.L.; Duffy, E.M. Prediction of drug solubility from structure. Adv. Drug Deliv. Rev. 2002, 54, 355–366. [Google Scholar] [CrossRef] [PubMed]
- Bowers, K.J.; Chow, E.; Xu, H.; Dror, R.O.; Eastwood, M.P.; Gregersen, B.A.; Klepeis, J.L.; Kolossvary, I.; Moraes, M.A.; Sacerdoti, F.D.; et al. Scalable algorithms for molecular dynamics simulations on commodity clusters. In Proceedings of the ACM/IEEE Conference on Supercomputing (SC06), Tampa, FL, USA, 11–17 November 2006. [Google Scholar]
- Owono, L.C.; Keita, M.; Megnassan, E.; Frecer, V.; Miertus, S. Design of Thymidine Analogues Targeting Thymidilate Kinase of Mycobacterium tuberculosis. Tuberc. Res. Treat. 2013, 2013, 670836. [Google Scholar] [CrossRef]
- Willett, P. Molecular Similarity in Drug Design; Dean, P.M., Ed.; Chapman and Hall: Glasgow, UK, 1994; pp. 110–137. [Google Scholar]
- Desmond Molecular Dynamics System, (Release 2021–2); Schrödinger LLC: New York, NY, USA, 2021.
- Frecer, V.; Miertus, S. Antiviral agents against COVID-19: Structure-based design of specific peptidomimetic inhibitors of SARS-CoV-2 main protease. RSC Adv. 2020, 10, 40244–40263. [Google Scholar] [CrossRef]
- Sapse, A.M.; Schweitzer, B.S.; Dicker, A.P.; Bertino, J.R.; Frecer, V. Ab initio studies of aromatic-aromatic and aromatic-polar interactions in the binding of substrate and inhibitor to dihydrofolate-reductase. Int. J. Pept. Protein Res. 1992, 39, 18–23. [Google Scholar] [CrossRef] [PubMed]
- Miertus, S.; Frecer, V.; Chiellini, E.; Chiellini, F.; Solaro, R.; Tomasi, J. Molecular interactions and inclusion phenomena in substituted β-cyclodextrins: Simple inclusion probes:: H2O, C, CH4, C6H6, NH4+, HCOO−. J. Incl. Phenom. Mol. Recog. Chem. 1998, 32, 23–46. [Google Scholar] [CrossRef]
- Bieri, C.; Akori, E. Structure-Based Design and Pharmacophore-Based Virtual Screening of Combinatorial Library of Triclosan Analogues Active against Enoyl-Acyl Carrier Protein Reductase of Plasmodium falciparum with Favourable ADME Profiles. Int. J. Mol. Sci. 2023, 24, 6916. [Google Scholar] [CrossRef]
- Guardia, A.; Gulten, G.; Fernandez, R.; Gómez, J.; Wang, F.; Convery, M.; Blanco, D.; Martínez, M.; Pérez-Herrán, E.; Alonso, M.; et al. N-Benzyl-4-((heteroaryl)methyl)benzamides: A new class of direct NADH-dependent 2-trans enoyl–acyl carrier protein reductase (InhA) inhibitors with antitubercular activity. ChemMedChem 2016, 11, 687–701. [Google Scholar] [CrossRef]
- BIOVIA. Available Chemicals Directory (ACD). 2022. Available online: https://www.psds.ac.uk/acd (accessed on 11 March 2023).
- QikProp, 6.5; (Release 139); Schrödinger LLC: New York, NY, USA, 2019.


Disclaimer/Publisher’s Note: The statements, opinions and data contained in all publications are solely those of the individual author(s) and contributor(s) and not of MDPI and/or the editor(s). MDPI and/or the editor(s) disclaim responsibility for any injury to people or property resulting from any ideas, methods, instructions or products referred to in the content. |
© 2025 by the authors. Licensee MDPI, Basel, Switzerland. This article is an open access article distributed under the terms and conditions of the Creative Commons Attribution (CC BY) license (https://creativecommons.org/licenses/by/4.0/).