Article

Genome-Wide Identification and Expression of the ERF Gene Family in Populus trichocarpa and Their Responses to Nitrogen and Abiotic Stresses

1
College of Forestry, Henan Agricultural University, Zhengzhou 450046, China
2
College of Horticulture and Forestry Science, Hubei Engineering Technology Research Center for Forestry Information, Huazhong Agricultural University, Wuhan 430070, China
3
State Key Laboratory of Conservation and Utilization of Subtropical Agro-Bioresources, Guangdong Laboratory for Lingnan Modern Agriculture, Guangdong Key Laboratory for Innovative Development and Utilization of Forest Plant Germplasm, College of Forestry and Landscape Architecture, South China Agricultural University, Guangzhou 510642, China
*
Author to whom correspondence should be addressed.
These authors contributed equally to this work.
Life 2025, 15(4), 550; https://doi.org/10.3390/life15040550
Submission received: 26 February 2025 / Revised: 25 March 2025 / Accepted: 26 March 2025 / Published: 27 March 2025
(This article belongs to the Special Issue Plant Biotic and Abiotic Stresses 2024)

Abstract

:
The ethylene response factor (ERF) family is a prominent plant-specific transcription factor family, which plays a crucial role in modulating plant growth and stress tolerance. In this study, a total of 210 ERFs were identified in Populus trichocarpa, comprising 29 AP2 (APETALA2) subfamily members, 176 ERF subfamily members, and 5 RAV (related to ABI3/VP1) subfamily members. The duplication events of the PtERF family members exclusively occurred within the subfamilies. A total of 168 duplication pairs were found among 161 PtERF genes, and all of them were fragment duplications. Gene structure analysis revealed that most ERF subfamily members only had one exon without introns, the AP2 subfamily members had six or more introns and exons, and RAV subfamily members lacked introns except for PtERF102. Considerable cis-acting elements associated with plant growth and development, stress response, hormone response, and light response were detected in the promoters of PtERF genes. The expression levels of PtERFs were highest in roots across tissues and in winter among seasons. Furthermore, the nitrate and urea stimulated the expression of PtERF genes. The co-expression network analysis based on PtERFs indicated their potential roles in hormone signaling, acyltransferase activity, and response to chemicals. This study provides novel insights into investigating the role of PtERFs in environmental stress in poplar species.

1. Introduction

Transcription factors (TFs) are proteins located in the cell nucleus that mediate DNA transcription [1]. They can specifically interact with cis-acting elements in promoter regions, thereby regulating the transcriptional expression of downstream genes [2]. Plants growing in natural environments are exposed to various biotic and abiotic stresses, such as fungi, bacteria, viruses, pests, salinity, drought, high temperature, and low temperature [3,4]. These stresses have a detrimental impact on plant growth and productivity. The expression of genes in plants can be induced by various stresses, and the products of gene expression not only contribute to stress tolerance but also regulate gene expression and signal transduction in stress responses [5]. There are approximately 1300–1600 genes encoding TFs in Arabidopsis and rice, which act as pivotal regulators involved in plant stress tolerance by modulating the expression of target genes [6].
The ethylene response factor (ERF) family is one of the largest TF families in plants, and it plays crucial roles in plant growth and development and hormone regulation, as well as responses to biotic and abiotic stresses [7,8]. The ERF family is classified into four subfamilies, namely AP2 (APETALA2), ERF, RAV (related to ABI3/VP1), and Soloist, based on the number of AP2 domains and sequence similarity [9]. The AP2 subfamily comprises two AP2 domains and plays a crucial role in regulating plant growth and development [10]. The RAV subfamily is characterized by an AP2 domain and a B3 domain and is involved in the response to hormones such as ethylene and brassinolide [11]. The ERF subfamily contains one AP2 domain and can be further divided into the DREB (Dehydration-Responsive-Element-Binding Factor) and ERF subgroups [12]. Members of the ERF subgroup bind to the ethylene response element (ERE) (GCC-box, core sequence AGCCGCC), while members of DREB subgroups bind to a DRE element (core sequence A/GCCGAC) [13]. The Soloist subfamily contains an AP2 domain, but its gene structure differs significantly from that of other subfamilies [14]. In addition, ERF genes in Arabidopsis were categorized into 10 branches based on their phylogenetic relationships [6].
The ERF transcription factors play a crucial role in response to biotic and abiotic stresses by activating the expression of related genes. For example, the overexpression of StPti5, a novel eggplant ERF transcription factor gene, could improve resistance to Verticillium dahliae and activate genes linked to the ethylene signaling pathway in Arabidopsis thaliana [15]. The ERF transcript factors regulated the expression of genes by directly binding to the promoters of their target genes or forming protein complexes with other transcript factors [6,16]. OsDREB2B, a member of the ERF family transcription factors, regulates the expression of OsAP2-39 and interacted with OsWRKY21 to regulate GA synthesis, resulting in a negative effect on rice growth and development [17]. The ERF transcription factor OsRPH1 interacts with the blue light receptor Cryptochrome 1 (OsCRY1b), resulting in a significant reduction in plant height [18]. Additionally, ERF transcription factors can synergistically interact with hormone-signaling pathways to form a cross-regulatory network, participating in growth and development as well as abiotic stress responses mediated by abscisic acid (ABA), gibberellin (GA), auxin (IAA), ethylene (ET), brassinosteroids (BR), and cytokinin (CTK) [19,20,21,22]. The overexpression of OsERF71 enhanced drought tolerance by regulating the expression of ABA response and proline synthesis genes, thereby reducing water loss [23]. The OsERF096 regulates the response to low temperature in rice by modulating the accumulation and signal transduction of IAA [24]. However, not all ERF transcription factors induce biotic and abiotic stress tolerance in plants. The overexpression of certain ERFs in plants made them more susceptible to stress [25,26]. Members of the ERF transcription factor family act as connecting factors in the cross-regulatory network in response to stress signals [27]. Numerous studies have shown that diverse stimuli can elicit the expression of ERF transcription factors. For instance, maize ERF genes are induced by salt, drought, and waterlogging to mount a defense response against environmental stress [28,29,30,31]. It has been shown that the members of the DREB subfamily can recognize drought response elements and cold response elements, thereby enhancing plant resistance to abiotic stresses [8].
Nitrogen (N) is an essential element for plants, functioning in plant growth and development processes [32,33]. When confronted with high N levels, N starvation, or changes in N forms, numerous ERF family members were overexpressed in response to N perturbation [34,35,36]. In addition, many investigations have indicated that ERF transcription factors are involved in the absorption and assimilation of N [37,38]. PvAP2-1, a member of the ERF family in P. vulgaris, has been suggested as an essential regulator in the legume–rhizobia nitrogen-fixing symbiosis [39]. Within the ERF family, the transcription factor MdDREB2A interacts with DRE cis-elements of the MdNIR1 promoter, positively regulating nitrogen utilization [37]. Meanwhile, MdDREB2A can also directly bind to the MdSWEET12 promoter, promoting nitrogen assimilation [37]. The ERF transcription factor ZmEREB97 directly targets and regulates the expression of six ZmNRT genes, enhancing absorption of nitrate and nitrogen utilization efficiency [38]. Overall, the ERF family is an important transcription factor family involved in regulating nitrogen uptake and assimilation.
In plants, numerous ERF transcription factors have been identified in various species, including Arabidopsis thaliana [7], Zea mays [40], Morus notabilis [41], and Osmanthus fragrans [42]. For example, 125 ERFs have been identified in Dimocarpus longan [43], and 49 ERFs have been identified in Taxus media [44]. The poplar is widely distributed around the world and plays a significant role in various sectors, including bioenergy, timber production, and carbon sequestration, owing to its rapid growth characteristics [45,46]. Although the ERF family members have been identified in poplar species, including Populus simonii × P. nigra [13], P. trichocarpa [47], and P. alba × P. glandulosa [9], the tissue-specific expression patterns and the responses to nitrogen and seasonal changes of ERF family members in P. trichocarpa remain unclear. With the upgrade of sequencing technology, the genome of P. trichocarpa, a model tree species, has been sequenced multiple times, and the genomic databases are constantly being updated [48]. Therefore, it is crucial to investigate the tissue-specific expression patterns and the responses to nitrogen and seasonal changes of ERF transcription factors in P. trichocarpa. In this study, we systematically identified the members of the ERF family in P. trichocarpa and analyzed the developmental evolution relationships and gene duplication events. In addition, we analyzed the expression patterns of ERF family members in various tissues and seasons, as well as the responses to nitrogen. Therefore, this study provides a theoretical basis for exploring the regulation mechanisms of plant growth and development and responses to nitrogen by PtERFs.

2. Materials and Methods

2.1. Identification of the ERF Transcription Factors in P. trichocarpa

The genome sequence and protein sequence data of P. trichocarpa were acquired from JGI Phytozome database v13 (https://phytozome-next.jgi.doe.gov/info/Ptrichocarpa_v4_1, accessed on 10 December 2024), and the Arabidopsis thaliana ERF full-length protein sequences were obtained from The Arabidopsis Information Resource (TAIR; https://www.arabidopsis.org/, accessed on 10 December 2024). The identification of PtERFs in P. trichocarpa was performed according to the previously reported methods [49,50]. First, the amino acid sequences of the AtERF transcription factor family were retrieved from TAIR. Subsequently, a local BLASTP was conducted to obtain the homologous proteins in P. trichocarpa according to the AtERF amino sequences, and all sequence information with an E-value less than 10−5 was retained. Then, the hidden Markov model (HMM) containing the AP2 domain was used to search from the P. trichocarpa protein database, retaining all sequence information with an E-value less than 10−5. After deduplicating the amino acid sequences obtained from BLASTP and HMMER (http://www.hmmer.org/, accessed on 10 December 2024), the candidate sequences were submitted to NCBI and HMMER for verification of the AP2 domain. Finally, 210 PtERF sequences were retained.

2.2. Chromosomal Distribution and Bioinformatics Analysis

Using the PhytoMine tool on the Phytozome (https://jgi.doe.gov, accessed on 11 December 2024) website, amino acid sequence analysis was performed by inputting 210 ERF protein IDs to obtain the number of amino acids, loci, and chromosomal location of the ERF transcription factor family. Molecular weight, theoretical isoelectric point (pI), and grand average of hydropathicity (GRAVY) were predicted using ProtParam (https://web.expasy.org/protparam/, accessed on 11 December 2024). The chromosomal distribution of PtERFs was mapped using TBtools (v 2.056) [51]. Subcellular localization analysis of the ERF transcription factors was conducted using WOLF-PSORT (https://www.genscript.com/wolf-psort.html, accessed on 11 December 2024).

2.3. Phylogenetic and Sequence Analysis

The 210 PtERF sequences were aligned using ClustalX (version 2.1), and a phylogenetic tree of the PtERF gene family proteins was constructed using the maximum likelihood method in MEGA software (version 11.0.13) [52]. The phylogenetic tree was visualized on the iTOL website (https://itol.embl.de, accessed on 12 December 2024) [53]. The gene and protein structures of PtERFs were visualized using TBtools (v 2.056) [54,55]

2.4. Analysis of Gene Replication Events

MCScanX software (version 11.0.13) was employed to identify gene pairs within the P. trichocarpa genome and between the A. thaliana genome based on protein sequences. The Ka/Ks values of gene duplication pairs were calculated using TBtools. The collinearity maps of the PtERF gene family members in P. trichocarpa and A. thaliana were generated by the Circos tool in TBtools (v 2.056) [54,55].

2.5. Analysis of Cis-Acting Elements

Regions 2000 bp upstream of the coding sequences of PtERF members were selected using the Gtf/Gff3 Sequences Extractor in TBtools software (v 2.056). Subsequently, the cis-acting elements were analyzed and predicted using the PlantCARE database (https://bioinformatics.psb.ugent.be/webtools/plantcare/html/, accessed on 20 December 2024) [56].

2.6. Gene Expression Analysis

The gene expression data for the PtERF gene family in various tissues under different treatments, as well as in root tips and stems during different seasons, were retrieved from the Phytozome database (https://data.jgi.doe.gov/refine-download/phytozome?q=Populus+trichocarpa, accessed on 11 December 2024) under filenames of Ptrichocarpa_533_v4.1.gene_atlas_v2.meanExpression.FPKM.csv.gz and Ptrichocarpa_533_v4.1.gene_atlas_v2.meanExpression.TPM.csv.gz [57]. The heatmaps were generated using RStudio (version 2023.12.1).

2.7. Co-Expression Network Analysis

The co-expression genes of each PtERF were obtained from the Phytozome website. Genes that exhibited a correlation coefficient greater than 0.95 and had a connection count exceeding 100 were selected for constructing the PtERFs’ co-expression network. The co-expression network was then visualized using Cytoscape software (version 3.8.2). The analyses of Gene Ontology (GO) and the Kyoto Encyclopedia of Genes and Genomes (KEGG) were conducted with R (version 2023.12.1) as suggested previously [58].

3. Results

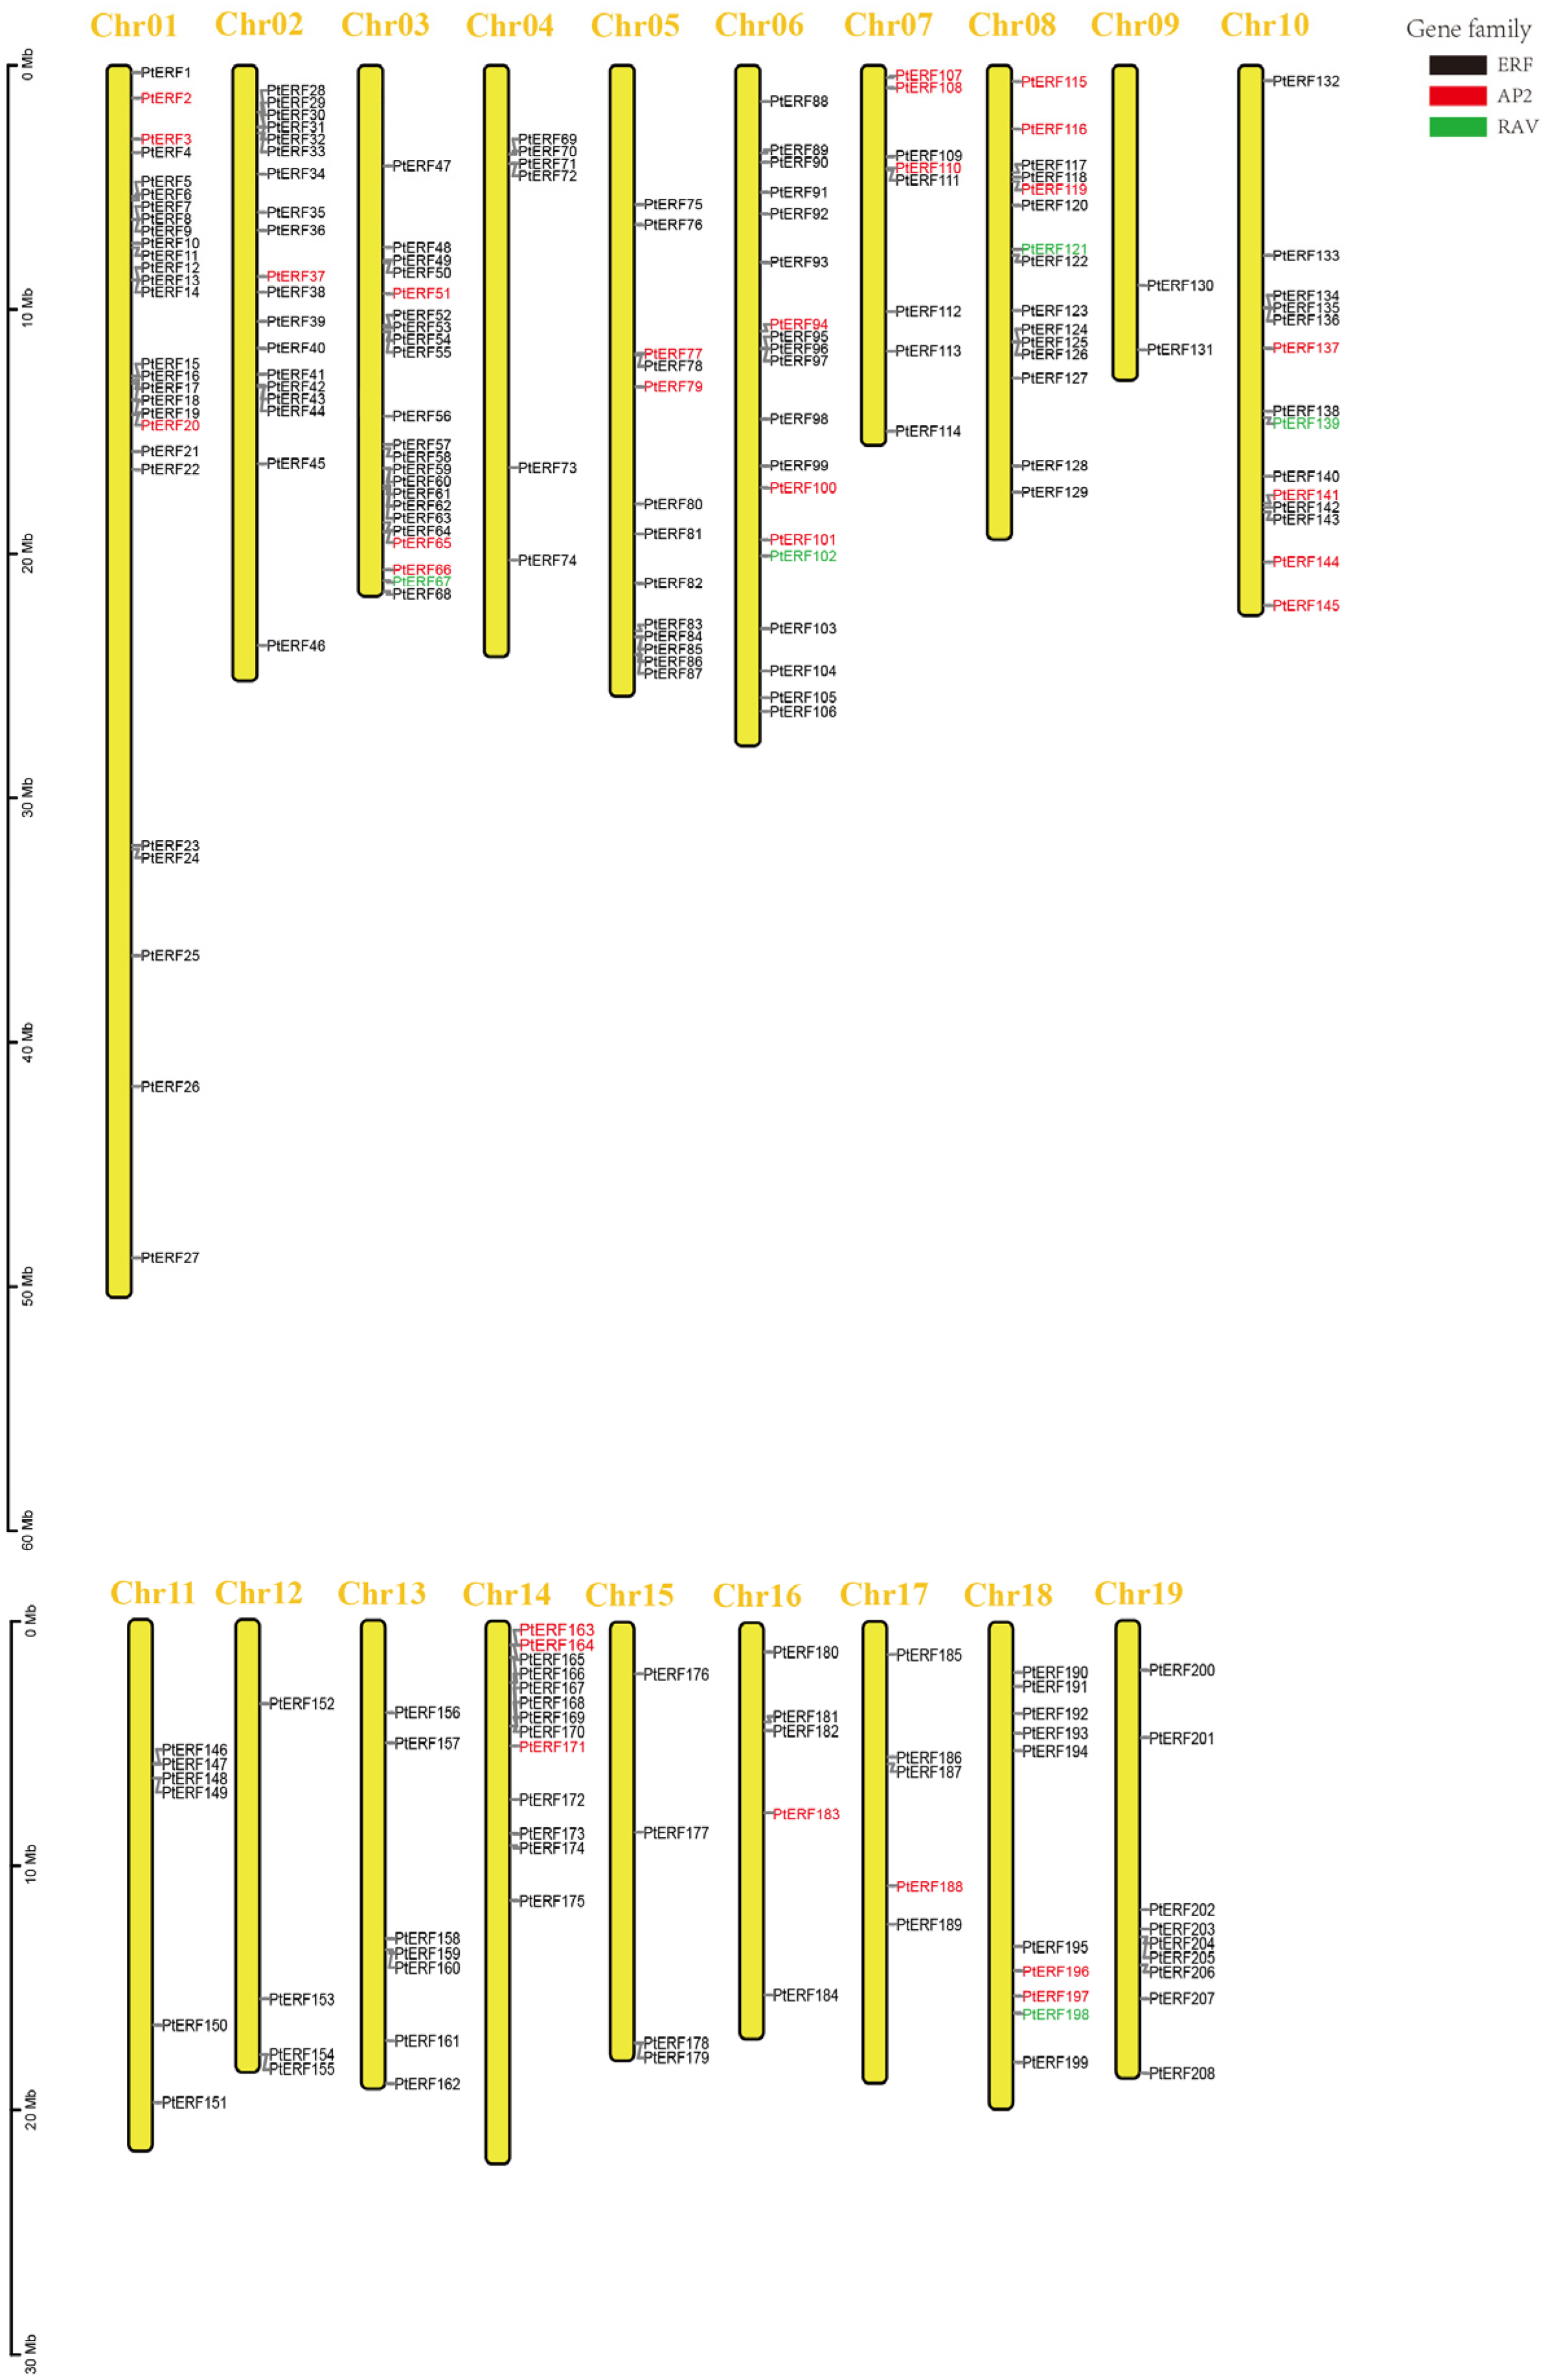
3.1. Identification and Physicochemical Properties of the PtERF Gene Family Members

Based on the results of BLASTP and HMMER, a total of 210 PtERF proteins were identified in the P. trichocarpa (V4.1) genome database, including 176 ERF subfamily members, 29 AP2 subfamily members, and 5 RAV subfamily members (Table S1). Among the 210 PtERFs, 208 PtERFs were unevenly distributed across all 19 chromosomes while two PtERFs were distributed on large segments in the P. trichocarpa genome (Figure 1). The 210 PtERFs were predominantly distributed on Chr01 (12.8%), Chr03 (10.5%), Chr06 (9.0%), and Chr08 (7.1%), with the least distribution on Chr09 (1.0%). The ERF subfamily members are distributed across all chromosomes, while AP2 subfamily members are found on all chromosomes except for Chr04, Chr09, Chr11, Chr12, Chr13, Chr15, and Chr19. RAV subfamily genes have a more scattered distribution, with five members located on Chr03, Chr06, Chr08, Chr10, and Chr18 (Figure 1).
The protein sequences of 210 PtERF gene family members underwent physicochemical analysis, revealing significant variations in terms of amino acid count, molecular weight, pI, and GRAVY (Table S1). The amino acid numbers of the 210 PtERF gene family members ranged from 111 aa (PtERF70) to 721 aa (PtERF119) (Table S1). It is noteworthy that the members of the AP2 subfamily exhibit a significant increase in amino acid length compared to those of the other two subfamilies. The molecular weight of the 210 PtERF gene family members ranged from 11.99 kDa (PtERF70) to 79.23 kDa (PtERF119) (Table S1). Among the 210 members of the PtERF family, 36.19% of the proteins exhibited pIs greater than 7, while 63.81% of proteins had values less than 7. These data indicate that the majority of PtERF family proteins are acidic proteins. Moreover, the GRAVY values for 210 PtERF family proteins were below 0, indicating that they are all hydrophilic proteins. Subcellular localization analyses of PtERFs revealed that 190 PtERF proteins were found in the nucleus, 16 in the chloroplast, 3 in the cytosol, and 1 in the mitochondrion (Table S1).

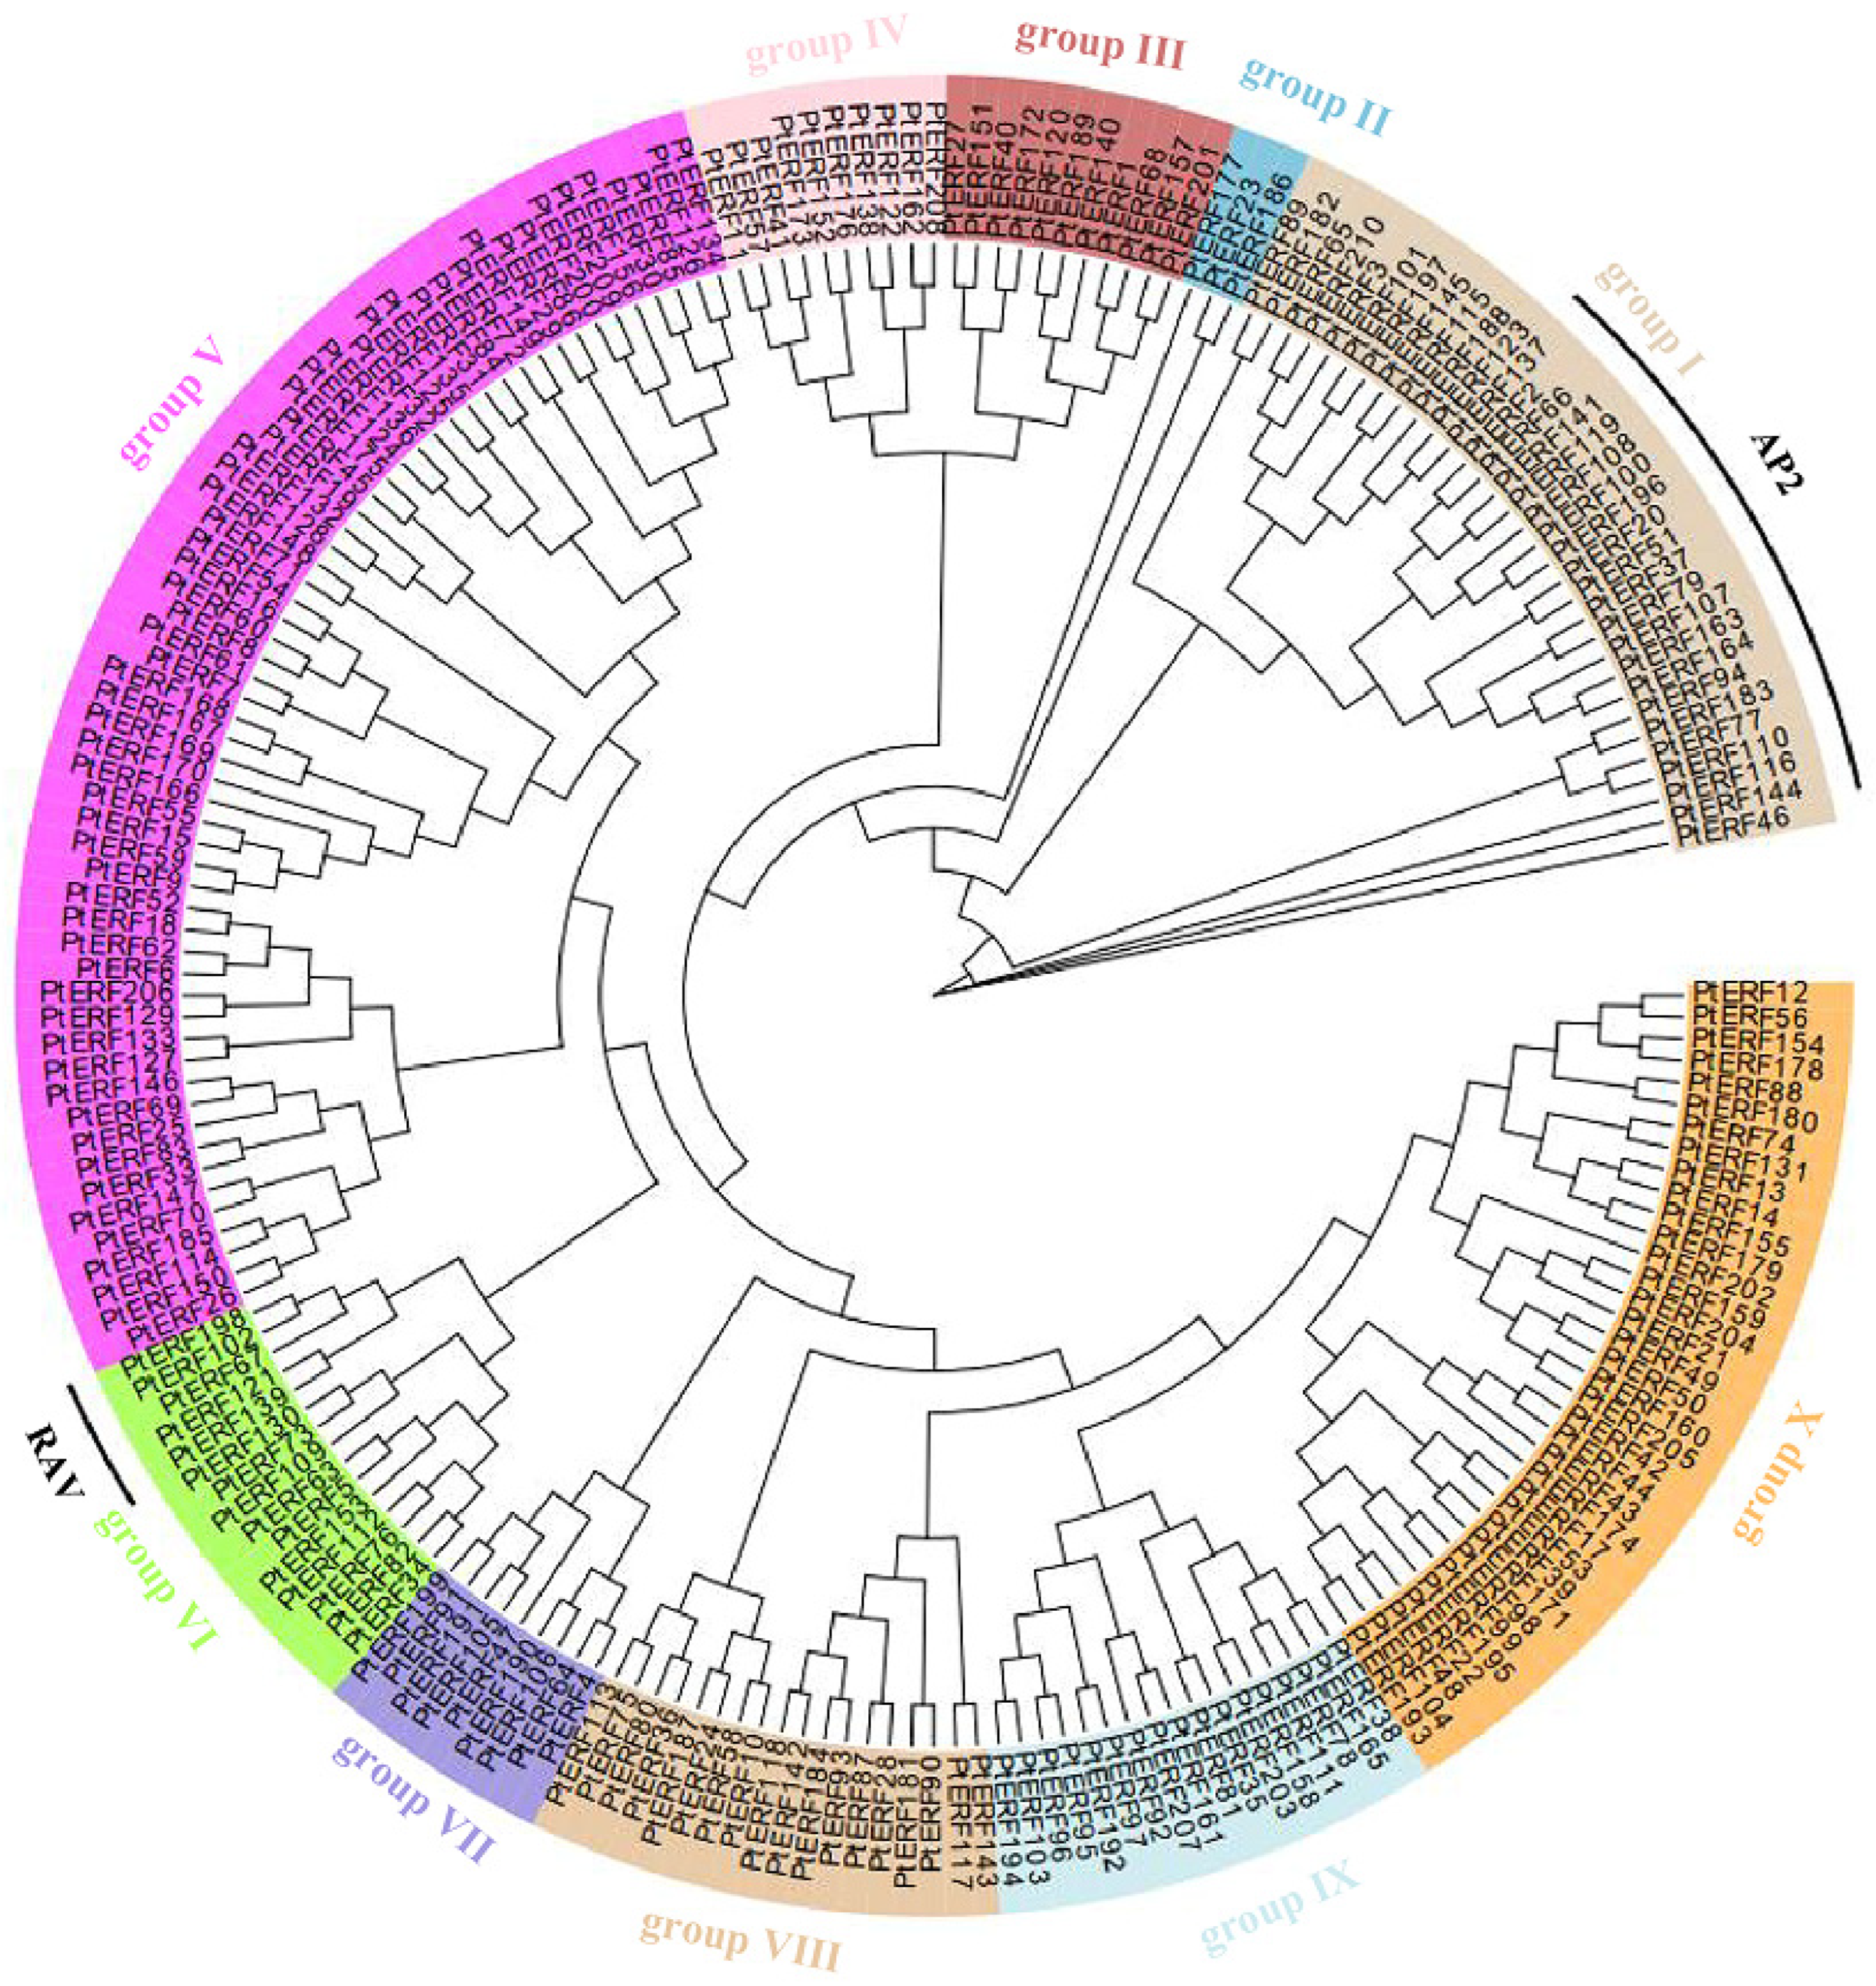
3.2. Phylogenetic and Structural Analysis of the PtERF Gene Family Members

A phylogenetic tree was constructed using 210 PtERF protein sequences to analyze their phylogenetic relationships (Figure 2). The 210 members of the PtERF gene family were categorized into 10 groups, labeled groups I to X, according to their phylogenetic relationships. Members of the ERF subfamily were distributed across these 10 groups, while all members of the AP2 subfamily were in group I, and members of RAV subfamily were in group VI (Figure 2). Group II contained the fewest proteins, and group V was the largest subgroup (59 members), followed by group X (35 members) and group VIII (33 members) (Figure 2). Groups IX and X were closely clustered together among these 10 groups, indicating a strong phylogenetic correlation between the two groups.
By analyzing the protein and gene sequences of PtERFs, the protein and gene structures of each member are depicted in Figure S1. Upon gene structure analysis, it was found that 64 genes in the PtERF family contain introns, with 36 genes (17%) comprising two or more introns (Figure S1). The members of the AP2 subfamily contained six or more introns and exons, which were characterized by relatively concise 5′ and 3′ untranslated regions (UTR) (Figure S1). All members of RAV subfamily, except for PtERF102, lack introns. Additionally, PtERF198 exhibits the longest 5′-UTR, while other members have either a short or absent 5′-UTR. Most members of the ERF subfamily contain only one exon without any introns. The analysis of protein structures demonstrates that the members of the AP2 subfamily contain two AP2 domains, members of the ERF subfamily contain only one AP2 domain, and the RAV subfamily members comprise one AP2 and one B3 domain (Figure S1).

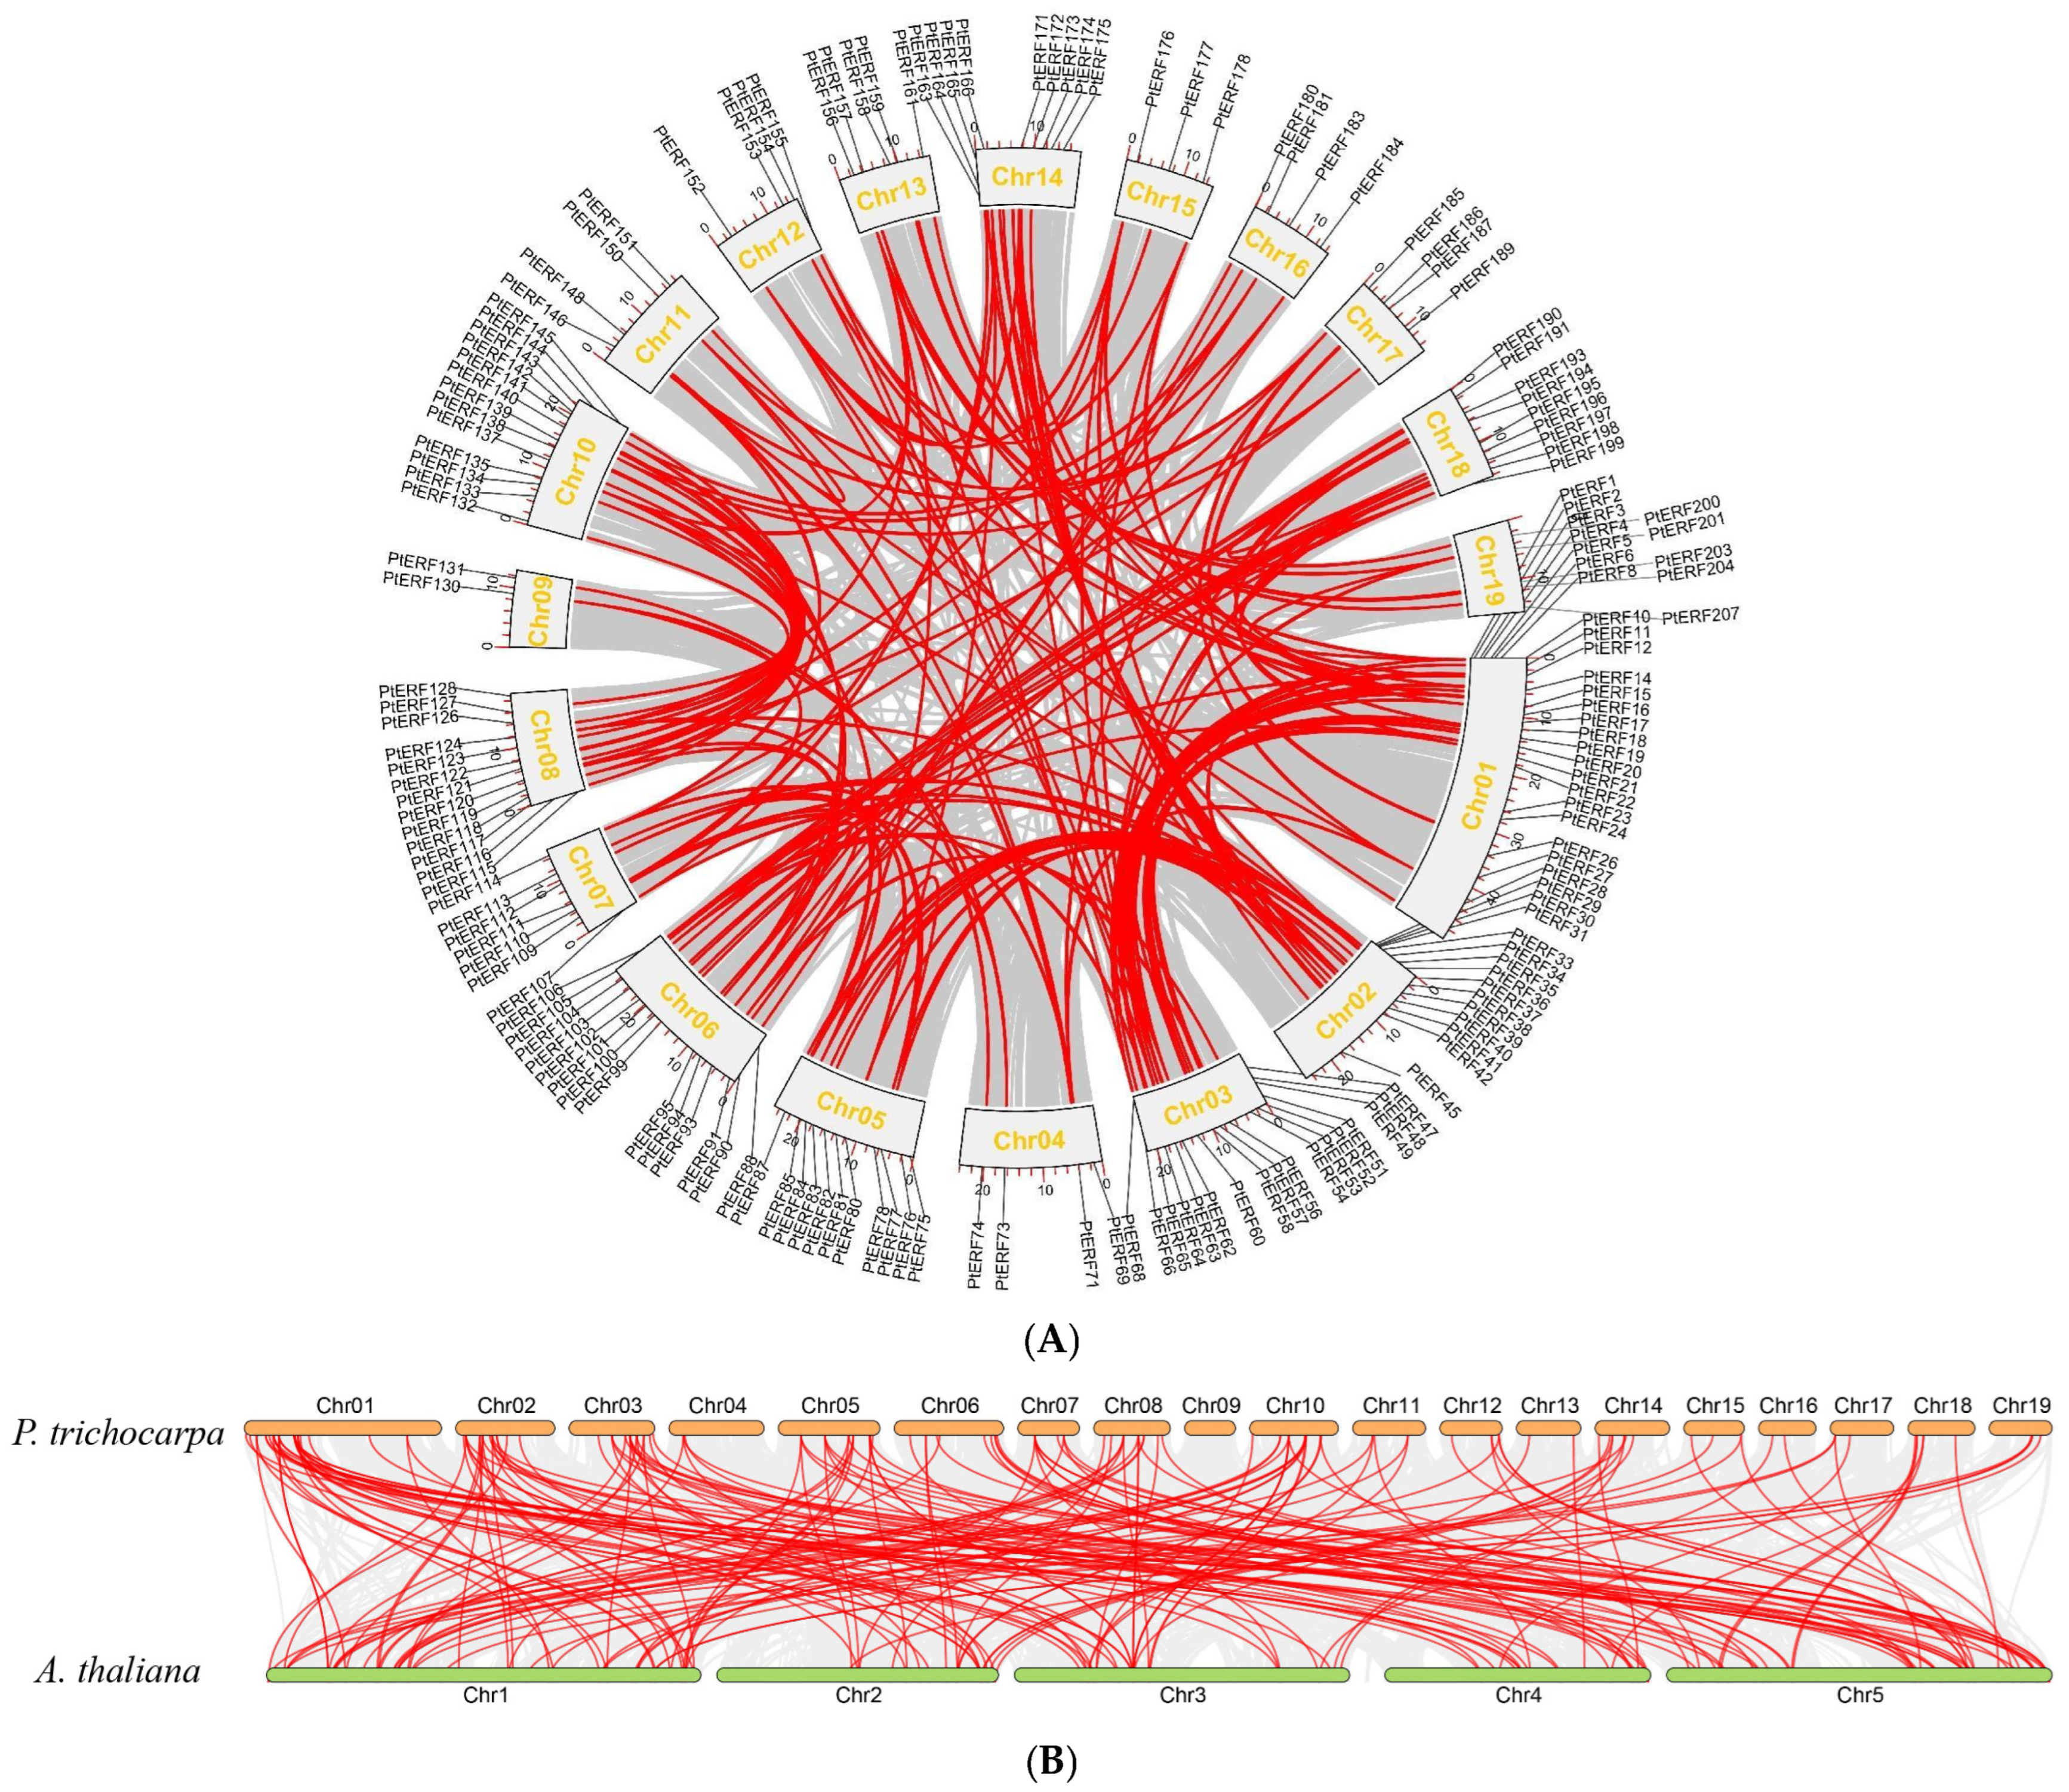
3.3. Duplication Events Analysis of PtERF Gene Family

To further explore the relationships among PtERF genes, we conducted gene pair calculation and collinearity analysis on PtERF family members (Figure 3A). A total of 168 duplicate pairs were identified among 161 PtERF genes, and all identified duplicates belonged to segmental duplications (Table S2). Each of PtERF11, PtERF22, PtERF29, PtERF41, PtERF57, PtERF69, PtERF85, PtERF126, PtERF134, PtERF146, PtERF152, PtERF156, PtERF173, PtERF176, PtERF185, PtERF195, and PtERF200 were involved in five segmental duplications (Table S2). In addition, repetitive events exclusively occurred within the same subfamily, with no instances of repetition detected across different subfamilies (Figure 3A). According to the calculation of 168 PtERF gene duplications, the Ka/Ks values ranged from 0.02 to 0.51 (Table S2), indicating that most PtERFs had undergone significant purifying selection in their evolutionary history. Furthermore, between 118 PtERF genes and 101 AtERF genes, a total of 200 duplicate pairs were detected (Figure 3B).

3.4. Cis-Acting Element Analysis of PtERF Gene Family

To investigate the potential regulation of PtERF genes, the cis-acting elements of PtERF promoters were analyzed (Figure 4, Table S3). The results showed that many cis-acting elements were associated with light response, phytohormone response, stress response, and plant growth and development (Figure 4A). As for plant growth and development elements, most PtERFs contain CAT-box and circadian motifs, which are involved in the meristem expression and circadian control, respectively (Figure 4A). For phytohormone response elements, most PtERFs contain ABRE, which is involved in abscisic acid response; CGTCA-motif and TGACG-motif, which are involved in the MeJA response; TGA-element, which is involved in auxin response; P-box, which is involved in gibberellin response; and TCA-element, which is involved in salicylic acid response. These results indicate that PtERFs might be regulated by multiple hormone-signaling pathways (Figure 4A). For light-response elements, most PtERFs contain GATA-motif, TCT-motif, G-box, GT1-motif, and Box 4, all of which are involved in light responsiveness, indicating that PtERFs may be regulated by light signaling (Figure 4A). For stress response elements, most PtERFs contain ARE motifs involved in anaerobic induction, MBS motifs involved in drought-inducibility, TC-rich repeats involved in defense and stress responsiveness, and LTR motifs involved in low-temperature responses, implying that PtERFs may be involved in multiple stress responses (Figure 4A). Among the detected cis-acting elements, light-responsive cis-acting elements constituted the largest proportion, ranging from approximately 20.83% to 81.82% of all cis-acting elements identified in PtERFs (Figure 4B). Additionally, the promoters of PtERF150, PtERF19, and PtERF183 contained 50, 45, and 43 cis-acting elements, respectively, suggest potential plentiful roles of these three genes in physiological processes. Taken together, the obtained data suggest that PtERFs play an important role in light response, phytohormone response, stress response, and plant growth and development.

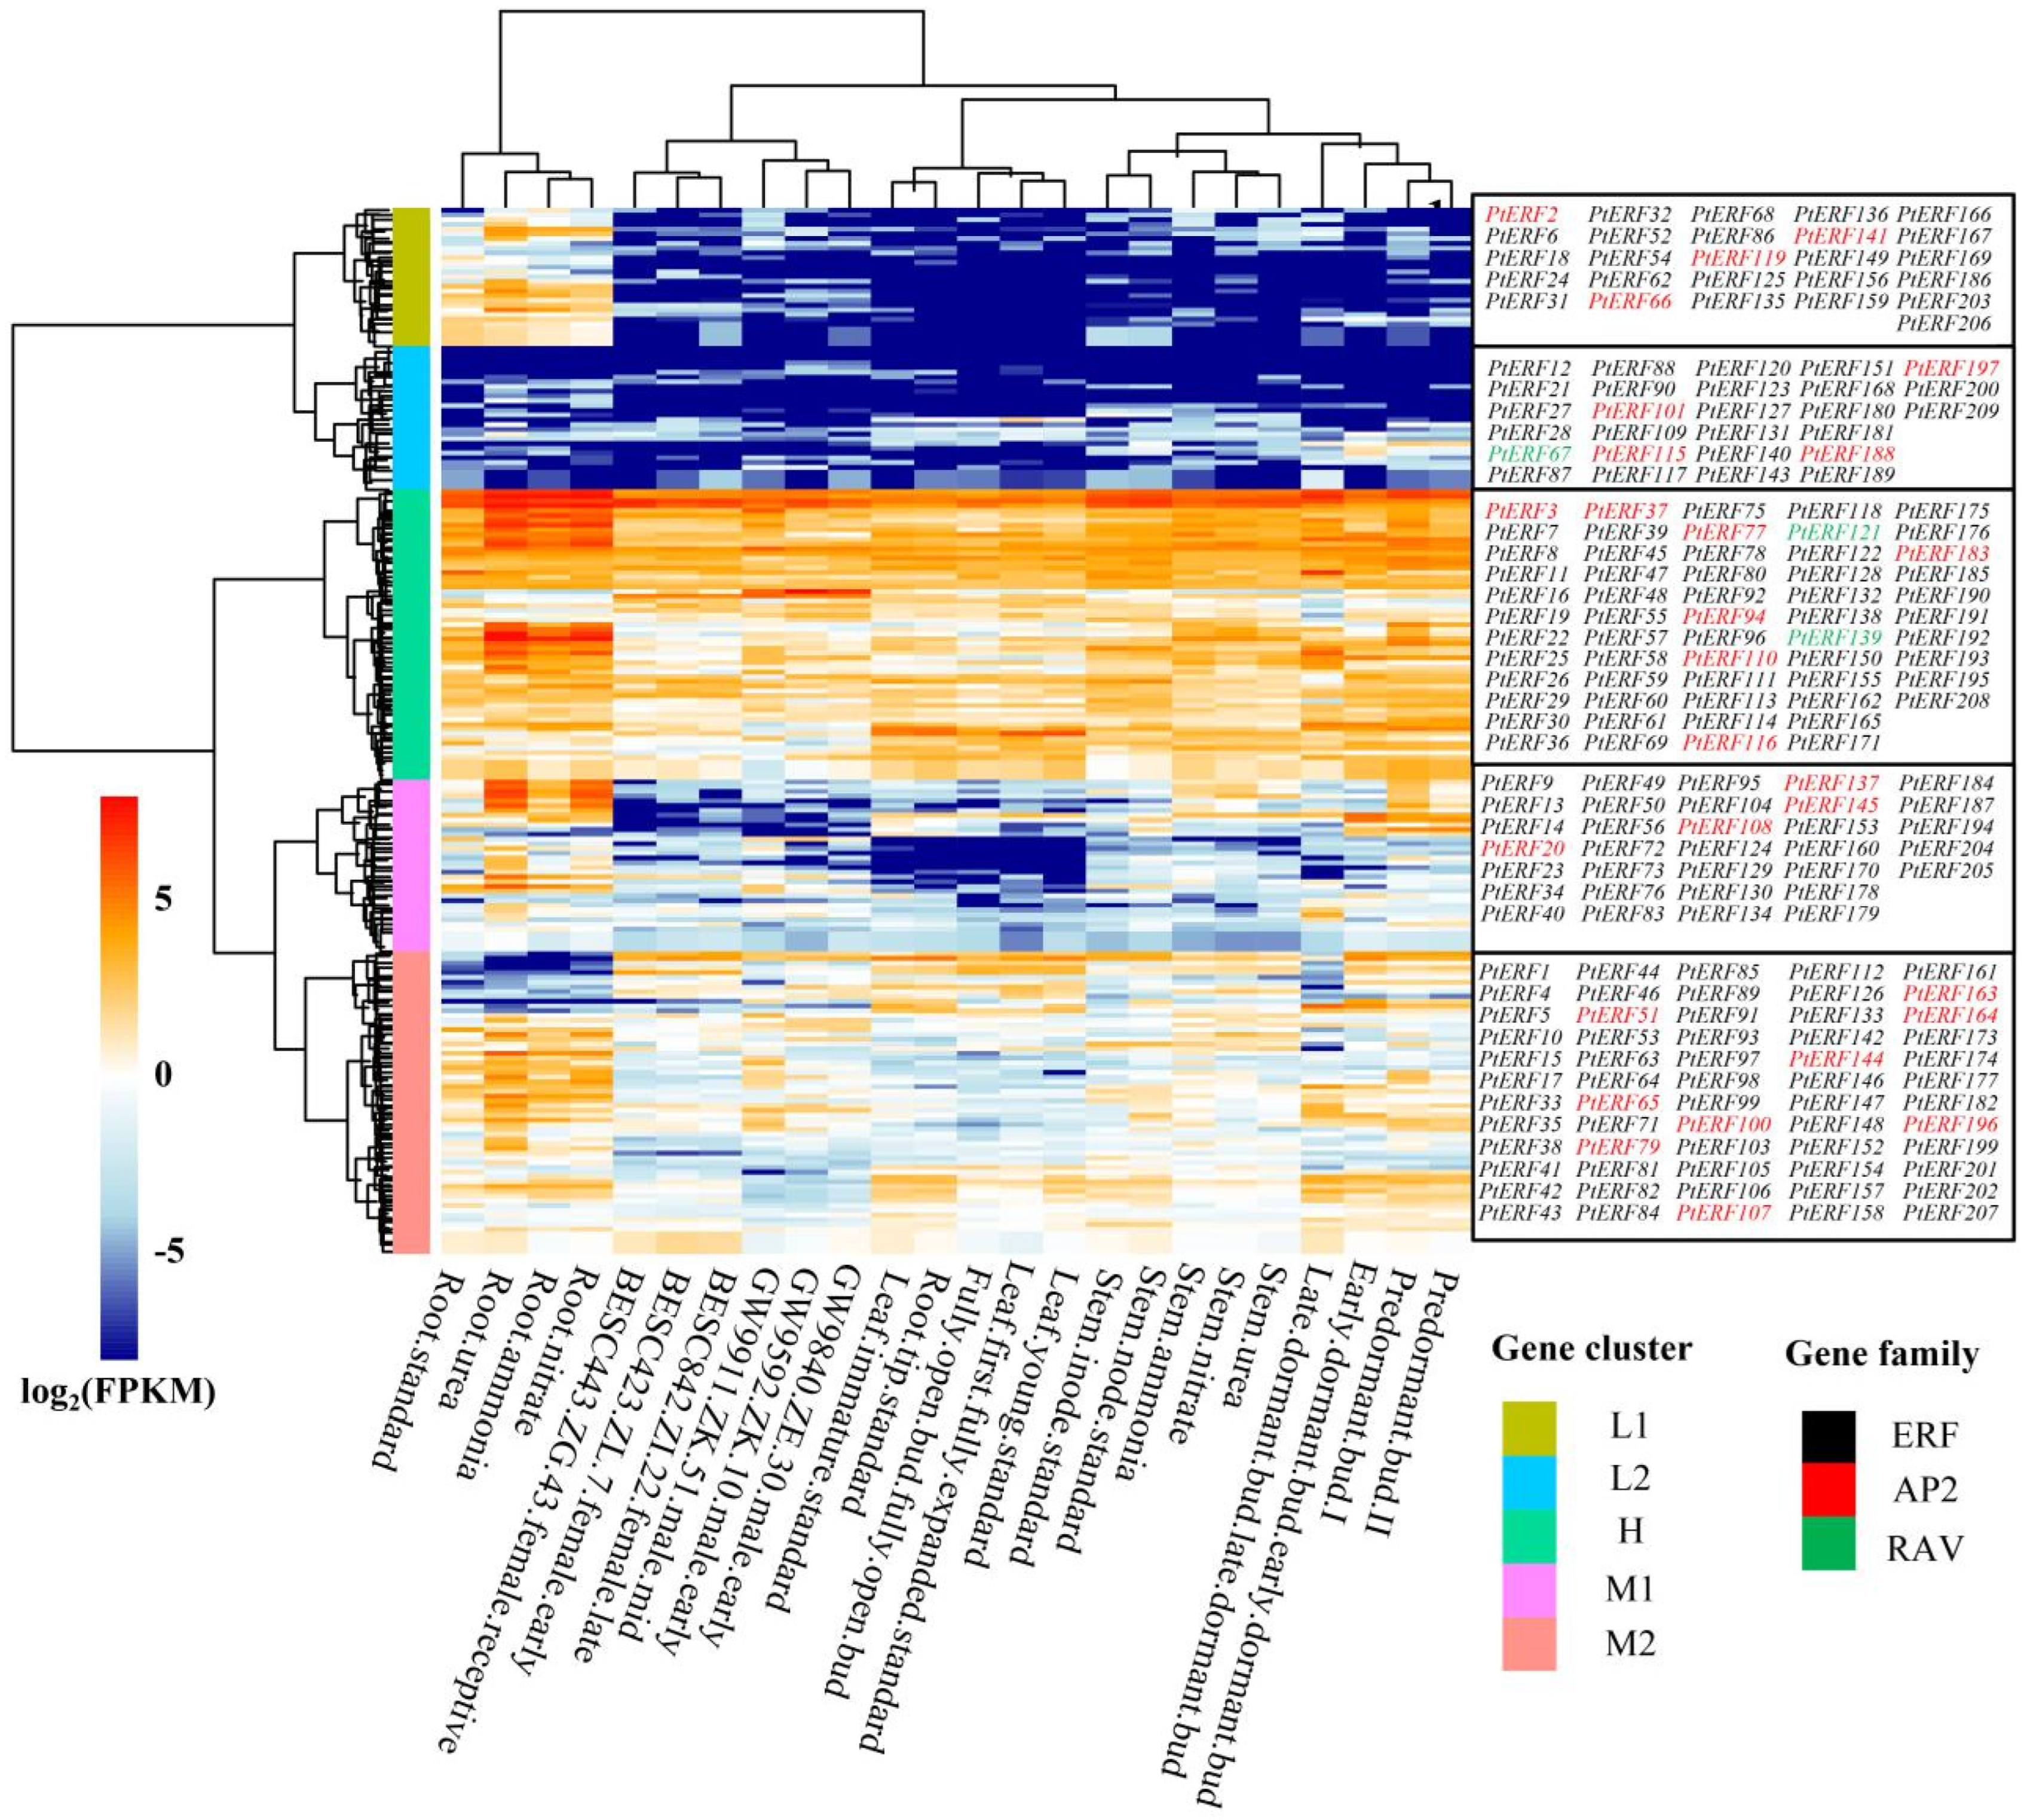
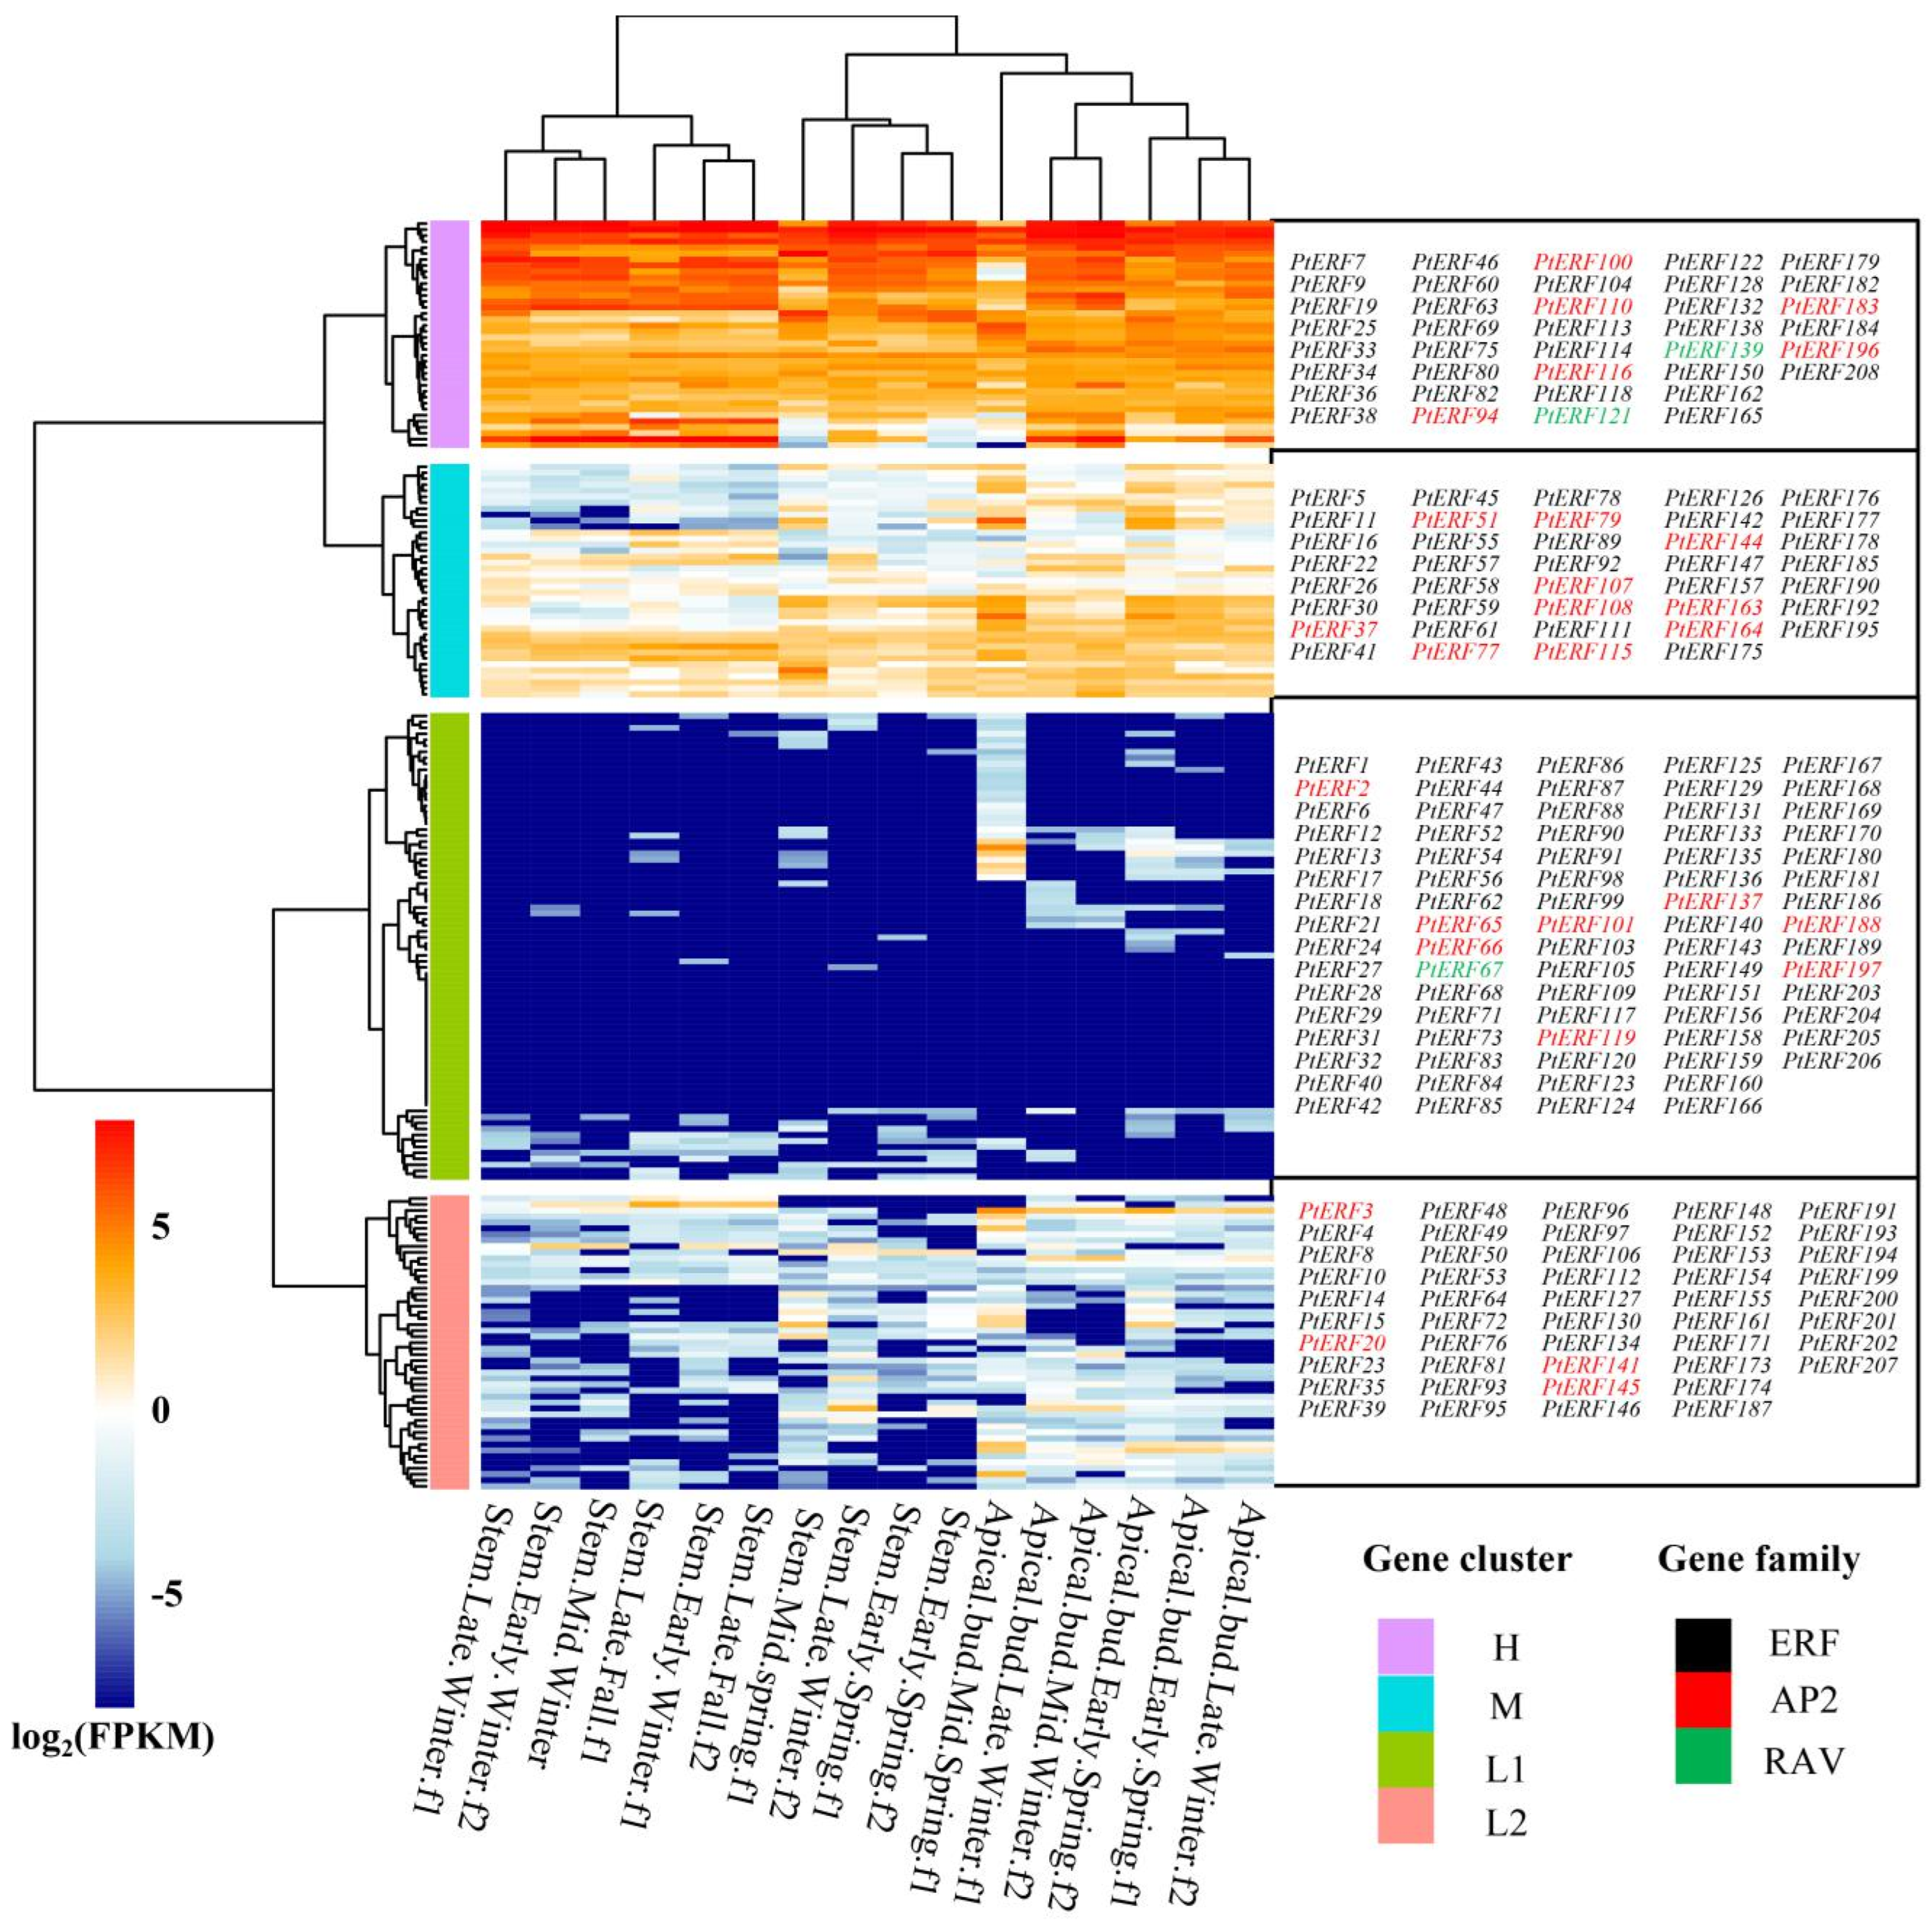
3.5. Tissue-Specific Expression Analysis of PtERF Genes in P. trichocarpa

The expression levels of the PtERF genes in different tissues, seasons, and treatments were derived from the Phytozome database (Figure 5). Based on the expression patterns of PtERF genes in different tissues under various N treatments, 210 PtERF genes were classified into low-expression clusters (L1 and L2), medium-expression clusters (M1 and M2), and a high-expression cluster (H) (Figure 5). The expression levels of PtERF genes in the roots were significantly higher compared to other tissues, while they exhibited relatively lower levels in young leaves and root tips, as observed in clusters L1, H, and M1 (Figure 5). Furthermore, among the various nitrogen treatments, the expression abundances of the PtERF genes in roots were found to be highest in the nitrate and urea treatment groups, while they exhibited the lowest levels in the control group (Figure 5). However, the expression of PtERF genes in stems was not altered among different nitrogen treatments (Figure 5). These results suggest that PtERF genes may be implicated in the nitrogen responses in poplar roots.
Similarly, the expression patterns of 210 PtERF genes in stems and apical buds were analyzed in different seasons. These genes were then divided into low-expression clusters (L1 and L2), a medium-expression cluster (M), and a high-expression cluster (H) based on their expression levels (Figure 6). The expression levels of PtERF genes in stems exhibited higher magnitudes compared to those in apical buds within the same season. The expression levels of the PtERF genes in apical buds were highest in mid-winter f2, gradually decreasing as the seasons transitioned to late winter f1, late winter f2, early spring f1, and early spring f2 before reaching the lowest point in mid-spring f1 (Figure 6). Interestingly, the expression of the PtERF genes in stems also exhibited seasonal variations. The expression profiles of PtERF in stems gradually increased during late autumn f1, early winter f1 and f2, and mid-winter and reached a peak in late winter f1. Subsequently, the expression levels declined gradually during late winter f2 and early spring f1 and f2, reaching their lowest levels in mid-spring f1 (Figure 6). These results indicate that the expression of PtERF genes is influenced by seasons, with the highest expression level observed in winter. It is speculated that low temperatures may induce the expression of the PtERFs genes.

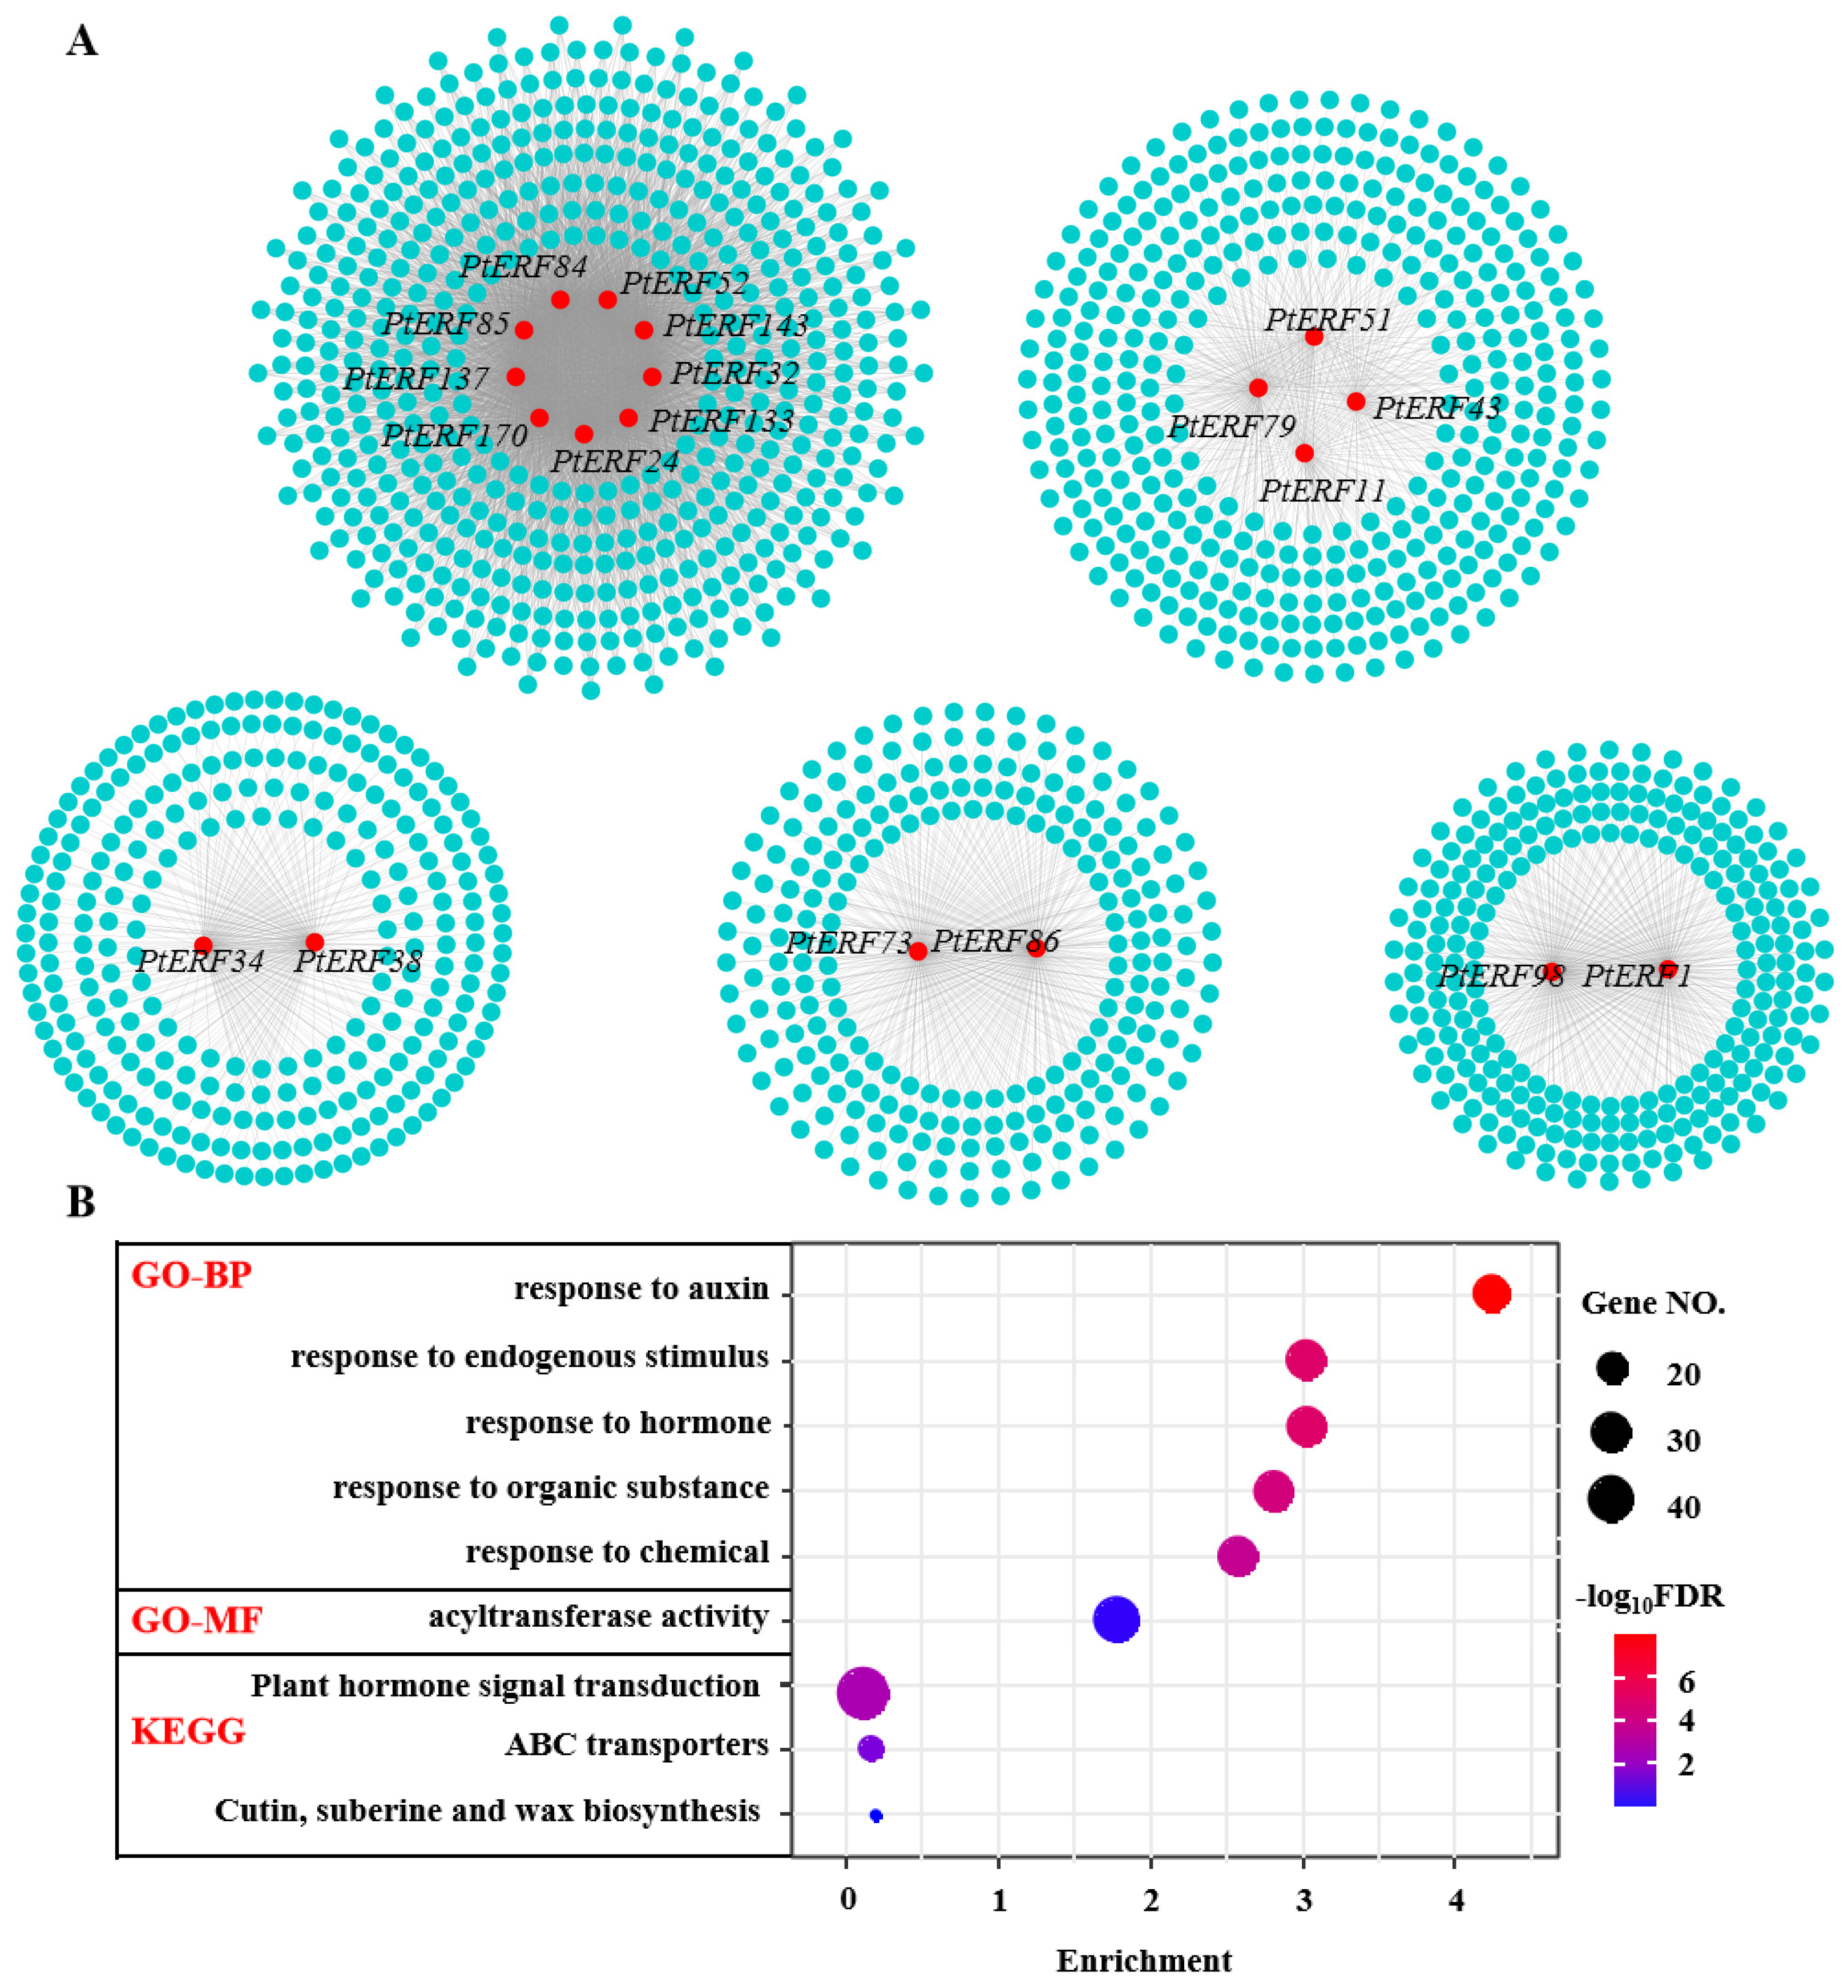
3.6. Co-Expression Analysis of PtERF Genes

A transcriptional co-expression network was constructed to uncover the potential biological functions played by PtERFs, which consisted of 1662 genes with 6440 interactions (Figure 7A). The co-expression network contained 19 PtERF genes and was clustered into five modules (Figure 7A). Among the 19 PtERF genes, PtERF51 and PtERF137 were classified as members of the AP2 subfamily, while the other 17 genes were categorized within the ERF subfamily. A total of 9 PtERFs (PtERF52, PtERF143, PtERF32, PtERF133, PtERF24, PtERF170, PtERF137, PtERF85, and PtERF84) and 514 co-expression genes formed the largest module (Figure 7A). Four PtERFs (PtERF51, PtERF79, PtERF11, and PtERF43) together with 384 co-expression genes formed the middle module. The three modules, consisting of PtERF34 and PtERF38, PtERF98 and PtERF1, and PtERF73 and PtERF86, respectively, encompassed a total of 262, 255, and 234 co-expressed genes. Interestingly, none of shared genes were observed within the five modules. The GO and KEGG enrichment analysis of genes in the PtERFs co-expression network shown in Figure 7B implied roles of the PtERFs in plant hormone signal transduction, acyltransferase activity, response to chemicals, response to organic substances, response to hormones, response to endogenous stimuli, and response to auxin.

4. Discussion

The ERF family, which is a prominent transcription factor family in plants, plays a pivotal role in responding to abiotic stress, regulating the synthesis of secondary metabolites, and plant growth and development. In this study, a total of 210 PtERF family members were identified in the P. trichocarpa genome, which is larger than that in other plant species such as Morus notabilis (106 ERF genes) [41], Arabidopsis (147 ERF genes) [6], Citrus junos (119 ERF genes) [59], Boehmeria nivea (138 ERF genes) [11], and Solanum melongena (178 ERF genes) [60]. The numerous members of the PtERF family may be attributed to gene duplication within the subfamily, although ERF family members have been identified in some poplar species, such as P. alba × P. glandulosa (209 ERF genes) [9] and P. trichocarpa (209 ERF genes) [13]. However, as sequencing technology advances, P. trichocarpa, as the first poplar species to be sequenced, has undergone repeated re-sequencing and refinement of its genome data, which might result in variations in the number of ERF family members within P. trichocarpa. For example, only 200 ERF genes were identified in P. trichocarpa according to the genome of black cottonwood version 1.1 [47]. In this study, 210 ERF genes were identified in P. trichocarpa based on the genome V4.1.
Physico-chemical analysis indicated that all PtERF proteins were hydrophilic, and the majority of them were acidic proteins (Table S1). The PtERF genes exhibited non-uniform distribution across the 19 chromosomes, with the highest prevalence observed on Chr01. The analyses of protein and gene structures revealed significant variations among the AP2, ERF, and RAV subfamilies in terms of amino acid length, as well as the number of exons and introns. The AP2 subfamily exhibited longer gene and amino acid sequences, with a noticeable increase in both exons and introns compared to the ERF and RAV subfamilies. Notably, the majority of ERF family members exhibited an absence of introns, which is consistent with previous research. Among the 122 ERF genes in Arabidopsis and the 155 ERF genes in potato, only 20 and 25 of the ERF genes possess introns, respectively [6]. The 5′-UTR and 3′-UTR of the AP2 subfamily exhibited relatively short lengths, while in the RAV subfamily, apart from PtERF198, which possessed a longer 5′-UTR, the remaining members displayed either extremely short or absent 5′-UTRs. Genes exhibiting similar gene and protein structures were predominantly observed within the same subfamily and phylogenetic group, thereby supporting the classification of PtERFs. Analysis of gene duplication events suggested that segmental duplications may have contributed to the expansion of the ERF gene family in P. trichocarpa, and PtERF genes may have originated from three different ancestors as duplication events occurring only within subfamilies. The Ka/Ks values of duplication pairs indicated that the PtERFs had undergone purifying selection in evolutionary history. Based on previous study, the functional divergence of PtERF genes predates the emergence of dicotyledonous and monocotyledonous plants [6]. In the course of evolution, purifying selection occurs when genes attain an optimized state to ensure stability in both structural domain sequences and functions, thereby upholding the consistency and constancy of gene function throughout the evolutionary process. Therefore, the PtERF genes may have reached the optimized state during evolution, suggesting a potential decrease in the number of family members in future evolutionary processes.
The association of ERF transcription factors with plant growth regulation, response to low temperature, and response to nutritional stress have been extensively demonstrated by numerous studies [24,34,38,61,62,63]. For instance, AtERF12 inhibited the accumulation of auxin, thereby modulating both root growth and leaf senescence [64]. In this study, most PtERF promoters contain ABRE, CGTCA-motif, TGACG-motif, TGA-element, P-box, and TCA-element, which are associated with phytohormone responsiveness; ARE, MBS, TC-rich repeats, and LTR are cis-acting elements associated with stress responses. These results showed that PtERF genes may be regulated to play a critical role in stress response. Additionally, the GO and KEGG analysis of co-expressed genes of PtERFs revealed a significant enrichment of genes involved in plant hormone signal transduction, response to auxin, response to hormones, and response to endogenous stimuli, suggesting that PtERFs potentially regulate plant growth through intricate hormonal signaling networks. The overexpression of ClRAP2.4, a member of the ERF transcription factor family, enhanced tolerance to low temperatures in Chrysanthemum lavandulifolium [61]. The season-specific expression of PtERF genes showed that the abundance of these PtERF genes was associated with seasons, with the highest levels in winter and the lowest levels in mid-spring. Hence, the induction of PtERF genes was speculated to be triggered by low temperatures, suggesting their potential involvement in response to cold stress [65,66]. Numerous ERF transcription factors were induced by nitrogen in rice and regulated leaf senescence [63]. Combined with the high expression of PtERF genes in roots treated with nitrate and urea, it was evident that PtERF genes may function in response to nitrogen. The tissue-specific expression analysis of PtERFs showed that the levels of PtERF genes were highly expressed in roots and varied significantly among different tissues, which was consistent with previous studies in longan [43] and tartary buckwheat [67].
Salt stress is one of the crucial environmental stresses that has a negative impact on plant growth and development [68]. In Arabidopsis, the aterf98 mutant exhibited sensitivity to salt stress, whereas the AtERF98-overexpressing plants demonstrated salt tolerance by activating ascorbic acid synthesis [69]. Additionally, some ERF genes have been demonstrated to augment salt stress tolerance, for example, ERF1-V in wheat [70], SlERF84 in tomato [71], AtERF34 in Arabidopsis [72], and ERF38 in 84K poplar [73]. The co-expression network demonstrated that PtERF98 and PtERF1, as well as PtERF34 and PtERF38, regulated the expression of 262 and 255 related genes, respectively. These findings suggest that PtERF34, PtERF38, PtERF98, and PtERF1 may enhance plant salt tolerance by regulating the expression of these co-expressed genes.

5. Conclusions

A total of 210 PtERF genes were identified in the P. trichocarpa genome, which exhibited an uneven distribution across all 19 chromosomes, with the majority (90.5%) located in the nucleus. A total of 168 gene duplication events were identified in the PtERF gene family, all of which were categorized as fragment duplications. The Ka/Ks values for all duplicated gene pairs were less than 1, indicating a prevalence of purifying selection during evolution. Numerous cis-acting elements were identified, which were involved in responses to light, phytohormones, and stress, as well as in plant growth and development. Transcriptional analysis revealed diverse gene expression profiles of the PtERF gene family in response to disparate environmental stresses in different tissues. The expression levels of the PtERF genes were highest in roots compared to other tissues. Additionally, the expression of PtERF genes can be induced by nitrate, urea, and low temperature. The co-expression network centered on PtERF genes revealed that these PtERFs play crucial roles in multiple biological processes, including plant hormone signal transduction, acyltransferase activity, responses to chemical and organic substances, hormonal responses, responses to endogenous stimuli, and auxin signaling. These results lay a foundation for investigating the roles of PtERFs in response to nitrogen and environmental stress.

Supplementary Materials

The following supporting information can be downloaded at: https://www.mdpi.com/article/10.3390/life15040550/s1, Figure S1. The analysis of gene structure and conserved domain of ERFs in P. trichocarpa; Table S1. Physicochemical properties and subcellular localizations of the PtERF gene family; Table S2. The Ka/Ks ratio of duplicated PtERF genes; Table S3. The cis-acting element analysis of PtERFs in 2 kb promoter region.

Author Contributions

Conceptualization, S.D.; methodology, R.F., D.Z. and Y.L.; software, M.L., J.Z. and Q.C.; investigation and data curation, Y.C. and C.Y.; writing—original draft preparation, M.L., J.Z. and Q.C.; writing—review and editing, M.L., W.H. and S.D.; visualization, M.L., J.Z. and Q.C.; funding acquisition, S.D. All authors have read and agreed to the published version of the manuscript.

Funding

This study was jointly supported by the National Natural Science Foundation of China (Grant No. 32001347), the Henan Provincial Science and Technology Research Project (Grant No. 212102110190), and the Guangdong Basic and Applied Basic Research Foundation (grant no. 2022A1515012038).

Institutional Review Board Statement

Not applicable.

Informed Consent Statement

Not applicable.

Data Availability Statement

Data are contained within the article and Supplementary Materials.

Conflicts of Interest

The authors declare no conflicts of interest.

References

  1. Singh, K.B.; Foley, R.C.; Oate-Sánchez, L. Transcription factors in plant defense and stress responses. Curr. Opin. Plant Biol. 2002, 5, 430–436. [Google Scholar] [CrossRef] [PubMed]
  2. Lim, J.; Lim, C.W.; Lee, S.C. Role of pepper MYB transcription factor CaDIM1 in regulation of the drought response. Front. Plant Sci. 2022, 13, 1028392. [Google Scholar] [CrossRef] [PubMed]
  3. Yang, K.; Dong, Q.; Wu, J.; Li, H.; Luan, H.; Jia, P.; Zhang, X.; Guo, S.; Yang, M.; Qi, G. Genome-wide analysis of the R2R3-MYB transcription factor gene family expressed in Juglans regia under abiotic and biotic stresses. Ind. Crop. Prod. 2023, 198, 116709. [Google Scholar] [CrossRef]
  4. Martins Cde, P.; Pedrosa, A.M.; Du, D.; Goncalves, L.P.; Yu, Q.; Gmitter, F.G., Jr.; Costa, M.G. Genome-Wide Characterization and Expression Analysis of Major Intrinsic Proteins during Abiotic and Biotic Stresses in Sweet Orange (Citrus sinensis L. Osb.). PLoS ONE 2015, 10, e0138786. [Google Scholar] [CrossRef]
  5. Yu, Y.; Yu, M.; Zhang, S.; Song, T.; Zhang, M.; Zhou, H.; Wang, Y.; Xiang, J.; Zhang, X. Transcriptomic Identification of Wheat AP2/ERF Transcription Factors and Functional Characterization of TaERF-6-3A in Response to Drought and Salinity Stresses. Int. J. Mol. Sci. 2022, 23, 3272. [Google Scholar] [CrossRef]
  6. Nakano, T.; Suzuki, K.; Fujimura, T.; Shinshi, H. Genome-Wide Analysis of the ERF Gene Family in Arabidopsis and Rice. Plant Physiol. 2006, 140, 411–432. [Google Scholar] [CrossRef]
  7. Wang, K.; Guo, H.; Yin, Y. AP2/ERF transcription factors and their functions in Arabidopsis responses to abiotic stresses. Environ. Exp. Bot. 2024, 222, 105763. [Google Scholar] [CrossRef]
  8. Ma, Z.; Hu, L.; Jiang, W. Understanding AP2/ERF Transcription Factor Responses and Tolerance to Various Abiotic Stresses in Plants: A Comprehensive Review. Int. J. Mol. Sci. 2024, 25, 893. [Google Scholar] [CrossRef]
  9. Zeng, D.; Dai, L.J.; Li, X.; Li, W.; Qu, G.Z.; Li, S. Genome-Wide Identification of the ERF Transcription Factor Family for Structure Analysis, Expression Pattern, and Response to Drought Stress in Populus alba × Populus glandulosa. Int. J. Mol. Sci. 2023, 24, 3697. [Google Scholar] [CrossRef]
  10. Xu, Y.; Li, X.; Yang, X.; Wassie, M.; Shi, H. Genome-wide identification and molecular characterization of the AP2/ERF superfamily members in sand pear (Pyrus pyrifolia). BMC Genom. 2023, 24, 32. [Google Scholar] [CrossRef]
  11. Qiu, X.; Zhao, H.; Abubakar, A.S.; Shao, D.; Chen, J.; Chen, P.; Yu, C.; Wang, X.; Chen, K.; Zhu, A. Genome-Wide Analysis of AP2/ERF Gene Superfamily in Ramie (Boehmeria nivea L.) Revealed Their Synergistic Roles in Regulating Abiotic Stress Resistance and Ramet Development. Int. J. Mol. Sci. 2022, 23, 15117. [Google Scholar] [CrossRef] [PubMed]
  12. Wu, Y.; Zhang, L.; Nie, L.; Zheng, Y.; Zhu, S.; Hou, J.; Li, R.; Chen, G.; Tang, X.; Wang, C.; et al. Genome-wide analysis of the DREB family genes and functional identification of the involvement of BrDREB2B in abiotic stress in wucai (Brassica campestris L.). BMC Genom. 2022, 23, 598. [Google Scholar] [CrossRef]
  13. Wang, S.; Yao, W.; Zhou, B.; Jiang, T. Structure analysis and expression pattern of the ERF transcription factor family in poplar. Acta Physiol. Plant. 2016, 38, 239. [Google Scholar] [CrossRef]
  14. Zhao, M.; Haxim, Y.; Liang, Y.; Qiao, S.; Gao, B.; Zhang, D.; Li, X. Genome-wide investigation of AP2/ERF gene family in the desert legume Eremosparton songoricum: Identification, classification, evolution, and expression profiling under drought stress. Front. Plant Sci. 2022, 13, 885694. [Google Scholar] [CrossRef]
  15. Li, N.; Niu, Y.; Wang, X.; Wang, S.; Chen, Y.; Wang, L. A novel eggplant AP2/ERF transcription factor StPti5 confers resistance to Verticillium wilt across different species. Plant Protect. Sci. 2023, 59, 325–336. [Google Scholar] [CrossRef]
  16. Jisha, V.; Dampanaboina, L.; Vadassery, J.; Mithofer, A.; Kappara, S.; Ramanan, R. Overexpression of an AP2/ERF Type Transcription Factor OsEREBP1 Confers Biotic and Abiotic Stress Tolerance in Rice. PLoS ONE 2015, 10, e0127831. [Google Scholar] [CrossRef]
  17. Ma, Z.; Jin, Y.M.; Wu, T.; Hu, L.; Zhang, Y.; Jiang, W.; Du, X. OsDREB2B, an AP2/ERF transcription factor, negatively regulates plant height by conferring GA metabolism in rice. Front. Plant Sci. 2022, 13, 1007811. [Google Scholar] [CrossRef]
  18. Ma, Z.; Wu, T.; Huang, K.; Jin, Y.M.; Li, Z.; Chen, M.; Yun, S.; Zhang, H.; Yang, X.; Chen, H.; et al. A Novel AP2/ERF Transcription Factor, OsRPH1, Negatively Regulates Plant Height in Rice. Front. Plant Sci. 2020, 11, 709. [Google Scholar] [CrossRef]
  19. Xie, Z.; Nolan, T.M.; Jiang, H.; Yin, Y. AP2/ERF Transcription Factor Regulatory Networks in Hormone and Abiotic Stress Responses in Arabidopsis. Front. Plant Sci. 2019, 10, 228. [Google Scholar] [CrossRef]
  20. Yoon, Y.; Seo, D.H.; Shin, H.; Kim, H.J.; Kim, C.M.; Jang, G. The Role of Stress-Responsive Transcription Factors in Modulating Abiotic Stress Tolerance in Plants. Agronomy 2020, 10, 788. [Google Scholar] [CrossRef]
  21. Zwack, P.J.; Rashotte, A.M. Interactions between cytokinin signalling and abiotic stress responses. J. Exp. Bot. 2015, 66, 4863–4871. [Google Scholar] [CrossRef] [PubMed]
  22. Mohanty, B. Genomic architecture of promoters and transcriptional regulation of candidate genes in rice involved in tolerance to anaerobic germination. Curr. Plant Biol. 2022, 29, 100236. [Google Scholar] [CrossRef]
  23. Li, J.; Guo, X.; Zhang, M.; Wang, X.; Zhao, Y.; Yin, Z.; Zhang, Z.; Wang, Y.; Xiong, H.; Zhang, H.; et al. OsERF71 confers drought tolerance via modulating ABA signaling and proline biosynthesis. Plant Sci. 2018, 270, 131–139. [Google Scholar] [CrossRef] [PubMed]
  24. Cai, X.; Chen, Y.; Wang, Y.; Shen, Y.; Yang, J.; Jia, B.; Sun, X.; Sun, M. A comprehensive investigation of the regulatory roles of OsERF096, an AP2/ERF transcription factor, in rice cold stress response. Plant Cell Rep. 2023, 42, 2011–2022. [Google Scholar] [CrossRef]
  25. Zhuang, J.; Jiang, H.-H.; Wang, F.; Peng, R.-H.; Yao, Q.-H.; Xiong, A.-S. A Rice OsAP23, Functioning as an AP2/ERF Transcription Factor, Reduces Salt Tolerance in Transgenic Arabidopsis. Plant Mol. Biol. Rep. 2013, 31, 1336–1345. [Google Scholar] [CrossRef]
  26. Chen, C.; Zhang, Z.; Lei, Y.; Chen, W.; Zhang, Z.; Dai, H. The transcription factor MdERF023 negatively regulates salt tolerance by modulating ABA signaling and Na+/H+ transport in apple. Plant Cell Rep. 2024, 43, 187. [Google Scholar] [CrossRef]
  27. Golldack, D.; Li, C.; Mohan, H.; Probst, N. Tolerance to drought and salt stress in plants: Unraveling the signaling networks. Front. Plant Sci. 2014, 5, 151. [Google Scholar] [CrossRef]
  28. Fu, J.; Zhu, C.; Wang, C.; Liu, L.; Shen, Q.; Xu, D.; Wang, Q. Maize transcription factor ZmEREB20 enhanced salt tolerance in transgenic Arabidopsis. Plant Physiol. Biochem. 2021, 159, 257–267. [Google Scholar] [CrossRef]
  29. Yang, Y.; Shi, J.; Chen, L.; Xiao, W.; Yu, J. ZmEREB46, a maize ortholog of Arabidopsis WAX INDUCER1/SHINE1, is involved in the biosynthesis of leaf epicuticular very-long-chain waxes and drought tolerance. Plant Sci. 2022, 321, 111256. [Google Scholar] [CrossRef]
  30. Zhu, Y.; Liu, Y.; Zhou, K.; Tian, C.; Aslam, M.; Zhang, B.; Liu, W.; Zou, H. Overexpression of ZmEREBP60 enhances drought tolerance in maize. J. Plant Physiol. 2022, 275, 153763. [Google Scholar] [CrossRef]
  31. Yu, F.; Liang, K.; Fang, T.; Zhao, H.; Han, X.; Cai, M.; Qiu, F. A group VII ethylene response factor gene, ZmEREB180, coordinates waterlogging tolerance in maize seedlings. Plant Biotechnol. J. 2019, 17, 2286–2298. [Google Scholar] [CrossRef] [PubMed]
  32. Lu, Y.; Zheng, B.; Zhang, C.; Yu, C.; Luo, J. Wood formation in trees responding to nitrogen availability. Ind. Crop. Prod. 2024, 218, 118978. [Google Scholar] [CrossRef]
  33. Luo, J.; Havé, M.; Clément, G.; Tellier, F.; Balliau, T.; Launay-Avon, A.; Guérard, F.; Zivy, M.; Masclaux-Daubresse, C. Integrating multiple omics to identify common and specific molecular changes occurring in Arabidopsis under chronic nitrate and sulfate limitations. J. Exp. Bot. 2020, 71, 6471–6490. [Google Scholar] [CrossRef]
  34. Xia, P.; Zhang, Y.; Zhang, X. The Potential Relevance of PnDREBs to Panax notoginseng Nitrogen Sensitiveness. Biochem. Genet. 2024, 62, 2631–2651. [Google Scholar] [CrossRef]
  35. Joshi, V.; Joshi, M.; Penalosa, A. Comparative analysis of tissue-specific transcriptomic responses to nitrogen stress in spinach (Spinacia oleracea). PLoS ONE 2020, 15, e0232011. [Google Scholar] [CrossRef]
  36. Li, Z.; Deng, S.; Zhu, D.; Wu, J.; Zhou, J.; Shi, W.; Fayyaz, P.; Luo, Z.-B.; Luo, J. Proteomic reconfigurations underlying physiological alterations in poplar roots in acclimation to changing nitrogen availability. Environ. Exp. Bot. 2023, 211, 105367. [Google Scholar] [CrossRef]
  37. Zhang, T.T.; Lin, Y.J.; Liu, H.F.; Liu, Y.Q.; Zeng, Z.F.; Lu, X.Y.; Li, X.W.; Zhang, Z.L.; Zhang, S.; You, C.X.; et al. The AP2/ERF transcription factor MdDREB2A regulates nitrogen utilisation and sucrose transport under drought stress. Plant Cell Environ. 2024, 47, 1668–1684. [Google Scholar] [CrossRef]
  38. Wu, Q.; Xu, J.; Zhao, Y.; Wang, Y.; Zhou, L.; Ning, L.; Shabala, S.; Zhao, H. Transcription factor ZmEREB97 regulates nitrate uptake in maize (Zea mays) roots. Plant Physiol. 2024, 1, 535–550. [Google Scholar] [CrossRef]
  39. Iniguez, L.P.; Nova-Franco, B.; Hernandez, G. Novel players in the AP2-miR172 regulatory network for common bean nodulation. Plant Signal. Behav. 2015, 10, e1062957. [Google Scholar] [CrossRef]
  40. Choudhury, S. Computational analysis of the AP2/ERF family in crops genome. BMC Genom. 2024, 25, 102. [Google Scholar] [CrossRef]
  41. Dou, H.; Wang, T.; Zhou, X.; Feng, X.; Tang, W.; Quan, J.e.; Bi, H. Genome-Wide Identification and Expression of the AP2/ERF Gene Family in Morus notabilis. Forests 2024, 15, 697. [Google Scholar] [CrossRef]
  42. Chen, G.; Shao, T.; Zhou, Y.; Chen, F.; Zhang, D.; Gu, H.; Yue, Y.; Wang, L.; Yang, X. Analysis of the Aging-Related AP2/ERF Transcription Factor Gene Family in Osmanthus fragrans. Int. J. Mol. Sci. 2024, 25, 8025. [Google Scholar] [CrossRef] [PubMed]
  43. Zhang, S.; Zhu, C.; Lyu, Y.; Chen, Y.; Zhang, Z.; Lai, Z.; Lin, Y. Genome-wide identification, molecular evolution, and expression analysis provide new insights into the APETALA2/ethylene responsive factor (AP2/ERF) superfamily in Dimocarpus longan Lour. BMC Genom. 2020, 21, 62. [Google Scholar] [CrossRef]
  44. Zhang, K.; Jiang, L.; Wang, X.; Han, H.; Chen, D.; Qiu, D.; Yang, Y. Transcriptome-wide analysis of AP2/ERF transcription factors involved in regulating Taxol biosynthesis in Taxus × media. Ind. Crop. Prod. 2021, 171, 113972. [Google Scholar] [CrossRef]
  45. Li, Z.; Guan, L.; Zhang, C.; Zhang, S.; Liu, Y.; Lu, Y.; Luo, J. Nitrogen assimilation genes in poplar: Potential targets for improving tree nitrogen use efficiency. Ind. Crop. Prod. 2024, 216, 118705. [Google Scholar] [CrossRef]
  46. Zhang, Y.; Tian, Y.; Ding, S.; Lv, Y.; Samjhana, W.; Fang, S. Growth, Carbon Storage, and Optimal Rotation in Poplar Plantations: A Case Study on Clone and Planting Spacing Effects. Forests 2020, 11, 842. [Google Scholar] [CrossRef]
  47. Zhuang, J.; Cai, B.; Peng, R.H.; Zhu, B.; Jin, X.F.; Xue, Y.; Gao, F.; Fu, X.Y.; Tian, Y.S.; Zhao, W.; et al. Genome-wide analysis of the AP2/ERF gene family in Populus trichocarpa. Biochem. Biophys. Res. Commun. 2008, 371, 468–474. [Google Scholar] [CrossRef]
  48. Tuskan, G.; Difazio, S.; Jansson, S.; Bohlmann, J.; Grigoriev, I.; Hellsten, U.; Putnam, N.; Ralph, S.; Rombauts, S.; Salamov, A. The Genome of Black Cottonwood, Populus trichocarpa (Torr. & Gray). Science 2006, 313, 1596–1604. [Google Scholar] [CrossRef]
  49. Luo, J.; Liang, Z.; Wu, M.; Mei, L. Genome-wide identification of BOR genes in poplar and their roles in response to various environmental stimuli. Environ. Exp. Bot. 2019, 164, 101–113. [Google Scholar] [CrossRef]
  50. Li, Z.; Wang, H.; Li, C.; Liu, H.; Luo, J. Genome-Wide Identification of the Remorin Gene Family in Poplar and Their Responses to Abiotic Stresses. Life 2024, 14, 1239. [Google Scholar] [CrossRef]
  51. Cui, W.; Xu, Z.; Kong, Y.; Yang, L.; Dou, H.; Zhang, D.; Li, M.; Chen, Y.; Ding, S.; Yang, C.; et al. Genome-Wide Identification of the Heat Shock Transcription Factor Gene Family in Rosemary (Salvia rosmarinus). Horticulturae 2024, 10, 1250. [Google Scholar] [CrossRef]
  52. Kumar, S.; Stecher, G.; Li, M.; Knyaz, C.; Tamura, K. MEGA X: Molecular Evolutionary Genetics Analysis across Computing Platforms. Mol. Biol. Evol. 2018, 35, 1547–1549. [Google Scholar] [CrossRef] [PubMed]
  53. Letunic, I.; Bork, P. Interactive Tree of Life (iTOL) v6: Recent updates to the phylogenetic tree display and annotation tool. Nucleic Acids Res. 2024, 52, W78–W82. [Google Scholar] [CrossRef] [PubMed]
  54. Chen, C.; Wu, Y.; Li, J.; Wang, X.; Zeng, Z.; Xu, J.; Liu, Y.; Feng, J.; Chen, H.; He, Y.; et al. TBtools-II: A “one for all, all for one” bioinformatics platform for biological big-data mining. Mol. Plant 2023, 16, 1733–1742. [Google Scholar] [CrossRef]
  55. Chen, C.; Chen, H.; Zhang, Y.; Thomas, H.R.; Frank, M.H.; He, Y.; Xia, R. TBtools: An Integrative Toolkit Developed for Interactive Analyses of Big Biological Data. Mol. Plant 2020, 13, 1194–1202. [Google Scholar] [CrossRef]
  56. Lescot, M.; Déhais, P.; Thijs, G.; Marchal, K.; Moreau, Y.; Van de Peer, Y.; Rouzé, P.; Rombauts, S. PlantCARE, a database of plant cis-acting regulatory elements and a portal to tools for in silico analysis of promoter sequences. Nucleic Acids Res. 2002, 30, 325–327. [Google Scholar] [CrossRef]
  57. Goodstein, D.M.; Shu, S.; Howson, R.; Neupane, R.; Hayes, R.D.; Fazo, J.; Mitros, T.; Dirks, W.; Hellsten, U.; Putnam, N.; et al. Phytozome: A comparative platform for green plant genomics. Nucleic Acids Res. 2012, 40, D1178–D1186. [Google Scholar] [CrossRef]
  58. Luo, J.; Nvsvrot, T.; Wang, N. Comparative transcriptomic analysis uncovers conserved pathways involved in adventitious root formation in poplar. Physiol. Mol. Biol. Plants 2021, 27, 1903–1918. [Google Scholar] [CrossRef]
  59. He, W.; Luo, L.; Xie, R.; Chai, J.; Wang, H.; Wang, Y.; Chen, Q.; Wu, Z.; Yang, S.; Li, M.; et al. Genome-Wide Identification and Functional Analysis of the AP2/ERF Transcription Factor Family in Citrus Rootstock under Waterlogging Stress. Int. J. Mol. Sci. 2023, 24, 8989. [Google Scholar] [CrossRef]
  60. Li, D.; He, Y.; Li, S.; Shi, S.; Li, L.; Liu, Y.; Chen, H. Genome-wide characterization and expression analysis of AP2/ERF genes in eggplant (Solanum melongena L.). Plant Physiol. Biochem. 2021, 167, 492–503. [Google Scholar] [CrossRef]
  61. Ren, M.; Yang, W.; Zhang, J.; Zhao, L.; Quan, Y.; He, Z.; Xu, Y.; Zhang, F.; Yin, M.; Wang, Y.; et al. Overexpression of ClRAP2.4 in Chrysanthemum enhances tolerance to cold stress. Funct. Plant Biol. 2023, 50, 470–481. [Google Scholar] [CrossRef] [PubMed]
  62. Xie, Z.; Yang, C.; Liu, S.; Li, M.; Gu, L.; Peng, X.; Zhang, Z. Identification of AP2/ERF transcription factors in Tetrastigma hemsleyanum revealed the specific roles of ERF46 under cold stress. Front. Plant Sci. 2022, 13, 936602. [Google Scholar] [CrossRef] [PubMed]
  63. Zhang, Y.; Wang, N.; He, C.; Gao, Z.; Chen, G. Comparative transcriptome analysis reveals major genes, transcription factors and biosynthetic pathways associated with leaf senescence in rice under different nitrogen application. BMC Plant Biol. 2024, 24, 419. [Google Scholar] [CrossRef] [PubMed]
  64. Huang, Y.; Liu, L.; Hu, H.; Tang, N.; Shi, L.; Xu, F.; Wang, S. Arabidopsis ERF012 Is a Versatile Regulator of Plant Growth, Development and Abiotic Stress Responses. Int. J. Mol. Sci. 2022, 23, 6841. [Google Scholar] [CrossRef]
  65. Liu, J.; Zhong, H.; Cao, C.; Wang, Y.; Zhang, Q.; Wen, Q.; Zhu, H.; Li, Z. Identification of AP2/ERF Transcription Factors and Characterization of AP2/ERF Genes Related to Low-Temperature Stress Response and Fruit Development in Luffa. Agronomy 2024, 14, 2509. [Google Scholar] [CrossRef]
  66. Zhang, H.; Wang, S.; Zhao, X.; Dong, S.; Chen, J.; Sun, Y.; Sun, Q.; Liu, Q. Genome-wide identification and comprehensive analysis of the AP2/ERF gene family in Prunus sibirica under low-temperature stress. BMC Plant Biol. 2024, 24, 883. [Google Scholar] [CrossRef]
  67. Liu, M.; Sun, W.; Ma, Z.; Zheng, T.; Huang, L.; Wu, Q.; Zhao, G.; Tang, Z.; Bu, T.; Li, C.; et al. Genome-wide investigation of the AP2/ERF gene family in tartary buckwheat (Fagopyum Tataricum). BMC Plant Biol. 2019, 19, 84. [Google Scholar] [CrossRef]
  68. Luo, J.; Shi, W.; Li, H.; Janz, D.; Luo, Z.-B. The conserved salt-responsive genes in the roots of Populus × canescens and Arabidopsis thaliana. Environ. Exp. Bot. 2016, 129, 48–56. [Google Scholar] [CrossRef]
  69. Zhang, Z.; Wang, J.; Zhang, R.; Huang, R. The ethylene response factor AtERF98 enhances tolerance to salt through the transcriptional activation of ascorbic acid synthesis in Arabidopsis. Plant J. 2012, 71, 273–287. [Google Scholar] [CrossRef]
  70. Xing, L.; Di, Z.; Yang, W.; Liu, J.; Li, M.; Wang, X.; Cui, C.; Wang, X.; Wang, X.; Zhang, R.; et al. Overexpression of ERF1-V from Haynaldia villosa Can Enhance the Resistance of Wheat to Powdery Mildew and Increase the Tolerance to Salt and Drought Stresses. Front. Plant Sci. 2017, 8, 1948. [Google Scholar] [CrossRef]
  71. Li, Z.; Tian, Y.; Xu, J.; Fu, X.; Gao, J.; Wang, B.; Han, H.; Wang, L.; Peng, R.; Yao, Q. A tomato ERF transcription factor, SlERF84, confers enhanced tolerance to drought and salt stress but negatively regulates immunity against Pseudomonas syringae pv. tomato DC3000. Plant Physiol. Biochem. 2018, 132, 683–695. [Google Scholar] [CrossRef] [PubMed]
  72. Park, S.J.; Park, S.; Kim, Y.; Hyeon, D.Y.; Park, H.; Jeong, J.; Jeong, U.; Yoon, Y.S.; You, D.; Kwak, J.; et al. Ethylene responsive factor34 mediates stress-induced leaf senescence by regulating salt stress-responsive genes. Plant Cell Environ. 2022, 45, 1719–1733. [Google Scholar] [CrossRef] [PubMed]
  73. Cheng, Z.; Zhang, X.; Zhao, K.; Yao, W.; Li, R.; Zhou, B.; Jiang, T. Over-Expression of ERF38 Gene Enhances Salt and Osmotic Tolerance in Transgenic Poplar. Front. Plant Sci. 2019, 10, 1375. [Google Scholar] [CrossRef]
Figure 1. Distribution of the ERF genes in Populus trichocarpa. Different colored genes represent different subfamilies. Black: ERF subfamily; red: AP2 subfamily; green: RAV subfamily.
Life 15 00550 g001
Figure 2. Phylogenetic analysis of ERFs in P. trichocarpa. Different colored sections represent different groups.
Life 15 00550 g002
Figure 3. Collinearity analysis of ERFs in P. trichocarpa (A) and among different plant species (B). (A) Collinearity relationships of PtERFs in P. trichocarpa. (B) Collinearity relationships of ERFs between P. trichocarpa and A. thaliana. The gray lines indicate the collinearity in the genomes of P. trichocarpa and among different plant species. Red lines highlight the collinearity of ERFs.
Life 15 00550 g003
Figure 4. The cis-acting elements analysis of PtERFs in P. trichocarpa. (A) The categories and quantities of the cis-acting elements in PtERFs. (B) The percentages of the four types of the cis-acting elements in PtERFs. The number of different promoter elements in the PtERFs is represented by different intensity colors and numbers. The different colors in the histogram represent the percentage of cis-acting elements within each of the four functional categories.
Life 15 00550 g004aLife 15 00550 g004b
Figure 5. The expression of PtERFs in different tissues and under different nitrogen treatments. Based on the expression patterns, PtERF genes were classified into low-expression clusters (L1 and L2), medium-expression clusters (M1 and M2), and a high-expression cluster (H). Red bars indicate upregulation, and blue bars indicate downregulation. Different colored labels represent different subfamilies. Black: ERF subfamily; red: AP2 subfamily; green: RAV subfamily. BESC443, BESC423, BESC842, GW9840, GW9592, and GW9911 represent distinct varieties of P. trichocarpa.
Life 15 00550 g005
Figure 6. The expression of PtERFs in different tissues and under different seasons. Based on the expression patterns, PtERF genes were classified into low-expression clusters (L1 and L2), a medium-expression cluster (M), and a high-expression cluster (H). Red bars indicate upregulation, and blue bars indicate downregulation. Different colored labels represent different subfamilies. Black: ERF subfamily; red: AP2 subfamily; green: RAV subfamily.
Life 15 00550 g006
Figure 7. Co-expression network of PtERFs in P. trichocarpa (A), as well as the GO and KEGG enrichment analyses of genes within the co-expression network (B). In the co-expression network, red nodes represent PtERFs, and light blue nodes represent their co-expressed genes. The edges of the network indicate the co-expression relationships between PtERFs and their co-expressed genes. GO-BP and GO-MF, respectively, refer to biological process and molecular function in GO analysis.
Life 15 00550 g007
Disclaimer/Publisher’s Note: The statements, opinions and data contained in all publications are solely those of the individual author(s) and contributor(s) and not of MDPI and/or the editor(s). MDPI and/or the editor(s) disclaim responsibility for any injury to people or property resulting from any ideas, methods, instructions or products referred to in the content.

