Article

Evaluating the Expression of Candidate Homeobox Genes and Their Role in Local-Site Inflammation in Mucosal Tissue Obtained from Children with Non-Syndromic Cleft Lip and Palate

Department of Morphology, Institute of Anatomy and Anthropology, Rīga Stradiņš University, LV-1007 Riga, Latvia
*
Author to whom correspondence should be addressed.
J. Pers. Med. 2021, 11(11), 1135; https://doi.org/10.3390/jpm11111135
Submission received: 30 September 2021 / Revised: 28 October 2021 / Accepted: 30 October 2021 / Published: 2 November 2021
(This article belongs to the Special Issue Precision Medicine in Oral Science and Dentistry)

Abstract

:
Craniofacial development including palatogenesis is a complex process which requires an orchestrated and spatiotemporal expression of various genes and factors for proper embryogenesis and organogenesis. One such group of genes essential for craniofacial development is the homeobox genes, transcriptional factors that are commonly associated with congenital abnormalities. Amongst these genes, DLX4, HOXB3, and MSX2 have been recently shown to be involved in the etiology of non-syndromic cleft lip and palate. Hence, we investigated the gene and protein expression of these genes in normal and cleft affected mucosal tissue obtained from 22 children, along with analyzing their role in promoting local-site inflammation using NF-κB. Additionally, we investigated the role of PTX3, which plays a critical role in tissue remodeling and wound repair. We found a residual gene and protein expression of DLX4 in cleft mucosa, although no differences in gene expression levels of HOXB3 and MSX2 were noted. However, a significant increase in protein expression for these genes was noted in the cleft mucosa (p < 0.05), indicating increased cellular proliferation. This was coupled with a significant increase in NF-κB protein expression in cleft mucosa (p < 0.05), highlighting the role of these genes in promotion of pro-inflammatory environment. Finally, no differences in gene expression of PTX3 were noted.

1. Introduction

The processes of embryogenesis, organogenesis, and subsequent cell differentiation are highly regulated and tightly controlled by multiple genes which are expressed in an orchestrated manner in different tissues. Homeobox genes are one such group which are deeply involved in embryonic patterning and cell differentiation. These genes possess a specific DNA sequence called the “homeobox” which encodes for proteins called the “homeodomains” [1,2,3]. Homeodomains, when expressed, recognize, and bind to specific DNA sequences which allows them to regulate the expression of other genes and control the process of organogenesis [4]. Due to their role and functionality as a transcription factor, several homeobox genes have been associated with congenital abnormalities [5]. About 230 homeobox genes have been discovered in the human genome [6,7] which are classified into gene families (containing similar genes), which are further clustered into 11 gene classes (containing similar families) [3]. The largest and most relevant gene class for craniofacial development is perhaps the ANTP (Antennapedia) class, comprising of 37 gene families divided into two subclasses based on the chromosomal location of the genes—HOXL and NKL. The HOXL (HOX-linked) subclass consists of 14 gene classes which are concentrated in two fourfold paralogous regions while the NKL (NK-linked) subclass consists of remaining 23 gene classes which are rather more dispersed [3].
Within the NKL subclass, two gene families—DLX (Distal-Less homeobox) and MSX (Muscle segment homeobox homolog/Msh homeobox) have been implicated in non-syndromic cleft lip and palate. Amongst the DLX family, the DLX4 gene is one of the latest genes which have been shown to play a role in clefting. The gene has been shown in murine models to be expressed in the mesenchyme derived from neural crest cells in the mandibular arch, the lower jaw primordia [8]. In human tissues, the gene expression quantification and identification has proven to be difficult due to non-expression in normal adult tissues [9]. However, the gene has been found to be expressed in different cancer cells including cells from breast [10], lung [11], prostatic [12] and colorectal cancer [13]. Additionally, in two recent studies, the gene has been associated with both non-syndromic [14] and syndromic forms of cleft lip and palate [15].
In the MSX family, mutations in the MSX2 gene have been shown to be associated with clefting in the Brazilian population [16]. Furthermore, in a sequencing study, point mutations in the MSX2 gene were found to be common amongst patients with bilateral cleft lip and palate and with a positive family history [17]. The gene expression is usually detectable by the middle of the seventh embryonic week in the mandibular and maxillary bone primordia, Meckel’s cartilage, and primordial tooth germs [18,19]. Moreover, the gene is essential for skeletal bone growth and differentiation since the overexpression of the gene impedes osteoblast differentiation while antisense inhibition promotes differentiation [19,20,21]. The HOXB3 (homeobox B3) gene, another candidate gene for non-syndromic cleft lip and palate, is a member of the HOX3 family (part of the HOXL subfamily) that has been shown to transcriptionally regulate the expression of JAG1 gene (Jagged Canonical Notch Ligand 1) in a synergistic manner during pharyngeal arch development [22]. Furthermore, the co-expression of HOXB3 and JAG1 has been demonstrated to affect the migration of the neural crest cells into the pharyngeal arches, which leads to neural crest deficiency and craniofacial defects [22].
Mutations and disruptions in the spatiotemporal expression of the above genes leads to incomplete development of the orofacial structures which in turn disrupts the functioning of the immune system and reparative processes [23]. Such disruption promotes local site inflammation due to an imbalance of the cytokines (pro vs. anti) which hinders normal tissue remodeling during wound healing [24]. Additionally, proinflammatory cytokines like IL17 and IL6, regulatory cytokine IFN-γ (interferon gamma) and anti-inflammatory cytokine IL4 modulate immunosteogenesis by actively participating in the process of osteogenesis [23]. Children with cleft lip and palate show disturbances in the immunosteogenesis during embryogenesis which affects the characteristics and the course of the disease postnatally [25]. These disturbances also create certain difficulties in the rehabilitation of such patients, which makes it essential to investigate the role of the gene-gene interactions, especially between causative genes and cytokine regulators. In one of our previous studies with the same cohort as in the current study, we showed the precise imbalance in the cytokine expression in the cleft mucosal tissue [26]. We reported an increase and constant expression of pro-inflammatory cytokines like IL-2,6,13 and TNF-α (tumor necrosis factor) which are known to stimulate osteogenesis. This was coupled with a decrease in anti-inflammatory cytokines like IL-4 and IL-10, which are known to downregulate osteogenesis. Interestingly, a strong correlation between IL-6 and IFN-γ gamma expression was noted, which indicated preferential Th1 pathway activation [26]. However, in the previous study we didn’t investigate the role of the master regulator of cytokine expression—NF-κB (Nuclear Factor Kappa Beta).
NF-κB is a family of five inducible transcription factors (p50/p105, p52/p100, p65 or RelA, c-Rel, and RelB) which regulates the immune and inflammatory responses [27,28]. These transcriptional factors are normally sequestered in the cytoplasm by a family of inhibitory proteins called IκB family members [29] and can be activated by two pathways—classical or canonical pathway and alternative or non-canonical pathway. In the classical pathway, when cells are stimulated by agents like inflammatory cytokines (TNF-α and IL-1), growth factors, mitogens, microbial components, and stress, IκB undergo phosphorylation which frees NF-κB (predominantly p50/RelA and p50/c-Rel dimers) to translocate into the nucleus and bind to specific DNA sequences [30,31]. In the non-classical pathway, very specific stimulants (ligands of a subset of tumor necrosis factor receptor superfamily members) stimulates p100, the NF-κB2 precursor protein [29,32]. The stimulants lead to phosphorylation and ubiquitination of p100, which then leads to the formation of a heterodimer of RelB/p52 which also translocate into the nucleus.
Finally, the soluble pattern recognition receptor PTX3 (long-pentraxin 3) has been gaining traction and attention for the role it plays in innate immunity, tissue remodeling, and tumorigenesis. Like NF-κB, PTX3 expression is also inducible by the same pro-inflammatory cytokines (whilst being downregulated by IL-4) in a variety of different cell types, including fibroblasts and endothelial cells, myeloid cells such as monocytes, macrophages, and dendritic cells (DCs), adipocytes, epithelial cells etc. [33,34,35]. In fact, epigenetic studies have demonstrated that NF-κB (especially RelA) binds specifically to an upstream enhancer (called Enhancer 2) of the PTX3 gene after TNF-α stimulation in macrophages, highlighting the regulatory connection between the two [36]. Apart from mediating inflammatory responses, PTX3 is heavily involved in the FGF/FGFR (fibroblast growth factor/FGF receptor) pathways [37]. It is known that PTX3 possess FGF2-binding and inhibitory capacity (basic fibroblast growth factor/bFGF) which confers it anti-angiogenic properties [38,39]. In our last study (again, with the same cohort as the present study) we showed that FGF2 was over-expressed in cleft mucosal tissue and hypothesized on the possible interaction and role of PTX3 in cleft tissue [40].
Hence, in the present study, we investigated the gene (using CISH—chromogenic in-situ hybridization) and protein (using IHC—immunohistochemistry) expression of three recently implicated homeobox genes (DLX4, MSX2, and HOXB3) in normal and cleft affected mucosal tissue. Further, we investigated the interactions of these genes with NF-κB to understand the underlying mechanisms of local-site inflammation. Additionally, we aimed to understand the role and interactions of PTX3 in cleft-affected mucosal tissue, providing us with better insights in the pathogenesis and manifestations of cleft lip and palate.

2. Results

2.1. Gene and Protein Expression Analysis of DLX4 Gene in Control and Cleft Tissue

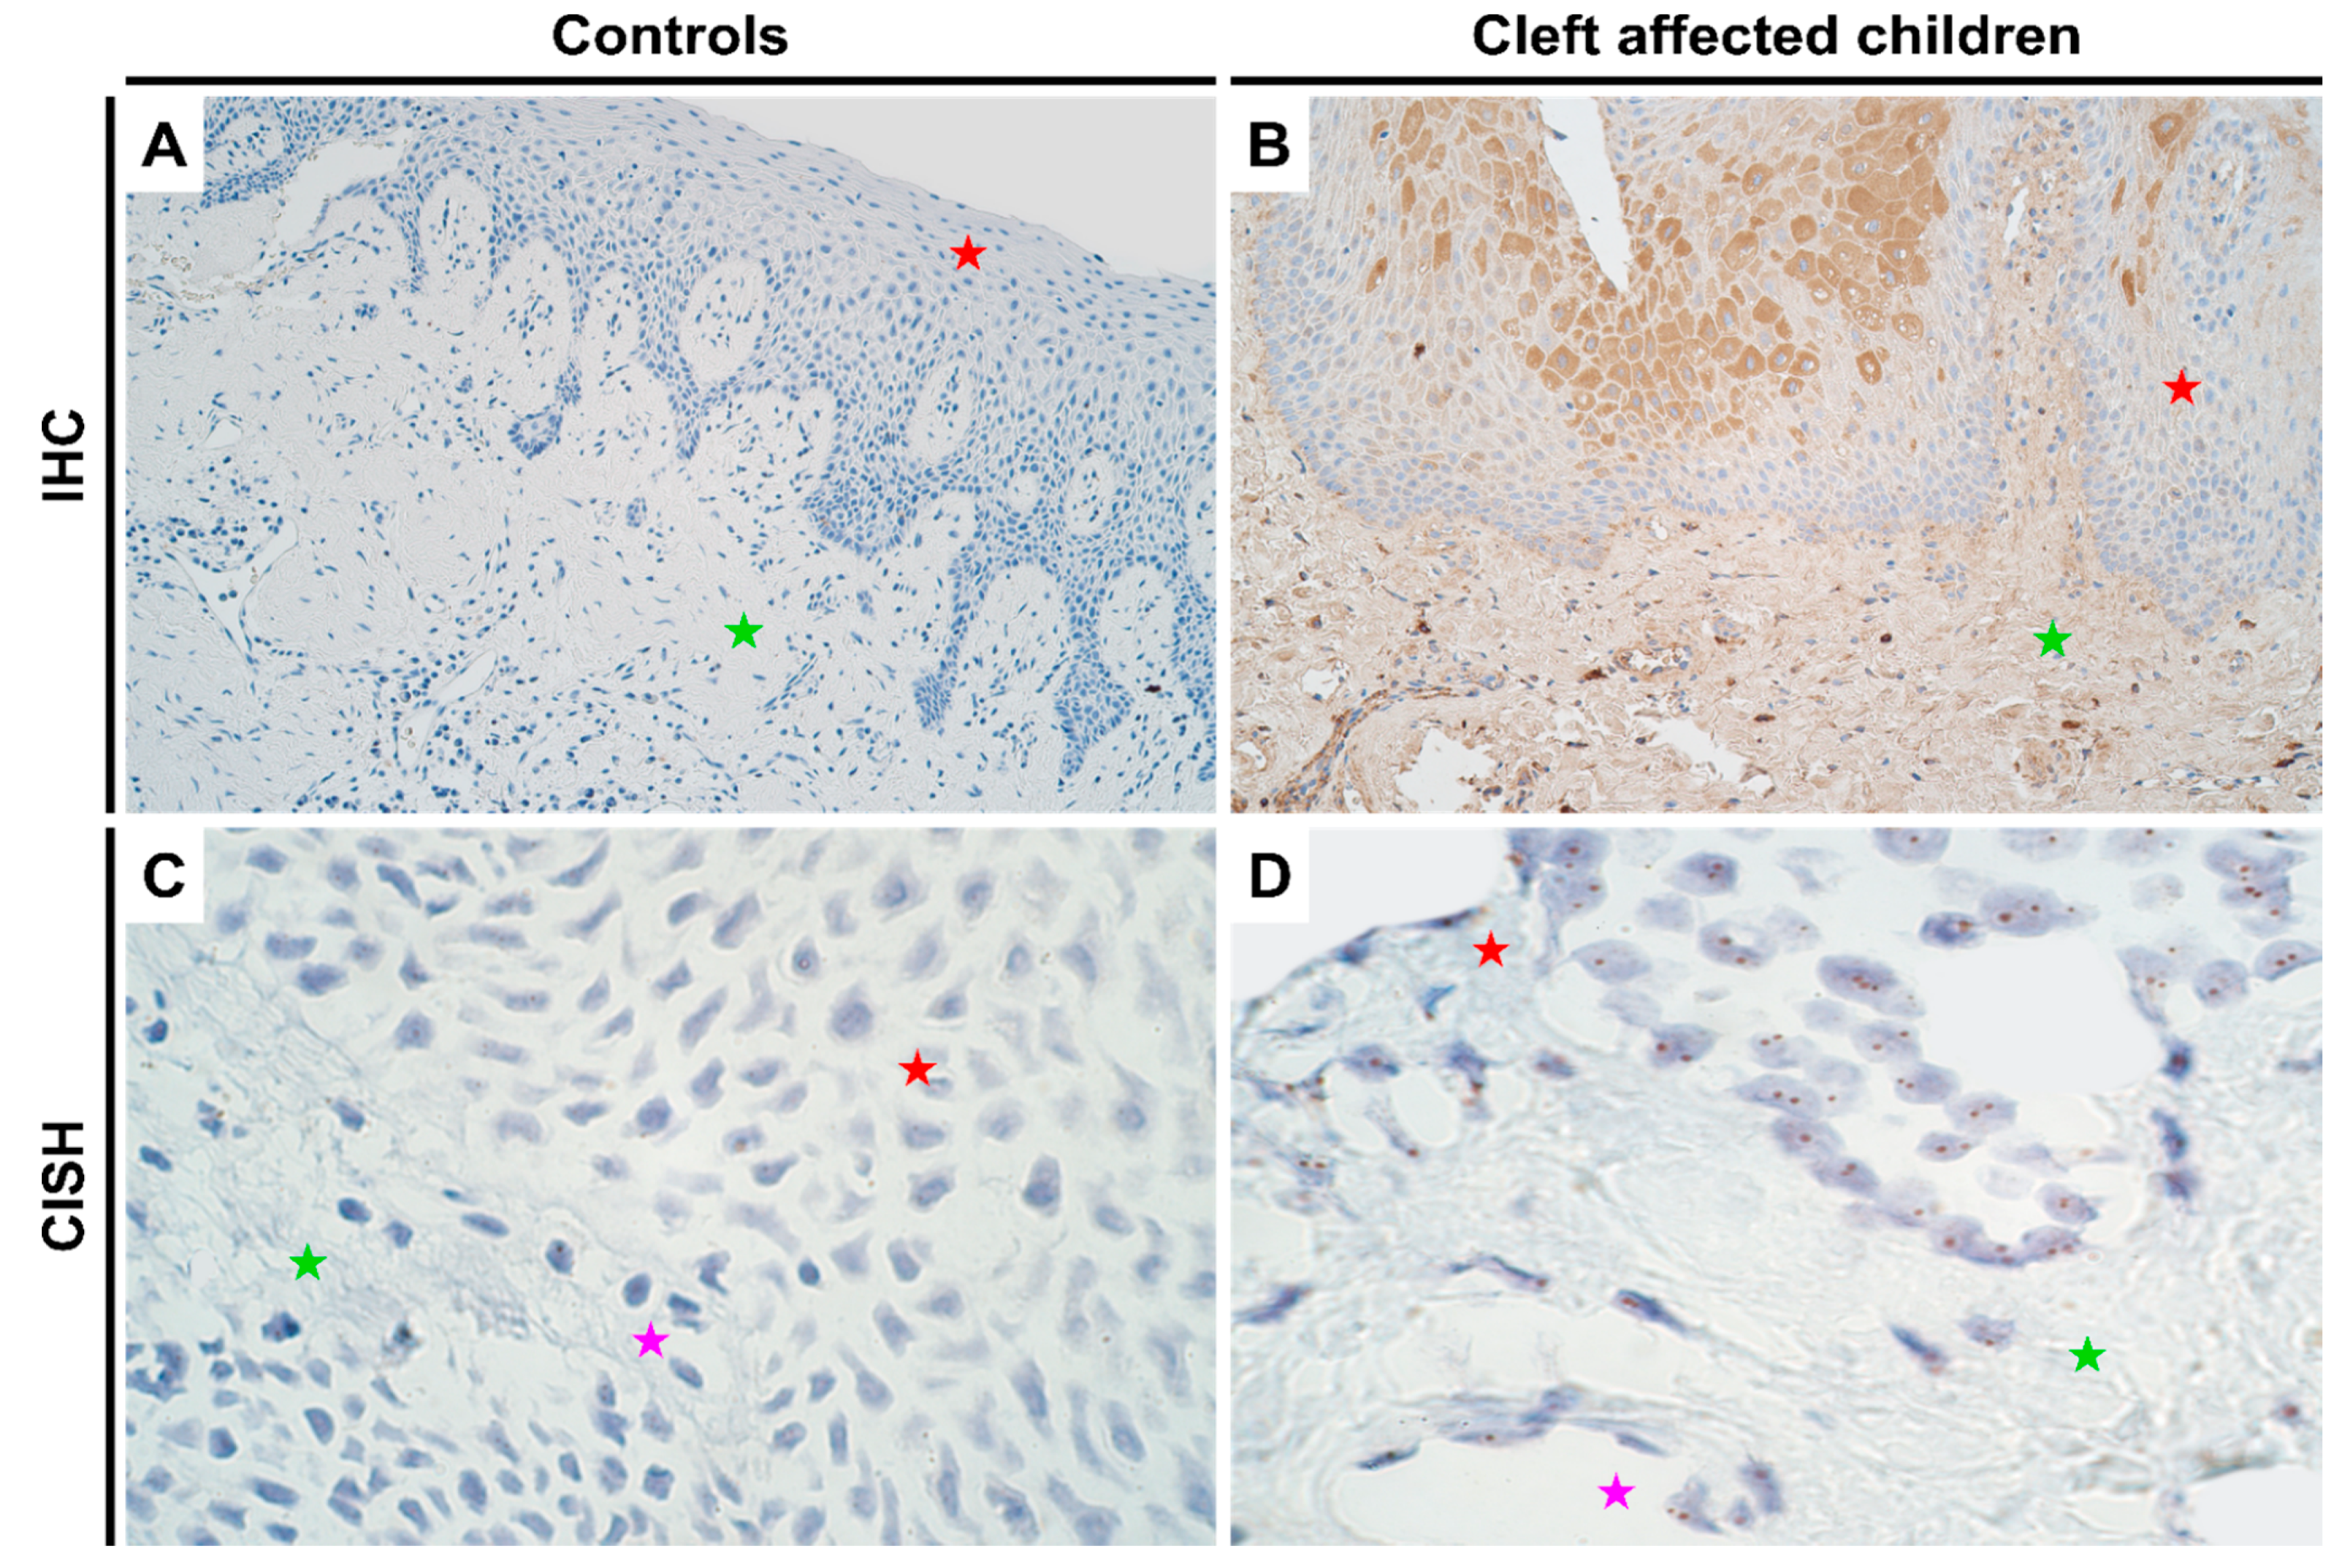
Since DLX4 is not expressed in normal adult tissues [9], the CISH assay also showed no positive results in the control tissues (Figure 1C). However, in the cleft mucosal tissue, gene expression was detectable by CISH, though no gene amplification was seen (Figure 1D). In terms of protein expression, as expected controls again showed no positive IHC results (Figure 1A; Supplementary Table S1) whilst the cleft affected mucosal samples showed a significant increase in protein expression in both epithelium (p = 0.000) and connective tissue cells (p = 0.001) with a mean IHC semi-quantitative grade of 1.7+ and 1.6+, respectively (Figure 1B and Table 1; one-sample Wilcoxon signed rank test). No significant differences in terms of protein expression were observed between epithelium and connective tissue cells in cleft tissue (p = 0.565; paired Wilcoxon signed rank test).

2.2. Gene and Protein Expression Analysis of HOXB3 Gene in Control and Cleft Tissue

There were no notable differences in the genetic expression of HOXB3 between normal and cleft affected mucosa. In both the tissues, all cell types (epithelial, endothelium and connective tissue cells) showed no gene amplification though gene expression was noted (Figure 2C,D; Supplementary Table S2). In terms of protein expression, like DLX4, controls showed no protein expression (Figure 2A; IHC). However, in the cleft tissue, there was a significant increase in protein expression in both epithelium (p < 0.001) and connective tissue cells (p < 0.001) with a mean IHC semi-quantitative grade of 2.1+ and 1.1+, respectively (Figure 2B and Table 1; Mann-Whitney U test). Further, epithelial cells showed a significantly higher expression of HOXB3 when compared with connective tissue cells in the cleft tissue in terms of protein expression (p = 0.000; paired Wilcoxon signed rank test).

2.3. Gene and Protein Expression Analysis of MSX2 Gene in Control and Cleft Tissue

As with HOXB3, no notable differences in genetic expression of MSX2 between normal and cleft affected mucosa was noted in any of the cell types (Figure 3C,D; Supplementary Table S2). In terms of protein expression, like the other two homeobox genes, no expression was visualized in controls using IHC (Figure 3A). However, there was a significant increase in protein expression in both epithelium (p = 0.000) and connective tissue cells (p = 0.010) in cleft tissue with a mean IHC semi-quantitative grade of 1.4+ and 0.6+, respectively (Figure 3B and Table 1; Mann-Whitney U test). Further, there were significant differences noted in protein expression between the epithelium and connective tissue cells in cleft tissue (p = 0.003; paired Wilcoxon signed rank test).

2.4. Protein Expression Analysis of NF-κB in Control and Cleft Tissue

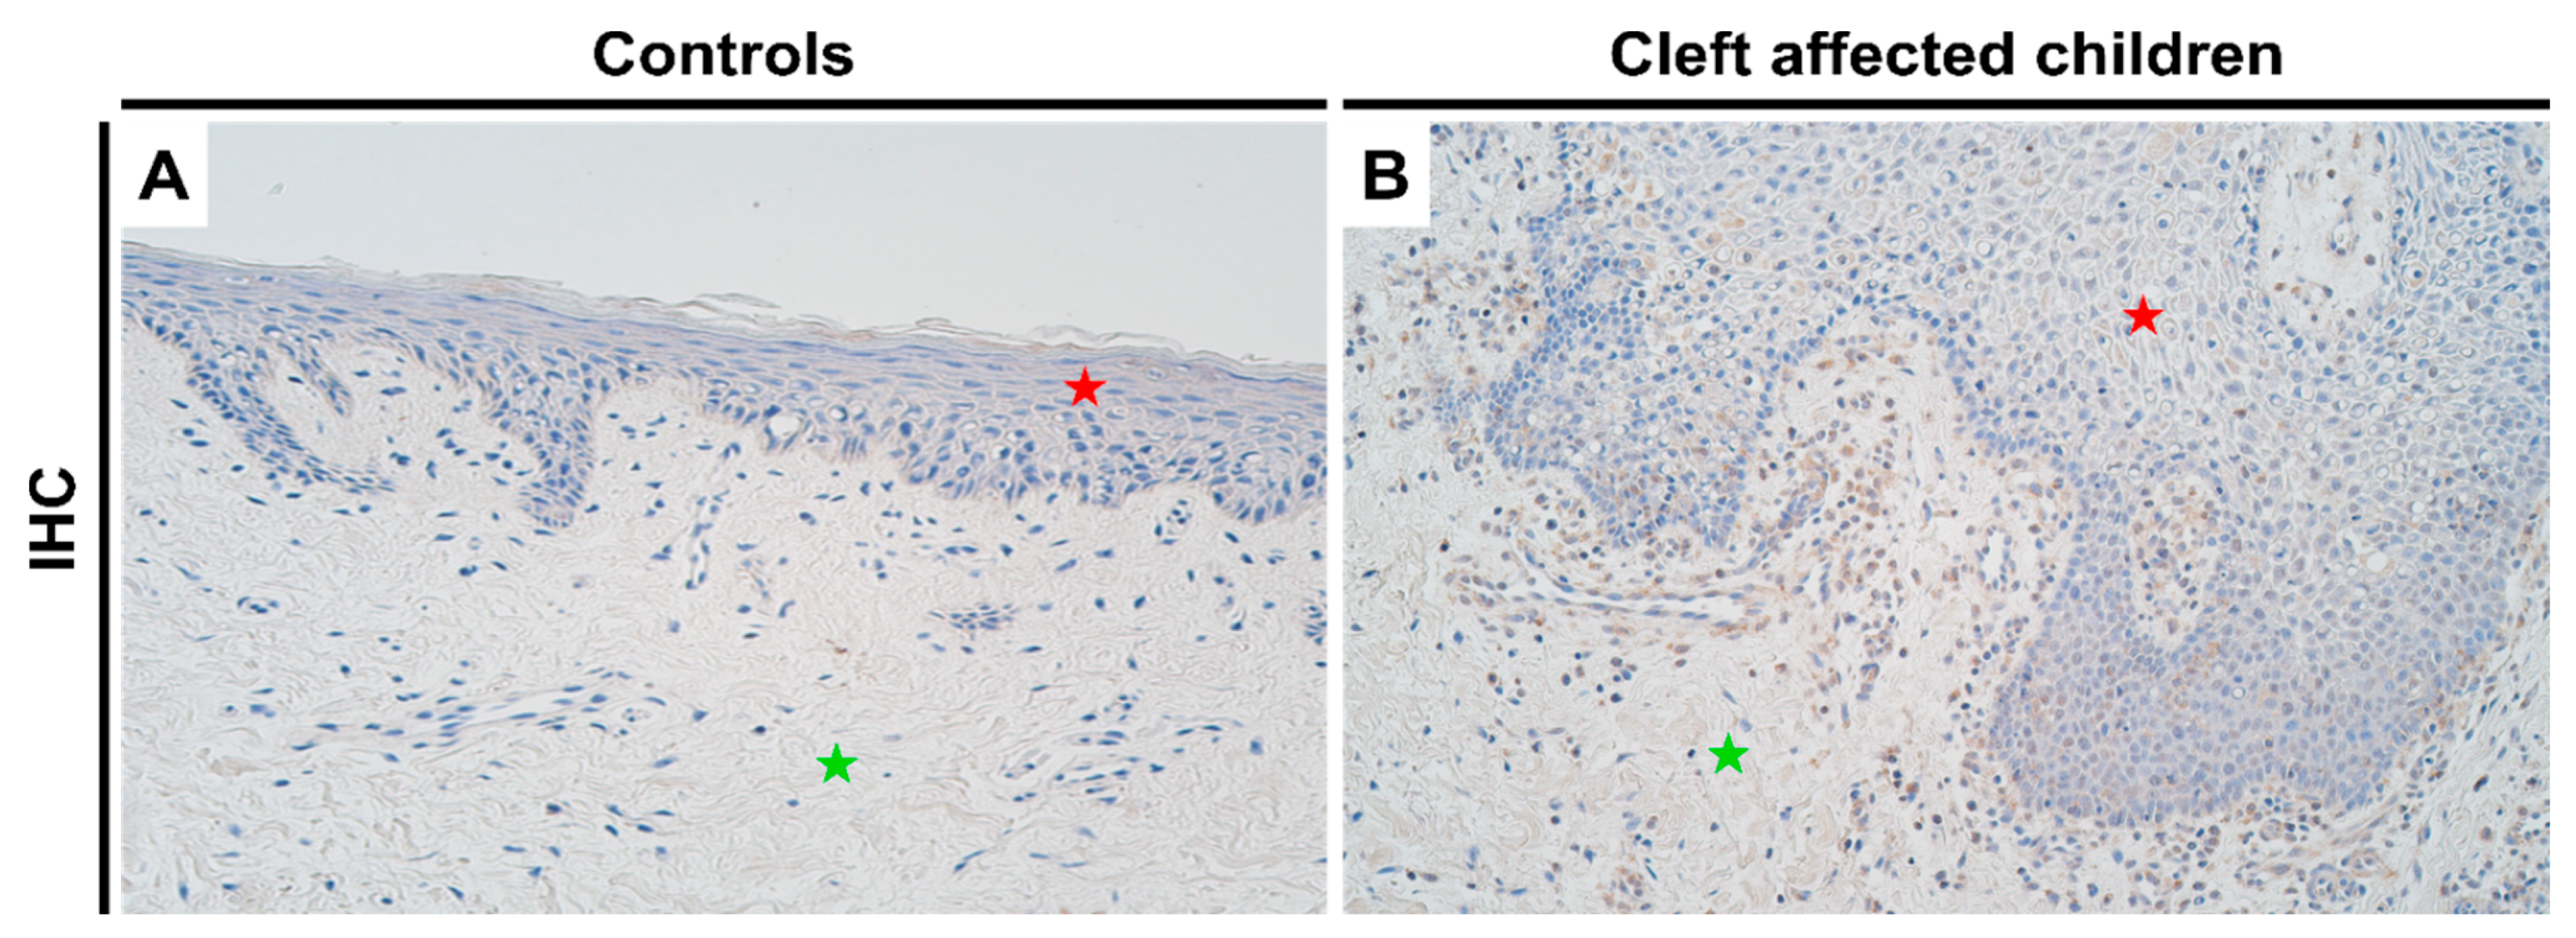
For NF-κB, control tissues showed no protein expression (Figure 4A), while there was a significant increase in the expression in cleft tissue (Figure 4B) in both epithelial (p = 0.0001) and connective tissue cells (p = 0.003), with a mean IHC semi-quantitative grade of 1.7+ and 1.1+, respectively (Table 1; Mann-Whitney test). A paired Wilcoxon signed rank test revealed no significant differences between NF-κB expression in epithelial and connective tissue cells in the cleft tissue (p = 0.051).

2.5. Gene Expression Analysis of PTX3 Gene in Control and Cleft Tissue

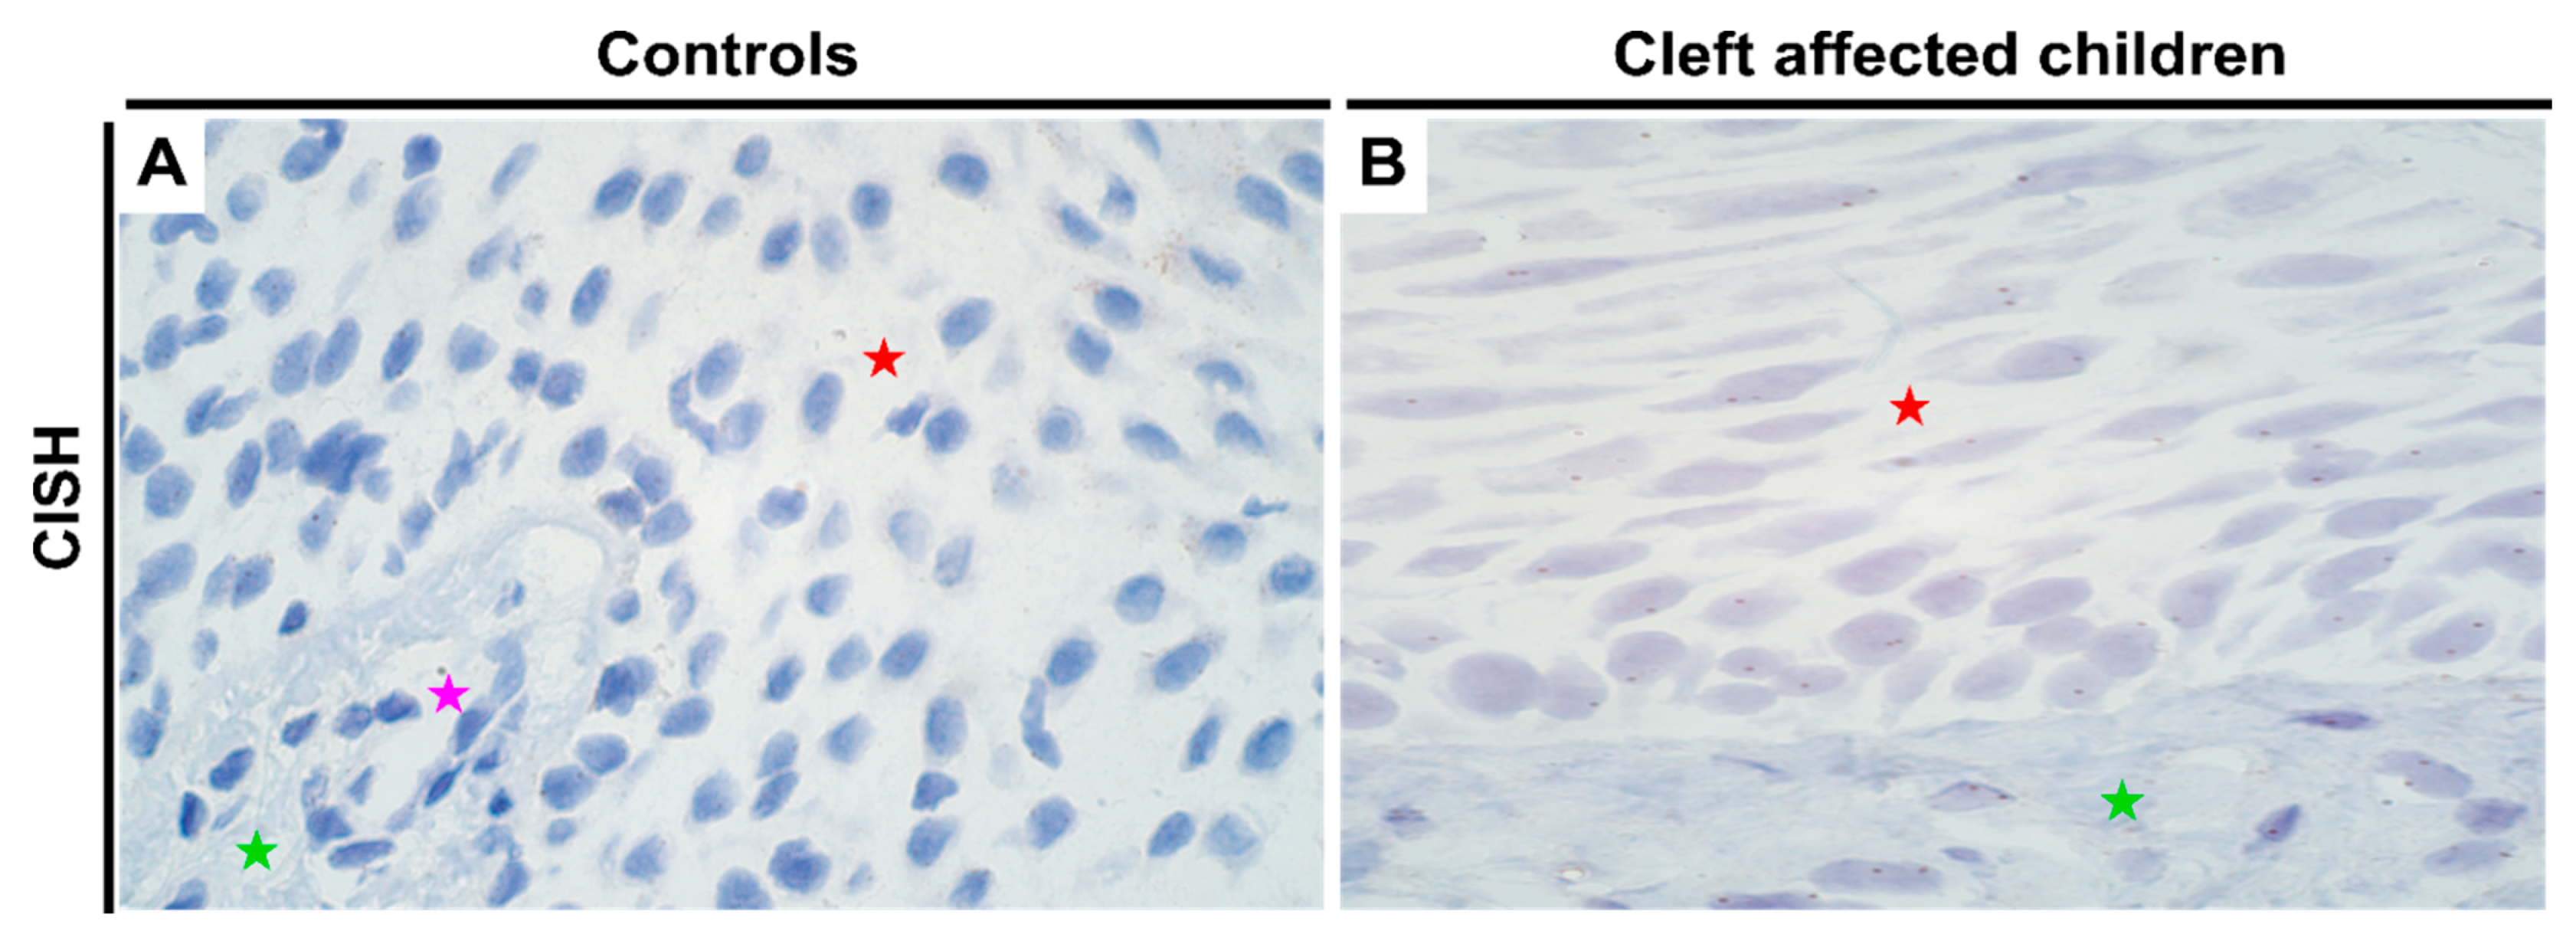
For PTX3, no changes in gene amplification or expression were noted between the control and cleft tissue (Table 1; Supplementary Table S2). All three cell types—epithelial, connective tissue, and endothelial cells showed equal expression of PTX3 gene in both tissues (Figure 5A,B, respectively).

2.6. Correlation between Protein Expression of Homeobox Genes and NF-κB (IHC)

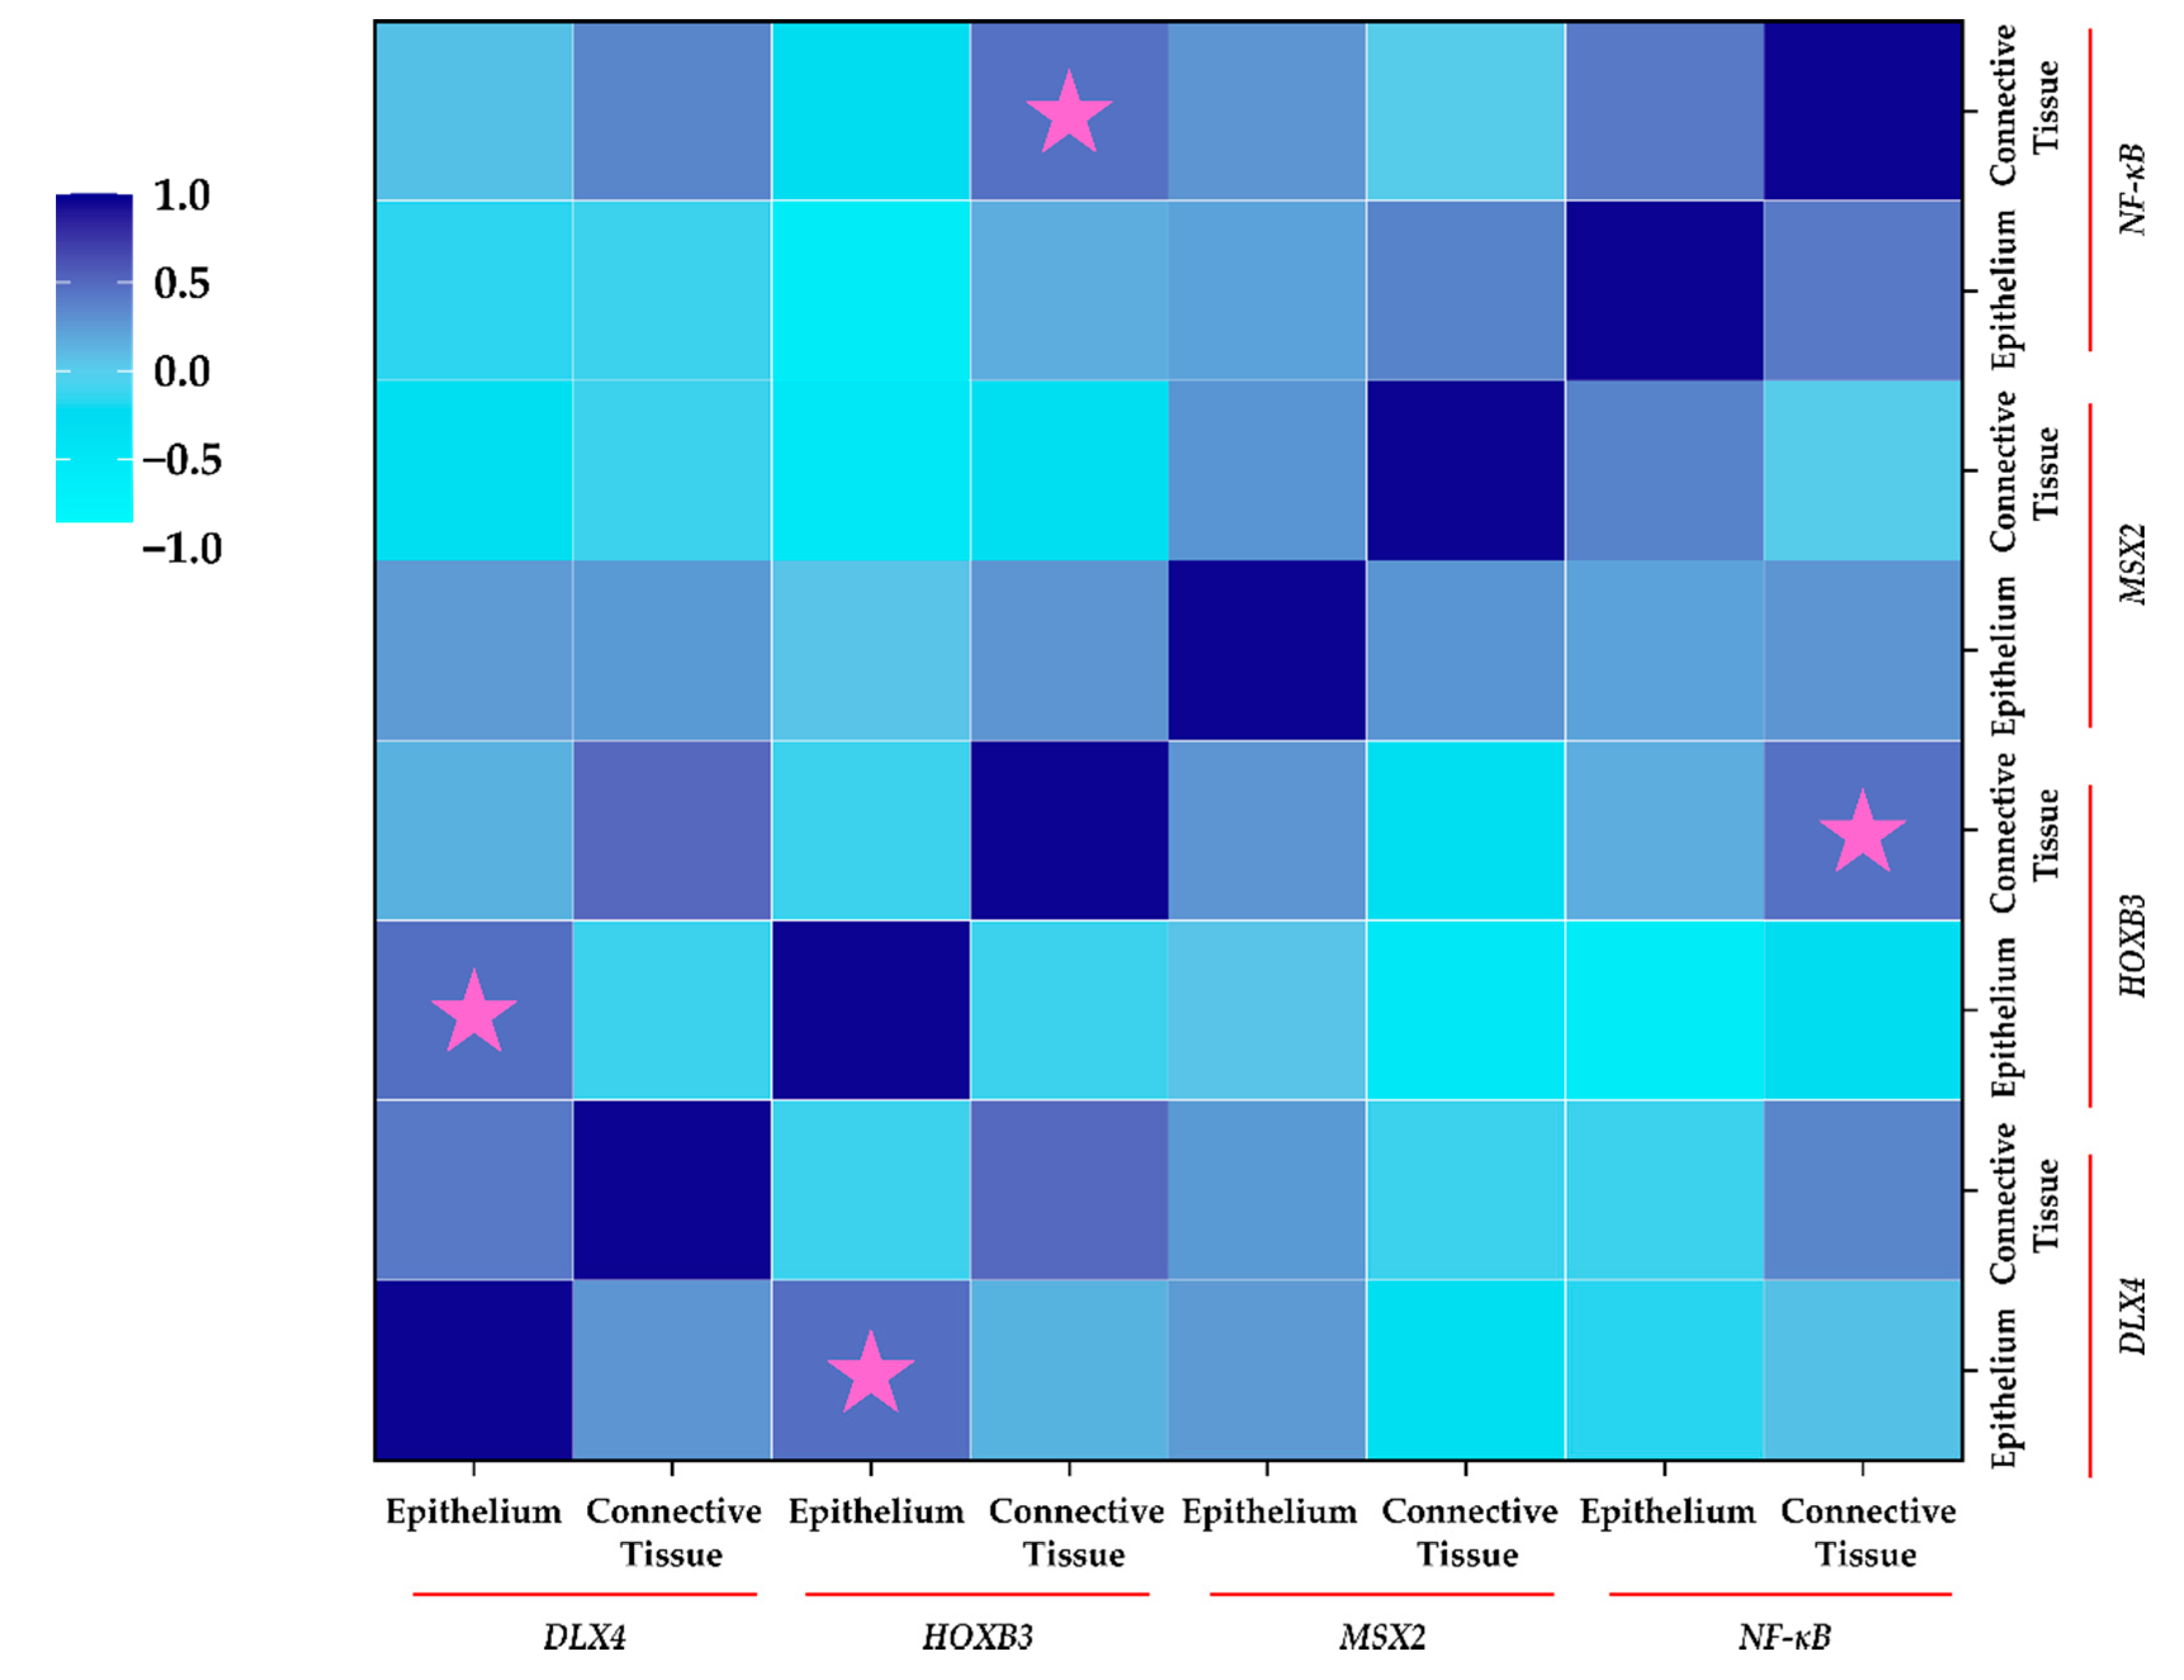
Correlation analysis (Figure 6) revealed a significant positive moderate correlation between epithelial expression of DLX4 and HOXB3 in cleft tissue (ρ = 0.472; p = 0.044). Similarly, a significant moderate positive correlation between connective tissue expression of HOXB3 and NF-κB was noted (ρ = 0.455; p = 0.028). Interestingly, epithelial cells showed a non-significant strong negative correlation between HOXB3 and NF-κB (ρ = −0.586; p = 0.102), indicating the differential expression and correlations between different types of cells in the cleft tissue.

3. Discussion

3.1. DLX4 Overexpression Leads to Increased Cellular Proliferation and Chronic Tissue Inflammation

Studies in mouse models have demonstrated that DLX4 is expressed in the mesenchymal tissue of the maxilla just prior to the time of palatal closure [14]. The expression levels then undergo significant reduction at later stages of palatal closure, highlighting the crucial regulatory role played by the gene in palatogenesis [14]. Additionally, the DLX genes have been shown to be closely related to normal tooth development. In a study on dental pulp cells isolated from human wisdom teeth (which are still under development after birth), the authors reported the presence of a high expression of DLX4 in crown completed and root completed stages of odontogenesis [41].
Apart from the oral cavity, DLX4 expression has been hugely discussed in the context of the human placenta and endometrium. The expression of the gene has been reported to be differentially elevated in the proliferative human endometrium, especially in the epithelium cells, which then reduces during the secretive phase [42]. This is quite interesting since a similar analogy can be attributed during palatogenesis, with preferential expression of DLX4 in the epithelium cells (as reported in our results as well). Additionally, ectopic (or residual in case of clefting) expression of DLX4 has been shown to increase cell proliferation by the inhibition of TGF-β/Smad signaling in cells, thereby causing p15 and p21 expression inhibition [9,43], which correlates with our previous findings whereby we found an increased detection of the proliferative marker Ki-67 [44], coupled with a pathological reduction in TGF-β1 expression in the cleft mucosa (Figure 7) [26].
While DLX4 gene expression has been associated with stimulatory effects on cell mobility, migration, and invasion abilities in breast tumor and preeclampsia placenta [45,46], other lung cancer studies have shown the opposite [47], which makes it difficult to elucidate its role in cleft tissue. Future studies investigating this role may prove to be instrumental in understanding neural crest cell migration patterns and regulation. Furthermore, the gene has been shown to be in involved in epithelial-mesenchymal transition (EMT) whereby the epithelial cells lose their polarity and assume a mesenchymal phenotype [46,48]. Such transition is necessary for normal embryonic development, tissue remodeling, and wound repair. In terms of inflammation regulation, DLX4 interacts directly with IL-1β that further leads to the downstream stimulation of NF-κB [49,50]. Moreover, IL-1β and NF-κB axis furthers stimulates multiple other targets including IL-6 and IL-8 (Figure 7) [51]. In the present study we also found an elevated NF-κB protein expression, which can be coupled with our previous results where we reported an elevated and consistent expression of IL-6 and elucidated its pro-inflammatory role in cleft tissue [26]. Additionally, stimulation of NF-κB by IL-1β and TNF-α causes suppression of TGF-β/Smad signaling which further exacerbates the pro-inflammatory environment [52].
Interestingly, interactions between DLX4 and bFGF/FGF2 have been reported in ovarian cancer tissue. DLX4 has been shown to directly stimulate expression of both the low and high molecular weight isoforms of FGF2 (Figure 7) which in turn stimulate VEGF (vascular endothelial growth factor) and promote an angiogenetic environment [53]. We also reported an increase in FGF2 expression in cleft tissue [40] which can lead to accelerated wound healing (FGF2 can further promote EMT and wound closure). Another possible pathway for angiogenetic promotion has been postulated by the means of DLX4 induced expression of iNOS (inducible nitric oxide synthetase) [54]. This promotion of angiogenetic and pro-inflammatory environment by DLX4 gives it a rather unusual protective role in the cleft tissue.
Finally, a regulatory mechanism between TGF-β and DLX4 has been reported. Induction of TGF-β1 has been shown to reduce DLX4 levels in human dental pulp cells, which leads to impaired iPSC (induced pluripotent stem cells) generation [41]. These findings are quite interesting, since we suspect the loss (or significant reduction) of TGF-β expression (which could be due to non-attenuation of DLX4 expression at the time of palatal closure) leads to sustained residual expression of DLX4, which ironically suppresses TGF-β signaling even more, thereby creating an auto-sustained loop (Figure 7).

3.2. Overexpression of HOXB3 Co-Stimulates Cellular Proliferation and Angiogenesis

The HOXB3 gene has been implicated in the promotion of angiogenesis via upregulating the expression of Ephrin A1 (EFNA1; Figure 7) and is needed to induce capillary morphogenesis in the endothelial sprouts [55]. Interactions between the EFNA1 and FGF/FGFR pathways have been shown by many authors in the past [56,57,58], which would make it an interesting link to investigate in the context of the cleft lip and palate. The expression of HOXB3 has also been implicated in the hematopoietic pathways, wherein its expression is significantly higher in primitive CD34+ cells, which eventually gets downregulated as the cells differentiate into committed progenitors [59]. In a study in knockout mice, the authors demonstrated that the HOXB3 gene plays a direct physiological role in regulating stem cell regeneration in which its expression was critical to the achieving of maximum proliferation rates of these progenitor cells [60].
This role of HOXB3 in controlling cell proliferation has also been established in the context of cleft lip and palate. In a study on regulatory network analysis of cleft genes, Li et al., reported that HOXB3 was enriched in the process of positive regulation of cell division, which is an important process in lip development [61]. Furthermore, the authors found that the downstream targets of the gene were involved in the wound healing processes and in the positive regulation of transcription from RNA polymerase II promoter, processes which are critical for palatogenesis [61].
Although in our study we found no significant differences in the genetic expression of the gene, protein expression analysis using IHC did show us a significant increase in the expression levels in cleft tissue. A critical moment in lip formation occurs just before the completion of the upper lips whereby the lateral nasal processes show a heightened session of cell division [62,63]. Disturbances in this process can result in clefting. Since both HOXB3 and DLX4 appear to accelerate cell proliferation, it is interesting to find a moderate positive correlation between the expression of the two genes in the cleft epithelial tissue, indicating some underlying signaling between the two genes which requires further investigation.

3.3. MSX2 Overexpression Causes Disturbances in Normal Tooth and Bone Development

In odontogenesis (formation of teeth), amelogenesis is a key process through which the enamel is formed. For successful amelogenesis to occur, dentinogenesis (formation of dentin) must occur. A precursor event to both these processes is the interaction between the epithelial and mesenchymal cells that allows the former to differentiate into ameloblasts which produce the enamel while the later differentiates into odontoblasts which produce the dentin [64,65]. Multiple case reports have been published showcasing the high prevalence of tooth anomalies in cleft affected children [66,67,68]. In cleft children predominantly enamel defects have been reported in the maxillary permanent central incisors which are adjacent to the clefts, with the intensity of defects correlating strongly with the severity of the clefting [66,67,68]. Studies in mice and humans have shown that silencing of the MSX2 gene due to mutations leads to amelogenesis imperfecta [69,70,71]. Furthermore, overexpression of MSX2 also leads to dental anomalies [72], which highlights the crucial role of the gene in cleft patients.
Apart from its role in tooth development, MSX2 also plays a crucial role in bone formation. Overexpression of MSX2 (as seen in our study using IHC) caused by sustained TNF-α levels (shown in previous study; Figure 7) [26] leads to NF-κB activation which in turn inhibits the bone morphogenetic protein 2 (BMP2)-induced expression of alkaline phosphatase (ALP) enzyme [73], thereby hindering bone formation. Interestingly, in another study we found a statistically significant decrease in BMP2 and BMP4 expression in bilateral cleft lip and palate tissue [74], which highlights the role of MSX2 in alveolar bone regeneration and the remodeling process. Additionally, interactions between MSX2 and FGF2 in bone formation abnormalities have also been reported [75,76]. In a study in mouse mammary epithelial cells, Bari et al., demonstrated that MSX2 expression downregulated epithelial marker E-cadherin expression and caused an upregulation of the mesenchymal markers vimentin and N-cadherin [77]. Furthermore, the authors showed that MSX2 promoted EMT in epithelial cells [77], which is essential during midline fusion of the palatal shelves.

3.4. Overexpression of NF-κB Promotes Chronic Inflammation and Bone Resorption

Apart from the known role of NF-κB in inflammation promotion, it has also been implicated in other processes seen in cleft patients. Bone formation and maintenance is a dynamic process that is under the regulatory control of various factors. While we noted previously an increase in FGF/FGFR pathways [40] which promote osteoblast differentiation, a chronic inflammatory state coupled with decrease in BMPs and TGF-β1/3 expression [26,74] usually results in greater bone resorption in cleft patients. This process is further compounded by an increase in the NF-κB expression due to activation of the classical pathway by TNF-α, IL-1β, IL-6, and IL-17 produced by T cells and other cells, all of which have been reported to be elevated in cleft tissue [26].
Like MSX2, NF-κB overexpression has also been associated with dental anomalies. In a study using the mice model, Blackburn et al., showed that NF-κB overexpression induces an ectopic odontogenesis program that is usually suppressed under physiological conditions [78]. Furthermore, they found that mice overexpressing NF-κB show supernumerary teeth [78], a complication which was found to be the third most common dental anomaly affecting as much as 16% of cleft affected children [79].

3.5. PTX3 Overexpression can Lead to Dysregulated Wound Healing

The pentraxins are a large highly conserved superfamily of pattern recognition proteins that are major components of the humoral arm of the innate immune system [80]. The commonly known pentraxins include the C-reactive protein (CRP) and serum amyloid P component (SAP), both of which unlike PTX3, are short pentraxins produced in the liver [80]. PTX3 has been shown to be upregulated in response to a rise in transcriptional factors such as NF-κB in monocytes, macrophages, and endothelial cells (Figure 7) [80]. Furthermore, it has been shown to attenuate excessive macrophage-mediated inflammatory activity, thereby promoting the wound healing processes [80]. Additionally, overexpression of PTX3 gene has been demonstrated in mice to be associated with severe tissue injury and lethality, especially after ischemic events [81]. This enhanced lethality has been attributed to the exacerbated inflammatory response and the production of PTX3 mediated pro-inflammatory cytokines, especially TNF-α [81]. In the present study, although no change in gene expression was noted, there may be differences in protein expression that need further evaluation.
Apart from regulating the inflammatory responses, PTX3 has also been shown to play a crucial role in tissue remodeling following an injury. In mice models it has been demonstrated that deficiency of PTX3 leads to altered thrombotic responses coupled with increased deposition of both fibrin and collagen [82,83,84]. Moreover, PTX3-deficient macrophages and fibroblasts were associated with defective fibrinolytic activity [82]. The deficiency of the gene has been further shown to suppress osteoblast function leading to a lower bone volume in mice models [85]. Due to its FGF2 binding properties, it acts as a bone protective factor which is important for osteoblast maturation by antagonizing the negative effects of FGF2 during early stages of bone formation [85]. PTX3 expression has also been linked to promote EMT in human proximal tubular epithelial cells, thereby inducing fibrotic changes in the renal tissue [86].

3.6. Limitations of the Present Study

The relevance and importance of the studies like the present one has been discussed and reported previously [40]. However, the results obtained in the present study are constrained by certain limitations. First, the limited number of control and cleft patients in the present study limits our ability to generalize our findings. This is rather understandable due to genuine concerns of the parents, given the tender age at which corrective surgery is undertaken [26,40]. Secondly, the complex etio-pathogenesis of cleft lip and palate makes it difficult to predict or state whether neonatal gene expression resembles embryonic gene expression, especially during the events just prior and during the palatal closure. Thirdly, there is extremely limited data in terms of comparison with the two stages of dentition in humans—the primary or milk dentition and the mixed dentition stages, which makes it difficult to analyze the gene expression and interactions. Fourth, gene-gene interactions (including gene products and transcriptional factors) are difficult to elucidate completely, even more so in the setting of a polyfactorial etiology. Finally, the role of environmental factors like maternal and paternal family history, lifestyle etc. have profound effects on the manifestations and clinical course of the condition, both of which are difficult to ascertain. Nonetheless, the results obtained in the present study can serve as a baseline for future studies to explore the molecular and phenotypic connections between various cytokines, candidate genes, and tissue repair genes.

4. Materials and Methods

4.1. Demographic Profile of the Study Participants

In the present study, lip mucosal tissue samples were obtained from 15 pediatric children (seven female children and eight male children) who reported at the Department of Oral and Maxillofacial Surgery, Institute of Stomatology, Riga Stradiņš University (RSU), Latvia, for consultation and treatment of unilateral non-syndromic congenital cleft lip and/or palate (Table 2). The tissue material was collected during the corrective plastic surgery from the site of clefting by the same surgeon. None of the children were previously diagnosed with coexisting genetic syndromes, chromosomal abnormalities, or immune deficiencies. Additionally, seven (three female children and four male children) control pediatric patients were enrolled. These children reported to the department for correction of low attached upper lip frenulum. The lip mucosal tissue material was obtained during upper labial frenectomy and was free of any pathology (including clefting) and/or inflammation. The control children were aged between five and six years.

4.2. Ethical Permission and Consent for Participation

The study design and protocol were approved by the Research Ethics Committee (REC) of RSU wide approval no. 5/28.06.2018, per the guidelines in the 1975 Declaration of Helsinki (revised in 2008). The study protocol additionally complied with the frameworks of the local and EU ethical norms. Written and oral consents from all pediatric patients were obtained from the parents/legal guardians for participation in the study. Simultaneous consent for publication of the study data was also obtained.

4.3. Sample Collection and Processing

Tissue samples collected during the corrective surgery (plastic surgery for cleft affected children and frenectomy for control children) were fixed for a day in a mixture of 2% formaldehyde and 0.2% picric acid in 0.1M phosphate buffer (pH 7.2). Prior to paraffin embedment, the samples were treated and rinsed with 10% saccharose containing Tyrode buffer for 12 h. The samples were then registered and assigned randomized internal codes. Only the internal codes and patient history (as shown in Table 2) was kept and disclosed to the researchers and/or lab assistants.

4.4. Slide Preparation and Visualization of Routine Histological Staining

Serial tissue sections of 3–4 µm were prepared from the solidified paraffin block for routine hematoxylin and eosin staining (H&E) and immunohistochemistry (IHC). Tissue sections were loaded on the slides and kept for 20–60 min in a thermostat at 56 °C. De-paraffinization of the sections was done using 96% ethanol and xylene solutions before H&E staining (Mayer’s; Bio Optica Milano, Milan, Italy). Slides were dehydrated with ethanol and clarified with carboxylol and xylene. A drop of histological Pertex glue (Histolab Products AB, Askim, Sweden) was applied and slides were covered with a cover glass. Visualization of the slides was done using Leica DC 300F brightfield light microscope (Leica DM500RB; Leica Biosystems Richmond, Richmond, IL, USA).

4.5. Biotin-Streptavidin Immunohistochemistry (IHC)

Prepared tissue sections (de-paraffinized, washed, and cleared) were rinsed for 10 min with TRIS wash buffer (Diapath, Martinengo, Italy) and then boiled in EDTA buffer for 10 min. The tissue sections were then cooled to 65 °C before second placement in TRIS wash buffer. 3% peroxidase (Dako, Naestved, Denmark) was used to block the activity of the endogenous peroxidase. Antibody diluent (Cell MarqueTM, Rocklin, CA, USA) was used to dilute the antibodies. The tissue sections were incubated with primary antibodies for 2 h in accordance with manufacturer’s protocols (Table 3). The sections were then washed with TRIS wash buffer. The HiDef DetectionTM HRP polymer system (Cell MarqueTM, Rocklin, CA, USA) was used for rabbit antibodies as per the manufacturer’s guidelines.
Tissue sections were subsequently incubated with biotin-containing secondary antibody for 30 min followed by rinsing for 10 min in TRIS wash buffer. This step was repeated for incubation with tertiary antibody. DAB+ chromogenic liquid was used to coat the tissue sections (DAB Substrate Kit, Cell MarqueTM, Rocklin, CA, USA). Finally, the sections were incubated at room temperature for 10 min to obtain brown staining of immunoreactive structures. The sections then underwent washing using distilled water and were counter-stained with haematoxylin for 2 min. Dehydration was performed using ethanol solution followed by clarification using carboxylol and xylene. The slides were then visualized using a light microscope (described in previous section). Negative and positive IHC controls were also prepared for each sample in the study.

4.6. Chromogenic In-Situ Hybridization (CISH)

Pretreatment and denaturation of the sections was done following standard laboratory protocol using the ZytoDot 2C CISH Implementation Kit (ZytoVision GmbH, Bremerhaven, Germany). CISH probes of DLX4, HOXB3, MSX2, and PTX3 genes were used in the present study (Empire Genomics, Williamsville, NY, USA). Hybridization was done using 10 µL of each probe followed by covering of the slides using coverslip. The slides were then placed on a hot plate for 5 min at 79 °C, and transferred to a humidity chamber overnight at 37 °C. On the following day, the coverslips were removed, and DAB solution was applied to the slide per the manufacturer’s protocol. The nucleus was counterstained with a nuclear dye and dehydration using increasing gradients of ethanol was done. Cover slip was placed, and the hybridized probe fragments were visualized using brightfield microscope. Under the microscope, two brown coloured dots (signals) were expected per nuclei of normal cells in interphase or metaphase without aberrations of the examined chromosomes. Due to limited availability of tissue material, only three control samples were used for CISH (1 female child and 2 male children).

4.7. Semi-Quantitative Grading and Statistical Analysis

The slides were analyzed under the microscope and with Image Pro Plus 6.0 (Media Cybernetics, Rockville, MD, USA). For IHC reactions, cells with brown nucleus/cytoplasm were considered as immunoreactive or immunopositive. Semi-quantitative grading of the epitheliocytes and connective tissue cells was done by two independent morphologists in at least five randomly selected vision fields at 400× magnification. For CISH, brown signals were evaluated per nuclei in at least 30 cells of each type (epitheliocytes, endotheliocyte, and connective tissue cells) at 1000× magnification using immersion oil. A grading scale interpretation table developed in our previous study was used for evaluating IHC and CISH results (Supplementary Tables S1 and S2) [40].
Statistical analysis was performed using non-parametric related samples Wilcoxon signed rank test for comparison within different cells (intra-group analysis). For control vs. cleft tissue comparison, a Mann Whitney U test and one-sample Wilcoxon signed rank test were used (inter-group analysis). Spearman’s rho was used for correlation analysis. Statistics were done using SPSS v26.0 (IBM Corp., Armonk, NY, USA). For statistical analysis, the numbers of “+” values were considered as equivalent to absolute whole numbers (e.g., “+” corresponded to 1; “++” corresponded to 2, and so on). Statistical significance was set at p < 0.05.

5. Conclusions

The following three conclusions are noteworthy from our present study:
  • Residual expression of DLX4 upregulates the expression of NF-κB in cleft mucosa leading to increased cellular proliferation and promotion of a pro-inflammatory environment. This accelerated proliferative state is further stimulated by the elevated HOXB3 expression.
  • Elevated expression of MSX2 and NF-κB in the cleft-affected lip tissue seems to negatively affect critical developmental pathways, resulting in the formation and persistence of a dysregulated hard tissue postnatally, a finding commonly reported in the cleft patients.
  • The PTX3 gene plays a crucial role in regulating and fine-tuning the persistent inflammatory responses characteristically seen in the postnatal cleft affected lip mucosa.

Supplementary Materials

The following are available online at https://www.mdpi.com/article/10.3390/jpm11111135/s1, Table S1: Summarized dataset of results obtained from immunohistochemistry (IHC), Table S2: Summarized dataset of results obtained from chromogenic in-situ hybridization (CISH), Figure S1: Positive and negative controls for DLX4 IHC antibody, Figure S2: Positive and negative controls for HOXB3 IHC antibody, Figure S3: Positive and negative controls for MSX2 IHC antibody, Figure S4: Positive and negative controls for NF-κB IHC antibody.

Author Contributions

The present study was conceptualized, designed, and implemented by M.P. and N.J. Statistical analysis, data curation, literature search and visualization of the data was done by N.J. Funding and project supervision was done by M.P. The initial draft was written by N.J. while reviewing and editing was done by M.P. and N.J. All authors have read and agreed to the published version of the manuscript.

Funding

The present study was funded by Riga Stradinš University (RSU).

Institutional Review Board Statement

The study was approved by the Research Ethics Committee (REC) of Riga Stradinš University (RSU) wide approval no. 5/26.08.2018. The protocol was designed and implemented per the guidelines outlined in the Declaration of Helsinki.

Informed Consent Statement

Informed consent (written and oral) was obtained from parents/legal guardians of the minor children for participation in the study and subsequent publication of the results.

Data Availability Statement

All results obtained from IHC and CISH are presented in the Supplementary Tables S1 and S2.

Acknowledgments

We would like to extend our gratitude to Ilze Akota, Department of Oral & Maxillofacial Surgery, Faculty of Dentistry, RSU for providing the patient material. We would also like to acknowledge the parents of the patients for consenting to participate in the present study.

Conflicts of Interest

The authors declare no competing interests in the present study. Furthermore, neither funders nor the funding institution had a role in the design of the study; in the collection, analysis, or interpretation of data; in the writing of the manuscript, or in the decision to publish the results.

References

  1. Bürglin, T.R. A comprehensive classification of homeobox genes. In Guidebook to the homeobox Genes; Duboule, D., Ed.; Oxford University Press: Oxford, UK, 1994; pp. 25–71. [Google Scholar]
  2. Bürglin, T.R. Homeodomain proteins. In Encyclopedia of Molecular Cell Biology and Molecular Medicine; Meyers, R.A., Ed.; Wiley-VCH Verlag GmbH & Co: Weinheim, Germany, 2005; pp. 179–222. [Google Scholar]
  3. Holland, P.W.H.; Booth, H.A.F.; Bruford, E. Classification and nomenclature of all human homeobox genes. BMC Biol. 2007, 5, 1–28. [Google Scholar] [CrossRef] [PubMed] [Green Version]
  4. Suryadeva, S.; Khan, M.B. Role of Homeobox Genes in Tooth Morphogenesis: A Review. J. Clin. Diagn. Res. 2015, 9, ZE09–ZE12. [Google Scholar] [CrossRef] [PubMed]
  5. Boncinelli, E. Homeobox genes and disease. Curr. Opin. Genet. Dev. 1997, 7, 331–337. [Google Scholar] [CrossRef]
  6. Nam, J.; Nei, M. Evolutionary Change of the Numbers of Homeobox Genes in Bilateral Animals. Mol. Biol. Evol. 2005, 22, 2386–2394. [Google Scholar] [CrossRef] [Green Version]
  7. Ryan, J.F.; Burton, P.M.; E Mazza, M.; Kwong, G.K.; Mullikin, J.C.; Finnerty, J.R. The cnidarian-bilaterian ancestor possessed at least 56 homeoboxes: Evidence from the starlet sea anemone, Nematostella vectensis. Genome Biol. 2006, 7, R64. [Google Scholar] [CrossRef] [Green Version]
  8. Jeong, J.; Cesario, J.; Zhao, Y.; Burns, L.; Westphal, H.; Rubenstein, J.L. Cleft palate defect ofDlx1/2−/− mutant mice is caused by lack of vertical outgrowth in the posterior palate. Dev. Dyn. 2012, 241, 1757–1769. [Google Scholar] [CrossRef] [Green Version]
  9. Trinh, B.Q.; Barengo, N.; Naora, H. Homeodomain protein DLX4 counteracts key transcriptional control mechanisms of the TGF-β cytostatic program and blocks the antiproliferative effect of TGF-β. Oncogene 2011, 30, 2718–2729. [Google Scholar] [CrossRef] [Green Version]
  10. Neufing, P.J.; Kalionis, B.; Horsfall, D.J.; Ricciardelli, C.; Stahl, J.; Vivekanandan, S.; Raymond, W.; Tilley, W.D. Expression and localization of homeodomain proteins DLX4/HB9 in normal and malignant human breast tissues. Anticancer. Res. 2003, 23, 1479–1488. [Google Scholar]
  11. Xian, Y.S.; Dang, C.X.; Yan, C.X.; Li, H.P.; Fu, S.W.; Wang, Z.R. Clinicopathological significance of homeobox BP1 mRNA expression in lung cancer tissue. J. South. Med Univ. 2006, 26, 1173–1175. [Google Scholar]
  12. Schwartz, A.M.; Man, Y.-G.; Rezaei, M.K.; Simmens, S.J.; E Berg, P. BP1, a homeoprotein, is significantly expressed in prostate adenocarcinoma and is concordant with prostatic intraepithelial neoplasia. Mod. Pathol. 2008, 22, 1–6. [Google Scholar] [CrossRef]
  13. Hollington, P.; Neufing, P.; Kalionis, B.; Waring, P.; Bentel, J.; Wattchow, D.; Tilley, W.D. Expression and localization of homeodomain proteins DLX4, HB9 and HB24 in malignant and benign human colorectal tissues. Anticancer Res. 2004, 24, 955–962. [Google Scholar]
  14. Wu, D.; Mandal, S.; Choi, A.; Anderson, A.; Prochazkova, M.; Perry, H.; Gil-Da-Silva-Lopes, V.L.; Lao, R.; Wan, E.; Tang, P.L.-F.; et al. DLX4is associated with orofacial clefting and abnormal jaw development. Hum. Mol. Genet. 2015, 24, 4340–4352. [Google Scholar] [CrossRef] [Green Version]
  15. He, M.; Bian, Z. Association between DLX4 Polymorphisms and Nonsyndromic Orofacial Clefts in a Chinese Han Population. Cleft Palate-Craniofacial J. 2019, 56, 357–362. [Google Scholar] [CrossRef]
  16. De Araujo, T.K.; Secolin, R.; Félix, T.M.; de Souza, L.T.; Fontes, M.; Ítalo, B.; Monlleo, I.; de Souza, J.; Fett-Conte, A.C.; Ribeiro, E.M.; et al. A multicentric association study between 39 genes and nonsyndromic cleft lip and palate in a Brazilian population. J. Cranio-Maxillofacial Surg. 2016, 44, 16–20. [Google Scholar] [CrossRef]
  17. Vieira, A.R.; Avila, J.R.; Daack-Hirsch, S.; Dragan, E.; Félix, T.M.; Rahimov, F.; Harrington, J.; Schultz, R.R.; Watanabe, Y.; Johnson, M.; et al. Medical Sequencing of Candidate Genes for Nonsyndromic Cleft Lip and Palate. PLoS Genet. 2005, 1, e64. [Google Scholar] [CrossRef] [Green Version]
  18. Davideau, J.-L.; Demri, P.; Hotton, D.; Gu, T.-T.; MacDougall, M.; Sharpe, P.; Forest, N.; Berdal, A. Comparative Study of MSX-2, DLX-5, and DLX-7 Gene Expression during Early Human Tooth Development. Pediatr. Res. 1999, 46, 650. [Google Scholar] [CrossRef] [Green Version]
  19. Alappat, S.; Zhang, Z.Y.; Chen, Y.P. Msx homeobox gene family and craniofacial development. Cell Res. 2003, 13, 429–442. [Google Scholar] [CrossRef]
  20. Dodig, M.; Tadic, T.; Kronenberg, M.S.; Dacic, S.; Liu, Y.-H.; Maxson, R.; Rowe, D.W.; Lichtler, A.C. EctopicMsx2Overexpression Inhibits andMsx2Antisense Stimulates Calvarial Osteoblast Differentiation. Dev. Biol. 1999, 209, 298–307. [Google Scholar] [CrossRef] [Green Version]
  21. Liu, Y.-H.; Tang, Z.; Kundu, R.K.; Wu, L.; Luo, W.; Zhu, D.; Sangiorgi, F.; Snead, M.L.; Maxson, R.E. Msx2Gene Dosage Influences the Number of Proliferative Osteogenic Cells in Growth Centers of the Developing Murine Skull: A Possible Mechanism forMSX2-Mediated Craniosynostosis in Humans. Dev. Biol. 1999, 205, 260–274. [Google Scholar] [CrossRef] [Green Version]
  22. Zhang, H.; Xie, J.; So, K.K.H.; Tong, K.K.; Sae-Pang, J.J.; Wang, L.; Tsang, S.L.; Chan, W.Y.; Wong, E.Y.M.; Sham, M.H. Hoxb3 Regulates Jag1 Expression in Pharyngeal Epithelium and Affects Interaction With Neural Crest Cells. Front. Physiol. 2021, 11. [Google Scholar] [CrossRef]
  23. Bai, N.; Liu, Y.; Chen, G.; Zhu, Z. Analysis of Genetic Regulation and Cytokine Expressions of Distraction Osteogenesis Reconstruction for Cleft Palate. J. Craniofacial Surg. 2014, 25, 2231–2236. [Google Scholar] [CrossRef]
  24. Papathanasiou, E.; Trotman, C.; Scott, A.; Van Dyke, T. Current and Emerging Treatments for Postsurgical Cleft Lip Scarring: Effectiveness and Mechanisms. J. Dent. Res. 2017, 96, 1370–1377. [Google Scholar] [CrossRef]
  25. Nesterova, I.; Mitropanova, M.; Chudilova, G.; Lomtatidze, L. Osteocalcin and regulatory cytokine imbalance in children with congenital cleft lip and palate. Immunol. Med. 2020, 43, 130–134. [Google Scholar] [CrossRef]
  26. Pilmane, M.; Jain, N.; Jain, S.; Akota, I.; Kroiča, J. Quantification of Cytokines in Lip Tissue from Infants Affected by Congenital Cleft Lip and Palate. Children 2021, 8, 140. [Google Scholar] [CrossRef]
  27. Jimi, E.; Ghosh, S. Role of nuclear factor-κB in the immune system and bone. Immunol. Rev. 2005, 208, 80–87. [Google Scholar] [CrossRef]
  28. Hayden, M.S.; Ghosh, S. Regulation of NF-κB by TNF family cytokines. Semin. Immunol. 2014, 26, 253–266. [Google Scholar] [CrossRef] [Green Version]
  29. Sun, S.C. Non-canonical NF-kappaB signaling pathway. Cell Res. 2011, 21, 71–85. [Google Scholar] [CrossRef] [Green Version]
  30. Israel, A. The IKK complex, a central regulator of NF-kappaB activation. Cold Spring Harb Perspect Biol. 2010, 2, a000158. [Google Scholar] [CrossRef] [PubMed] [Green Version]
  31. Karin, M.; Delhase, M. The I kappa B kinase (IKK) and NF-kappa B: Key elements of proinflammatory signalling. Semin Immunol 2000, 12, 85–98. [Google Scholar] [CrossRef] [PubMed]
  32. Sun, S.C.; Liu, Z.G. A special issue on NF-kappaB signaling and function. Cell Res. 2011, 21, 1–2. [Google Scholar] [CrossRef] [PubMed]
  33. Bottazzi, B.; Doni, A.; Garlanda, C.; Mantovani, A. An Integrated View of Humoral Innate Immunity: Pentraxins as a Paradigm. Annu. Rev. Immunol. 2010, 28, 157–183. [Google Scholar] [CrossRef]
  34. Doni, A.; Peri, G.; Chieppa, M.; Allavena, P.; Pasqualini, F.; Vago, L.; Romani, L.; Garlanda, C.; Mantovani, A. Production of the soluble pattern recognition receptor PTX3 by myeloid, but not plasmacytoid, dendritic cells. Eur. J. Immunol. 2003, 33, 2886–2893. [Google Scholar] [CrossRef]
  35. Woo, J.M.; Kwon, M.-Y.; Shin, D.-Y.; Kang, Y.-H.; Hwang, N.; Chung, S.W. Human retinal pigment epithelial cells express the long pentraxin PTX3. Mol. Vis. 2013, 19, 303–310. [Google Scholar]
  36. Rubino, M.; Kunderfranco, P.; Basso, G.; Greco, C.; Pasqualini, F.; Serio, S.; Roncalli, M.; Laghi, L.; Mantovani, A.; Papait, R.; et al. Epigenetic regulation of the extrinsic oncosuppressor PTX3 gene in inflammation and cancer. OncoImmunology 2017, 6, e1333215. [Google Scholar] [CrossRef] [Green Version]
  37. Rodrigues, P.F.; Matarazzo, S.; Maccarinelli, F.; Foglio, E.; Giacomini, A.; Nunes, J.P.S.; Presta, M.; Dias, A.A.M.; Ronca, R. Long Pentraxin 3-Mediated Fibroblast Growth Factor Trapping Impairs Fibrosarcoma Growth. Front. Oncol. 2018, 8, 472. [Google Scholar] [CrossRef] [Green Version]
  38. Rusnati, M.; Camozzi, M.; Moroni, E.; Bottazzi, B.; Peri, G.; Indraccolo, S.; Amadori, A.; Mantovani, A.; Presta, M. Selective recognition of fibroblast growth factor-2 by the long pentraxin PTX3 inhibits angiogenesis. Blood 2004, 104, 92–99. [Google Scholar] [CrossRef] [Green Version]
  39. Camozzi, M.; Rusnati, M.; Bugatti, A.; Bottazzi, B.; Mantovani, A.; Bastone, A.; Inforzato, A.; Vincenti, S.; Bracci, L.; Mastroianni, D.; et al. Identification of an Antiangiogenic FGF2-binding Site in the N Terminus of the Soluble Pattern Recognition Receptor PTX3. J. Biol. Chem. 2006, 281, 22605–22613. [Google Scholar] [CrossRef] [Green Version]
  40. Pilmane, M.; Jain, N.; Vitenberga-Verza, Z. Expression Analysis of FGF/FGFR and FOX Family Proteins in Mucosal Tissue Obtained from Orofacial Cleft-Affected Children. Biology 2021, 10, 423. [Google Scholar] [CrossRef]
  41. Tamaoki, N.; Takahashi, K.; Aoki, H.; Iida, K.; Kawaguchi, T.; Hatakeyama, D.; Inden, M.; Chosa, N.; Ishisaki, A.; Kunisada, T.; et al. The homeobox gene DLX4 promotes generation of human induced pluripotent stem cells. Sci. Rep. 2014, 4, 7283. [Google Scholar] [CrossRef] [Green Version]
  42. Quinn, L.M.; Kilpatrick, L.M.; E Latham, S.; Kalionis, B. Homeobox genes DLX4 and HB24 are expressed in regions of epithelial-mesenchymal cell interaction in the adult human endometrium. Mol. Hum. Reprod. 1998, 4, 497–501. [Google Scholar] [CrossRef] [Green Version]
  43. Zhang, L.; Wan, Y.; Jiang, Y.; Zhang, Z.; Shu, S.; Cheng, W.; Lang, J. Overexpression of BP1, an isoform of Homeobox Gene DLX4, promotes cell proliferation, migration and predicts poor prognosis in endometrial cancer. Gene 2019, 707, 216–223. [Google Scholar] [CrossRef]
  44. Pilmane, M.; Sidhoma, E.; Akota, I.; Kazoka, D. Characterization of Cytokines and Proliferation Marker Ki67 in Cleft Affected Lip Tissue. Medicina 2019, 55, 518. [Google Scholar] [CrossRef] [Green Version]
  45. Fu, Y.; Lian, Y.; Kim, K.S.; Zhang, L.; Hindle, A.K.; Brody, F.; Siegel, R.S.; McCaffrey, T.A.; Fu, S.W. BP1 Homeoprotein Enhances Metastatic Potential in ER-negative Breast Cancer. J. Cancer 2010, 1, 54–62. [Google Scholar] [CrossRef] [Green Version]
  46. Sun, Y.-Y.; Lu, M.; Xi, X.-W.; Qiao, Q.-Q.; Chen, L.-L.; Xu, X.-M.; Feng, Y.-J. Regulation of Epithelial-Mesenchymal Transition by Homeobox Gene DLX4 in JEG-3 Trophoblast Cells: A Role in Preeclampsia. Reprod. Sci. 2011, 18, 1138–1145. [Google Scholar] [CrossRef]
  47. Tomida, S.; Yanagisawa, K.; Koshikawa, K.; Yatabe, Y.; Mitsudomi, T.; Osada, H.; Takahashi, T. Identification of a metastasis signature and the DLX4 homeobox protein as a regulator of metastasis by combined transcriptome approach. Oncogene 2007, 26, 4600–4608. [Google Scholar] [CrossRef] [Green Version]
  48. Kalluri, R.; Weinberg, R.A. The basics of epithelial-mesenchymal transition. J. Clin. Investig. 2009, 119, 1420–1428. [Google Scholar] [CrossRef] [Green Version]
  49. Perkins, N.D.; Gilmore, T.D. Good cop, bad cop: The different faces of NF-κB. Cell Death Differ. 2006, 13, 759–772. [Google Scholar] [CrossRef] [Green Version]
  50. Haria, D.; Trinh, B.Q.; Ko, S.Y.; Barengo, N.; Liu, J.; Naora, H. The Homeoprotein DLX4 Stimulates NF-κB Activation and CD44-Mediated Tumor–Mesothelial Cell Interactions in Ovarian Cancer. Am. J. Pathol. 2015, 185, 2298–2308. [Google Scholar] [CrossRef]
  51. Topley, N.; Jörres, A.; Luttmann, W.; Petersen, M.M.; Lang, M.J.; Thierauch, K.H.; Müller, C.; Coles, G.A.; Davies, M.; Williams, J.D. Human peritoneal mesothelial cells synthesize interleukin-6: Induction by IL-1 beta and TNF alpha. Kidney Int. 1993, 43, 226–233. [Google Scholar] [CrossRef] [Green Version]
  52. Bitzer, M.; von Gersdorff, G.; Liang, D.; Dominguez-Rosales, A.; Beg, A.A.; Rojkind, M.; Böttinger, E.P. A mechanism of suppression of TGF-beta/SMAD signaling by NF-kappa B/RelA. Genes Dev. 2000, 14, 187–197. [Google Scholar] [PubMed]
  53. Hara, F.; Samuel, S.; Liu, J.; Rosen, D.; Langley, R.R.; Naora, H. A Homeobox Gene Related to Drosophila Distal-Less Promotes Ovarian Tumorigenicity by Inducing Expression of Vascular Endothelial Growth Factor and Fibroblast Growth Factor-2. Am. J. Pathol. 2007, 170, 1594–1606. [Google Scholar] [CrossRef] [PubMed] [Green Version]
  54. Trinh, B.; Ko, S.Y.; Haria, D.; Barengo, N.; Naora, H. The homeoprotein DLX4 controls inducible nitric oxide synthase-mediated angiogenesis in ovarian cancer. Mol. Cancer 2015, 14, 1–11. [Google Scholar] [CrossRef] [PubMed] [Green Version]
  55. Myers, C.; Charboneau, A.; Boudreau, N. Homeobox B3 Promotes Capillary Morphogenesis and Angiogenesis. J. Cell Biol. 2000, 148, 343–352. [Google Scholar] [CrossRef] [PubMed] [Green Version]
  56. Yokote, H.; Fujita, K.; Jing, X.; Sawada, T.; Liang, S.; Yao, L.; Yan, X.; Zhang, Y.; Schlessinger, J.; Sakaguchi, K. Trans-activation of EphA4 and FGF receptors mediated by direct interactions between their cytoplasmic domains. Proc. Natl. Acad. Sci. USA 2005, 102, 18866–18871. [Google Scholar] [CrossRef] [Green Version]
  57. Sawada, T.; Arai, D.; Jing, X.; Furushima, K.; Chen, Q.; Kawakami, K.; Yokote, H.; Miyajima, M.; Sakaguchi, K. Trans-Activation between EphA and FGFR Regulates Self-Renewal and Differentiation of Mouse Embryonic Neural Stem/Progenitor Cells via Differential Activation of FRS2α. PLoS ONE 2015, 10, e0128826. [Google Scholar] [CrossRef] [Green Version]
  58. Straume, O.; Akslen, L.A. Importance of Vascular Phenotype by Basic Fibroblast Growth Factor, and Influence of the Angiogenic Factors Basic Fibroblast Growth Factor/Fibroblast Growth Factor Receptor-1 and Ephrin-A1/EphA2 on Melanoma Progression. Am. J. Pathol. 2002, 160, 1009–1019. [Google Scholar] [CrossRef] [Green Version]
  59. Sauvageau, G.; Lansdorp, P.M.; Eaves, C.J.; Hogge, D.; Dragowska, W.H.; Reid, D.S.; Largman, C.; Lawrence, H.J.; Humphries, R.K. Differential expression of homeobox genes in functionally distinct CD34+ subpopulations of human bone marrow cells. Proc. Natl. Acad. Sci. USA 1994, 91, 12223–12227. [Google Scholar] [CrossRef] [Green Version]
  60. Björnsson, J.M.; Larsson, N.; Brun, A.C.M.; Magnusson, M.; Andersson, E.; Lundström, P.; Larsson, J.; Repetowska, E.; Ehinger, M.; Humphries, R.K.; et al. Reduced Proliferative Capacity of Hematopoietic Stem Cells Deficient in Hoxb3 and Hoxb4. Mol. Cell. Biol. 2003, 23, 3872–3883. [Google Scholar] [CrossRef] [Green Version]
  61. Li, A.; Qin, G.; Suzuki, A.; Gajera, M.; Iwata, J.; Jia, P.; Zhao, Z. Network-based identification of critical regulators as putative drivers of human cleft lip. BMC Med Genom. 2019, 12, 119–132. [Google Scholar] [CrossRef] [Green Version]
  62. A Mossey, P.; Little, J.; Munger, R.G.; Dixon, M.J.; Shaw, W.C. Cleft lip and palate. Lancet 2009, 374, 1773–1785. [Google Scholar] [CrossRef]
  63. Blanton, S.H.; Henry, R.R.; Yuan, Q.; Mulliken, J.B.; Stal, S.; Finnell, R.; Hecht, J.T. Folate pathway and nonsyndromic cleft lip and palate. Birth Defects Res. Part A Clin. Mol. Teratol. 2011, 91, 50–60. [Google Scholar] [CrossRef] [Green Version]
  64. Kollar, E.J.; Lumsden, A.G. Tooth morphogenesis: The role of the innervation during induction and pattern formation. J. Boil. Buccale 1979, 7, 49–60. [Google Scholar]
  65. Thesleff, I.A.; Nieminen, P. Tooth Induction. Chichester; John Wiley & Sons Ltd.: Hoboken, NJ, USA, 2005. [Google Scholar]
  66. Maciel, S.P.; Costa, B.; Gomide, M.R. Difference in the Prevalence of Enamel Alterations Affecting Central Incisors of Children with Complete Unilateral Cleft Lip and Palate. Cleft Palate-Craniofacial J. 2005, 42, 392–395. [Google Scholar] [CrossRef]
  67. Freitas, J.A.D.S.; Neves, L.; Almeida, A.L.P.F.; Garib, D.; Trindade-Suedam, I.; Yaedu, R.Y.F.; Lauris, R.D.C.M.C.; Soares, S.; Oliveira, T.M.; Pinto, J.N. Rehabilitative treatment of cleft lip and palate: Experience of the Hospital for Rehabilitation of Craniofacial Anomalies/USP (HRAC/USP)—Part 1: Overall aspects. J. Appl. Oral Sci. 2012, 20, 9–15. [Google Scholar] [CrossRef]
  68. Oliveira, F.V.; Dionísio, T.J.; Neves, L.T.; Machado, M.A.A.M.; Santos, C.F.; Oliveira, T.M. Amelogenin gene influence on enamel defects of cleft lip and palate patients. Braz. Oral Res. 2014, 28, 1–6. [Google Scholar] [CrossRef] [Green Version]
  69. Satokata, I.; Ma, L.; Ohshima, H.; Bei, M.; Woo, I.; Nishizawa, K.; Maeda, T.; Takano, Y.; Uchiyama, M.; Heaney, S.; et al. Msx2 deficiency in mice causes pleiotropic defects in bone growth and ectodermal organ formation. Nat. Genet. 2000, 24, 391–395. [Google Scholar] [CrossRef]
  70. Bei, M.; Stowell, S.; Maas, R. Msx2controls ameloblast terminal differentiation. Dev. Dyn. 2004, 231, 758–765. [Google Scholar] [CrossRef]
  71. Babajko, S.; de La Dure-Molla, M.; Jedeon, K.; Berdal, A. MSX2 in ameloblast cell fate and activity. Front. Physiol. 2015, 5. [Google Scholar] [CrossRef] [Green Version]
  72. Ruspita, I.; Das, P.; Xia, Y.; Kelangi, S.; Miyoshi, K.; Noma, T.; Snead, M.L.; D’Souza, R.N.; Bei, M. An Msx2-Sp6-Follistatin Pathway Operates During Late Stages of Tooth Development to Control Amelogenesis. Front. Physiol. 2020, 11, 582610. [Google Scholar] [CrossRef]
  73. Lee, H.-L.; Yi, T.; Woo, K.M.; Ryoo, H.-M.; Kim, G.-S.; Baek, J.-H. Msx2 mediates the inhibitory action of TNF-α on osteoblast differentiation. Exp. Mol. Med. 2010, 42, 437–445. [Google Scholar] [CrossRef] [Green Version]
  74. Smane, L.; Pilmane, M. Evaluation of the presence of MMP-2, TIMP-2, BMP2/4, and TGFβ3 in the facial tissue of children with cleft lip and palate. Acta medica Litu. 2018, 25, 86–94. [Google Scholar] [CrossRef] [PubMed] [Green Version]
  75. Li, Y.; Liu, J.; Hudson, M.; Kim, S.; Hatch, N.E. FGF2 promotes Msx2 stimulated PC-1 expression via Frs2/MAPK signaling. J. Cell. Biochem. 2010, 111, 1346–1358. [Google Scholar] [CrossRef] [PubMed] [Green Version]
  76. A Ignelzi, M.; Wang, W.; Young, A.T. Fibroblast Growth Factors Lead to Increased Msx2 Expression and Fusion in Calvarial Sutures. J. Bone Miner. Res. 2003, 18, 751–759. [Google Scholar] [CrossRef] [PubMed]
  77. di Bari, M.; Ginsburg, E.; Plant, J.; Strizzi, L.; Salomon, D.; Vonderhaar, B. Msx2 induces epithelial-mesenchymal transition in mouse mammary epithelial cells through upregulation of Cripto-1. J. Cell. Physiol. 2009, 219, 659–666. [Google Scholar] [CrossRef] [Green Version]
  78. Blackburn, J.; Kawasaki, K.; Porntaveetus, T.; Kawasaki, M.; Otsuka-Tanaka, Y.; Miake, Y.; Ota, M.; Watanabe, M.; Hishinuma, M.; Nomoto, T.; et al. Excess NF-κB Induces Ectopic Odontogenesis in Embryonic Incisor Epithelium. J. Dent. Res. 2015, 94, 121–128. [Google Scholar] [CrossRef]
  79. Nicholls, W. Dental anomalies in children with cleft lip and palate in Western Australia. Eur. J. Dent. 2016, 10, 254–258. [Google Scholar] [CrossRef] [Green Version]
  80. Shiraki, A.; Kotooka, N.; Komoda, H.; Hirase, T.; Oyama, J.-I.; Node, K. Pentraxin-3 regulates the inflammatory activity of macrophages. Biochem. Biophys. Rep. 2016, 5, 290–295. [Google Scholar] [CrossRef] [Green Version]
  81. Souza, D.G.; Soares, A.C.; Pinho, V.; Torloni, H.; Reis, L.; Martins, M.T.; Dias, A.A.M. Increased Mortality and Inflammation in Tumor Necrosis Factor-Stimulated Gene-14 Transgenic Mice after Ischemia and Reperfusion Injury. Am. J. Pathol. 2002, 160, 1755–1765. [Google Scholar] [CrossRef] [Green Version]
  82. Doni, A.; Musso, T.; Morone, D.; Bastone, A.; Zambelli, V.; Sironi, M.; Castagnoli, C.; Cambieri, I.; Stravalaci, M.; Pasqualini, F.; et al. An acidic microenvironment sets the humoral pattern recognition molecule PTX3 in a tissue repair mode. J. Exp. Med. 2015, 212, 905–925. [Google Scholar] [CrossRef]
  83. Bonacina, F.; Barbieri, S.S.; Cutuli, L.; Amadio, P.; Doni, A.; Sironi, M.; Tartari, S.; Mantovani, A.; Bottazzi, B.; Garlanda, C.; et al. Vascular pentraxin 3 controls arterial thrombosis by targeting collagen and fibrinogen induced platelets aggregation. Biochim. Biophys. Acta (BBA)—Mol. Basis Dis. 2016, 1862, 1182–1190. [Google Scholar] [CrossRef]
  84. Cappuzzello, C.; Doni, A.; Dander, E.; Pasqualini, F.; Nebuloni, M.; Bottazzi, B.; Mantovani, A.; Biondi, A.; Garlanda, C.; D’Amico, G. Mesenchymal Stromal Cell-Derived PTX3 Promotes Wound Healing via Fibrin Remodeling. J. Investig. Dermatol. 2016, 136, 293–300. [Google Scholar] [CrossRef] [Green Version]
  85. Grčević, D.; Sironi, M.; Valentino, S.; Deban, L.; Cvija, H.; Inforzato, A.; Kovačić, N.; Katavic, V.; Kelava, T.; Kalajzić, I.; et al. The Long Pentraxin 3 Plays a Role in Bone Turnover and Repair. Front. Immunol. 2018, 9, 417. [Google Scholar] [CrossRef] [Green Version]
  86. Hung, T.-W.; Tsai, J.-P.; Lin, S.-H.; Lee, C.-H.; Hsieh, Y.-H.; Chang, H.-R. Pentraxin 3 Activates JNK Signaling and Regulates the Epithelial-To-Mesenchymal Transition in Renal Fibrosis. Cell. Physiol. Biochem. 2016, 40, 1029–1038. [Google Scholar] [CrossRef] [Green Version]
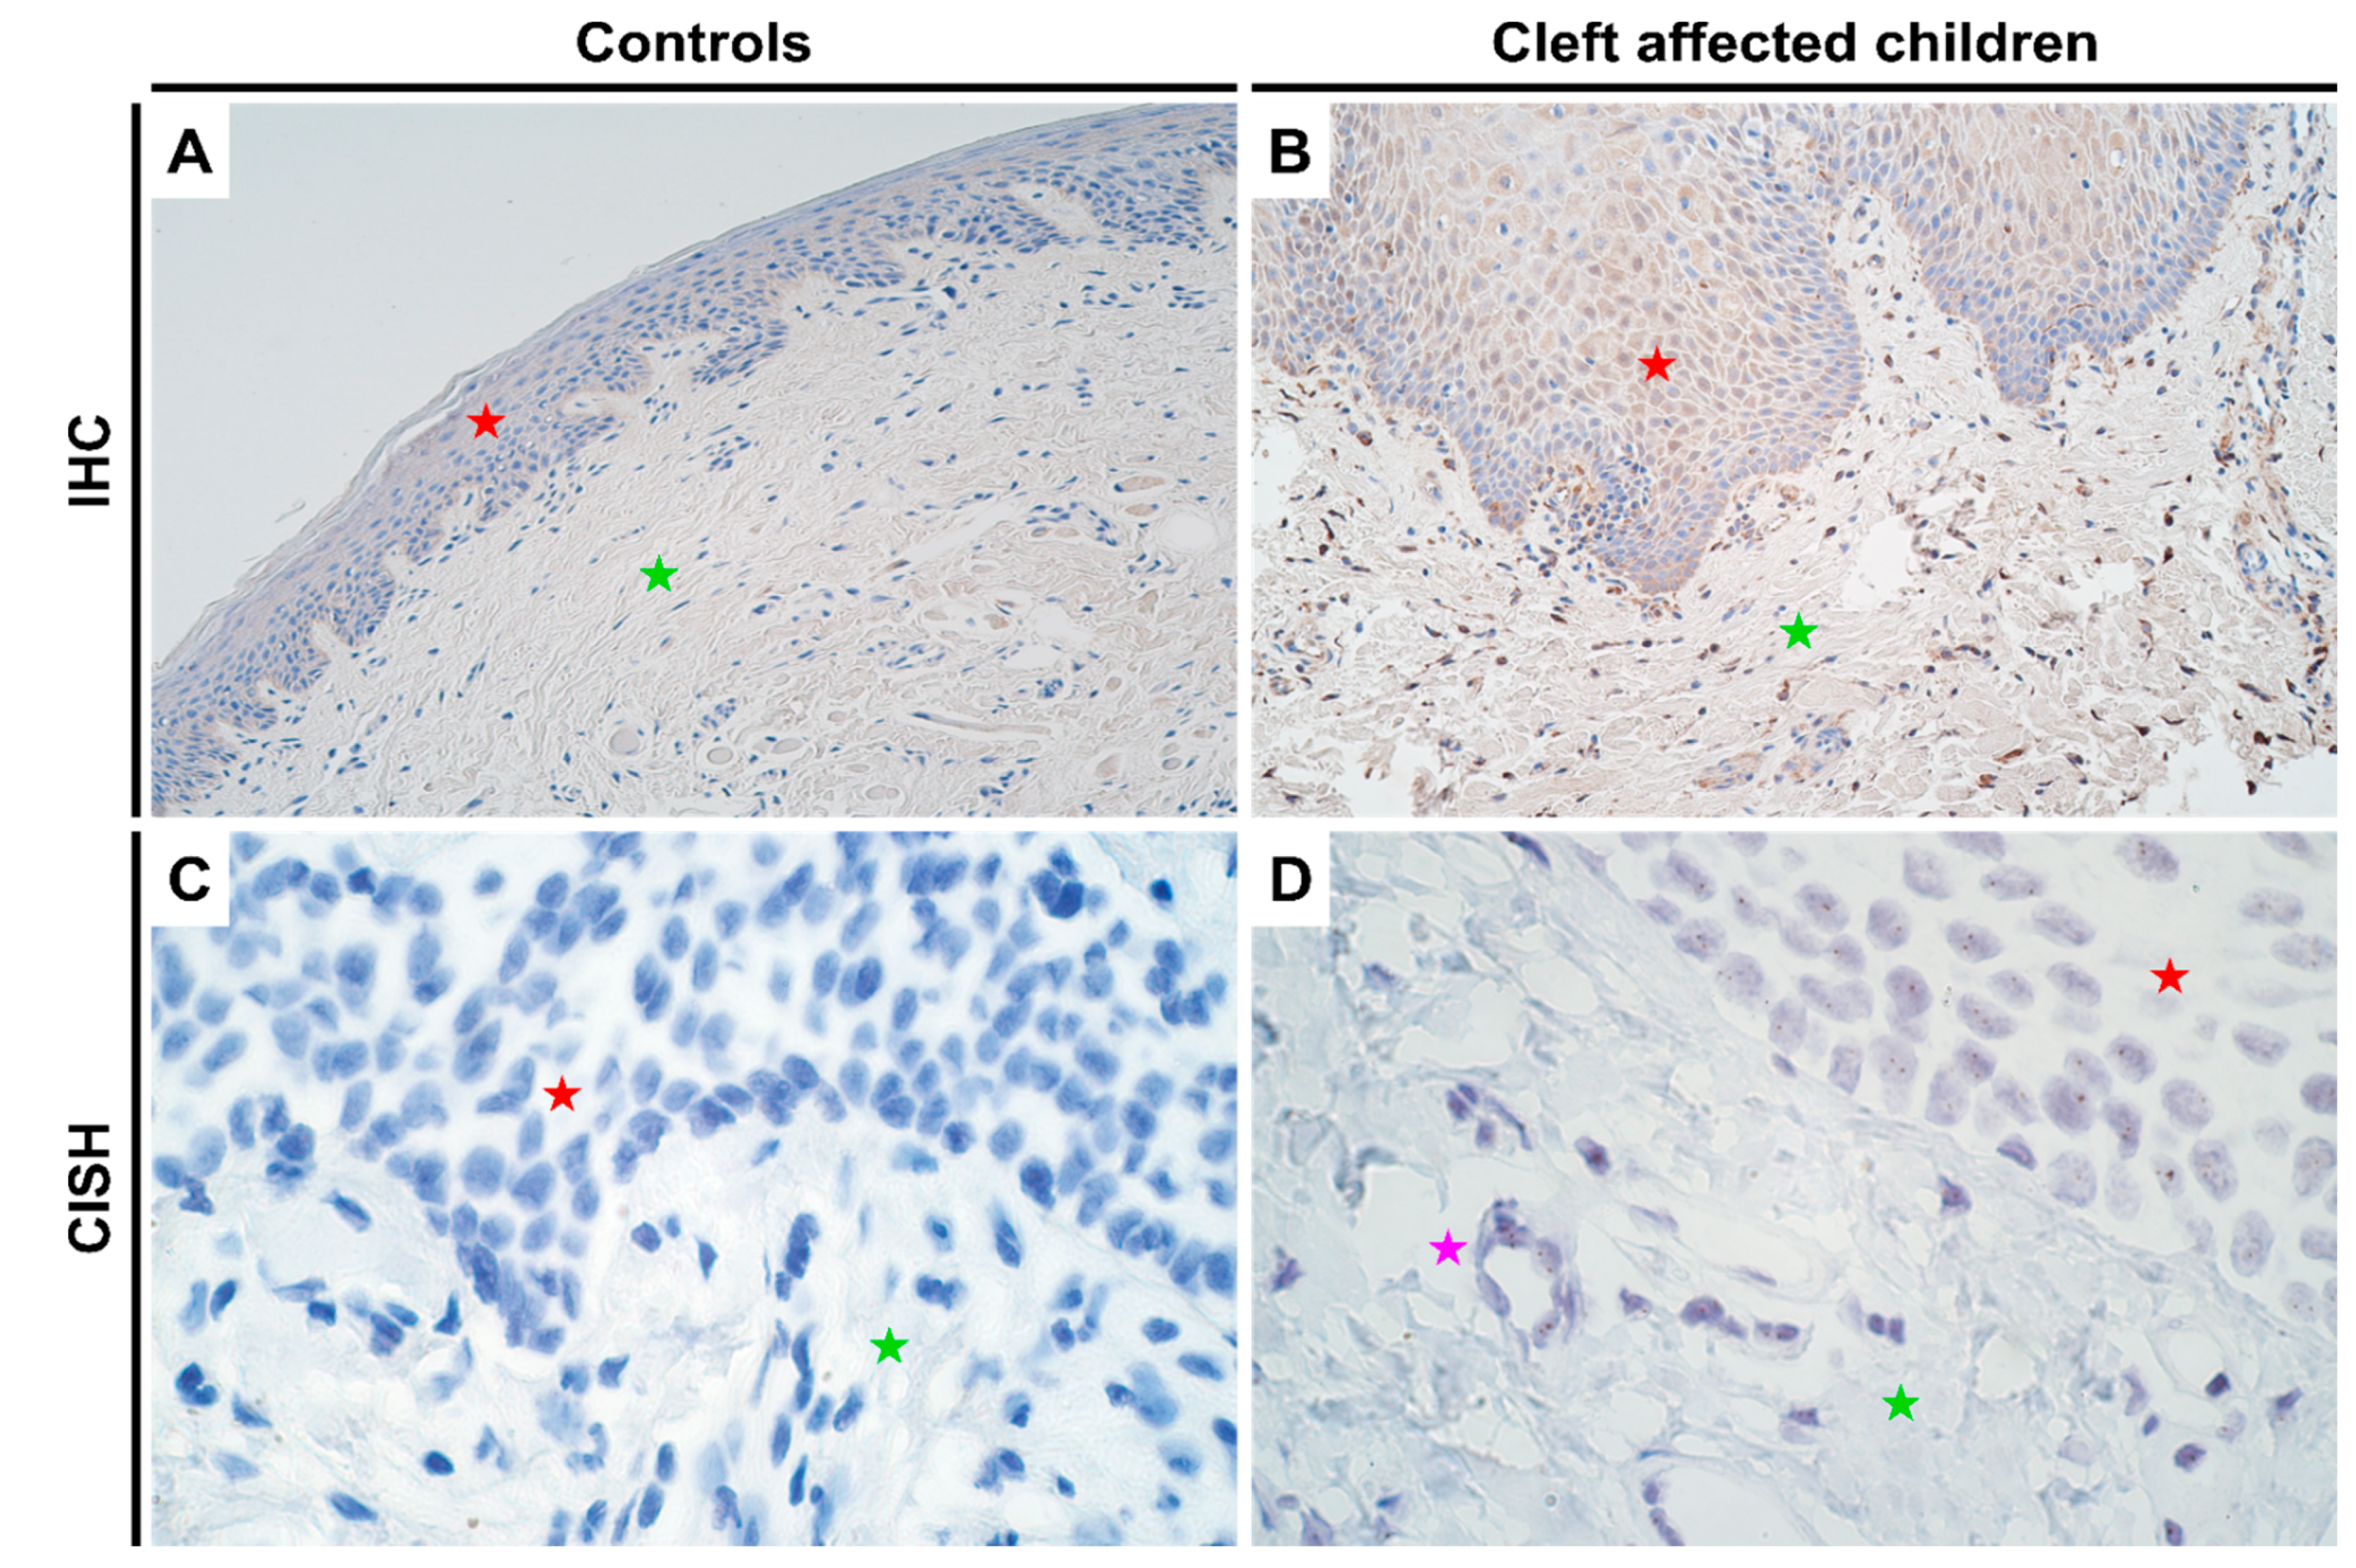
Figure 1. Expression of DLX4 gene visualized using IHC and CISH methods in controls and cleft patients. Protein expression of the DLX4 gene was visualized using immunohistochemistry (IHC) in (A) controls and (B) cleft affected children. (A) No positively stained (0) structures are visible in tissue obtained from controls; (B) Moderate number (++) of weakly stained epitheliocytes and distinctly stained connective tissue cells are seen in the cleft tissue obtained from a five-month-old girl. Original magnification, 200×. Gene amplification levels of DLX4 gene was visualized using chromogenic in-situ hybridization (CISH) in (C) controls and (D) cleft affected children. (C) No gene expression and amplification (0) are seen in the tissue obtained from controls; (D) No gene amplification (0) is seen; however, gene expression is seen by brown dots in the nucleus of the epithelium and endothelium cells in the cleft tissue obtained from an eight-month-old boy. Original magnification, 1000×. Red star indicates epithelium; green star indicates connective tissue, while purple star indicates endothelial cells.
Jpm 11 01135 g001
Figure 2. Expression of HOXB3 gene visualized using IHC and CISH methods in controls and cleft patients. Protein expression of the HOXB3 gene was visualized using immunohistochemistry (IHC) in (A) controls and (B) cleft affected children. (A) No positively stained (0) structures are visible in tissue obtained from controls; (B) Moderate number (++) of weakly stained epitheliocytes and connective tissue cells are seen in the cleft tissue obtained from a five-month-old girl. Original magnification, 200×. Gene amplification levels of HOXB3 gene was visualized using chromogenic in-situ hybridization (CISH) in (C) controls and (D) cleft affected children. (C) No gene amplification (0) is seen in the tissue obtained from controls; (D) No gene amplification (0) is seen; however, gene expression is seen by brown dots in the nucleus of the epithelial, endothelial, and connective tissue cells in the cleft tissue obtained from a three-month-old girl. Original magnification, 1000×. Red star indicates epithelium; green star indicates connective tissue, while purple star indicates endothelial cells.
Jpm 11 01135 g002
Figure 3. Expression of MSX2 gene visualized using IHC and CISH methods in controls and cleft patients. Protein expression of the MSX2 gene was visualized using immunohistochemistry (IHC) in (A) controls and (B) cleft affected children. (A) No positively stained (0) structures are visible in tissue obtained from controls; (B) Moderate number (++) of weakly stained epitheliocytes and endotheliocytes are seen in the cleft tissue obtained from a six-month-old girl. Original magnification, 200×. Gene amplification levels of MSX2 gene was visualized using chromogenic in-situ hybridization (CISH) in (C) controls and (D) cleft affected children. (C) No gene amplification (0) is seen in the tissue obtained from controls; (D) No gene amplification (0) is seen; however, gene expression is seen by brown dots in the nucleus of the epithelial, endothelial, and connective tissue cells in the cleft tissue obtained from a five-month-old boy. Original magnification, 1000×. Red star indicates epithelium; green star indicates connective tissue, while purple star indicates endothelial cells.
Jpm 11 01135 g003
Figure 4. Expression of NF-κB protein complex visualized using IHC in controls and cleft patients. Protein expression of NF-κB was visualized using immunohistochemistry (IHC) in (A) controls and (B) cleft affected children. (A) No positively stained (0) structures are visible in tissue obtained from controls; (B) Moderate number (++) of positively stained inflammatory cells are seen in the cleft tissue obtained from a three-month-old boy. Original magnification, 200×. Red star indicates epithelium while green star indicates connective tissue.
Jpm 11 01135 g004
Figure 5. Expression of PTX3 gene visualized using CISH in controls and cleft patients. Gene amplification levels of the PTX3 gene was visualized using chromogenic in-situ hybridization (CISH) in (A) controls and (B) cleft affected children. (A) No gene amplification (0) is seen in the tissue obtained from controls; (B) No gene amplification (0) is seen; however, gene expression is seen by brown dots in the nucleus of the epitheliocytes and connective tissue cells in the cleft tissue obtained from a five-month-old girl. Original magnification, 1000×. Red star indicates epithelium; green star indicates connective tissue, while purple star indicates endothelial cells.
Jpm 11 01135 g005
Figure 6. Correlation between protein expression of homeobox genes and NF-κB using IHC in cleft patients. Spearman’s Rho was used for correlation analysis. The legend for correlation is displayed on the left. Pink stars indicate significant correlation in expression (p < 0.05).
Jpm 11 01135 g006
Figure 7. Protein-protein interactions between candidate genes and cytokines in non-syndromic cleft palate and lip. A non-comprehensive simplified overview of the protein-protein interactions as obtained using STRING (adapted and modified from https://www.string-db.org/, accessed on 28 September 2021) is shown. Light blue bubbles indicate cytokines, green bubbles indicate proteins encoded by homeobox genes, orange bubbles indicate FGF/FGFR pathway proteins, pink bubbles indicate FOX pathway proteins, dark blue bubble indicates Ephrin A1 while yellow bubble indicates the PTX3 protein. Solid lines indicate interactions obtained from STRING database. Dashed lines indicate potential interactions obtained from literature. Arrow heads indicate the direction of interaction. Crossed head indicate negative regulation.
Jpm 11 01135 g007
Table 1. Average semi-quantitative score of the results obtained from IHC and CISH.
GroupsImmunohistochemistry (IHC)Chromogenic In-Situ Hybridization (CISH)
DLX4HOXB3MSX2NF-κBDLX4HOXB3MSX2PTX3
Controls
Epithelium0000ND *000
Connective Tissue0000ND *000
EndotheliumNTNTNTNTND *000
Cleft affected children
Epithelium1.7+2.1+1.4+1.7+0000
Connective Tissue1.6+1.1+0.6+1.1+0000
EndotheliumNT *NT *NT*NT *0000
* NT stands for not tested while ND stands for not determined (refer to Supplementary Tables S1 and S2 for interpretation).
Table 2. Clinical diagnosis and demographic profile of the cleft affected children.
Patient NumberAge (Months)GenderClinical Diagnosis Anamnesis
13FcCheilognathouranoschisis sinistra-
23McCheilognathouranoschisis dextra-
33.5McCheilognathouranoschisis sinistraMother reported use of paracetamol during pregnancy; father was smoker and partially alcoholic. Epilepsy in the family tree. Child was born overweight
44McCheilognathouranoschisis sinistraThere was a reported threat of miscarriage in the 36th gestational week; history of clefts in the family tree.
54FcCheilognathouranoschisis dextra-
64FcCheilognathouranoschisis sinistraBorn in the 42nd gestational week; mother reported use of paracetamol during pregnancy
74McCheilognathouranoschisis sinistraBorn in the 41st gestational week; mother reported use of paracetamol during pregnancy
84FcCheilognathouranoschisis sinistra-
94McCheilognathouranoschisis sinistra-
104FcCheilognathouranoschisis sinistra-
114.5McCheilognathouranoschisis sinistraHistory of Down syndrome in the family tree
125McCheilognathouranoschisis sinistraHistory of clefts in the family tree; mother reported use of Amoxiclav during pregnancy
135FcCheilognathouranoschisis sinistraMother developed gestational diabetes during the pregnancy
146FcCheilognathouranoschisis sinistra-
158McCheilognathouranoschisis sinistraBoth parents were regular smokers
Clinical diagnosis is provided in Latin; cheilognathouranoschisis—cleft lip, alveolar ridge, and palate; sinistra—left; dextra—right. Fc—female child; Mc—male child.
Table 3. Description and characteristics of the primary antibodies.
Primary Antibody *Antibody Characteristics **CloneDilutionCatalogue No.Manufacturer
DLX4Polyclonal rabbit AB against human AG-1:100orb626417Biorbyt Limited (UK)
HOXB3Polyclonal rabbit AB against human AGH-501:100sc-28606Santa Cruz (USA)
MSX2Polyclonal rabbit AB against human AG-1:100ab223692Abcam (UK)
NF-κB (p50/p105)Monoclonal rabbit AB against human AGE3811:100ab32360Abcam (UK)
* Abbreviations: DLX4—Distal-Less homeobox 4; HOXB3—homeobox B3; MSX2—Msh homeobox 2 and NF-κB—nuclear factor kappa-light-chain-enhancer of activated B cells. ** Abbreviations: AB, antibody; AG, antigen.
Publisher’s Note: MDPI stays neutral with regard to jurisdictional claims in published maps and institutional affiliations.