
Increased Expression of VANGL1 is Predictive of Lymph Node Metastasis in Colorectal Cancer: Results from a 20-Gene Expression Signature


 ,
,  , ,
, , 
Abstract
:
1. Introduction
2. Materials and Methods
2.1. Patients and Sample Collection
2.2. RNA Isolation
2.3. Quantitative and Qualitative Analysis of the Isolated RNA Samples
2.4. Real-Time PCR Analysis
2.5. Unsupervised Hierarchical Clustering
2.6. Immunohistochemistry and Evaluation of Staining
2.7. Statistical Analysis
3. Results
3.1. Clinical and Pathological Characteristics of Patients
3.2. Gene Expression Analysis
3.3. Heat Maps of Real-Time PCR Data
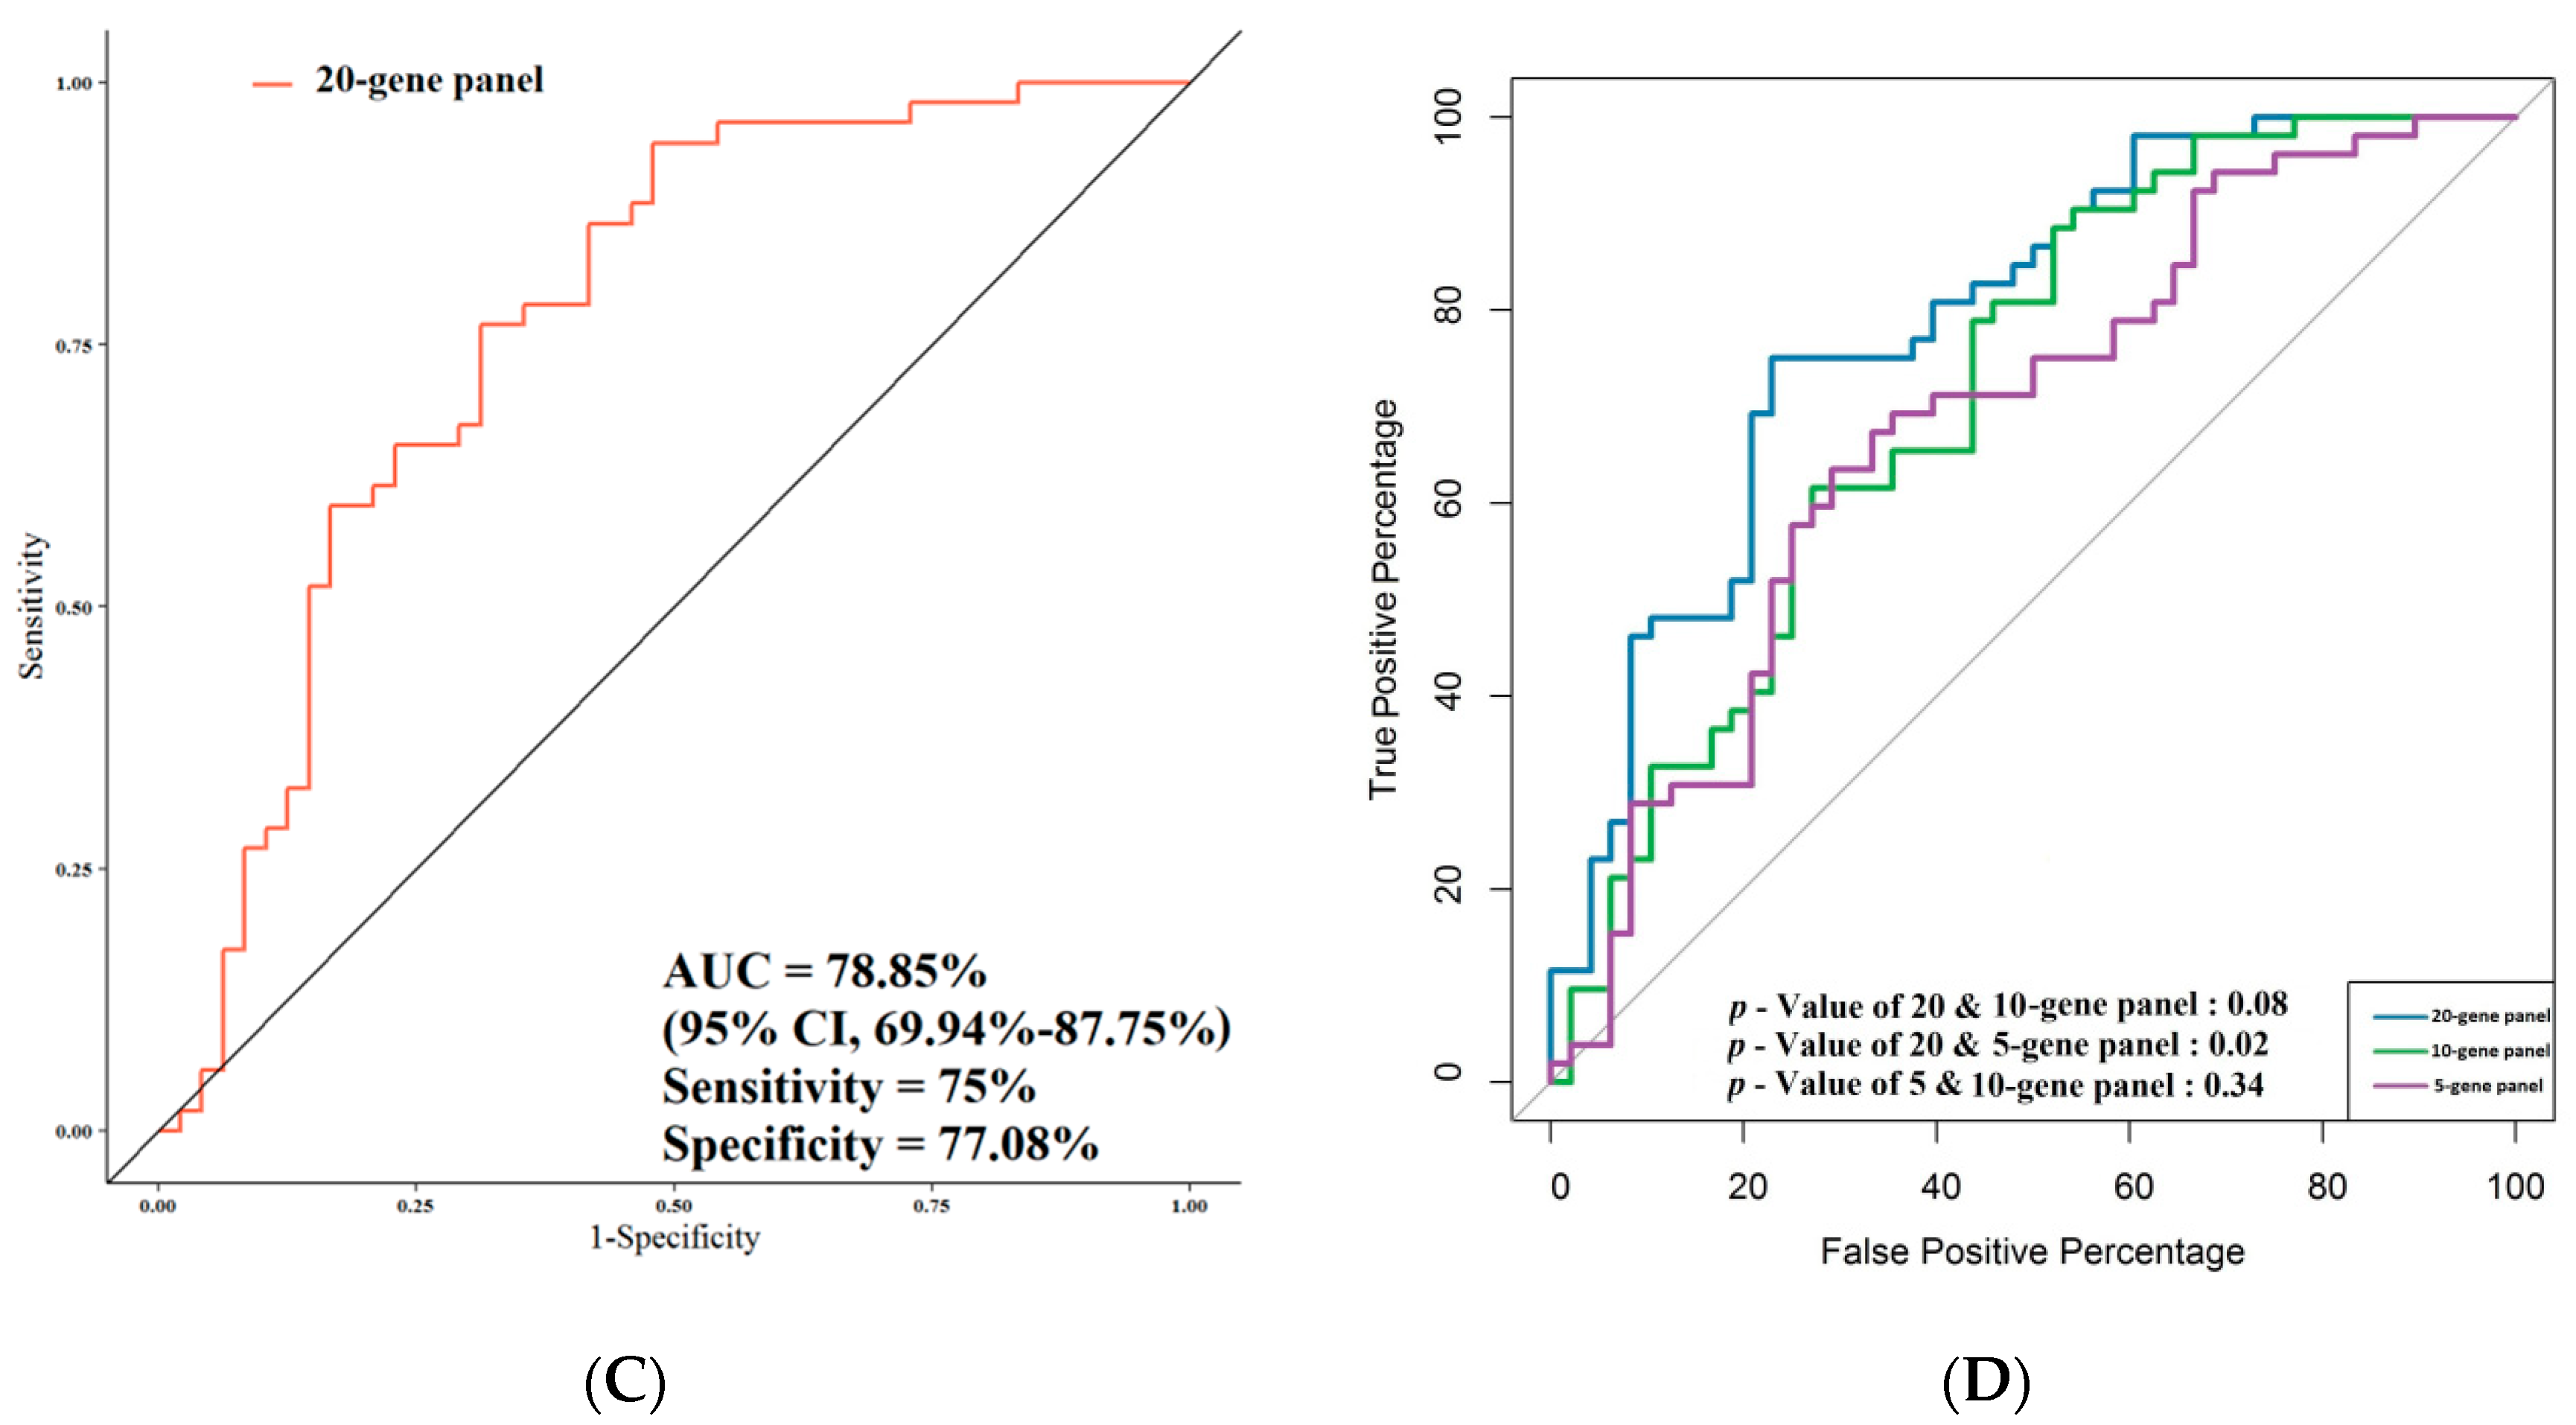
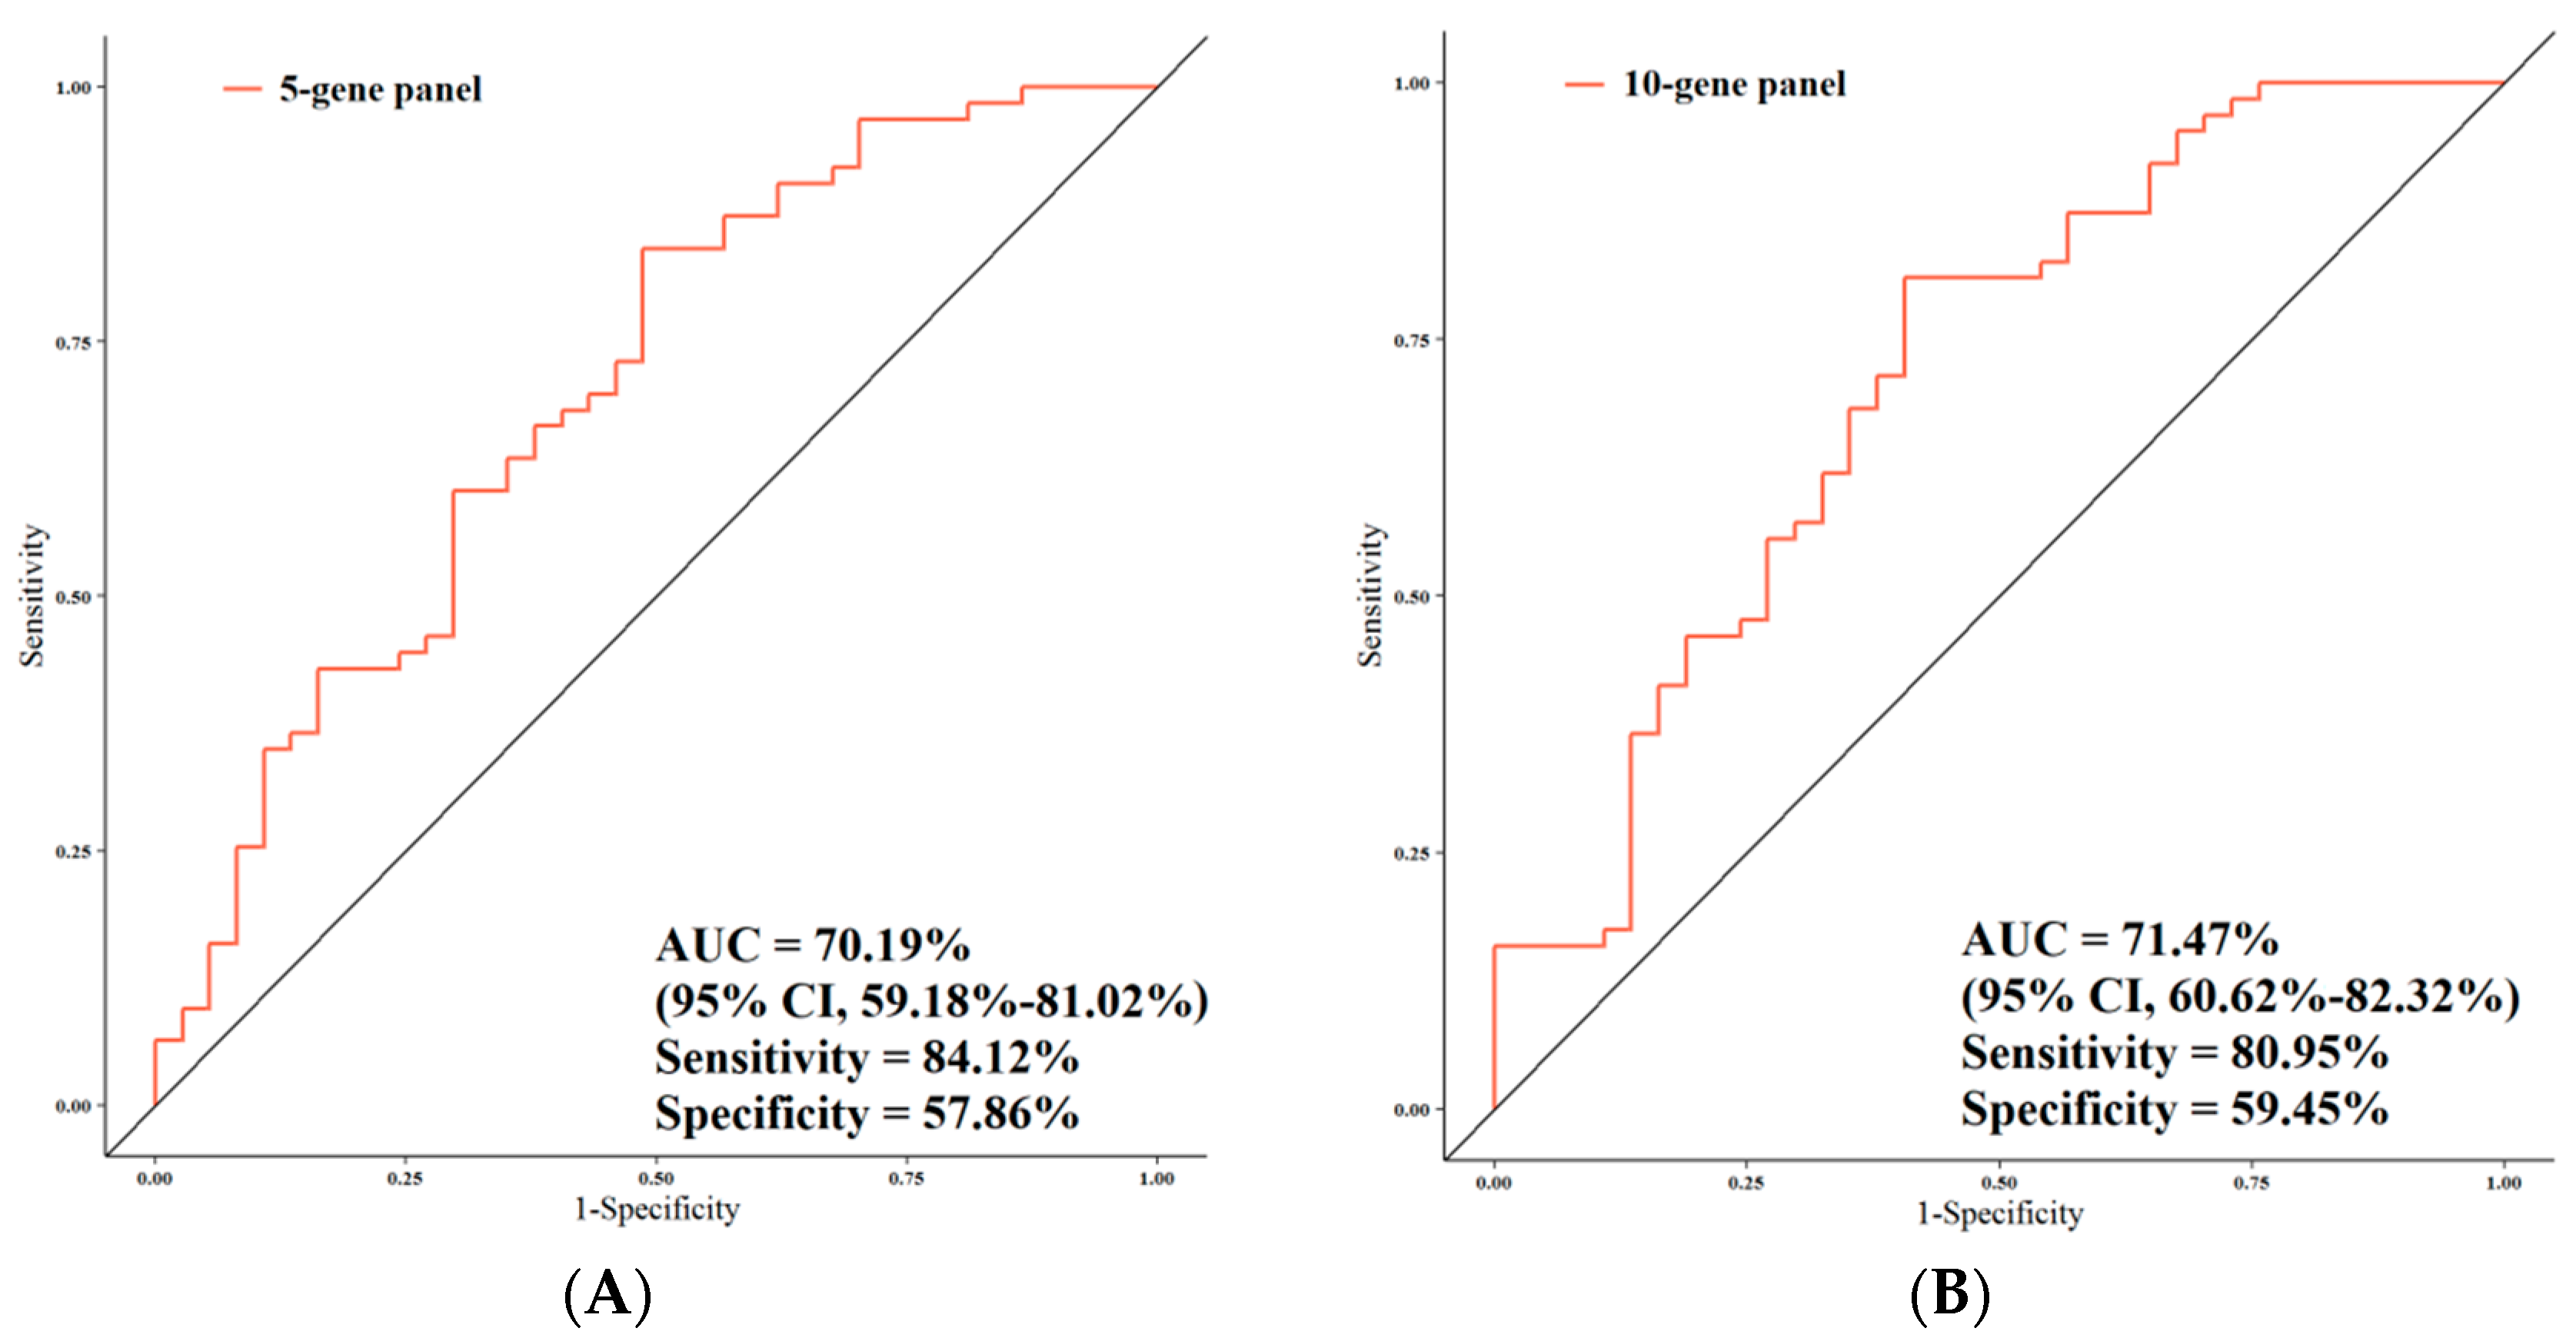
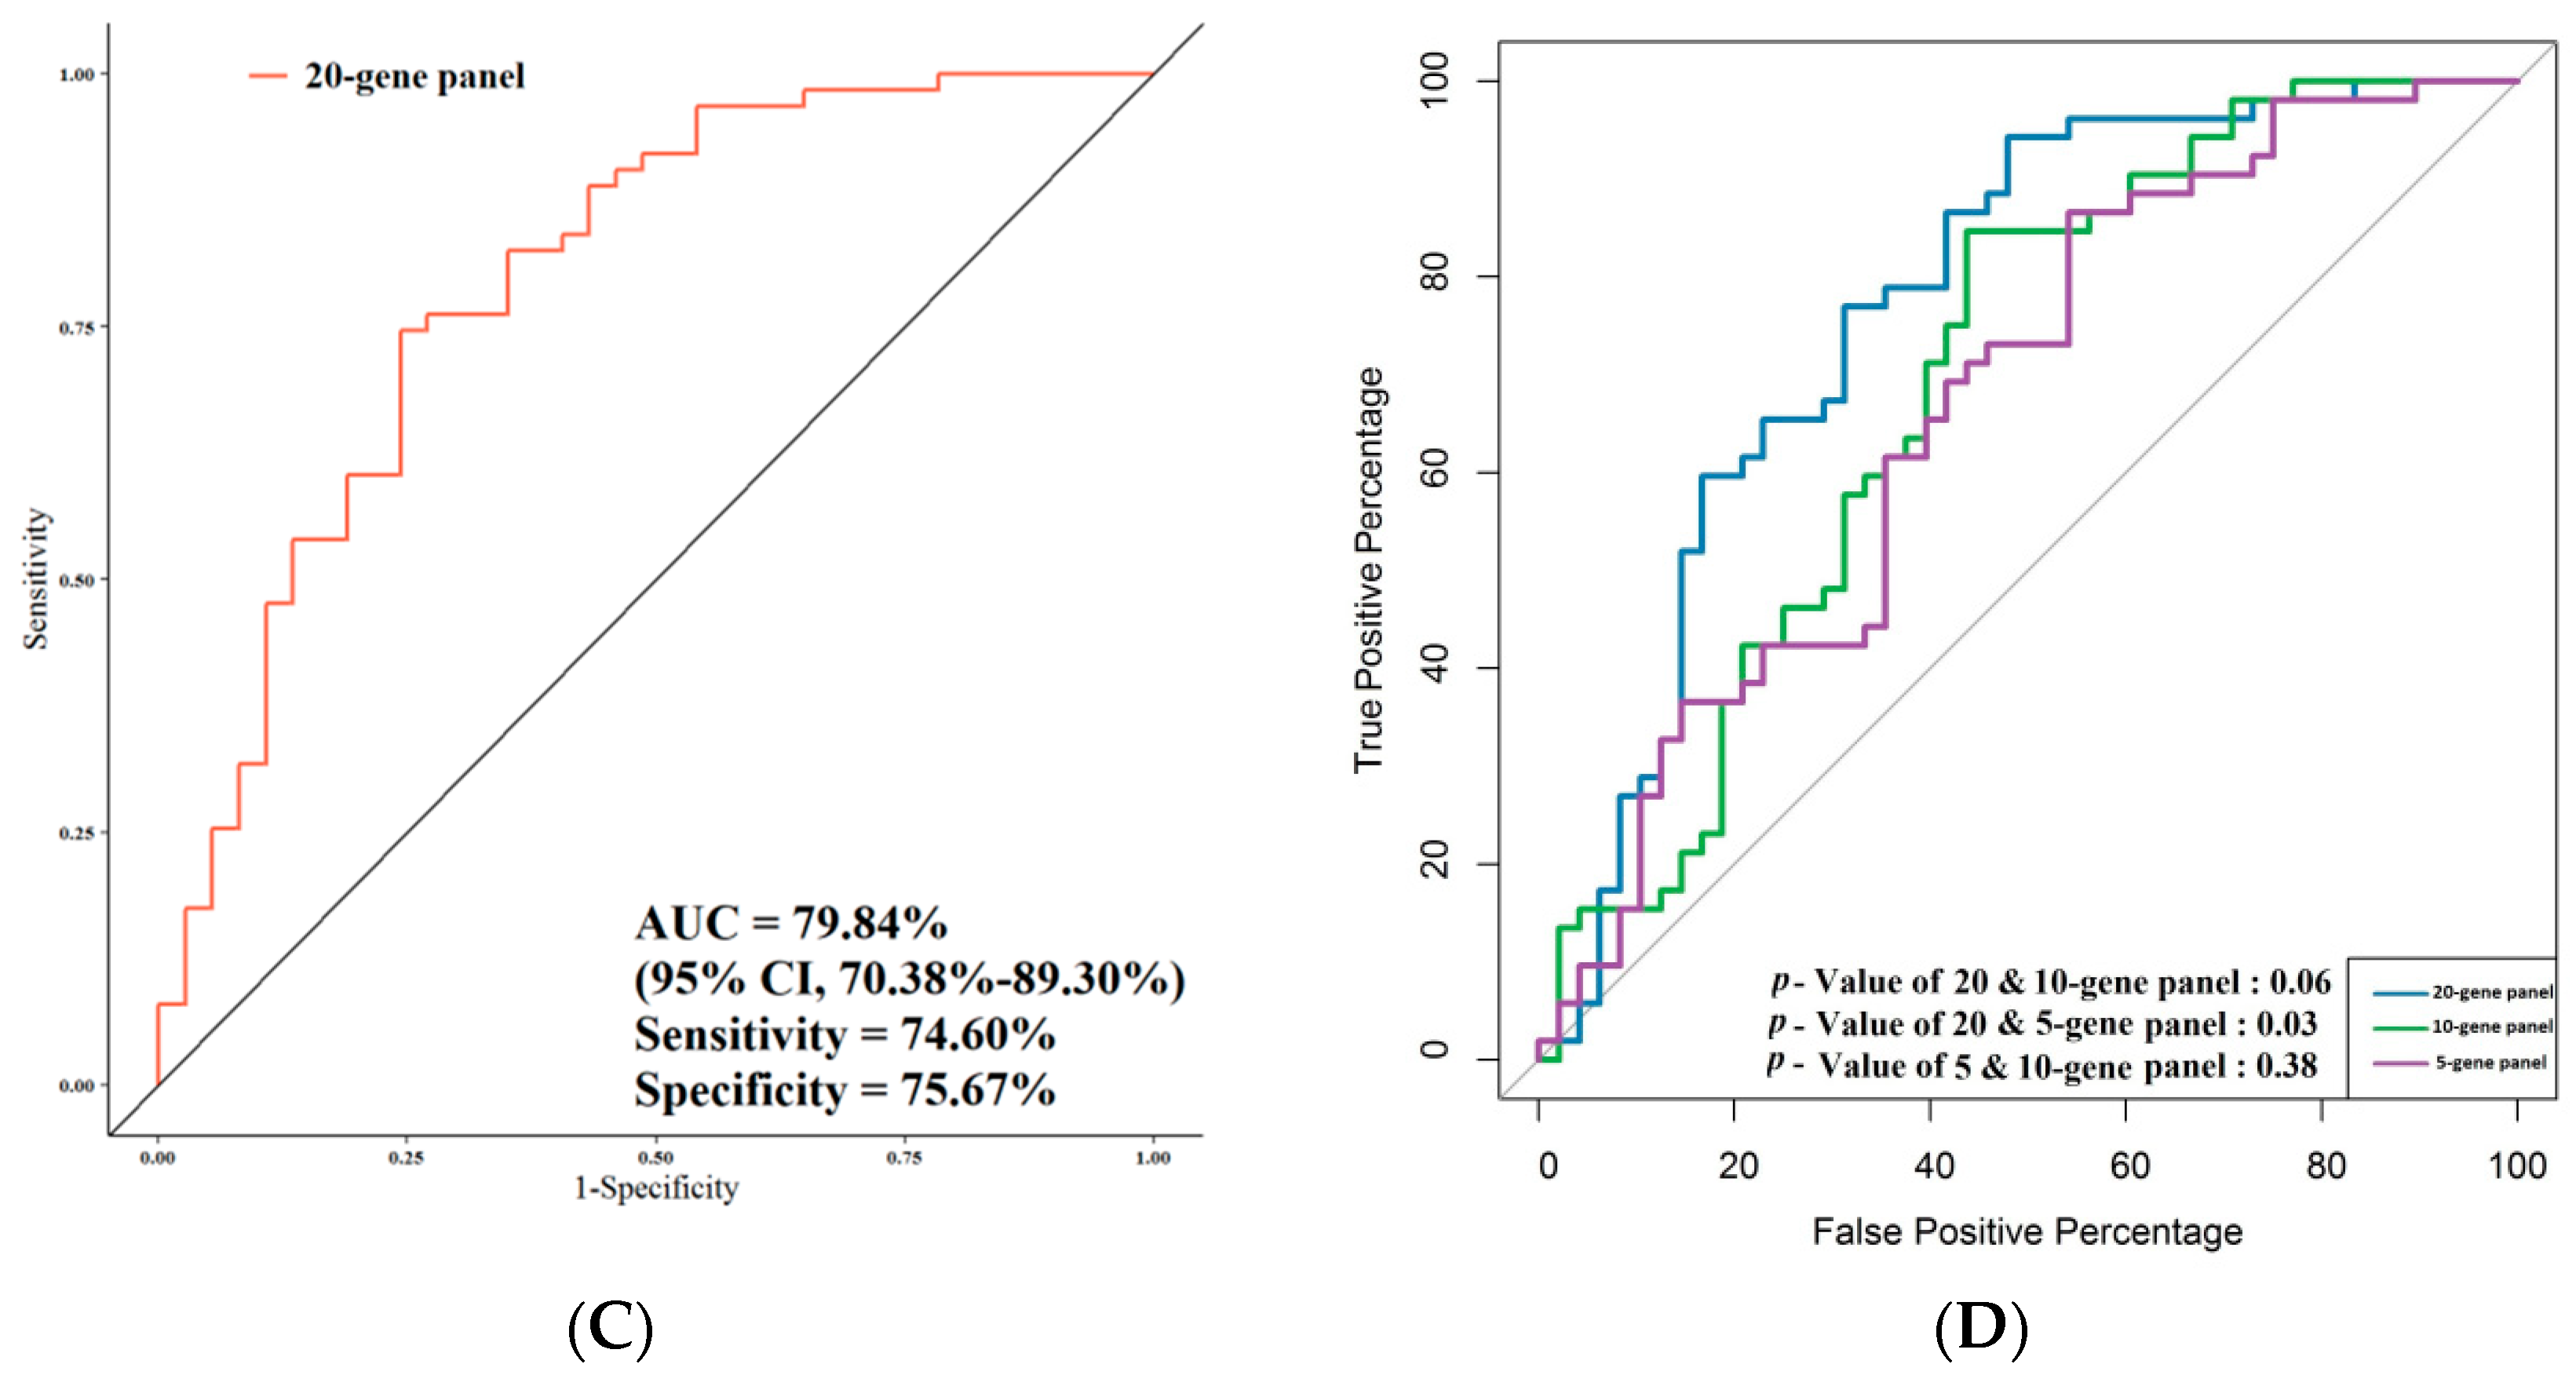
3.4. ROC Analysis
3.5. Correlation of Gene Expression with Overall Survival
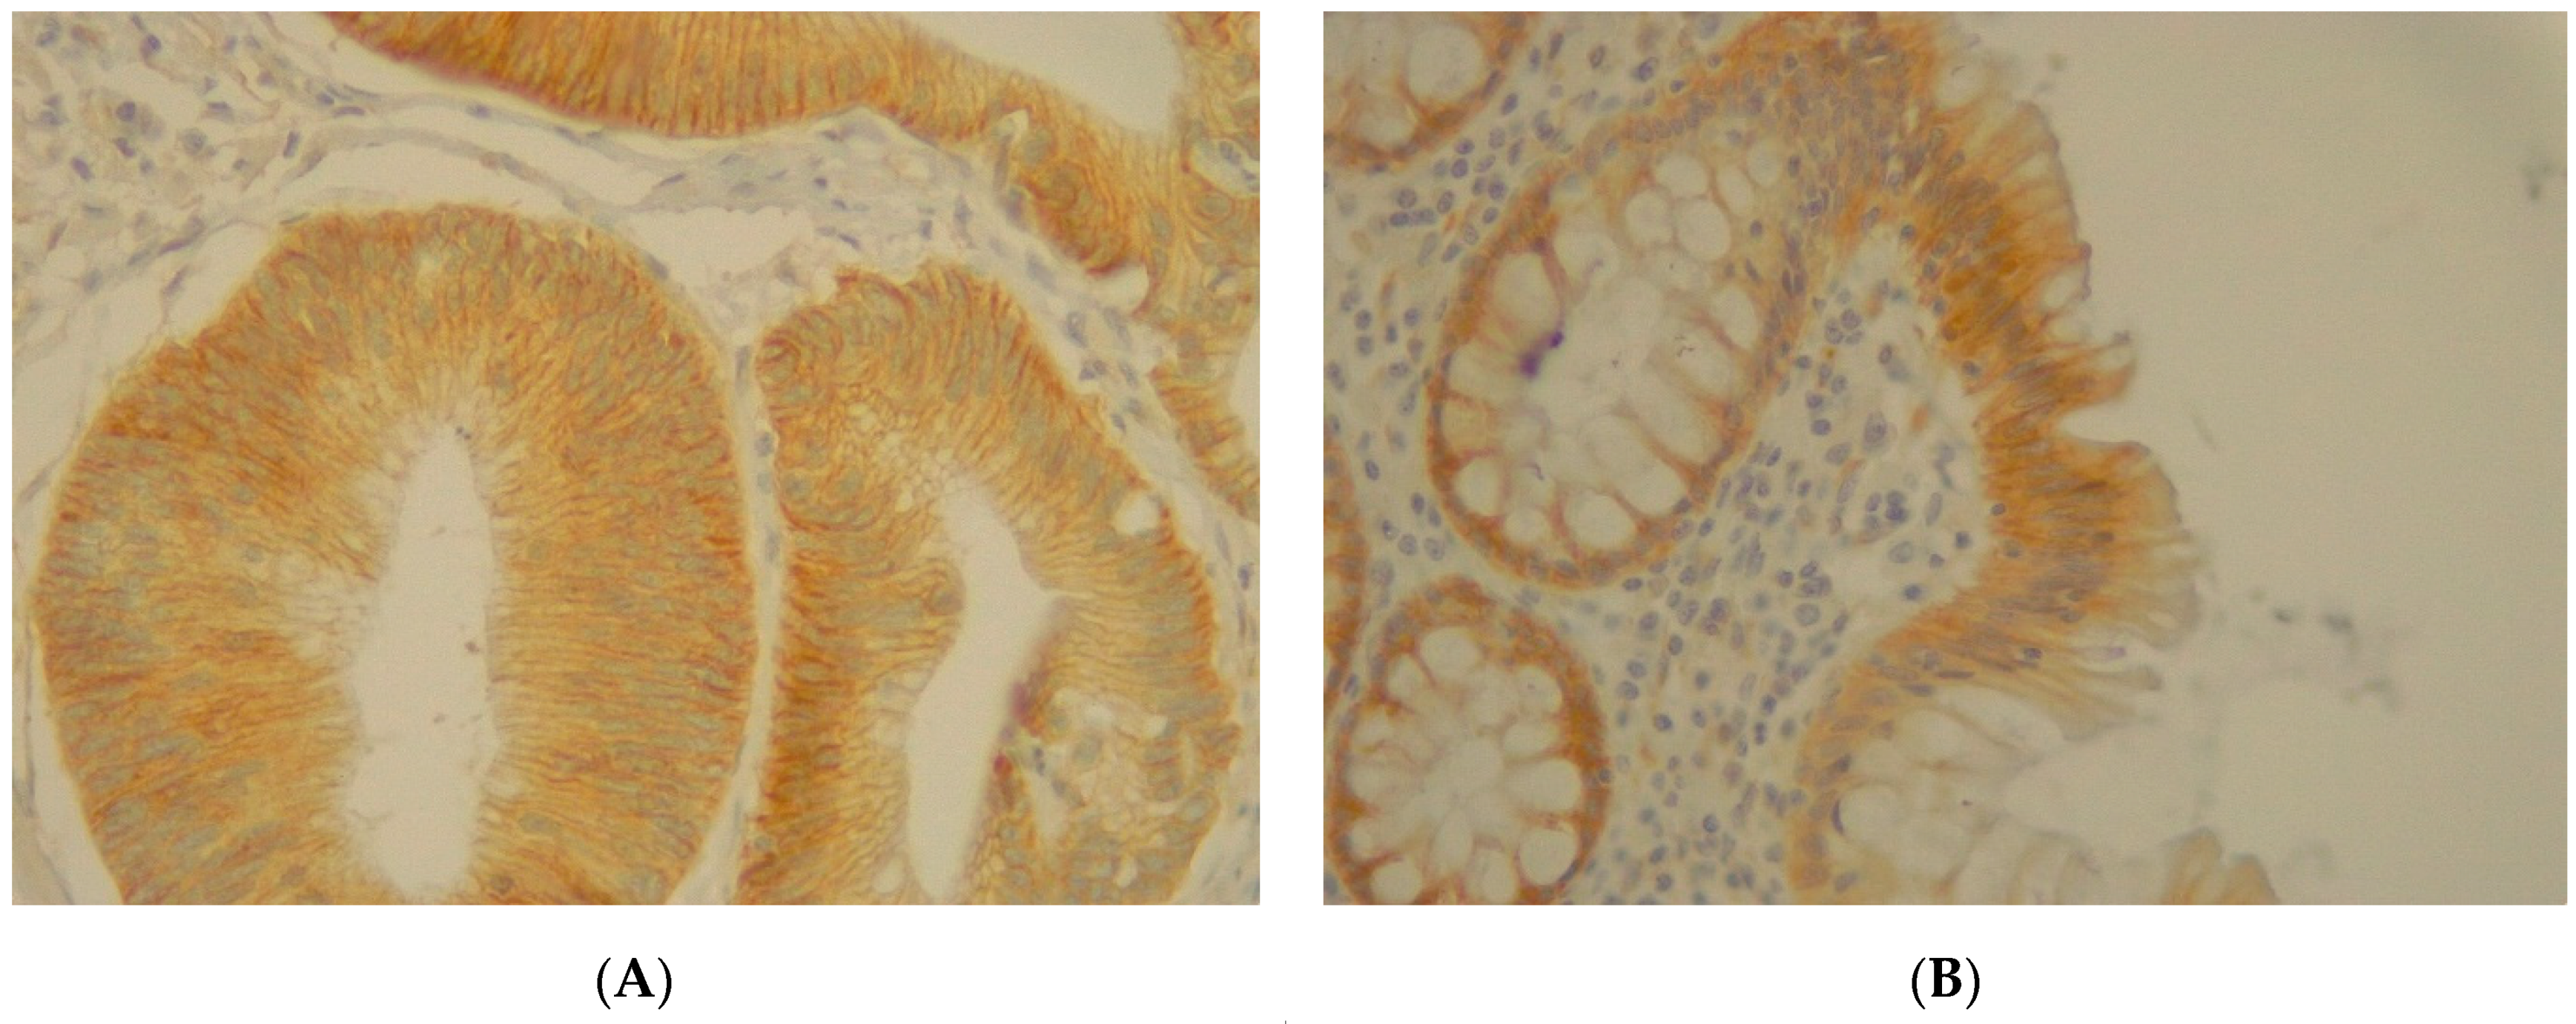
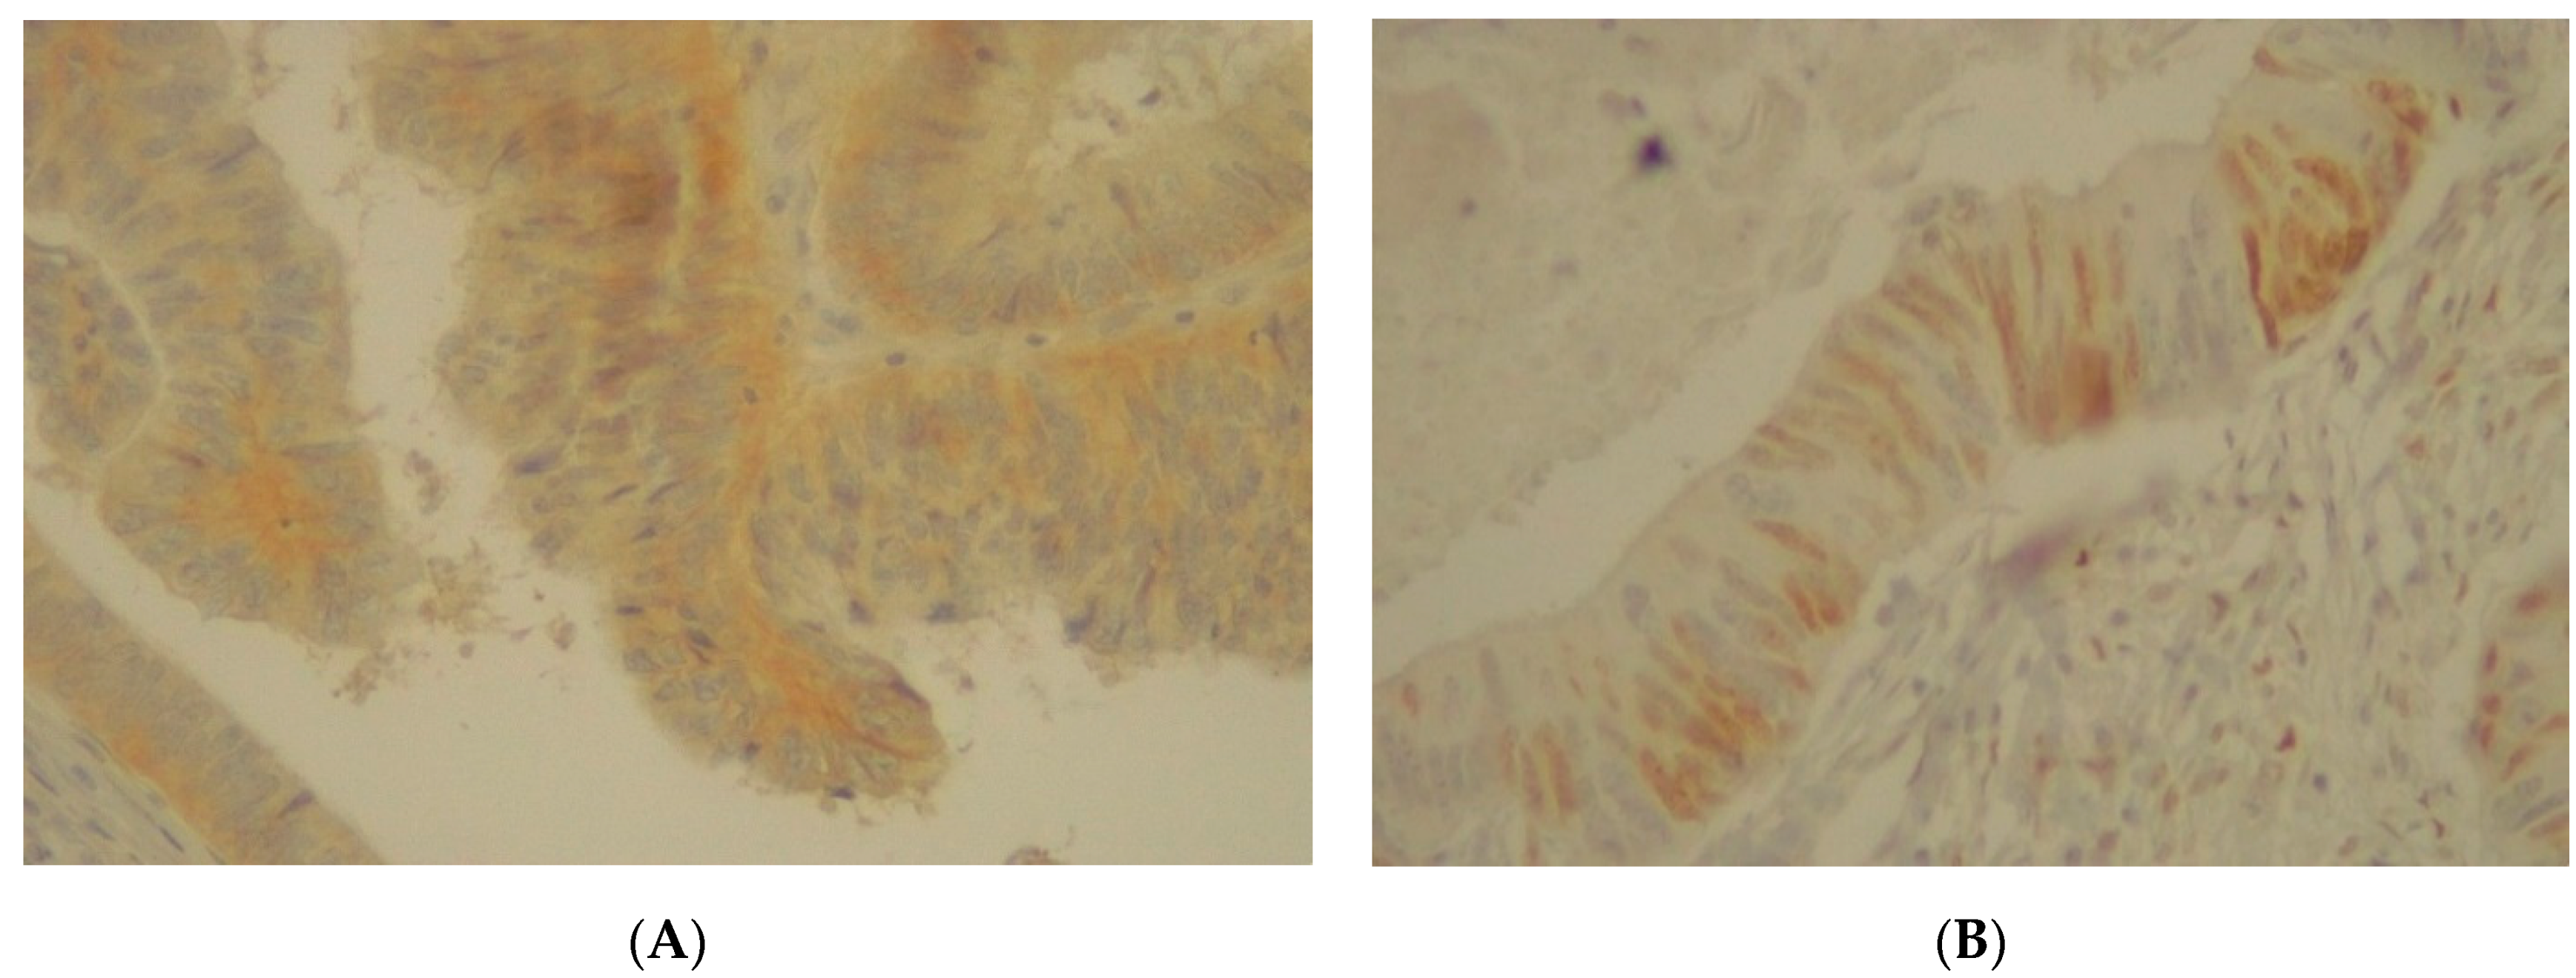
3.6. Immunohistochemistry Analysis
4. Discussion
5. Conclusions
Supplementary Materials
Author Contributions
Funding
Institutional Review Board Statement
Informed Consent Statement
Data Availability Statement
Acknowledgments
Conflicts of Interest
References
- Ueda, Y.; Yasuda, K.; Inomata, M.; Shiraishi, N.; Yokoyama, S.; Kitano, S. Biological predictors of survival in stage II colorectal cancer. Mol. Clin. Oncol. 2013, 1, 643–648. [Google Scholar] [CrossRef]
- Ong, M.L.H.; Schofield, J.B. Assessment of lymph node involvement in colorectal cancer. World J. Gastrointest. Surg. 2016, 8, 179–192. [Google Scholar] [CrossRef]
- Benson, A.B.; Venook, A.P.; Al-Hawary, M.M.; Arain, M.A.; Chen, Y.-J.; Ciombor, K.K.; Cohen, S.; Cooper, H.S.; Deming, D.; Farkas, L.; et al. Colon Cancer, Version 2.2.2021, NCCN Clinical Practice Guidelines in Oncology. Available online: www.nccn.org/professionals/physician_gls/pdf/colon/pdf (accessed on 1 February 2021).
- Schell, M.J.; Yang, M.; Missiaglia, E.; Delorenzi, M.; Soneson, C.; Yue, B.; Nebozhyn, M.V.; Loboda, A.; Bloom, G.; Yeatman, T.J. A Composite Gene Expression Signature Optimizes Prediction of Colorectal Cancer Metastasis and Outcome. Clin. Cancer Res. 2016, 22, 734–745. [Google Scholar] [CrossRef] [PubMed] [Green Version]
- Kim, H.J.; Choi, G. Clinical Implications of Lymph Node Metastasis in Colorectal Cancer: Current Status and Future Perspectives. Ann. Coloproctol. 2019, 35, 109–117. [Google Scholar] [CrossRef] [Green Version]
- Peyravian, N.; Larki, P.; Gharib, E.; Sadeghi, H.; Anaraki, F.; Young, C.; McClellan, J.; Bonab, M.A.; Asadzadeh-Aghdaei, H.; Zali, M.R. The Application of Gene Expression Profiling in Predictions of Occult Lymph Node Metastasis in Colorectal Cancer Patients. Biomedicines 2018, 6, 27. [Google Scholar] [CrossRef] [Green Version]
- Nicastri, D.G.; Doucette, J.T.; Godfrey, T.E.; Hughes, S.J. Is Occult Lymph Node Disease in Colorectal Cancer Patients Clinically Significant? J. Mol. Diagn. 2007, 9, 563–571. [Google Scholar] [CrossRef] [PubMed] [Green Version]
- Amin, M.B.; Greene, F.L.; Edge, S.B.; Compton, C.C.; Gershenwald, J.E.; Brookland, R.K.; Meyer, L.; Gress, D.M.; Byrd, D.R.; Winchester, D.P. The Eighth Edition AJCC Cancer Staging Manual: Continuing to build a bridge from a population-based to a more “personalized” approach to cancer staging. Cancer J. Clin. 2017, 67, 93–99. [Google Scholar] [CrossRef]
- Mojarad, E.N.; Kuppen, P.J.; Aghdaei, H.A.; Zali, M.R. The CpG island methylator phenotype (CIMP) in colorectal cancer. Gastroenterol. Hepatol. Bed Bench 2013, 6, 120–128. [Google Scholar]
- Esfahani, A.T.; Seyedna, S.Y.; Nazemalhosseini-Mojarad, E.; Majd, A.; Aghdaei, H.A. MSI-L/EMAST is a predictive biomarker for metastasis in colorectal cancer patients. J. Cell. Physiol. 2019, 234, 13128–13136. [Google Scholar] [CrossRef]
- Nazemalhosseini-Mojarad, E.; Mohammadpour, S.; Esafahani, A.T.; Gharib, E.; Larki, P.; Moradi, A.; Porhoseingholi, M.A.; Aghdaei, H.A.; Kuppen, P.J.K.; Zali, M.R. Intratumoral infiltrating lymphocytes correlate with improved survival in colorectal cancer patients: Independent of oncogenetic features. J. Cell. Physiol. 2019, 234, 4768–4777. [Google Scholar] [CrossRef] [PubMed]
- Petrelli, F.; Ghidini, M.; Cabiddu, M.; Pezzica, E.; Corti, D.; Turati, L.; Costanzo, A.; Varricchio, A.; Ghidini, A.; Barni, S.; et al. Microsatellite Instability and Survival in Stage II Colorectal Cancer: A Systematic Review and Meta-analysis. Anticancer Res. 2019, 39, 6431–6441. [Google Scholar] [CrossRef] [PubMed] [Green Version]
- Yan, X.; Wan, H.; Hao, X.; Lan, T.; Li, W.; Xu, L.; Yuan, K.; Wu, H. Importance of gene expression signatures in pancreatic cancer prognosis and the establishment of a prediction model. Cancer Manag. Res. 2018, 11, 273–283. [Google Scholar] [CrossRef] [Green Version]
- Angadi, P.; Kale, A. Tumor budding is a potential histopathological marker in the prognosis of oral squamous cell carcinoma: Current status and future prospects. J. Oral Maxillofac. Pathol. 2019, 23, 318. [Google Scholar] [CrossRef] [PubMed]
- Dihge, L.; Vallon-Christersson, J.; Hegardt, C.; Saal, L.H.; Häkkinen, J.; Larsson, C.; Ehinger, A.; Loman, N.; Malmberg, M.; Bendahl, P.-O.; et al. Prediction of Lymph Node Metastasis in Breast Cancer by Gene Expression and Clinicopathological Models: Development and Validation within a Population-Based Cohort. Clin. Cancer Res. 2019, 25, 6368–6381. [Google Scholar] [CrossRef] [PubMed] [Green Version]
- Meeh, P.F.; Farrell, C.L.; Croshaw, R.; Crimm, H.; Miller, S.K.; Oroian, D.; Kowli, S.; Zhu, J.; Carver, W.; Wu, W.; et al. A Gene Expression Classifier of Node-Positive Colorectal Cancer. Neoplasia 2009, 11, 1074-IN12. [Google Scholar] [CrossRef] [Green Version]
- Dai, W.; Li, Y.; Mo, S.; Feng, Y.; Zhang, L.; Xu, Y.; Li, Q.; Cai, G. A robust gene signature for the prediction of early relapse in stage I-III colon cancer. Mol. Oncol. 2018, 12, 463–475. [Google Scholar] [CrossRef] [Green Version]
- Chu, C.-M.; Yao, C.-T.; Chang, Y.-T.; Chou, H.-L.; Chou, Y.-C.; Chen, K.-H.; Terng, H.-J.; Huang, C.-S.; Lee, C.-C.; Su, S.-L.; et al. Gene Expression Profiling of Colorectal Tumors and Normal Mucosa by Microarrays Meta-Analysis Using Prediction Analysis of Microarray, Artificial Neural Network, Classification, and Regression Trees. Dis. Markers 2014, 2014, 1–11. [Google Scholar] [CrossRef] [Green Version]
- Gutiérrez, M.L.; Corchete-Sánchez, L.A.; Sarasquete, M.E.; Abad, M.D.M.; Bengoechea, O.; Fermiñán, E.; Anduaga, M.F.; Del Carmen, S.; Iglesias, M.; Esteban, C.; et al. Prognostic impact of a novel gene expression profile classifier for the discrimination between metastatic and non-metastatic primary colorectal cancer tumors. Oncotarget 2017, 8, 107685–107700. [Google Scholar] [CrossRef] [PubMed] [Green Version]
- Kleivi, K.; Lind, G.E.; Diep, C.B.; Meling, G.I.; Brandal, L.T.; Nesland, J.M.; Myklebost, O.; Rognum, T.O.; Giercksky, K.-E.; Skotheim, R.I.; et al. Gene expression profiles of primary colorectal carcinomas, liver metastases, and carcinomatoses. Mol. Cancer 2007, 6, 2. [Google Scholar] [CrossRef] [Green Version]
- Oh, H.-H.; Park, K.-J.; Kim, N.; Park, S.-Y.; Park, Y.-L.; Oak, C.-Y.; Myung, D.S.; Cho, S.-B.; Lee, W.-S.; Kim, K.-K.; et al. Impact of KITENIN on tumor angiogenesis and lymphangiogenesis in colorectal cancer. Oncol. Rep. 2015, 35, 253–260. [Google Scholar] [CrossRef] [PubMed] [Green Version]
- Lee, S.; Song, Y.-A.; Park, Y.-L.; Cho, S.-B.; Lee, W.-S.; Lee, J.-H.; Chung, I.-J.; Kim, K.-K.; Rew, J.-S.; Joo, H.-H.O.A.Y.-E. Expression of KITENIN in human colorectal cancer and its relation to tumor behavior and progression. Pathol. Int. 2011, 61, 210–220. [Google Scholar] [CrossRef]
- Bae, J.A.; Kho, D.H.; Sun, E.G.; Ko, Y.-S.; Yoon, S.; Lee, K.H.; Ahn, K.Y.; Lee, K.-H.; Joo, H.-H.O.A.Y.-E.; Chung, I.-J.; et al. Elevated Coexpression of KITENIN and the ErbB4 CYT-2 Isoform Promotes the Transition from Colon Adenoma to Carcinoma Following APC loss. Clin. Cancer Res. 2016, 22, 1284–1294. [Google Scholar] [CrossRef] [Green Version]
- Sun, E.G.; Lee, K.H.; Ko, Y.-S.; Choi, H.J.; Yang, J.-I.; Lee, K.-H.; Chung, I.-J.; Paek, Y.-W.; Kim, H.; Bae, J.A.; et al. KITENIN functions as a fine regulator of ErbB4 expression level in colorectal cancer via protection of ErbB4 from E3-ligase Nrdp1-mediated degradation. Mol. Carcinog. 2016, 56, 1068–1081. [Google Scholar] [CrossRef] [PubMed]
- Pezeshkian, Z.; Forouzesh, F.; Peyravian, N.; Yaghoob-Taleghani, M.; Asadzadeh-Aghdaei, H.; Zali, M.; Nazemalhosseini-Mojarad, E. Clinicopatho-logical correlations of VEGF-A and MMP-7 genes expression in different types of colorectal adenoma polyps. WCRJ 2017, 4, e978. [Google Scholar]
- Aghdaei, H.A.; Pezeshkian, Z.; Abdollahpour-Alitappeh, M.; Nazemalhosseini-Mojarad, E.; Zali, M.R. The Role of Angiogenesis in Colorectal Polyps and Cancer, a Review. Med. Lab. J. 2018, 12, 1–6. [Google Scholar] [CrossRef] [Green Version]
- Khatibi, S.; Nazemalhosseini Mojarad, E.; Forouzesh, F.; Pezeshkian, Z.; Asadzadeh Aghdaei, H.; Zali, M.R. HIF-1 alpha gene expression is not a suitable biomarker for evaluating malignancy risk in colorectal polyps. WCRJ 2018, 5, e1128. [Google Scholar]
- Massagué, J.; Blain, S.W.; Lo, R.S. TGFβ Signaling in Growth Control, Cancer, and Heritable Disorders. Cell 2000, 103, 295–309. [Google Scholar] [CrossRef] [Green Version]
- Samanta, D. Alterations in the Smad pathway in human cancers. Front. Biosci. 2012, 17, 1281–1293. [Google Scholar] [CrossRef] [PubMed] [Green Version]
- Fukushima, T.; Mashiko, M.; Takita, K.; Otake, T.; Endo, Y.; Sekikawa, K.; Takenoshita, S. Mutational analysis of TGF-β type II receptor, Smad2, Smad3, Smad4, Smad6 and Smad7 genes in colorectal cancer. J. Exp. Clin. Cancer. Res. 2003, 22, 315–320. [Google Scholar] [PubMed]
- Tian, F.; Byfield, S.D.; Parks, W.T.; Yoo, S.; Felici, A.; Tang, B.; Piek, E.; Wakefield, L.M.; Roberts, A.B. Reduction in Smad2/3 signaling enhances tumorigenesis but suppresses metastasis of breast cancer cell lines. Cancer. Res. 2003, 63, 8284–8292. [Google Scholar] [PubMed]
- Fleming, N.I.; Jorissen, R.N.; Mouradov, D.; Christie, M.; Sakthianandeswaren, A.; Palmieri, M.; Day, F.; Li, S.; Tsui, C.; Lipton, L.; et al. SMAD2, SMAD3 and SMAD4 Mutations in Colorectal Cancer. Cancer Res. 2013, 73, 725–735. [Google Scholar] [CrossRef] [Green Version]
- Koveitypour, Z.; Panahi, F.; Vakilian, M.; Peymani, M.; Forootan, F.S.; Esfahani, M.H.N.; Ghaedi, K. Signaling pathways involved in colorectal cancer progression. Cell Biosci. 2019, 9, 1–14. [Google Scholar] [CrossRef] [Green Version]
- Bao, Y.; Chen, Z.; Guo, Y.; Feng, Y.; Li, Z.; Han, W.; Wang, J.; Zhao, W.; Jiao, Y.; Li, K.; et al. Tumor Suppressor MicroRNA-27a in Colorectal Carcinogenesis and Progression by Targeting SGPP1 and Smad2. PLoS ONE 2014, 9, e105991. [Google Scholar] [CrossRef] [Green Version]
- Zhao, M.; Mishra, L.; Deng, C.X. The role of TGF-β/SMAD4 signaling in cancer. Int. J. Biol. Sci. 2018, 14, 111–123. [Google Scholar] [CrossRef] [PubMed] [Green Version]
- Papageorgis, P.; Cheng, K.H.; Ozturk, S.; Gong, Y.; Lambert, A.; Mostafavi Abdolmaleky, H.; Zhou, J.-R.; Thiagalingam, S. Smad4 Inactivation Pro-motes Malignancy and Drug Resistance of Colon Cancer. Cancer. Res. 2011, 71, 998–1008. [Google Scholar] [CrossRef] [Green Version]
- Maitra, A.; Molberg, K.; Albores-Saavedra, J.; Lindberg, G. Loss of Dpc4 Expression in Colonic Adenocarcinomas Correlates with the Presence of Metastatic Disease. Am. J. Pathol. 2000, 157, 1105–1111. [Google Scholar] [CrossRef] [Green Version]
- Miyaki, M.; Iijima, T.; Konishi, M.; Sakai, K.; Ishii, A.; Yasuno, M.; Hishima, T.; Koike, M.; Shitara, N.; Iwama, T.; et al. Higher frequency of Smad4 gene mutation in human colorectal cancer with distant metastasis. Oncogene 1999, 18, 3098–3103. [Google Scholar] [CrossRef] [PubMed] [Green Version]
- Kitamura, T.; Kometani, K.; Hashida, H.; Matsunaga, A.; Miyoshi, H.; Hosogi, H.; Aoki, M.; Oshima, M.; Hattori, M.; Takabayashi, A.; et al. SMAD4-deficient intestinal tumors recruit CCR1+ myeloid cells that promote invasion. Nat. Genet. 2007, 39, 467–475. [Google Scholar] [CrossRef]
- Inamoto, S.; Itatani, Y.; Yamamoto, T.; Minamiguchi, S.; Hirai, H.; Iwamoto, M.; Hasegawa, S.; Taketo, M.M.; Sakai, Y.; Kawada, K. Loss of SMAD4 Promotes Colorectal Cancer Progression by Accumulation of Myeloid-Derived Suppressor Cells through the CCL15–CCR1 Chemokine Axis. Clin. Cancer Res. 2016, 22, 492–501. [Google Scholar] [CrossRef] [Green Version]
- Calon, A.; Lonardo, E.; Berenguer-Llergo, A.; Espinet, E.; Hernando-Momblona, X.; Iglesias, M.; Sevillano, M.; Palomo-Ponce, S.; Tauriello, D.V.F.; Byrom, D.; et al. Stromal gene expression defines poor-prognosis subtypes in colorectal cancer. Nat. Genet. 2015, 47, 320–329. [Google Scholar] [CrossRef] [PubMed] [Green Version]
- Li, H.; Zhang, Z.; Chen, L.; Sun, X.; Zhao, Y.; Guo, Q.; Zhu, S.; Li, P.; Min, L.; Zhang, S. Cytoplasmic Asporin promotes cell migration by regulating TGF-β/Smad2/3 pathway and indicates a poor prognosis in colorectal cancer. Cell Death Dis. 2019, 10, 1–14. [Google Scholar] [CrossRef] [Green Version]
- Huang, R.; Tang, Q.; You, Q.; Liu, Z.; Wang, G.; Chen, Y.; Sun, Y.; Muhammad, S.; Wang, X. Disparity Expression of Notch1 in Benign and Malignant Colorectal Diseases. PLoS ONE 2013, 8, e81005. [Google Scholar] [CrossRef] [Green Version]
- Androutsellis-Theotokis, A.; Leker, R.R.; Soldner, F.; Hoeppner, D.J.; Ravin, R.; Poser, S.W.; Rueger, M.A.; Bae, S.-K.; Kittappa, R.; McKay, R.D.G. Notch signalling regulates stem cell numbers in vitro and in vivo. Nat. Cell Biol. 2006, 442, 823–826. [Google Scholar] [CrossRef]
- Okamoto, R.; Tsuchiya, K.; Nemoto, Y.; Akiyama, J.; Nakamura, T.; Kanai, T.; Watanabe, M. Requirement of Notch activation during regeneration of the intestinal epithelia. Am. J. Physiol. Liver Physiol. 2009, 296, 23–35. [Google Scholar] [CrossRef] [Green Version]
- Chen, X.; Stoeck, A.; Lee, S.J.; Shih, I.-M.; Wang, M.M.; Wang, T.-L. Jagged1 Expression Regulated by Notch3 and Wnt/β-catenin Signaling Pathways in Ovarian Cancer. Oncotarget 2010, 1, 210–218. [Google Scholar] [CrossRef] [PubMed]
- Wang, H.; Zang, C.; Liu, X.S.; Aster, J.C. The role of Notch receptors in transcriptional Regulation. J. Cell Physiol. 2015, 230, 982–988. [Google Scholar] [CrossRef]
- Lutgens, M.W.M.D.; Vleggaar, F.P.; Schipper, M.E.I.; Stokkers, P.C.F.; Van Der Woude, C.J.; Hommes, D.W.; De Jong, D.J.; Dijkstra, G.; Van Bodegraven, A.A.; Oldenburg, B.; et al. High frequency of early colorectal cancer in inflammatory bowel disease. Gut 2008, 57, 1246–1251. [Google Scholar] [CrossRef]
- Kageyama, R.; Ohtsuka, T.; Kobayashi, T. The Hes gene family: Repressors and oscillators that orchestrate embryogenesis. Development 2007, 134, 1243–1251. [Google Scholar] [CrossRef] [PubMed] [Green Version]
- Yuan, R.; Ke, J.; Sun, L.; He, Z.; Zou, Y.; He, X.; Chen, Y.; Wu, X.; Cai, Z.; Wang, L.; et al. HES1 promotes metastasis and predicts poor survival in patients with colorectal cancer. Clin. Exp. Metastasis 2015, 32, 169–179. [Google Scholar] [CrossRef]
- Egan, S.E.; Reedijk, M.; Odorcic, S.; Zhang, H.; Chetty, R.; Tennert, C.; Dickson, B.C.; Lockwood, G.; Gallinger, S. Activation of Notch signaling in human colon adenocarcinoma. Int. J. Oncol. 1992, 33, 1223–1229. [Google Scholar] [CrossRef] [PubMed] [Green Version]
- Candy, P.A.; Phillips, M.R.; Redfern, A.D.; Colley, S.M.; Davidson, J.A.; Stuart, L.M.; A. Wood, B.; Zeps, N.; Leedman, P.J. Notch-induced transcription factors are predictive of survival and 5-fluorouracil response in colorectal cancer patients. Br. J. Cancer 2013, 109, 1023–1030. [Google Scholar] [CrossRef] [PubMed] [Green Version]
- Rajendran, D.T.; Subramaniyan, B.; Mathan, G. Role of Notch Signaling in Colorectal Cancer. Role Transcr. Factors Gastrointest. Malig. 2017, 307–314. [Google Scholar] [CrossRef]
- Zhang, P.; Yang, Y.; Zweidler-McKay, P.A.; Hughes, D.P. Critical Role of Notch Signaling in Osteosarcoma Invasion and Metastasis. Clin. Cancer Res. 2008, 14, 2962–2969. [Google Scholar] [CrossRef] [PubMed] [Green Version]
- Wang, Z.; Banerjee, S.; Li, Y.; Rahman, K.M.W.; Zhang, Y.-X.; Sarkar, F.H. Down-regulation of Notch-1 Inhibits Invasion by Inactivation of Nuclear Factor-κB, Vascular Endothelial Growth Factor, and Matrix Metalloproteinase-9 in Pancreatic Cancer Cells. Cancer Res. 2006, 66, 2778–2784. [Google Scholar] [CrossRef] [PubMed] [Green Version]
- Balint, K.; Xiao, M.; Pinnix, C.C.; Soma, A.; Veres, I.; Juhasz, I.; Brown, E.J.; Capobianco, A.J.; Herlyn, M.; Liu, Z.-J. Activation of Notch1 signaling is required for -catenin-mediated human primary melanoma progression. J. Clin. Investig. 2005, 115, 3166–3176. [Google Scholar] [CrossRef] [PubMed]
- García-Tuñnón, I.; Ricote, M.; Ruiz, A.; Fraile, B.; Paniagua, R.; Royuela, M. Interleukin-2 and its receptor complex (α, β and γ chains) in in situ and infiltrative human breast cancer: An immunohistochemical comparative study. Breast Cancer Res. 2003, 6, R1–R7. [Google Scholar] [CrossRef] [PubMed] [Green Version]
- Marshall, K.W.; Mohr, S.; El Khettabi, F.; Nossova, N.; Chao, S.; Bao, W.; Ma, J.; Li, X.-J.; Liew, C.-C. A blood-based biomarker panel for stratifying current risk for colorectal cancer. Int. J. Cancer 2009, 126, 1177–1186. [Google Scholar] [CrossRef]
- Draeger, A.; Monastyrskaya, K.; Babiychuk, E.B. Plasma membrane repair and cellular damage control: The annexin survival kit. Biochem Pharmacol. 2011, 81, 703–712. [Google Scholar] [CrossRef]
- Park, J.E.; Lee, D.H.; Lee, J.A.; Park, S.G.; Kim, N.-S.; Park, B.C.; Cho, S. Annexin A3 is a potential angiogenic mediator. Biochem. Biophys. Res. Commun. 2005, 337, 1283–1287. [Google Scholar] [CrossRef]
- Harashima, M.; Harada, K.; Ito, Y.; Hyuga, M.; Seki, T.; Ariga, T.; Yamaguchi, T.; Niimi, S. Annexin A3 Expression Increases in Hepatocytes and is Regulated by Hepatocyte Growth Factor in Rat Liver Regeneration. J. Biochem. 2007, 143, 537–545. [Google Scholar] [CrossRef]
- Yan, X.; Yin, J.; Yao, H.; Mao, N.; Yang, Y.; Pan, L. Increased Expression of Annexin A3 Is a Mechanism of Platinum Re-sistance in Ovarian Cancer. Cancer. Res. 2010, 70, 1616–1624. [Google Scholar] [CrossRef] [Green Version]
- Wu, N.; Sun, M.-Z.; Guo, C.; Hou, Z.; Sun, M.-Z. The role of annexin A3 playing in cancers. Clin. Transl. Oncol. 2013, 15, 106–110. [Google Scholar] [CrossRef]
- Zhou, T.; Liu, S.; Yang, L.; Ju, Y.; Li, C. The expression of ANXA3 and its relationship with the occurrence and development of breast cancer. J. BUON 2018, 23, 713–719. [Google Scholar] [PubMed]
- Bai, Z.; Wang, J.; Wang, T.; Li, Y.; Zhao, X.; Wu, G.; Yang, Y.; Deng, W.; Zhang, Z. The MiR-495/Annexin A3/P53 Axis Inhibits the Invasion and EMT of Colorectal Cancer Cells. Cell. Physiol. Biochem. 2017, 44, 1882–1895. [Google Scholar] [CrossRef]
- Yang, L.; Men, W.-L.; Yan, K.-M.; Tie, J.; Nie, Y.-Z.; Xiao, H.-J. MiR-340-5p is a potential prognostic indicator of colorectal cancer and modulates ANXA3. Eur. Rev. Med. Pharmacol. Sci. 2018, 22, 4837–4845. [Google Scholar] [PubMed]
- Wang, K.; Li, J. Overexpression of ANXA3 is an independent prognostic indicator in gastric cancer and its depletion suppresses cell proliferation and tumor growth. Oncotarget 2016, 7, 86972–86984. [Google Scholar] [CrossRef]
- Zhou, T.; Li, Y.; Yang, L.; Tang, T.; Zhang, L.; Shi, J. Annexin A3 as a Prognostic Biomarker for Breast Cancer: A Retrospective Study. BioMed Res. Int. 2017, 2017, 1–7. [Google Scholar] [CrossRef] [PubMed] [Green Version]
- Shigeishi, H.; Oue, N.; Kuniyasu, H.; Wakikawa, A.; Yokozaki, H.; Ishikawa, T.; Yasui, W. Expression of Bub1 Gene Correlates with Tumor Proliferating Activity in Human Gastric Carcinomas. Pathobiology 2001, 69, 24–29. [Google Scholar] [CrossRef] [PubMed]
- Stahl, D.; Braun, M.; Gentles, A.J.; Lingohr, P.; Walter, A.; Kristiansen, G.; Gütgemann, I. Low BUB1 expression is an adverse prognostic marker in gastric adenocarcinoma. Oncotarget 2017, 8, 76329–76339. [Google Scholar] [CrossRef]
- Rounseville, M.P.; Davis, T.P. Prohormone convertase and autocrine growth factor mRNAs are coexpressed in small cell lung carcinoma. J. Mol. Endocrinol. 2000, 25, 121–128. [Google Scholar] [CrossRef] [Green Version]
- Jaaks, P.; Bernasconi, M. The proprotein convertase furin in tumour progression. Int. J. Cancer 2017, 141, 654–663. [Google Scholar] [CrossRef] [PubMed] [Green Version]
- Shichiri, M.; Yoshinaga, K.; Hisatomi, H.; Sugihara, K.; Hirata, Y. Genetic and epigenetic inactivation of mitotic checkpoint genes hBUB1 and hBUBR1 and their relationship to survival. Cancer Res. 2002, 62, 11782350. [Google Scholar]
- Nicholson, R.; Gee, J.M.; Harper, M.E. EGFR and cancer prognosis. Eur. J. Cancer 2001, 37 (Suppl. 4), 9–15. [Google Scholar] [CrossRef]
- Repetto, L.; Gianni, W.; Aglianò, A.M.; Gazzaniga, P. Impact of EGFR expression on colorectal cancer patient prognosis and survival: A response. Ann. Oncol. 2005, 16, 1557. [Google Scholar] [CrossRef] [PubMed]
- Goldstein, N.; Armin, M. Epidermal growth factor receptor immunohistochemical reactivity in patients with American Joint Committee on Cancer Stage IV colon adenocarcinoma: Implications for a standardized scoring system. Cancer 2001, 92, 1331–1346. [Google Scholar] [CrossRef]
- McKay, J.A.; Murray, L.J.; Curran, S.; Ross, V.G.; Clark, C.; Murray, G.I.; Cassidy, J.; McLeod, H.L. Evaluation of the epidermal growth factor receptor (EGFR) in colorectal tumours and lymph node metastases. Eur. J. Cancer 2002, 38, 2258–2264. [Google Scholar] [CrossRef]


| Gene Symbol | Gene Name and Functions | Primer Sequence |
|---|---|---|
| VANGL1 (KITENIN) | VANGL planar cell polarity protein 1 (located on chromosome 1) 1. It encodes a member of the tetraspanin family. 2. It may be involved in mediating intestinal trefoil factor-induced wound healing in the intestinal mucosa. | F: 5′-GACACAAGTCACCCCGGAATA-3′ R: 5′-TCCTCTGTCCGAGTAGAATCATT-3′ Amplicon length: 109 bp |
| IL2RA (CD25) | Interleukin 2 receptor subunit alpha (located on chromosome 10) 1. Mutations in this gene are associated with interleukin 2 receptor alpha deficiency. 2. Serum IL-2R levels are found to be elevated in patients with different types of carcinomas. | F: 5′-GAACACAACGAAACAAGTGACAC-3′ R: 5′-GGCTGCATTGGACTTTGCATT-3′ Amplicon length: 81 bp |
| IL2RB (CD122) | Interleukin 2 receptor subunit beta (located on chromosome 22) 1. It is involved in receptor-mediated endocytosis and transduction of mitogenic signals from IL2. | F: 5′-CAGCGGTGAATGGCACTTC-3′ R: 5′-GGCATGGACTTGGCAGGAA-3′ Amplicon length: 113 bp |
| TGFβ1 | Transforming growth factor ß (located on chromosome 19) 1. It encodes a secreted ligand of the TGFß superfamily of proteins. The encoded protein regulates cell proliferation, differentiation, and growth. 2. It is frequently upregulated in tumor cells. | F: 5′-CAATTCCTGGCGATACCTCAG-3′ R: 5′-GCACAACTCCGGTGACATCAA-3′ Amplicon length: 86 bp |
| SMAD2 | SMAD2 family member 2 (located on chromosome 18) 1. The protein encoded mediates the signal of the transforming growth factor (TGF)-beta, thus regulating multiple cellular processes (i.e., cell proliferation, apoptosis, and differentiation). | F: 5′-CCGACACACCGAGATCCTAAC-3′ R: 5′-GAGGTGGCGTTTCTGGAATATAA-3′ Amplicon length: 125 bp |
| SMAD4 | SMAD4 family member 4 (Located on chromosome 18) 1. The encoded protein forms homomeric complexes and heteromeric complexes with other activated Smad proteins that accumulate in the nucleus and regulate the transcription of target genes. 2. The encoded protein acts as a tumor suppressor and inhibits epithelial cell proliferation. | F: 5′-CCACCAAGTAATCGTGCATCG-3′ R: 5′-TGGTAGCATTAGACTCAGATGGG-3′ Amplicon length: 76 bp |
| CD44 (CSPG8) | CD44 antigen (located on chromosome 11) 1. It is a cell-surface glycoprotein involved in cell–cell interactions, cell adhesion, and migration. 2. The encoded protein participates in several cellular functions (e.g., lymphocyte activation, recirculation and homing, hematopoiesis, and tumor metastasis). | F: 5′-CTGCCGCTTTGCAGGTGTA-3′ R: 5′-CATTGTGGGCAAGGTGCTATT-3′ Amplicon length: 109 bp |
| CD133 (PROM1) | CD133 (located on chromosome 4) 1. It encodes a pentaspan transmembrane glycoprotein. 2. The encoded protein is often expressed on adult stem cells, where it has been suggested to maintain stem cell properties by suppressing differentiation. 3. It is the marker most commonly used for the isolation of cancer stem cell population from different tumors. | F: 5′-GGCCCAGTACAACACTACCAA-3′ R: 5′-ATTCCGCCTCCTAGCACTGAA-3′ Amplicon length: 75 bp |
| HES1 | HES family basic helix-loop-helix (bHLH) transcription factor 1 (chromosome 3) 1. It is a transcriptional repressor of genes that require a bHLH protein for their transcription. 2. It plays an important role in the Notch signaling pathway. 3. The absence of Hes1 in the developing intestine promotes the increase of Math1 (the production of intestinal cell types). | F: 5′-ACGTGCGAGGGCGTTAATAC-3′ R: 5′-GGGGTAGGTCATGGCATTGA-3′ Amplicon length: 90 bp |
| NOTCH1 | NOTCH receptor 1 (located on chromosome 9) 1. The Notch signaling pathway regulates interactions between physically adjacent cells through the binding of Notch family receptors to their cognate ligands. 2. It plays a role in the development of numerous cell and tissue types. 3. Mutations in NOTCH1 are associated with syndromes, hematological and solid tumors. | F: 5′-TGGACCAGATTGGGGAGTTC-3′ R: 5′-GCACACTCGTCTGTGTTGAC-3′ Amplicon length: 82 bp |
| LEF1 (TCF10) | Lymphoid enhancer-binding factor 1 (located on chromosome 4) 1. It encodes a transcription factor belonging to a family of proteins that share homology with the high mobility group protein-1. 2. It binds to a functionally important site in the T-cell receptor-alpha (TCRA) enhancer, thus conferring maximal enhancer activity. 3. It is involved in the Wnt signaling pathway, and mutations in this gene have been found in some tumors. | F: 5′-ATGTCAACTCCAAACAAGGCA-3′ R: 5′-CCCGGAGACAAGGGATAAAAAGT-3′ Amplicon length: 76 bp |
| MTA1 | Metastasis-associated 1 (located on chromosome 14) 1. MTA1 expression has been correlated with the metastatic potential of some carcinomas, but it is expressed also in many normal tissues. 2. The profile and activity of the encoded protein suggest that it is involved in regulating transcription and that this may be accomplished by chromatin remodeling. | F: 5′-ACGCAACCCTGTCAGTCTG-3′ R: 5′-GGGCAGGTCCACCATTTCC-3′ Amplicon length: 104 bp |
| EGFR (ErBb-1) | Epidermal growth factor receptor (located on chromosome 7) 1. It encodes a transmembrane glycoprotein that is a member of the protein kinase (PK) superfamily. 2. EGFR binds to EGF, thus inducing receptor dimerization and tyrosine autophosphorylation, leading to cell proliferation. 3. Mutations in EGFR are associated with lung cancer. | F: 5′-TGCGTCTCTTGCCGGAAT-3′ R: 5′-GGCTCACCCTCCAGAAGGTT-3′ Amplicon length: 71 bp |
| MAP2K1 (MEK1) | Mitogen-activated protein kinase kinase 1 (located on chromosome 15) 1. The encoded protein is a member of the dual specificity PK family that acts as a mitogen-activated protein (MAP) kinase kinase. 2. The encoded protein stimulates the enzymatic activity of MAP kinases upon a wide variety of extra- and intracellular signals. 3. As a component of the MAP kinase signal transduction pathway, the encoded protein is involved in many cellular processes (e.g., proliferation, differentiation, and transcription regulation). | F: 5′-CAATGGCGGTGTGGTGTTC-3′ R: 5′-GATTGCGGGTTTGATCTCCAG-3′ Amplicon length: 91 bp |
| FOLH1 (PSMA) | Folate hydrolase 1 (located on chromosome 11) 1. It encodes a type II transmembrane glycoprotein belonging to the M28 peptidase family. 2. Also known as prostate-specific membrane antigen (PSMA), it is expressed in many tissues, including the prostate. 3. In the prostate, the FOLH1/PSMA protein is upregulated in cancer cells and is used as an effective diagnostic and prognostic indicator of prostate cancer. | F: 5′-AGAGGGCGATCTAGTGTATGTT-3′ R: 5′-TGATTTTCATGTCCCGTTCCAAT-3′ Amplicon length: 74 bp |
| BUB1 | BUB1 mitotic checkpoint serine/threonine kinase (located on chromosome 2) 1. It encodes a protein that plays a central role in mitosis. 2. This protein may also function in the DNA damage response. 3. Mutations in this gene have been associated with aneuploidy and several forms of cancer. | F: 5′-AGCCCAGACAGTAACAGACTC-3′ R: 5′-GTTGGCAACCTTATGTGTTTCAC-3′ Amplicon length: 136 bp |
| RHOA | Ras homolog family member A (located on chromosome 3) 1. It encodes a member of the Rho family of small GTPases that function as molecular switches in signal transduction cascades. 2. Overexpression of this gene is associated with tumor cell proliferation and metastasis. | F: 5′-GGAAAGCAGGTAGAGTTGGCT-3′ R: 5′-GGCTGTCGATGGAAAAACACAT-3′ Amplicon length: 118 bp |
| PCSK7 | Proprotein convertase subtilisin/kexin type 7 (located on chromosome 11) 1. It encodes a type 1 membrane-bound protease that is expressed in many tissues, including the neuroendocrine, liver, gut, and brain. 2. It has been implicated in the transcriptional regulation of housekeeping genes. 3. A chromosomal translocation associated with B-cell lymphoma occurs between this gene and its inverted counterpart. | F: 5′-GCAGCGTCCACTTCAACGA-3′ R: 5′-GCCCAGTCACATTGCGTTC-3′ Amplicon length: 117 bp |
| PITX2 (ARP1) | Paired-like homeodomain 2 (located on chromosome 4) 1. It encodes a member of the RIEG/PITX homeobox family, which is in the bicoid class of homeodomain proteins. 3. The encoded protein acts as a transcription factor and regulates procollagen lysyl hydroxylase gene expression. | F: 5′-GCCAAGGGCCTTACATCCG-3′ R: 5′-GGTGGGGAAAACATGCTCTG-3′ Amplicon length: 101 bp |
| ANXA3 (annexin) A3 | Annexin A3 (located on chromosome 4) 1. It encodes a member of the annexin family. 1. Members of this calcium-dependent phospholipid-binding protein family play a role in the regulation of cellular growth and in signal transduction pathways. 2. The encoded protein functions in the inhibition of phospholipase A2 and cleavage of inositol 1,2-cyclic phosphate to form inositol 1-phosphate. | F: 5′-TTAGCCCATCAGTGGATGCTG-3′ R: 5′-CTGTGCATTTGACCTCTCAGT-3′ Amplicon length: 104 bp |
| B2M | β2-microglobulin (located on chromosome 15) – Housekeeping gene | F: 5′-TGCTGTCTCCATGTTTGATGTATCT-3′ R: 5′-TCTCTGCTCCCCACCTCTAAGT-3′ Amplicon length: 86 bp |
| ACTB | β-actin (located on chromosome 7) – Housekeeping gene | F: 5′- GCCGGGACCTGACTGACTAC-3′ R: 5′- TTCTCCTTAATGTCACGCACGAT-3′ Amplicon length: 100 bp |
| Characteristics | Number of Patients, 100 (%) |
|---|---|
| Gender | |
| Male | 59 (59%) |
| Female | 41 (41%) |
| Age | |
| <50 years | 59 (59%) |
| ≥50 years | 41 (41%) |
| Tumor localization | |
| Left (descending colon) | 49 (49%) |
| Right (ascending colon) | 51 (51%) |
| Tumor stage | |
| I | 9 (9%) |
| II | 43 (43%) |
| ΙIΙ | 41 (41%) |
| IV | 7 (7%) |
| Differentiation grade | |
| Well differentiated | 82 (82%) |
| Poorly differentiated | 18 (18%) |
| Lymph node metastasis | |
| Yes | 37 (37%) |
| No | 63 (63%) |
| Median overall survival, range | 10.8 years, 0.019–21 years |
| Gene Symbol | Fold Change of Age | Fold Change of Sex | ||||
|---|---|---|---|---|---|---|
| <50 | ≥50 | p-Value | Male | Female | p-Value | |
| VANGL1 | 4.910 ± 7.56 | 7.155 ± 10.54 | 0.44 | 5.706 ± 9.02 | 6.972 ± 10.08 | 0.36 |
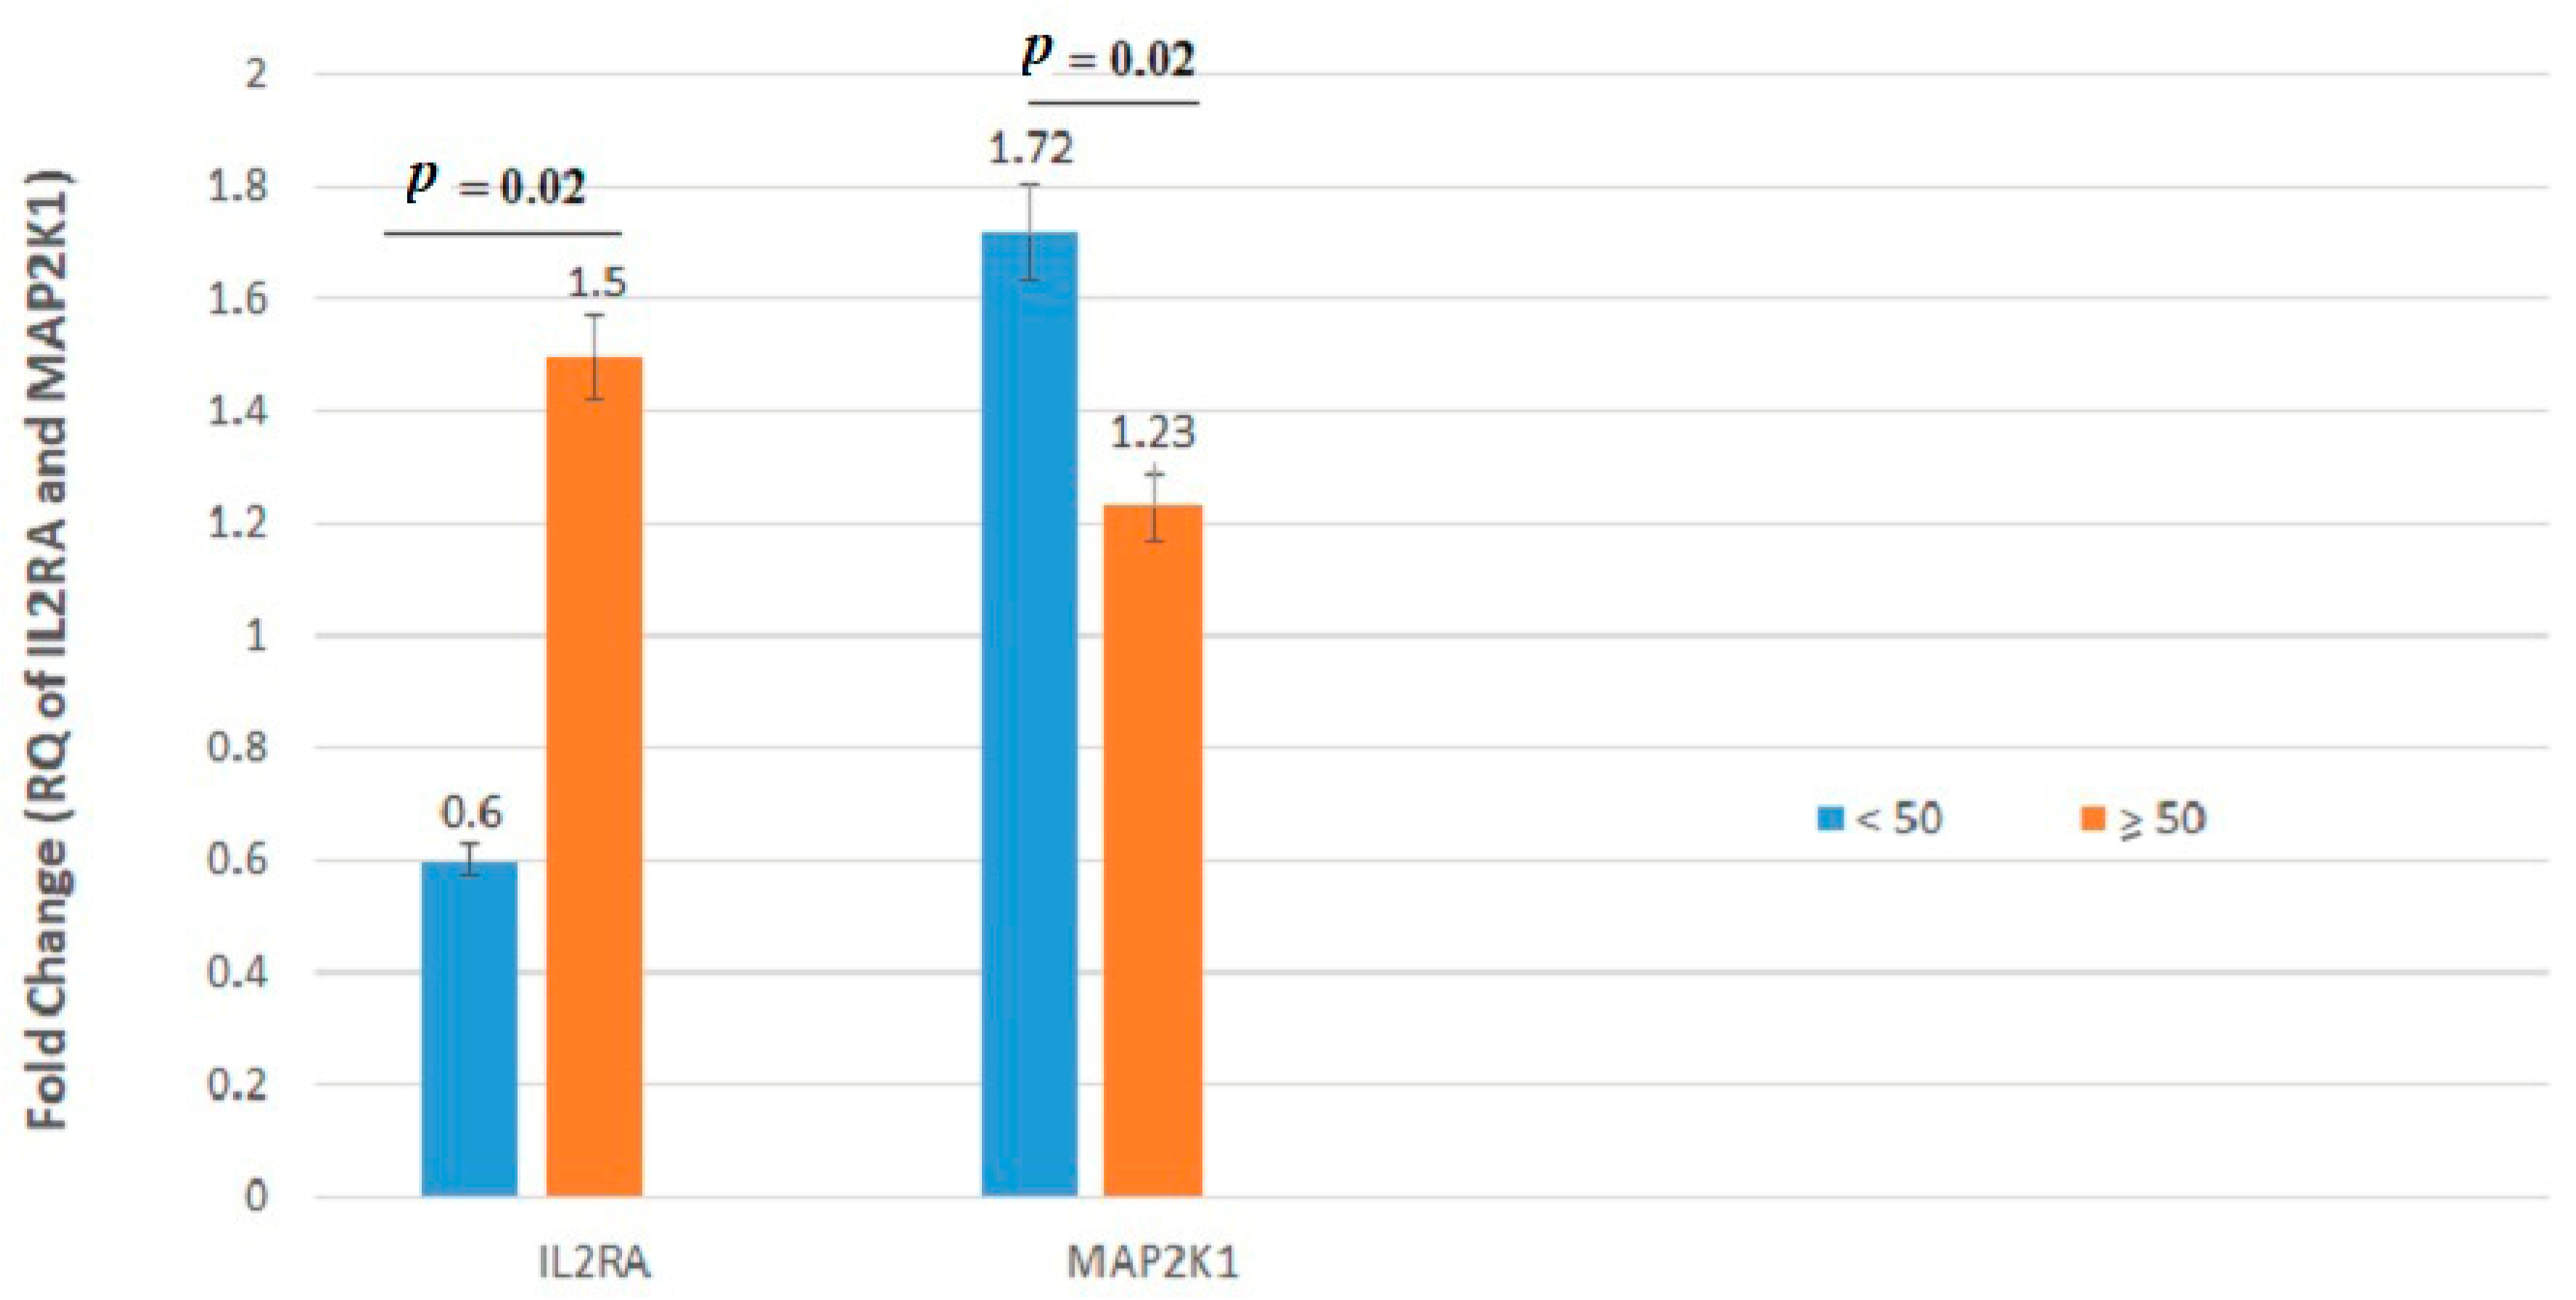
| IL2RA | 0.603 ± 0.640 | 1.509 ± 1.83 | 0.02 | 1.148 ± 1.61 | 1.098 ± 1.37 | 0.93 |
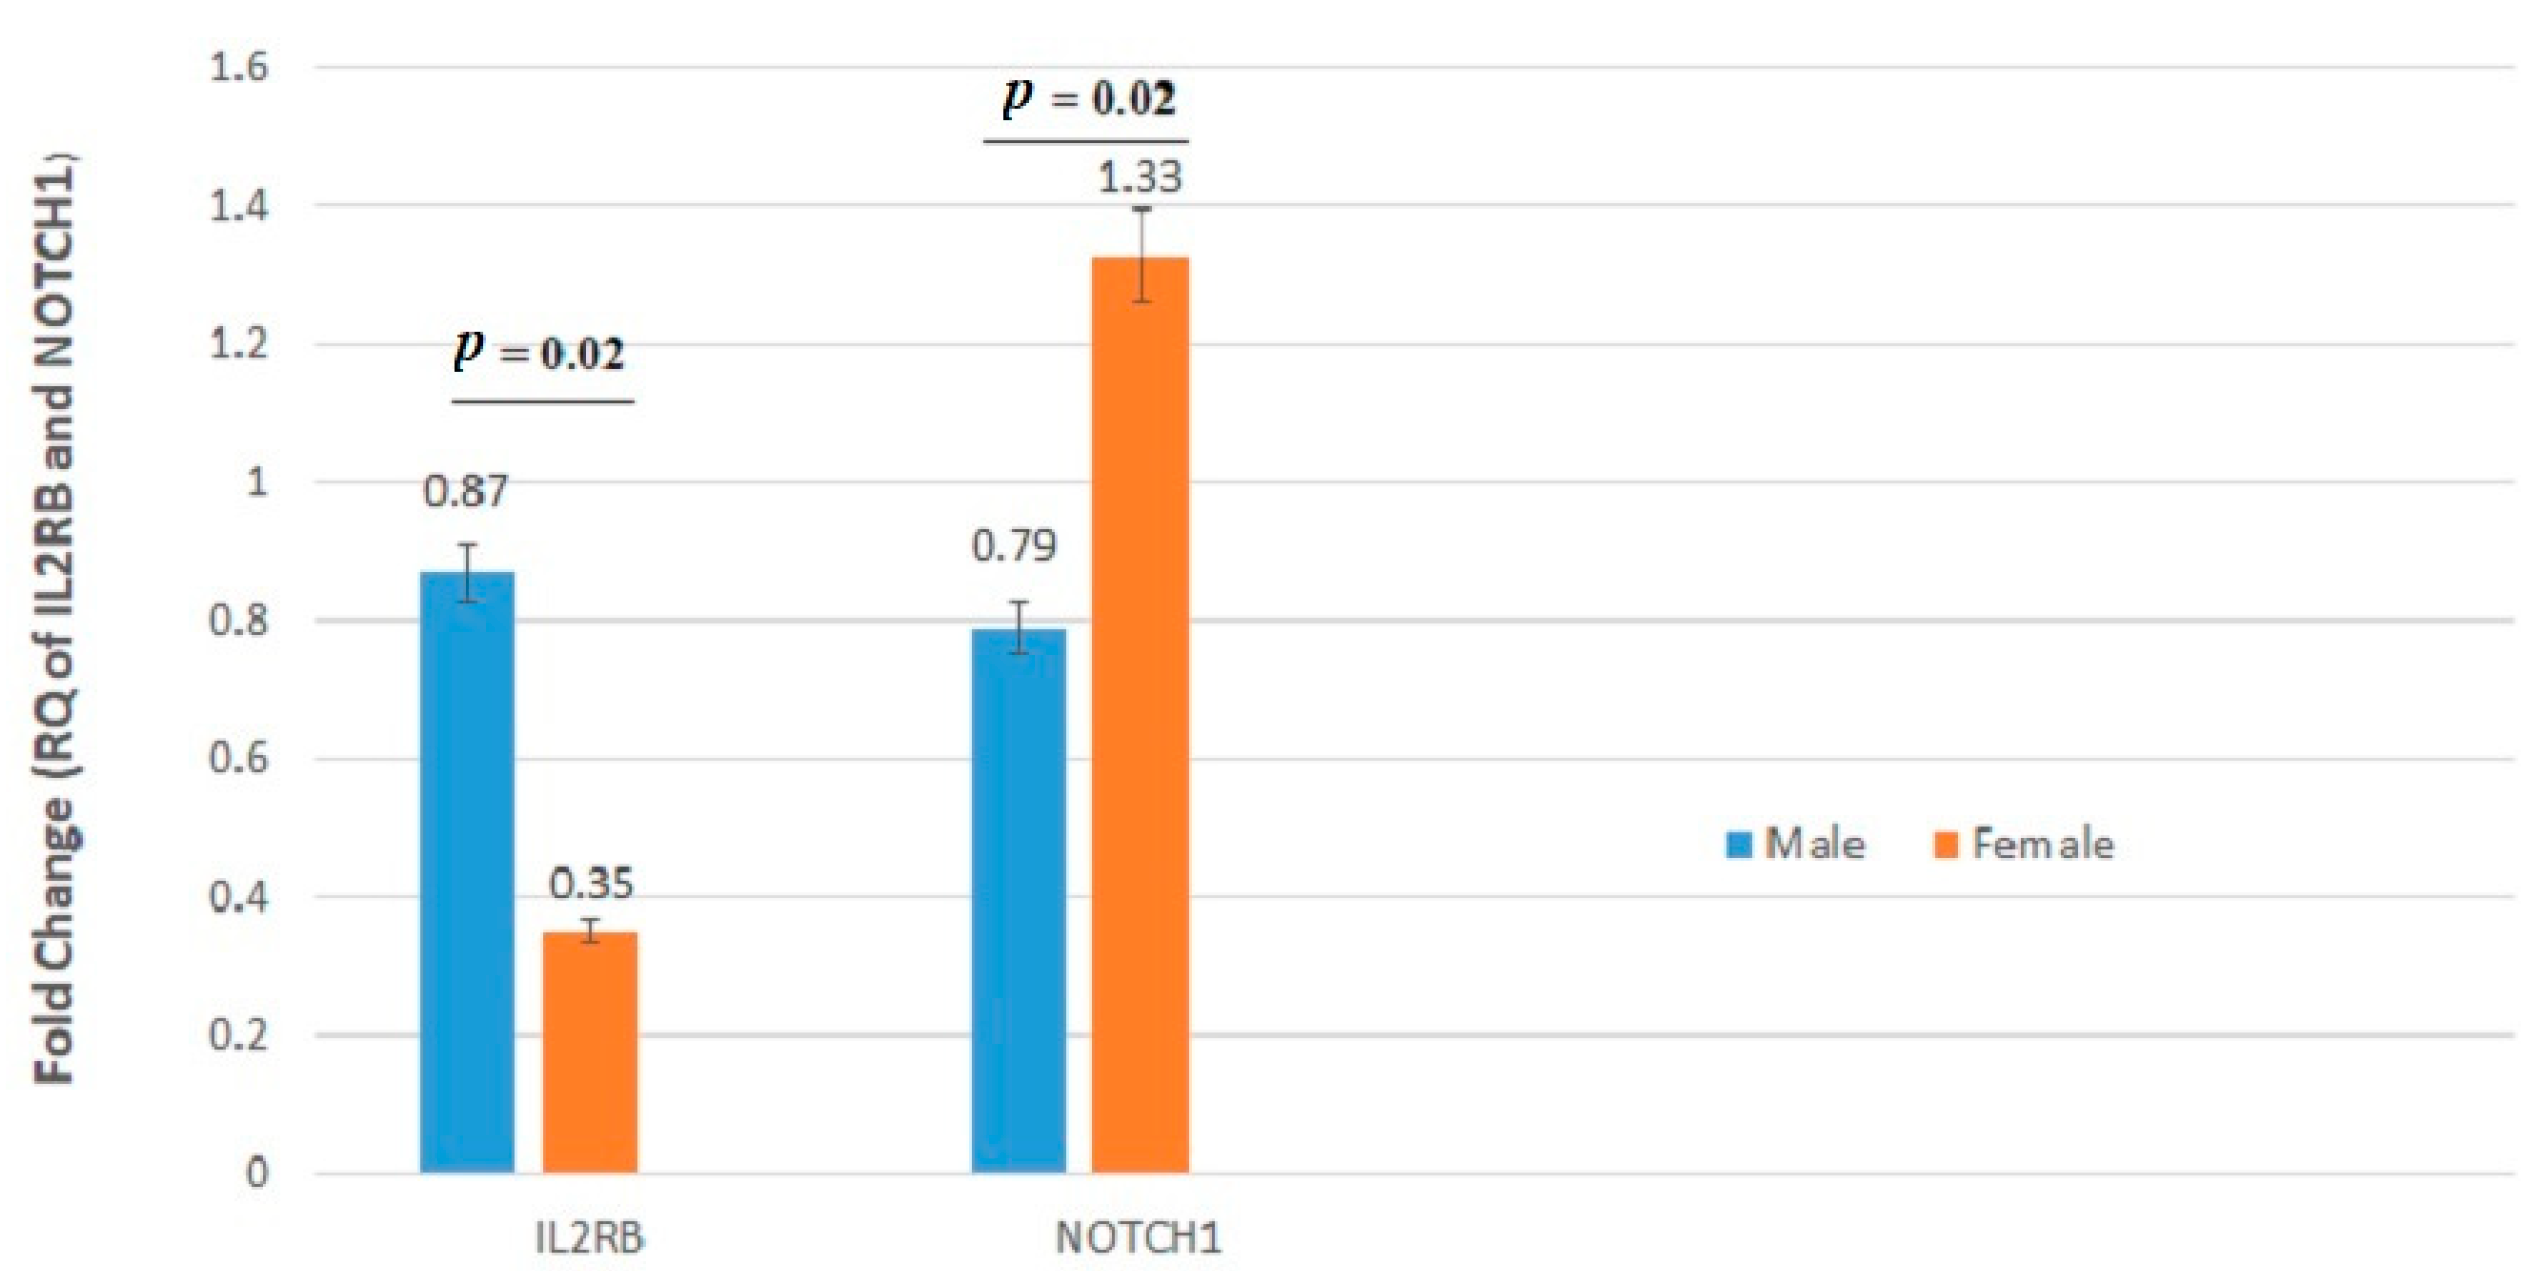
| IL2RB | 0.699 ± 1.10 | 0.635 ± 1.24 | 0.88 | 0.870 ± 1.37 | 0.351 ± 0.71 | 0.02 |
| TGFβ | 1.056 ± 1.61 | 1.285 ± 2.02 | 0.79 | 1.308 ± 2.14 | 1.010 ± 1.34 | 0.90 |
| SMAD2 | 1.313 ± 2.20 | 0.855 ± 1.45 | 0.74 | 0.942 ± 1.64 | 1.205 ± 2.06 | 0.30 |
| SMAD4 | 2.157 ± 2.36 | 2.425 ± 2.21 | 0.41 | 2.417 ± 2.20 | 2.157 ± 2.37 | 0.34 |
| CD44 | 0.596 ± 0.814 | 0.537 ± 0.87 | 0.44 | 0.478 ± 0.85 | 0.687 ± 0.82 | 0.10 |
| CD133 | 0.832 ± 1.77 | 1.329 ± 2.83 | 0.62 | 0.870 ± 2.43 | 1.495 ± 2.44 | 0.07 |
| HES1 | 2.830 ± 3.52 | 2.134 ± 3.28 | 0.36 | 2.685 ± 3.39 | 0.955 ± 3.38 | 0.44 |
| NOTCH1 | 1.088 ± 2.18 | 0.953 ± 2.22 | 0.58 | 0.795 ± 2.36 | 1.332 ± 1.89 | 0.02 |
| LEF1 | 1.178 ± 1.80 | 1.038 ± 1.19 | 0.58 | 0.988 ± 1.14 | 1.260 ± 1.86 | 0.86 |
| MTA1 | 1.045 ± 1.01 | 1.012 ± 0.98 | 0.85 | 0.947 ± 0.93 | 1.144 ± 1.06 | 0.37 |
| EGFR | 2.272 ± 2.60 | 2.937 ± 4.65 | 0.75 | 2.439 ± 3.43 | 2.986 ± 4.58 | 0.87 |
| MAP2K1 | 1.722 ± 2.47 | 1.235 ± 2.23 | 0.02 | 1.495 ± 2.65 | 1.355 ± 1.78 | 0.49 |
| FOLH1 | 0.797 ± 0.70 | 0.814 ± 0.91 | 0.65 | 0.809 ± 0.85 | 0.804 ± 0.81 | 0.78 |
| BUB1 | 0.656 ± 1.65 | 0.610 ± 1.46 | 0.18 | 0.731 ± 1.53 | 0.476 ± 1.56 | 0.27 |
| RHOA | 0.510 ± 0.621 | 0.562 ± 1.19 | 0.11 | 0.625 ± 1.11 | 0.414 ± 0.75 | 0.50 |
| PCSK7 | 6.590 ± 7.74 | 3.069 ± 4.48 | 0.19 | 4.196 ± 5.12 | 5.076 ± 6.02 | 0.42 |
| PITX2 | 0.976 ± 2.00 | 0.663 ± 1.13 | 0.57 | 0.720 ± 1.13 | 0.906 ± 2.05 | 0.58 |
| ANXA3 | 3.533 ± 4.70 | 4.399 ± 6.65 | 0.60 | 4.298 ± 6.06 | 3.641 ± 5.71 | 0.12 |
| Gene Symbol | Fold Change of Stage | Fold Change of Lymph Node Metastasis | Fold Change of Tumor Site | Fold Change of Differentiation Grade | ||||||||
|---|---|---|---|---|---|---|---|---|---|---|---|---|
| I, II | ΙIΙ, IV | p-Value | Yes | No | p-Value | Right | Left | p-Value | Well | Poor | p-Value | |
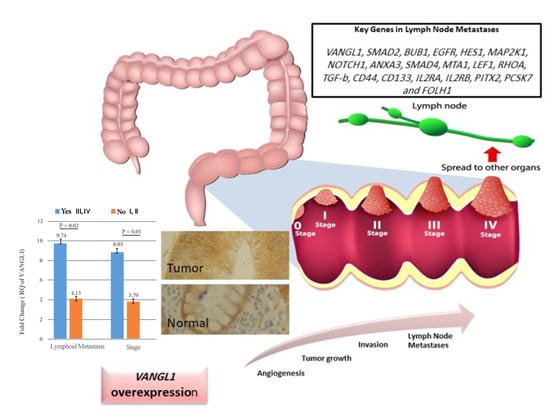
| VANGL1 | 3.795 ± 5.63 | 8.831 ± 11.80 | 0.05 | 9.749 ± 12.40 | 4.136 ± 6.38 | 0.02 | 7.144 ± 10.44 | 5.243 ± 8.23 | 0.26 | 6.516 ± 9.22 | 4.831 ± 10.50 | 0.07 |
| IL2RA | 1.073 ± 1.59 | 1.188 ± 1.44 | 0.40 | 0.982 ± 1.19 | 1.214 ± 1.68 | 0.85 | 1.293 ± 1.84 | 0.957 ± 1.08 | 0.63 | 1.221 ± 1.56 | 0.707 ± 1.23 | 0.12 |
| IL2RB | 0.728 ± 1.31 | 0.591 ± 1.02 | 0.64 | 0.433 ± 0.43 | 0.797 ± 1.33 | 0.19 | 0.520 ± 0.85 | 0.811 ± 1.44 | 0.78 | 0.618 ± 1.21 | 0.864 ± 1.00 | 0.05 |
| TGFβ | 0.977 ± 1.50 | 1.418 ± 2.17 | 0.71 | 1.560 ± 2.25 | 0.971 ± 1.56 | 0.22 | 1.086 ± 1.66 | 1.296 ± 2.06 | 0.53 | 1.649 ± 1.84 | 1.088 ± 1.90 | 0.26 |
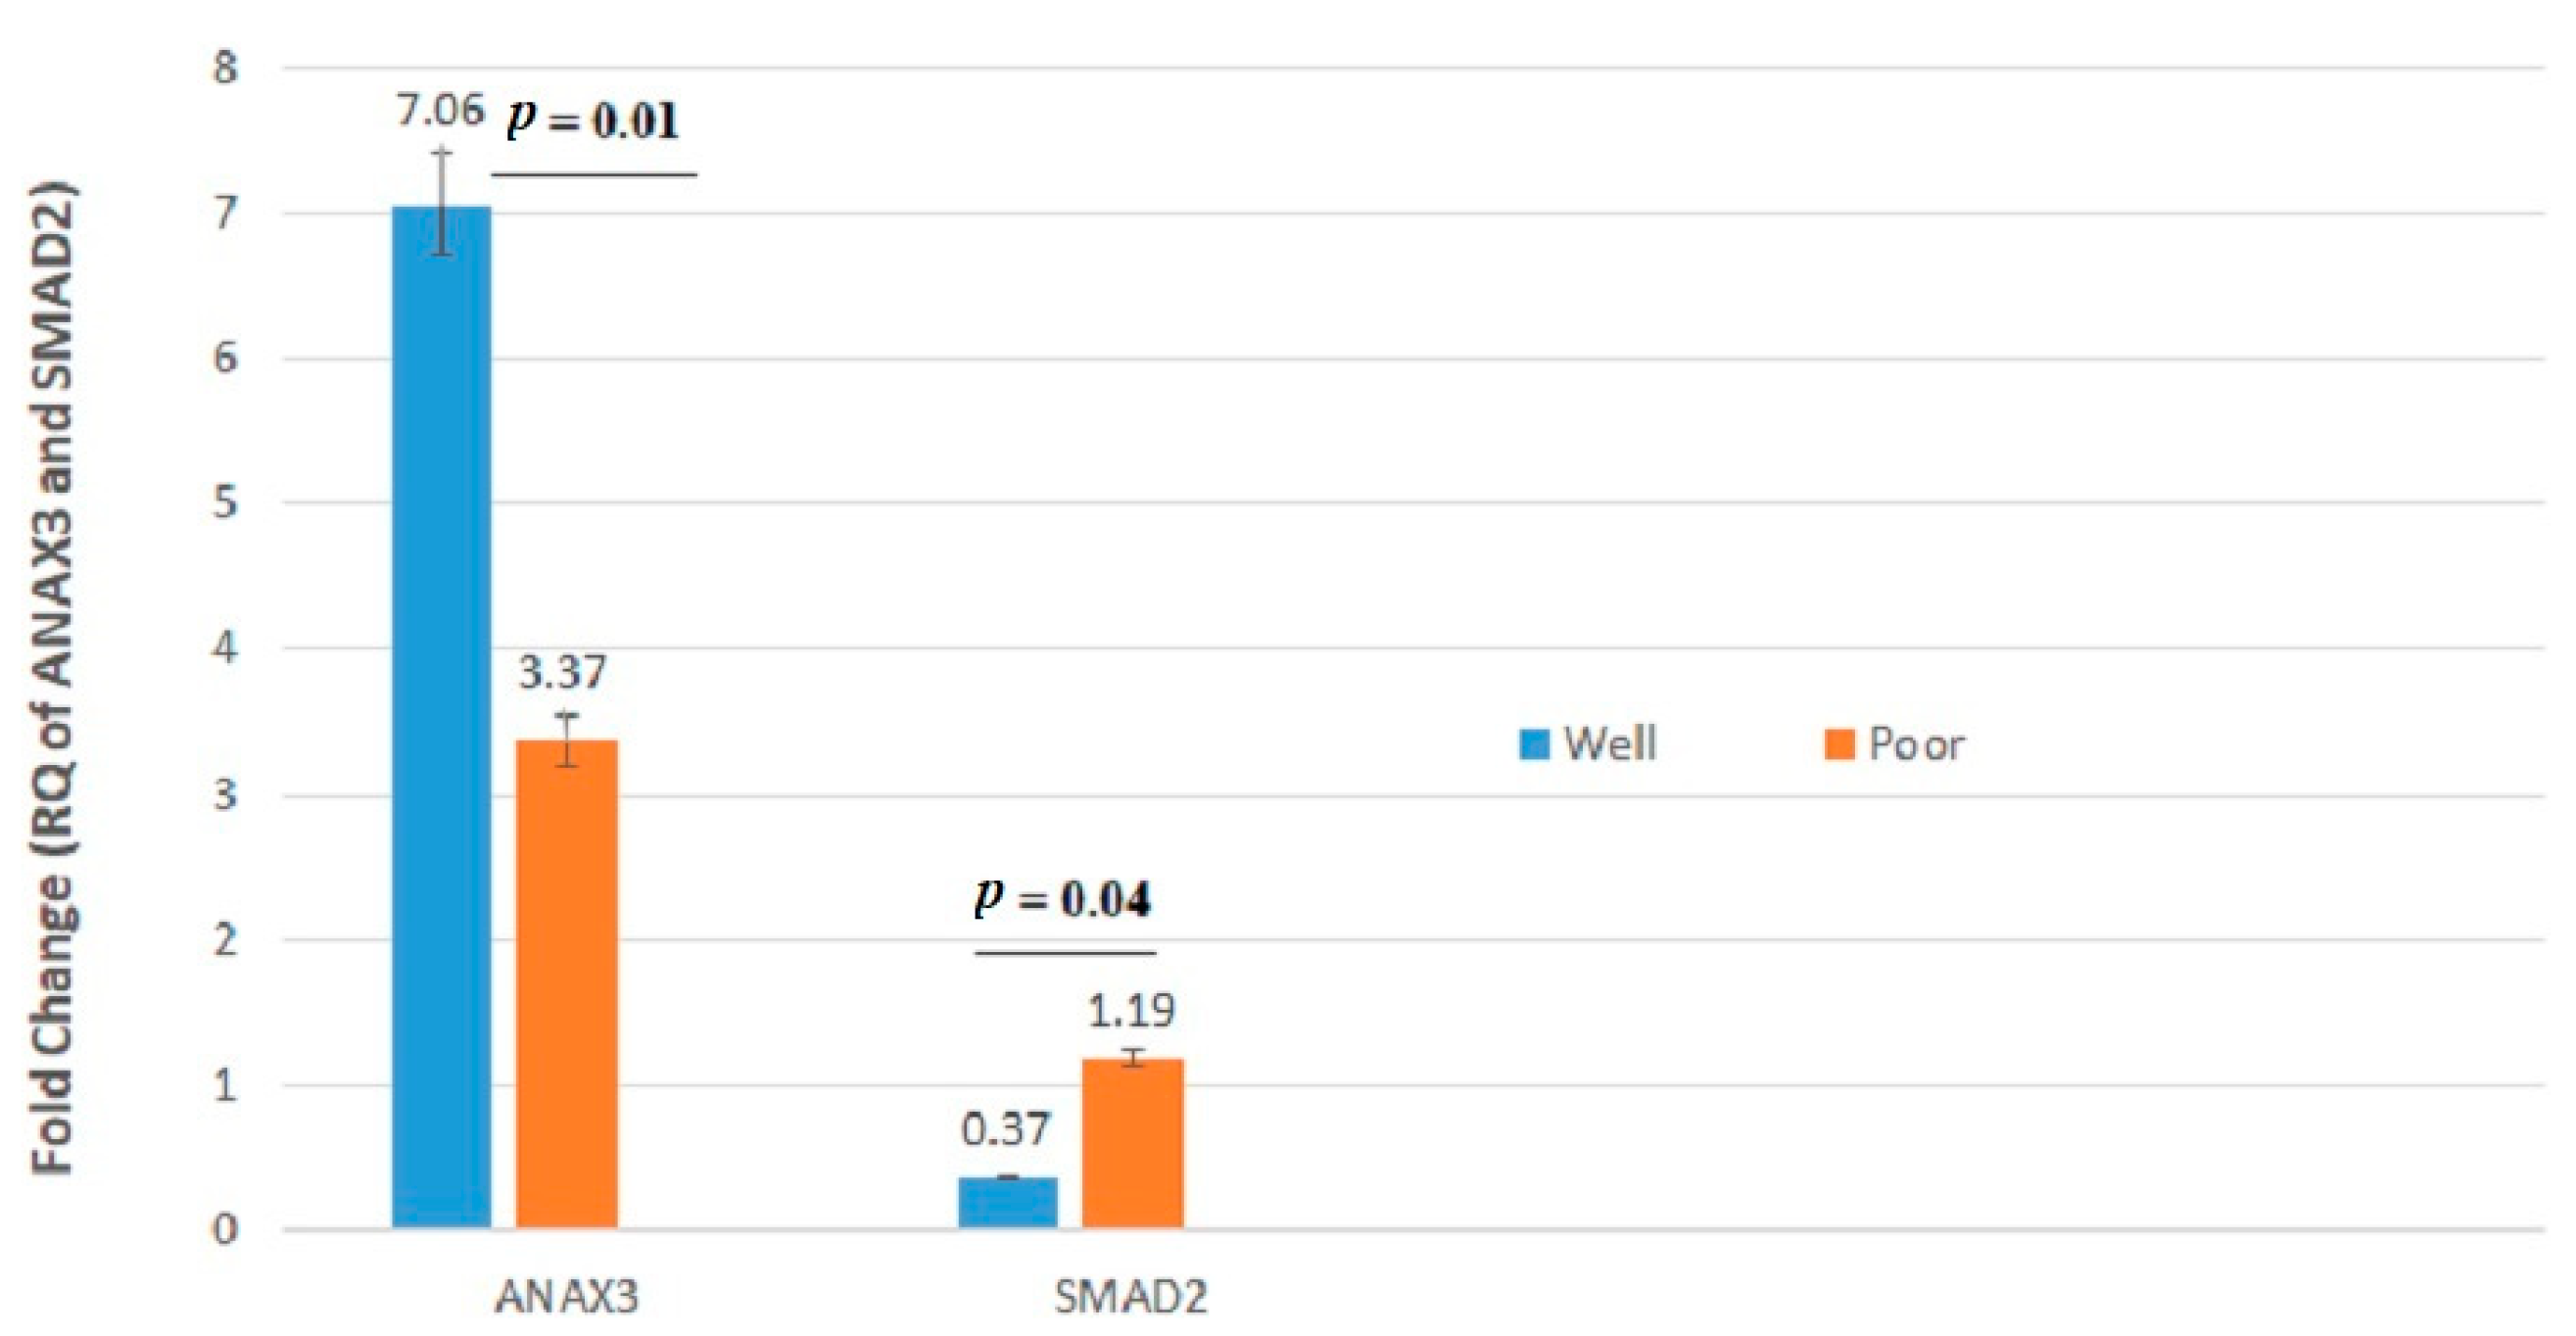
| SMAD2 | 1.257 ± 2.13 | 0.821 ± 1.37 | 0.27 | 0.702 ± 1.26 | 1.250 ± 2.05 | 0.19 | 1.053 ± 2.17 | 1.043 ± 1.36 | 0.24 | 0.371 ± 1.95 | 1.196 ± 0.65 | 0.04 |
| SMAD4 | 2.483 ± 2.50 | 2.128 ± 1.99 | 0.78 | 2.096 ± 1.99 | 2.440 ± 2.41 | 0.82 | 2.165 ± 2.41 | 2.467 ± 2.11 | 0.37 | 2.068 ± 2.20 | 2.367 ± 2.60 | 0.22 |
| CD44 | 0.480 ± 0.61 | 0.650 ± 1.03 | 0.77 | 0.767 ± 1.14 | 0.441 ± 0.58 | 0.65 | 0.705 ± 1.03 | 0.413 ± 0.55 | 0.24 | 0.570 ± 0.76 | 0.522 ± 1.15 | 0.35 |
| CD133 | 0.842 ± 1.99 | 1.421 ± 2.85 | 0.63 | 1.324 ± 2.43 | 1.000 ± 2.46 | 0.50 | 0.831 ± 1.59 | 1.421 ± 3.08 | 0.45 | 1.204 ± 2.63 | 0.738 ± 1.21 | 0.26 |
| HES1 | 2.111 ± 2.96 | 2.767 ± 3.80 | 0.44 | 2.944 ± 4.06 | 2.123 ± 2.91 | 0.33 | 2.707 ± 3.90 | 2.134 ± 2.76 | 0.29 | 2.637 ± 3.58 | 1.465 ± 2.11 | 0.47 |
| NOTCH1 | 1.147 ± 2.44 | 0.861 ± 1.90 | 0.66 | 0.968 ± 2.10 | 1.034 ± 2.26 | 0.87 | 0.768 ± 1.49 | 1.261 ± 2.73 | 0.16 | 1.170 ± 2.38 | 0.278 ± 0.49 | 0.13 |
| LEF1 | 0.844 ± 0.87 | 1.371 ± 1.89 | 0.76 | 1.424 ± 1.99 | 0.905 ± 1.02 | 0.67 | 0.980 ± 1.49 | 1.218 ± 1.45 | 0.21 | 1.056 ± 1.34 | 1.283 ± 2.00 | 0.51 |
| MTA1 | 0.983 ± 0.98 | 1.072 ± 1.00 | 0.72 | 1.073 ± 1.03 | 0.998 ± 0.96 | 0.83 | 1.178 ± 0.97 | 0.868 ± 0.99 | 0.08 | 1.024 ± 0.98 | 1.032 ± 1.04 | 0.89 |
| EGFR | 2.693 ± 3.86 | 2.620 ± 4.02 | 0.84 | 2.091 ± 2.65 | 2.990 ± 4.49 | 0.56 | 3.214 ± 4.31 | 2.078 ± 3.40 | 0.22 | 2.595 ± 4.12 | 2.945 ± 2.91 | 0.33 |
| MAP2K1 | 1.442 ± 2.57 | 1.436 ± 2.07 | 0.33 | 1.549 ± 1.25 | 1.253 ± 2.58 | 0.98 | 1.251 ± 2.09 | 1.636 ± 2.57 | 0.34 | 1.377 ± 2.34 | 1.724 ± 2.34 | 0.39 |
| FOLH1 | 0.857 ± 0.90 | 0.753 ± 0.75 | 0.55 | 0.767 ± 0.76 | 0.831 ± 0.87 | 0.79 | 0.848 ± 0.90 | 0.764 ± 0.75 | 0.70 | 0.829 ± 0.86 | 0.708 ± 0.67 | 0.83 |
| BUB1 | 0.607 ± 1.35 | 0.652 ± 1.73 | 0.95 | 0.617 ± 1.67 | 0.636 ± 1.47 | 0.96 | 0.559 ± 1.28 | 0.702 ± 1.78 | 0.65 | 0.695 ± 1.68 | 0.328 ± 0.48 | 0.27 |
| RHOA | 0.294 ± 0.39 | 0.807 ± 1.32 | 0.21 | 0.916 ± 1.46 | 0.320 ± 0.43 | 0.24 | 0.645 ± 1.13 | 0.431 ± 0.81 | 0.36 | 0.501 ± 0.86 | 0.720 ± 1.44 | 0.78 |
| PCSK7 | 4.290 ± 5.74 | 4.827 ± 6.81 | 0.12 | 4.170 ± 5.51 | 4.770 ± 6.21 | 0.19 | 3.614 ± 4.51 | 5.520 ± 6.32 | 0.07 | 4.364 ± 5.65 | 5.384 ± 6.96 | 1.00 |
| PITX2 | 0.644 ± 1.03 | 0.957 ± 1.95 | 0.98 | 1.079 ± 2.16 | 0.627 ± 1.03 | 0.63 | 0.959 ± 1.98 | 0.622 ± 0.92 | 0.84 | 0.737 ± 1.12 | 1.056 ± 2.82 | 0.21 |
| ANXA3 | 3.320 ± 4.54 | 4.811 ± 7.06 | 0.67 | 5.542 ± 7.75 | 3.150 ± 4.31 | 0.21 | 4.597 ± 7.06 | 3.450 ± 4.39 | 0.73 | 7.065 ± 4.91 | 3.370 ± 8.71 | 0.01 |
Publisher’s Note: MDPI stays neutral with regard to jurisdictional claims in published maps and institutional affiliations. |
© 2021 by the authors. Licensee MDPI, Basel, Switzerland. This article is an open access article distributed under the terms and conditions of the Creative Commons Attribution (CC BY) license (http://creativecommons.org/licenses/by/4.0/).
Share and Cite
Peyravian, N.; Nobili, S.; Pezeshkian, Z.; Olfatifar, M.; Moradi, A.; Baghaei, K.; Anaraki, F.; Nazari, K.; Asadzadeh Aghdaei, H.; Zali, M.R.; et al. Increased Expression of VANGL1 is Predictive of Lymph Node Metastasis in Colorectal Cancer: Results from a 20-Gene Expression Signature. J. Pers. Med. 2021, 11, 126. https://doi.org/10.3390/jpm11020126
Peyravian N, Nobili S, Pezeshkian Z, Olfatifar M, Moradi A, Baghaei K, Anaraki F, Nazari K, Asadzadeh Aghdaei H, Zali MR, et al. Increased Expression of VANGL1 is Predictive of Lymph Node Metastasis in Colorectal Cancer: Results from a 20-Gene Expression Signature. Journal of Personalized Medicine. 2021; 11(2):126. https://doi.org/10.3390/jpm11020126
Chicago/Turabian StylePeyravian, Noshad, Stefania Nobili, Zahra Pezeshkian, Meysam Olfatifar, Afshin Moradi, Kaveh Baghaei, Fakhrosadat Anaraki, Kimia Nazari, Hamid Asadzadeh Aghdaei, Mohammad Reza Zali, and et al. 2021. "Increased Expression of VANGL1 is Predictive of Lymph Node Metastasis in Colorectal Cancer: Results from a 20-Gene Expression Signature" Journal of Personalized Medicine 11, no. 2: 126. https://doi.org/10.3390/jpm11020126
APA StylePeyravian, N., Nobili, S., Pezeshkian, Z., Olfatifar, M., Moradi, A., Baghaei, K., Anaraki, F., Nazari, K., Asadzadeh Aghdaei, H., Zali, M. R., Mini, E., & Nazemalhosseini Mojarad, E. (2021). Increased Expression of VANGL1 is Predictive of Lymph Node Metastasis in Colorectal Cancer: Results from a 20-Gene Expression Signature. Journal of Personalized Medicine, 11(2), 126. https://doi.org/10.3390/jpm11020126