
Sex Difference in the Associations among Obesity-Related Indices with Incident Hypertension in a Large Taiwanese Population Follow-Up Study

 , , , and
Abstract
:1. Introduction
2. Materials and Methods
2.1. Taiwan Biobank
2.2. Definition of Incident Hypertension
2.3. Calculation of Obesity-Related Indices
- BMI was calculated as:
- 2.
- WHR was calculated as:
- 3.
- WHtR was calculated as:
- 4.
- BRI was calculated as:
- 5.
- CI was calculated using the Valdez equation based on BW, BH and WC as:
- 6.
- BAI was calculated according to the method of Bergman and colleagues as:
- 7.
- AVI was calculated as AVI = [37].
- 8.
- LAP was calculated as:
- 9.
- VAI score was calculated as described previously [39] using the following sex-specific equations (with TG levels in mmol/L and HDL-cholesterol levels in mmol/L):
2.4. Statistical Analysis
3. Results
3.1. Comparisons of Clinical Characteristics between the Participants by Sex
3.2. Comparisons of Clinical Characteristics between the Participants with and without Incident Hypertension by Sex
3.3. Associations among Obesity-Related Indices with Incident Hypertension by Sex
3.4. Interactions among Obesity-Related Indices and Sex on Incident Hypertension
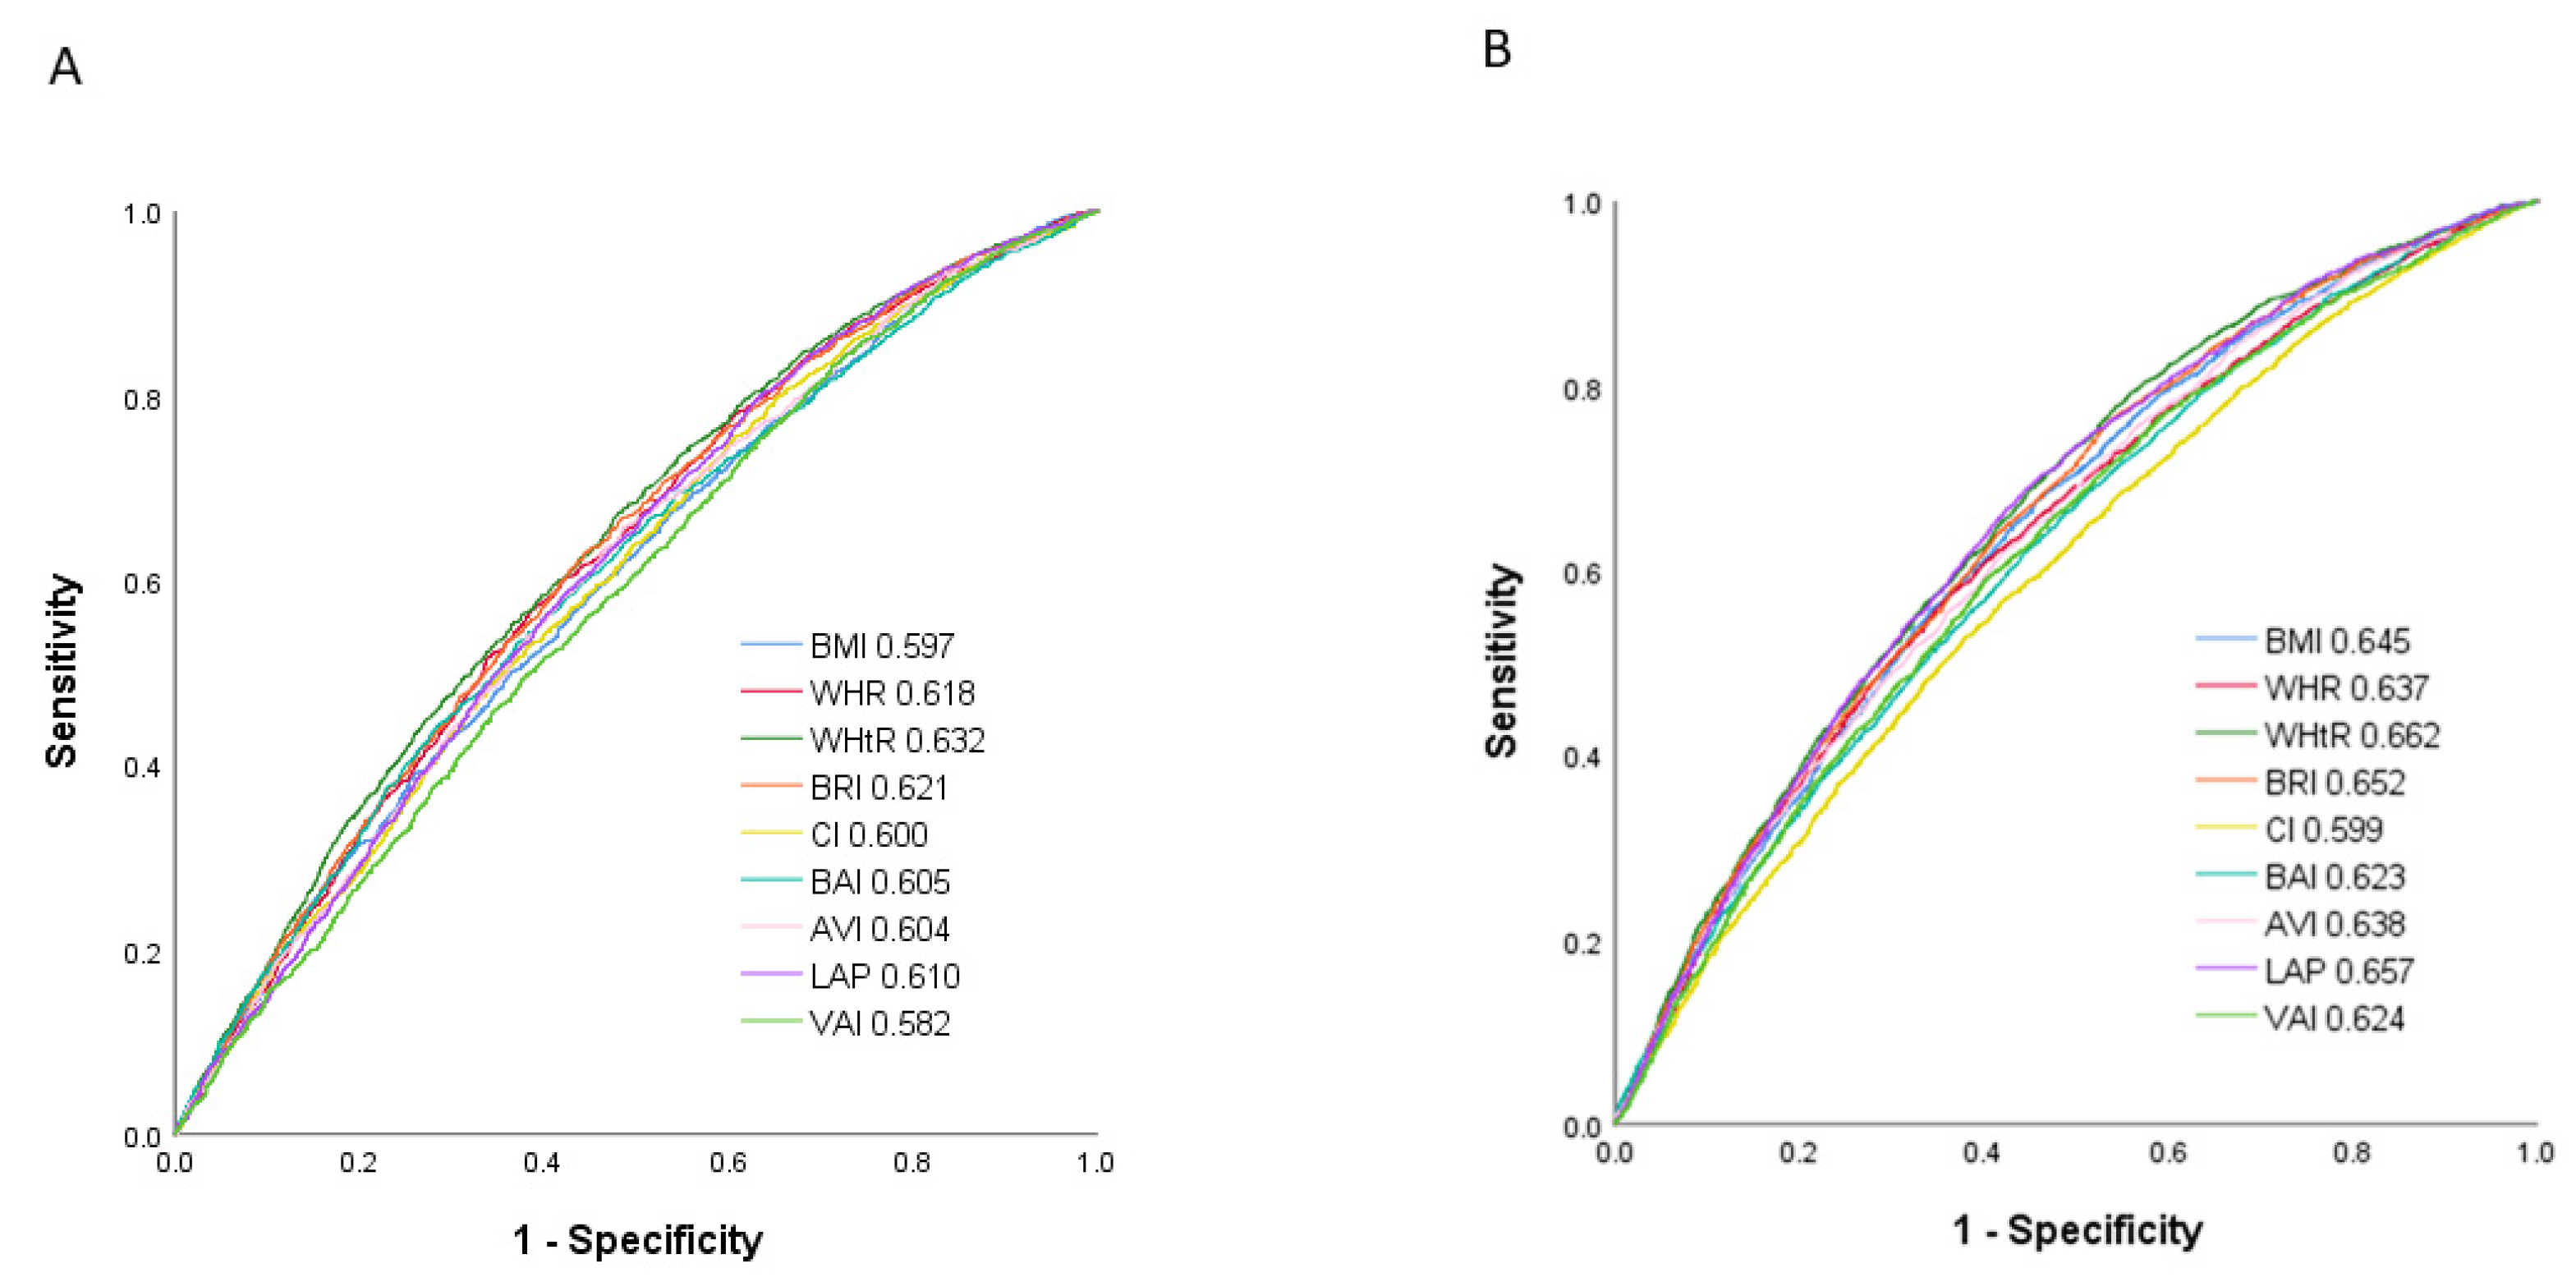
3.5. Performance and Predictive Ability of the Obesity-Related Indices to Identify Incident Hypertension by Sex
4. Discussion
Supplementary Materials
Author Contributions
Funding
Institutional Review Board Statement
Informed Consent Statement
Data Availability Statement
Conflicts of Interest
References
- Zhou, B.; Carrillo-Larco, R.M.; Danaei, G.; Riley, L.M.; Paciorek, C.J.; Stevens, G.A.; Gregg, E.W.; Bennett, J.E.; Solomon, B.; Singleton, R.K.; et al. Worldwide trends in hypertension prevalence and progress in treatment and control from 1990 to 2019: A pooled analysis of 1201 population-representative studies with 104 million participants. Lancet 2021, 398, 957–980. [Google Scholar] [CrossRef]
- Ostchega, Y.; Fryar, C.D.; Nwankwo, T.; Nguyen, D.T. Hypertension Prevalence among Adults Aged 18 and over United States 2017–2018. NCHS Data Brief. 2020, 364, 1–8. [Google Scholar]
- The Prevalence of Three-Hypers Series in Taiwanese. Website. Health Promotion Administration, Taiwan. Available online: https://www.hpa.gov.tw/Pages/Detail.aspx?nodeid=641&pid=1231 (accessed on 20 May 2022).
- Beevers, G.; Lip, G.Y.; O’Brien, E. ABC of hypertension: The pathophysiology of hypertension. BMJ 2001, 322, 912–916. [Google Scholar] [CrossRef] [PubMed]
- Harrison, D.G.; Coffman, T.M.; Wilcox, C.S. Pathophysiology of Hypertension: The Mosaic Theory and Beyond. Circ. Res. 2021, 128, 847–863. [Google Scholar] [CrossRef]
- Grillo, A.; Salvi, L.; Coruzzi, P.; Salvi, P.; Parati, G. Sodium Intake and Hypertension. Nutrients 2019, 11, 1970. [Google Scholar] [CrossRef] [Green Version]
- Ohishi, M. Hypertension with diabetes mellitus: Physiology and pathology. Hypertens. Res. 2018, 41, 389–393. [Google Scholar] [CrossRef]
- Hall, J.E.; do Carmo, J.M.; da Silva, A.A.; Wang, Z.; Hall, M.E. Obesity, kidney dysfunction and hypertension: Mechanistic links. Nat. Rev. Nephrol. 2019, 15, 367–385. [Google Scholar] [CrossRef]
- Mouton, A.J.; Li, X.; Hall, M.E.; Hall, J.E. Obesity, Hypertension, and Cardiac Dysfunction: Novel Roles of Immunometabolism in Macrophage Activation and Inflammation. Circ. Res. 2020, 126, 789–806. [Google Scholar] [CrossRef]
- Hall, J.E.; do Carmo, J.M.; da Silva, A.A.; Wang, Z.; Hall, M.E. Obesity-induced hypertension: Interaction of neurohumoral and renal mechanisms. Circ. Res. 2015, 116, 991–1006. [Google Scholar] [CrossRef] [Green Version]
- Arif, M.; Sadayappan, S.; Becker, R.C.; Martin, L.J.; Urbina, E.M. Epigenetic modification: A regulatory mechanism in essential hypertension. Hypertens. Res. 2019, 42, 1099–1113. [Google Scholar] [CrossRef]
- Hill, L.K.; Thayer, J.F. The Autonomic Nervous System and Hypertension: Ethnic Differences and Psychosocial Factors. Curr. Cardiol. Rep. 2019, 21, 15. [Google Scholar] [CrossRef] [PubMed]
- Wu, C.H.; Mohammadmoradi, S.; Chen, J.Z.; Sawada, H.; Daugherty, A.; Lu, H.S. Renin-Angiotensin System and Cardiovascular Functions. Arterioscler. Thromb. Vasc. Biol. 2018, 38, e108–e116. [Google Scholar] [CrossRef] [Green Version]
- Schulz, E.; Gori, T.; Munzel, T. Oxidative stress and endothelial dysfunction in hypertension. Hypertens. Res. 2011, 34, 665–673. [Google Scholar] [CrossRef] [PubMed]
- Cipolla, M.J.; Liebeskind, D.S.; Chan, S.L. The importance of comorbidities in ischemic stroke: Impact of hypertension on the cerebral circulation. J. Cereb. Blood Flow Metab. 2018, 38, 2129–2149. [Google Scholar] [CrossRef]
- Verma, A.; Solomon, S.D. Diastolic dysfunction as a link between hypertension and heart failure. Med. Clin. N. Am. 2009, 93, 647–664. [Google Scholar] [CrossRef] [PubMed]
- Al-Sharea, A.; Lee, M.K.S.; Whillas, A.; Michell, D.L.; Shihata, W.A.; Nicholls, A.J.; Cooney, O.D.; Kraakman, M.J.; Veiga, C.B.; Jefferis, A.M.; et al. Chronic sympathetic driven hypertension promotes atherosclerosis by enhancing hematopoiesis. Haematologica 2019, 104, 456–467. [Google Scholar] [CrossRef] [Green Version]
- Turana, Y.; Tengkawan, J.; Chia, Y.C.; Hoshide, S.; Shin, J.; Chen, C.H.; Buranakitjaroen, P.; Nailes, J.; Park, S.; Siddique, S.; et al. Hypertension and Dementia: A comprehensive review from the HOPE Asia Network. J. Clin. Hypertens. 2019, 21, 1091–1098. [Google Scholar] [CrossRef] [Green Version]
- Kawamoto, R.; Kikuchi, A.; Akase, T.; Ninomiya, D.; Kumagi, T. Usefulness of waist-to-height ratio in screening incident hypertension among Japanese community-dwelling middle-aged and elderly individuals. Clin. Hypertens. 2020, 26, 9. [Google Scholar] [CrossRef]
- Browning, L.M.; Hsieh, S.D.; Ashwell, M. A systematic review of waist-to-height ratio as a screening tool for the prediction of cardiovascular disease and diabetes: 0.5 could be a suitable global boundary value. Nutr. Res. Rev. 2010, 23, 247–269. [Google Scholar] [CrossRef] [Green Version]
- Choi, J.R.; Koh, S.B.; Choi, E. Waist-to-height ratio index for predicting incidences of hypertension: The ARIRANG study. BMC Public Health 2018, 18, 767. [Google Scholar] [CrossRef]
- Ou, Y.L.; Lee, M.Y.; Lin, I.T.; Wen, W.L.; Hsu, W.H.; Chen, S.C. Obesity-related indices are associated with albuminuria and advanced kidney disease in type 2 diabetes mellitus. Ren. Fail. 2021, 43, 1250–1258. [Google Scholar] [CrossRef]
- Hsu, Y.E.; Chen, S.C.; Geng, J.H.; Wu, D.W.; Wu, P.Y.; Huang, J.C. Obesity-Related Indices Are Associated with Longitudinal Changes in Lung Function: A Large Taiwanese Population Follow-Up Study. Nutrients 2021, 13, 4055. [Google Scholar] [CrossRef]
- Wung, C.H.; Chung, C.Y.; Wu, P.Y.; Huang, J.C.; Tsai, Y.C.; Chen, S.C.; Chiu, Y.W.; Chang, J.M. Associations between Metabolic Syndrome and Obesity-Related Indices and Bone Mineral Density T-Score in Hemodialysis Patients. J. Pers. Med. 2021, 11, 775. [Google Scholar] [CrossRef]
- Wung, C.H.; Lee, M.Y.; Wu, P.Y.; Huang, J.C.; Chen, S.C. Obesity-Related Indices Are Associated with Peripheral Artery Occlusive Disease in Patients with Type 2 Diabetes Mellitus. J. Pers. Med. 2021, 11, 533. [Google Scholar] [CrossRef]
- Huang, S.H.; Chen, S.C.; Geng, J.H.; Wu, D.W.; Li, C.H. Metabolic Syndrome and High-Obesity-Related Indices Are Associated with Poor Cognitive Function in a Large Taiwanese Population Study Older than 60 Years. Nutrients 2022, 14, 1535. [Google Scholar] [CrossRef]
- Lin, I.T.; Lee, M.Y.; Wang, C.W.; Wu, D.W.; Chen, S.C. Gender Differences in the Relationships among Metabolic Syndrome and Various Obesity-Related Indices with Nonalcoholic Fatty Liver Disease in a Taiwanese Population. Int. J. Environ. Res. Public Health 2021, 18, 857. [Google Scholar] [CrossRef]
- Chiu, T.H.; Huang, Y.C.; Chiu, H.; Wu, P.Y.; Chiou, H.C.; Huang, J.C.; Chen, S.C. Comparison of Various Obesity-Related Indices for Identification of Metabolic Syndrome: A Population-Based Study from Taiwan Biobank. Diagnostics 2020, 10, 1081. [Google Scholar] [CrossRef]
- Janghorbani, M.; Aminorroaya, A.; Amini, M. Comparison of Different Obesity Indices for Predicting Incident Hypertension. High Blood Press. Cardiovasc. Prev. 2017, 24, 157–166. [Google Scholar] [CrossRef]
- Lin, Y.A.; Chen, Y.J.; Tsao, Y.C.; Yeh, W.C.; Li, W.C.; Tzeng, I.S.; Chen, J.Y. Relationship between obesity indices and hypertension among middle-aged and elderly populations in Taiwan: A community-based, cross-sectional study. BMJ Open 2019, 9, e031660. [Google Scholar] [CrossRef] [Green Version]
- Chen, C.H.; Yang, J.H.; Chiang, C.W.K.; Hsiung, C.N.; Wu, P.E.; Chang, L.C.; Chu, H.W.; Chang, J.; Song, I.W.; Yang, S.L.; et al. Population structure of Han Chinese in the modern Taiwanese population based on 10,000 participants in the Taiwan Biobank project. Hum. Mol. Genet. 2016, 25, 5321–5331. [Google Scholar] [CrossRef] [Green Version]
- Fan, C.T.; Hung, T.H.; Yeh, C.K. Taiwan Regulation of Biobanks. J. Law. Med. Ethics 2015, 43, 816–826. [Google Scholar] [CrossRef] [PubMed]
- Levey, A.S.; Bosch, J.P.; Lewis, J.B.; Greene, T.; Rogers, N.; Roth, D. A more accurate method to estimate glomerular filtration rate from serum creatinine: A new prediction equation. Modification of Diet in Renal Disease Study Group. Ann. Intern. Med. 1999, 130, 461–470. [Google Scholar] [CrossRef] [PubMed]
- Thomas, D.M.; Bredlau, C.; Bosy-Westphal, A.; Mueller, M.; Shen, W.; Gallagher, D.; Maeda, Y.; McDougall, A.; Peterson, C.M.; Ravussin, E.; et al. Relationships between body roundness with body fat and visceral adipose tissue emerging from a new geometrical model. Obesity 2013, 21, 2264–2271. [Google Scholar] [CrossRef] [PubMed] [Green Version]
- Valdez, R. A simple model-based index of abdominal adiposity. J. Clin. Epidemiol. 1991, 44, 955–956. [Google Scholar] [CrossRef]
- Bergman, R.N.; Stefanovski, D.; Buchanan, T.A.; Sumner, A.E.; Reynolds, J.C.; Sebring, N.G.; Xiang, A.H.; Watanabe, R.M. A better index of body adiposity. Obesity (Silver Spring, Md.) 2011, 19, 1083–1089. [Google Scholar] [CrossRef]
- Guerrero-Romero, F.; Rodríguez-Morán, M. Abdominal volume index. An anthropometry-based index for estimation of obesity is strongly related to impaired glucose tolerance and type 2 diabetes mellitus. Arch. Med. Res. 2003, 34, 428–432. [Google Scholar] [CrossRef]
- Kahn, H.S. The “lipid accumulation product” performs better than the body mass index for recognizing cardiovascular risk: A population-based comparison. BMC Cardiovasc. Disord. 2005, 5, 26. [Google Scholar] [CrossRef] [Green Version]
- Amato, M.C.; Giordano, C.; Galia, M.; Criscimanna, A.; Vitabile, S.; Midiri, M.; Galluzzo, A. Visceral Adiposity Index: A reliable indicator of visceral fat function associated with cardiometabolic risk. Diabetes Care 2010, 33, 920–922. [Google Scholar] [CrossRef] [Green Version]
- Shihab, H.M.; Meoni, L.A.; Chu, A.Y.; Wang, N.Y.; Ford, D.E.; Liang, K.Y.; Gallo, J.J.; Klag, M.J. Body mass index and risk of incident hypertension over the life course: The Johns Hopkins Precursors Study. Circulation 2012, 126, 2983–2989. [Google Scholar] [CrossRef] [Green Version]
- Chua, E.Y.; Zalilah, M.S.; Haemamalar, K.; Norhasmah, S.; Geeta, A. Obesity indices predict hypertension among indigenous adults in Krau Wildlife Reserve, Peninsular Malaysia. J. Health Popul. Nutr. 2017, 36, 24. [Google Scholar] [CrossRef]
- Lam, B.C.; Koh, G.C.; Chen, C.; Wong, M.T.; Fallows, S.J. Comparison of Body Mass Index (BMI), Body Adiposity Index (BAI), Waist Circumference (WC), Waist-To-Hip Ratio (WHR) and Waist-To-Height Ratio (WHtR) as predictors of cardiovascular disease risk factors in an adult population in Singapore. PLoS ONE 2015, 10, e0122985. [Google Scholar] [CrossRef] [PubMed]
- Garrison, R.J.; Kannel, W.B.; Stokes, J., III; Castelli, W.P. Incidence and precursors of hypertension in young adults, The Framingham offspring study. Prev. Med. J. 1987, 16, 235–251. [Google Scholar] [CrossRef]
- Fantin, F.; Giani, A.; Zoico, E.; Rossi, A.P.; Mazzali, G.; Zamboni, M. Weight Loss and Hypertension in Obese Subjects. Nutrients 2019, 11, 1667. [Google Scholar] [CrossRef] [PubMed] [Green Version]
- Adeosun, S.O.; Gordon, D.M.; Weeks, M.F.; Moore, K.H.; Hall, J.E.; Hinds, T.D., Jr.; Stec, D.E. Loss of biliverdin reductase-A promotes lipid accumulation and lipotoxicity in mouse proximal tubule cells. Am. J. Physiol. Renal. Physiol. 2018, 315, F323–F331. [Google Scholar] [CrossRef]
- Marcus, Y.; Shefer, G.; Stern, N. Adipose tissue renin-angiotensin-aldosterone system (RAAS) and progression of insulin resistance. Mol. Cell Endocrinol. 2013, 378, 1–14. [Google Scholar] [CrossRef]
- Kashyap, S.R.; Roman, L.J.; Lamont, J.; Masters, B.S.; Bajaj, M.; Suraamornkul, S.; Belfort, R.; Berria, R.; Kellogg, D.L., Jr.; Liu, Y.; et al. Insulin resistance is associated with impaired nitric oxide synthase activity in skeletal muscle of type 2 diabetic subjects. J. Clin. Endocrinol. Metab. 2005, 90, 1100–1105. [Google Scholar] [CrossRef] [Green Version]
- Mendizabal, Y.; Llorens, S.; Nava, E. Hypertension in metabolic syndrome: Vascular pathophysiology. Int. J. Hypertens. 2013, 2013, 230868. [Google Scholar] [CrossRef] [Green Version]
- Rask-Madsen, C.; King, G.L. Mechanisms of Disease: Endothelial dysfunction in insulin resistance and diabetes. Nat. Clin. Pract. Endocrinol. Metab. 2007, 3, 46–56. [Google Scholar] [CrossRef]
- Moosaie, F.; Fatemi Abhari, S.M.; Deravi, N.; Karimi Behnagh, A.; Esteghamati, S.; Dehghani Firouzabadi, F.; Rabizadeh, S.; Nakhjavani, M.; Esteghamati, A. Waist-To-Height Ratio Is a More Accurate Tool for Predicting Hypertension Than Waist-To-Hip Circumference and BMI in Patients With Type 2 Diabetes: A Prospective Study. Front. Public Health 2021, 9, 726288. [Google Scholar] [CrossRef]
- Romero-Corral, A.; Montori, V.M.; Somers, V.K.; Korinek, J.; Thomas, R.J.; Allison, T.G.; Mookadam, F.; Lopez-Jimenez, F. Association of bodyweight with total mortality and with cardiovascular events in coronary artery disease a systematic review of cohort studies. Lancet 2006, 368, 666–678. [Google Scholar] [CrossRef]
- Faulkner, J.L.; Belin de Chantemele, E.J. Sex Differences in Mechanisms of Hypertension Associated with Obesity. Hypertension 2018, 71, 15–21. [Google Scholar] [CrossRef] [PubMed]
- Motamed, N.; Sohrabi, M.; Poustchi, H.; Maadi, M.; Malek, M.; Keyvani, H.; Amoli, M.S.; Zamani, F. The six obesity indices, which one is more compatible with metabolic syndrome? A population based study. Diabetes Metab. Syndr. 2017, 11, 173–177. [Google Scholar] [CrossRef] [PubMed]
- Montague, C.T.; Prins, J.B.; Sanders, L.; Digby, J.E.; O’Rahilly, S. Depot-_and_sex-specific_differences in Human Leptin mRNA Expression. Diabetes 1997, 46, 342–347. [Google Scholar] [CrossRef] [PubMed]
- Power, M.L.; Schulkin, J. Sex differences in fat storage, fat metabolism, and the health risks from obesity: Possible evolutionary origins. Br. J. Nutr. 2008, 99, 931–940. [Google Scholar] [CrossRef]
- Zhou, Z.; Hu, D.; Chen, J. Association between obesity indices and blood pressure or hypertension: Which index is the best? Public Health Nutr. 2009, 12, 1061–1071. [Google Scholar] [CrossRef] [Green Version]
- Adegoke, O.; Ozoh, O.B.; Odeniyi, I.A.; Bello, B.T.; Akinkugbe, A.O.; Ojo, O.O.; Agabi, O.P.; Okubadejo, N.U. Prevalence of obesity and an interrogation of the correlation between anthropometric indices and blood pressures in urban Lagos, Nigeria. Sci. Rep. 2021, 11, 3522. [Google Scholar] [CrossRef]
- Kautzky-Willer, A.; Harreiter, J.; Pacini, G. Sex and Gender Differences in Risk, Pathophysiology and Complications of Type 2 Diabetes Mellitus. Endocr. Rev. 2016, 37, 278–316. [Google Scholar] [CrossRef] [Green Version]
- Nutrition and Health Survey in Taiwan, 2013–2016. Health Promotion Administration, Taiwan. Available online: https://www.hpa.gov.tw/Pages/List.aspx?nodeid=3998 (accessed on 20 May 2022).


| Characteristics | Male (n = 6899) | Female (n = 14,567) | p |
|---|---|---|---|
| Age (year) | 49.6 ± 10.9 | 49.7 ± 10.0 | 0.465 |
| DM (%) | 5.0 | 2.8 | <0.001 |
| Smoking history (%) | 57.8 | 7.9 | <0.001 |
| Alcohol history (%) | 6.9 | 0.7 | <0.001 |
| Regular exercise habits (%) | 46.2 | 46.1 | 0.876 |
| Systolic BP (mmHg) | 116.1 ± 11.5 | 110.0 ± 13.3 | <0.001 |
| Diastolic BP (mmHg) | 73.8 ± 8.2 | 67.9 ± 8.7 | <0.001 |
| Body height (cm) | 169.2 ± 6.3 | 157.2 ± 5.5 | <0.001 |
| Body weight (Kg) | 70.6 ± 10.6 | 57.3 ± 8.9 | <0.001 |
| Waist circumference (cm) | 86.1 ± 8.5 | 79.9 ± 9.1 | <0.001 |
| Hip circumference (cm) | 96.6 ± 6.2 | 94.6 ± 6.6 | <0.001 |
| Laboratory parameters | |||
| Fasting glucose (mg/dL) | 98.2 ± 22.2 | 92.8 ± 16.5 | <0.001 |
| Hemoglobin (g/dL) | 15.0 ± 1.1 | 13.0 ± 1.3 | <0.001 |
| Triglyceride (mg/dL) | 128.6 ± 98.9 | 98.1 ± 67.0 | <0.001 |
| Total cholesterol (mg/dL) | 191.8 ± 34.4 | 196.6 ± 35.7 | <0.001 |
| HDL-cholesterol (mg/dL) | 48.6 ± 11.1 | 58.4 ± 13.0 | <0.001 |
| LDL-cholesterol (mg/dL) | 122.7 ± 31.4 | 120.7 ± 31.7 | <0.001 |
| eGFR (mL/min/1.73 m2) | 100.9 ± 20.0 | 116.0 ± 25.6 | <0.001 |
| Uric acid (mg/dL) | 6.4 ± 1.3 | 4.8 ± 1.1 | <0.001 |
| Obesity-related indices | |||
| BMI (kg/m2) | 24.6 ± 3.2 | 23.2 ± 3.4 | <0.001 |
| WHR (%) | 89.0 ± 5.4 | 84.3 ± 6.6 | <0.001 |
| WHtR (%) | 50.9 ± 5.0 | 50.8 ± 6.0 | 0.335 |
| BRI | 6.9 ± 1.6 | 6.3 ± 1.8 | <0.001 |
| CI | 1.22 ± 0.06 | 1.22 ± 0.08 | <0.001 |
| BAI | 26.0 ± 3.0 | 30.1 ± 3.7 | <0.001 |
| AVI | 15.1 ± 3.0 | 13.1 ± 2.9 | <0.001 |
| LAP | 33.1 ± 33.7 | 26.1 ± 25.4 | <0.001 |
| VAI | 1.67 ± 1.75 | 1.55 ± 1.52 | <0.001 |
| Characteristics | Male (n = 6899) | Female (n = 14,567) | ||||
|---|---|---|---|---|---|---|
| Incident Hypertension (−) (n = 5530) | Incident Hypertension (+) (n = 1369) | p | Incident Hypertension (−) (n = 12,775) | Incident Hypertension (+) (n = 1792) | p | |
| Age (year) | 48.5 ± 10.9 | 54.0 ± 10.0 | <0.001 | 48.9 ± 9.9 | 55.5 ± 8.5 | <0.001 |
| DM (%) | 4.3 | 7.7 | <0.001 | 2.5 | 5.7 | <0.001 |
| Smoking history (%) | 56.9 | 61.7 | 0.001 | 8.2 | 5.7 | <0.001 |
| Alcohol history (%) | 6.5 | 8.9 | 0.001 | 0.7 | 0.6 | 0.615 |
| Regular exercise habits (%) | 44.8 | 52.0 | <0.001 | 45.1 | 53.3 | <0.001 |
| Systolic BP (mmHg) | 113.9 ± 10.9 | 124.8 ± 9.4 | <0.001 | 108.1 ± 12.4 | 124.0 ± 10.5 | <0.001 |
| Diastolic BP (mmHg) | 72.7 ± 8.0 | 78.5 ± 7.4 | <0.001 | 66.9 ± 8.3 | 74.9 ± 8.3 | <0.001 |
| Body height (cm) | 169.5 ± 6.2 | 167.9 ± 6.4 | <0.001 | 157.5 ± 5.6 | 155.7 ± 5.2 | <0.001 |
| Body weight (Kg) | 70.2 ± 10.5 | 72.0 ± 10.7 | <0.001 | 56.9 ± 8.7 | 59.8 ± 9.7 | <0.001 |
| Waist circumference (cm) | 85.5 ± 8.5 | 88.5 ± 8.2 | <0.001 | 79.3 ± 8.9 | 83.7 ± 9.4 | <0.001 |
| Hip circumference (cm) | 96.4 ± 6.2 | 97.5 ± 6.3 | <0.001 | 94.4 ± 6.5 | 96.1 ± 7.3 | <0.001 |
| Laboratory parameters | ||||||
| Fasting glucose (mg/dL) | 97.3 ± 20.6 | 101.7 ± 27.4 | <0.001 | 92.1 ± 15.4 | 97.8 ± 22.7 | <0.001 |
| Hemoglobin (g/dL) | 15.0 ± 1.1 | 15.1 ± 1.2 | 0.038 | 12.9 ± 1.3 | 13.2 ± 1.3 | <0.001 |
| Triglyceride (mg/dL) | 124.7 ± 97.0 | 144.3 ± 104.7 | <0.001 | 95.4 ± 62.4 | 117.9 ± 90.7 | <0.001 |
| Total cholesterol (mg/dL) | 191.1 ± 34.5 | 194.9 ± 33.8 | <0.001 | 195.7 ± 35.5 | 203.0 ± 36.5 | <0.001 |
| HDL-cholesterol (mg/dL) | 49.0 ± 11.3 | 47.2 ± 10.5 | <0.001 | 58.7 ± 13.0 | 55.8 ± 12.7 | <0.001 |
| LDL-cholesterol (mg/dL) | 122.2 ± 31.3 | 124.7 ± 31.9 | <0.001 | 119.9 ± 31.4 | 126.6 ± 33.1 | <0.001 |
| eGFR (mL/min/1.73 m2) | 101.8 ± 19.7 | 97.4 ± 21.1 | <0.001 | 116.8 ± 25.5 | 110.2 ± 25.6 | <0.001 |
| Uric acid (mg/dL) | 6.3 ± 1.3 | 6.6 ± 1.4 | <0.001 | 4.8 ± 1.0 | 5.2 ± 1.1 | <0.001 |
| Obesity-related indices | ||||||
| BMI (kg/m2) | 24.4 ± 3.1 | 25.5 ± 3.1 | <0.001 | 22.9 ± 3.3 | 24.6 ± 3.6 | <0.001 |
| WHR (%) | 88.6 ± 5.4 | 90.7 ± 5.0 | <0.001 | 84.0 ± 6.5 | 87.1 ± 6.5 | <0.001 |
| WHtR (%) | 50.5 ± 5.0 | 52.7 ± 4.8 | <0.001 | 50.4 ± 5.9 | 53.8 ± 6.1 | <0.001 |
| BRI | 6.8 ± 1.6 | 7.4 ± 1.6 | <0.001 | 6.2 ± 1.7 | 7.1 ± 1.9 | <0.001 |
| CI | 1.22 ± 0.06 | 1.24 ± 0.06 | <0.001 | 1.21 ± 0.08 | 1.24 ± 0.09 | <0.001 |
| BAI | 25.8 ± 2.9 | 26.8 ± 3.1 | <0.001 | 29.9 ± 3.6 | 31.5 ± 3.9 | <0.001 |
| AVI | 14.9 ± 2.9 | 15.9 ± 2.9 | <0.001 | 12.9 ± 2.9 | 14.3 ± 3.2 | <0.001 |
| LAP | 31.3 ± 32.3 | 40.4 ± 37.9 | <0.001 | 24.7 ± 23.3 | 35.8 ± 35.7 | <0.001 |
| VAI | 1.61 ± 1.72 | 1.93 ± 1.86 | <0.001 | 1.49 ± 1.40 | 1.97 ± 2.19 | <0.001 |
| Obesity-Related Indices | Male (n = 6899) | Male (n = 6899) | ||||
|---|---|---|---|---|---|---|
| Crude | Age-Adjusted | |||||
| OR | 95% Confidence Interval | p | OR | 95% Confidence Interval | p | |
| BMI (per 1 kg/m2) | 1.108 | 1.088–1.128 | <0.001 | 1.140 | 1.118–1.162 | <0.001 |
| WHR (per 0.01) | 1.077 | 1.065–1.090 | <0.001 | 1.060 | 1.048–1.072 | <0.001 |
| WHtR (per 0.01) | 1.092 | 1.079–1.105 | <0.001 | 1.083 | 1.070–1.097 | <0.001 |
| BRI (per 1) | 1.267 | 1.222–1.313 | <0.001 | 1.265 | 1.219–1.313 | <0.001 |
| CI (per 0.1) | 1.722 | 1.565–1.894 | <0.001 | 1.455 | 1.318–1.606 | <0.001 |
| BAI (per 1) | 1.127 | 1.105–1.150 | <0.001 | 1.113 | 1.091–1.136 | <0.001 |
| AVI (per 1) | 1.116 | 1.095–1.138 | <0.001 | 1.130 | 1.108–1.154 | <0.001 |
| LAP (per 1) | 1.007 | 1.005–1.009 | <0.001 | 1.008 | 1.007–1.010 | <0.001 |
| VAI (per 1) | 1.092 | 1.058–1.127 | <0.001 | 1.111 | 1.074–1.149 | <0.001 |
| Obesity-Related Indices | Female (n = 14,567) | Female (n = 14,567) | ||||
|---|---|---|---|---|---|---|
| Crude | Age-Adjusted | |||||
| OR | 95% Confidence Interval | p | OR | 95% Confidence Interval | p | |
| BMI (per 1 kg/m2) | 1.141 | 1.126–1.157 | <0.001 | 1.150 | 1.134–1.167 | <0.001 |
| WHR (per 0.01) | 1.072 | 1.064–1.080 | <0.001 | 1.044 | 1.036–1.052 | <0.001 |
| WHtR (per 0.01) | 1.091 | 1.082–1.099 | <0.001 | 1.071 | 1.062–1.080 | <0.001 |
| BRI (per 1) | 1.293 | 1.261–1.325 | <0.001 | 1.235 | 1.203–1.269 | <0.001 |
| CI (per 0.1) | 1.483 | 1.401–1.570 | <0.001 | 1.204 | 1.134–1.278 | <0.001 |
| BAI (per 1) | 1.119 | 1.105–1.134 | <0.001 | 1.104 | 1.089–1.119 | <0.001 |
| AVI (per 1) | 1.151 | 1.134–1.169 | <0.001 | 1.130 | 1.112–1.149 | <0.001 |
| LAP (per 1) | 1.014 | 1.012–1.015 | <0.001 | 1.011 | 1.009–1.012 | <0.001 |
| VAI (per 1) | 1.168 | 1.134–1.203 | <0.001 | 1.123 | 1.091–1.157 | <0.001 |
| Obesity-Related Indices | Male (n = 6899) | Female (n = 14,567) | |||||
|---|---|---|---|---|---|---|---|
| Multivariable | Multivariable | ||||||
| OR | 95% Confidence Interval | p | OR | 95% Confidence Interval | p | Interaction p | |
| BMI (per 1 kg/m2) a | 1.107 | 1.083–1.131 | <0.001 | 1.119 | 1.101–1.137 | <0.001 | 0.010 |
| WHR (per 0.01) a | 1.038 | 1.024–1.051 | <0.001 | 1.027 | 1.018–1.035 | <0.001 | 0.477 |
| WHtR (per 0.01) a | 1.062 | 1.048–1.077 | <0.001 | 1.053 | 1.043–1.062 | <0.001 | 0.890 |
| BRI (per 1) a | 1.190 | 1.141–1.241 | <0.001 | 1.166 | 1.131–1.201 | <0.001 | 0.369 |
| CI (per 0.1) a | 1.237 | 1.112–1.375 | <0.001 | 1.095 | 1.028–1.166 | 0.005 | 0.008 |
| BAI (per 1) a | 1.084 | 1.061–1.107 | <0.001 | 1.078 | 1.062–1.093 | <0.001 | 0.574 |
| AVI (per 1) a | 1.092 | 1.068–1.117 | <0.001 | 1.090 | 1.071–1.110 | <0.001 | 0.013 |
| LAP (per 1) b | 1.008 | 1.005–1.111 | <0.001 | 1.010 | 1.007–1.013 | <0.001 | <0.001 |
| VAI (per 1) c | 1.084 | 1.041–1.128 | <0.001 | 1.095 | 1.062–1.128 | <0.001 | 0.002 |
| Obesity-Related Indices | AUC (95% Confidence Interval) | Cutoff Value | Sensitivity (%) | Specificity (%) | Youden Index |
|---|---|---|---|---|---|
| BMI (kg/m2) | 0.597 (0.581–0.614) * | 24.700 | 56.7 | 56.7 | 0.134 |
| WHR | 0.618 (0.602–0.634) * | 0.897 | 58.7 | 58.7 | 0.174 |
| WHtR | 0.632 (0.616–0.648) * | 0.514 | 59.3 | 59.1 | 0.184 |
| BRI | 0.621 (0.605–0.637) * | 6.952 | 58.7 | 58.8 | 0.175 |
| CI | 0.600 (0.584–0.617) * | 1.232 | 57.0 | 57.0 | 0.140 |
| BAI | 0.605 (0.588–0.621) * | 26.166 | 57.9 | 57.8 | 0.157 |
| AVI | 0.604 (0.588–0.620) * | 15.138 | 58.1 | 58.1 | 0.162 |
| LAP | 0.610 (0.594–0.626) * | 26.802 | 58.1 | 58.1 | 0.162 |
| VAI | 0.582 (0.566–0.599) * | 1.287 | 55.6 | 55.6 | 0.112 |
| Obesity-Related Indices | AUC (95% Confidence Interval) | Cutoff Value | Sensitivity (%) | Specificity (%) | Youden Index |
|---|---|---|---|---|---|
| BMI (kg/m2) | 0.645 (0.632–0.658) * | 23.318 | 60.7 | 60.7 | 0.214 |
| WHR | 0.637 (0.624–0.651) * | 0.852 | 60.4 | 60.3 | 0.207 |
| WHtR | 0.662 (0.649–0.674) * | 0.516 | 61.5 | 61.5 | 0.230 |
| BRI | 0.652 (0.639–0.666) * | 6.409 | 60.9 | 60.8 | 0.217 |
| CI | 0.599 (0.585–0.613) * | 1.222 | 57.2 | 57.2 | 0.144 |
| BAI | 0.623 (0.610–0.637) * | 30.266 | 58.4 | 58.4 | 0.168 |
| AVI | 0.638 (0.624–0.651) * | 13.151 | 59.6 | 59.6 | 0.192 |
| LAP | 0.657 (0.644–0.670) * | 23.080 | 61.7 | 61.7 | 0.234 |
| VAI | 0.624 (0.610–0.637) * | 1.304 | 59.4 | 59.4 | 0.188 |
Publisher’s Note: MDPI stays neutral with regard to jurisdictional claims in published maps and institutional affiliations. |
© 2022 by the authors. Licensee MDPI, Basel, Switzerland. This article is an open access article distributed under the terms and conditions of the Creative Commons Attribution (CC BY) license (https://creativecommons.org/licenses/by/4.0/).
Share and Cite
Lee, W.-C.; Wu, P.-Y.; Huang, J.-C.; Tsai, Y.-C.; Chiu, Y.-W.; Chen, S.-C.; Chang, J.-M.; Chen, H.-C. Sex Difference in the Associations among Obesity-Related Indices with Incident Hypertension in a Large Taiwanese Population Follow-Up Study. J. Pers. Med. 2022, 12, 972. https://doi.org/10.3390/jpm12060972
Lee W-C, Wu P-Y, Huang J-C, Tsai Y-C, Chiu Y-W, Chen S-C, Chang J-M, Chen H-C. Sex Difference in the Associations among Obesity-Related Indices with Incident Hypertension in a Large Taiwanese Population Follow-Up Study. Journal of Personalized Medicine. 2022; 12(6):972. https://doi.org/10.3390/jpm12060972
Chicago/Turabian StyleLee, Wen-Chi, Pei-Yu Wu, Jiun-Chi Huang, Yi-Chun Tsai, Yi-Wen Chiu, Szu-Chia Chen, Jer-Ming Chang, and Hung-Chun Chen. 2022. "Sex Difference in the Associations among Obesity-Related Indices with Incident Hypertension in a Large Taiwanese Population Follow-Up Study" Journal of Personalized Medicine 12, no. 6: 972. https://doi.org/10.3390/jpm12060972