
Validation of Automatic Cochlear Measurements Using OTOPLAN® Software

Abstract
:1. Introduction
- -
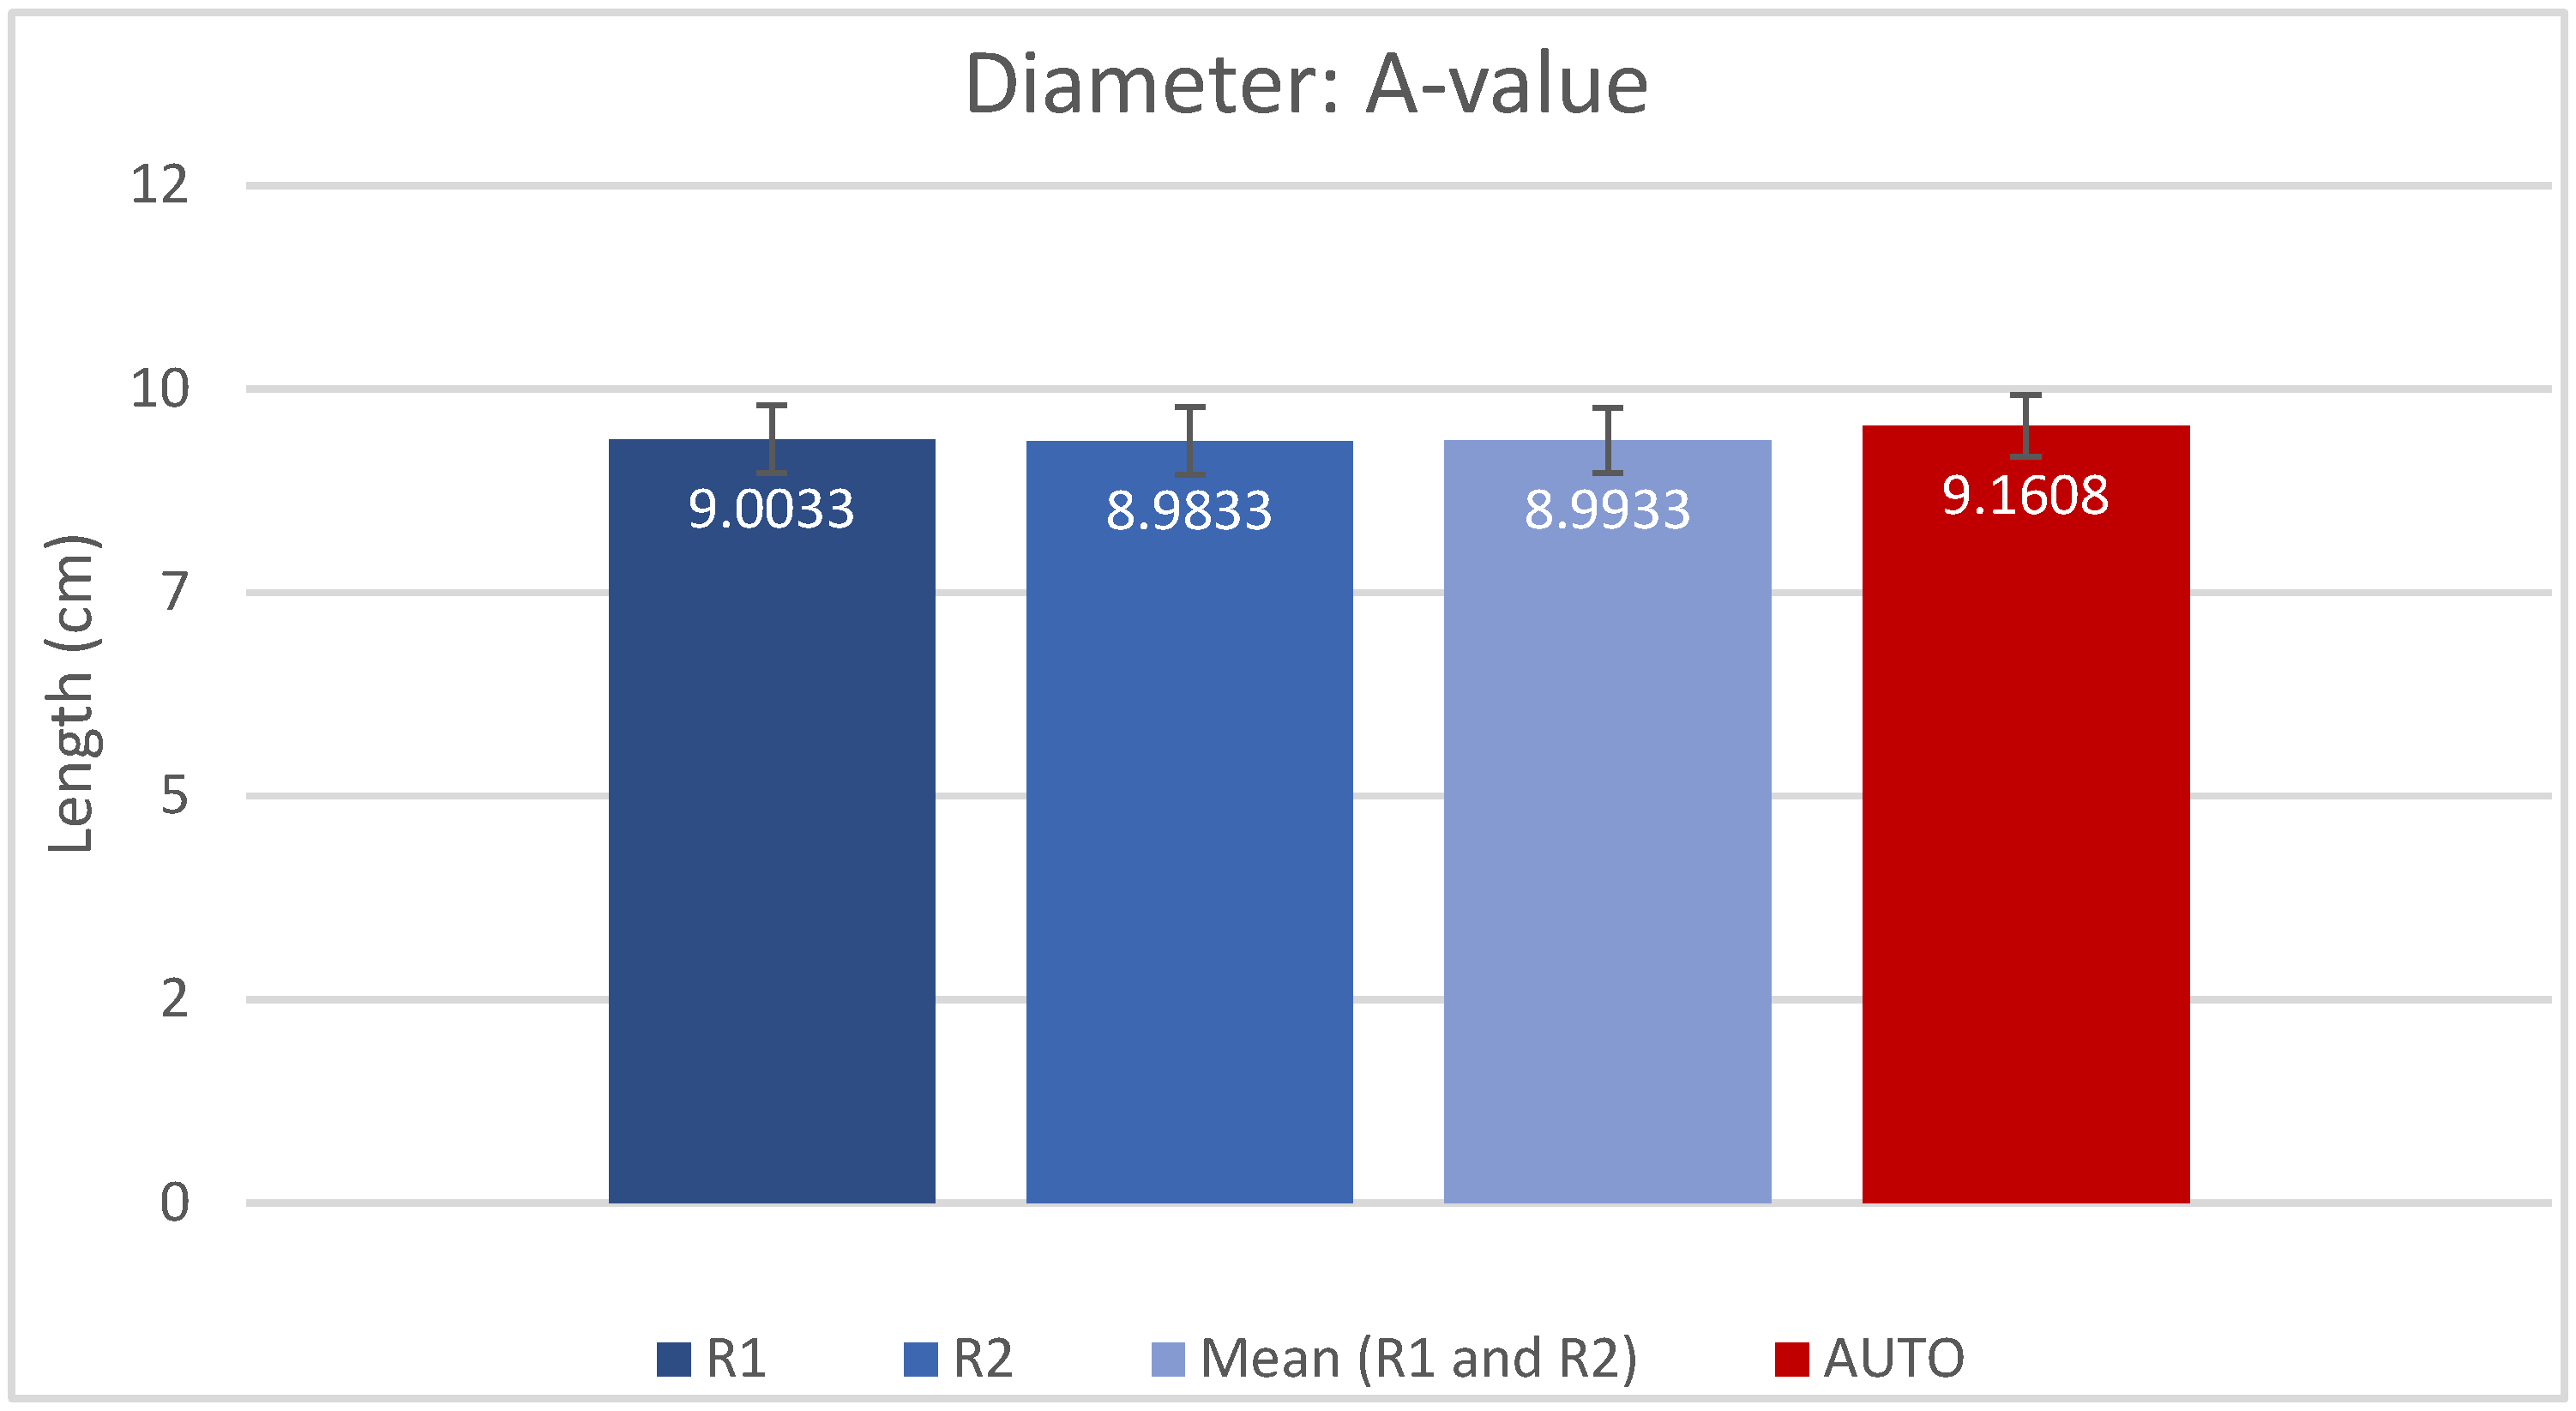
- Diameter (A-value) as the distance between the center of the round window and the furthest point on the opposite side of the lateral wall;
- -
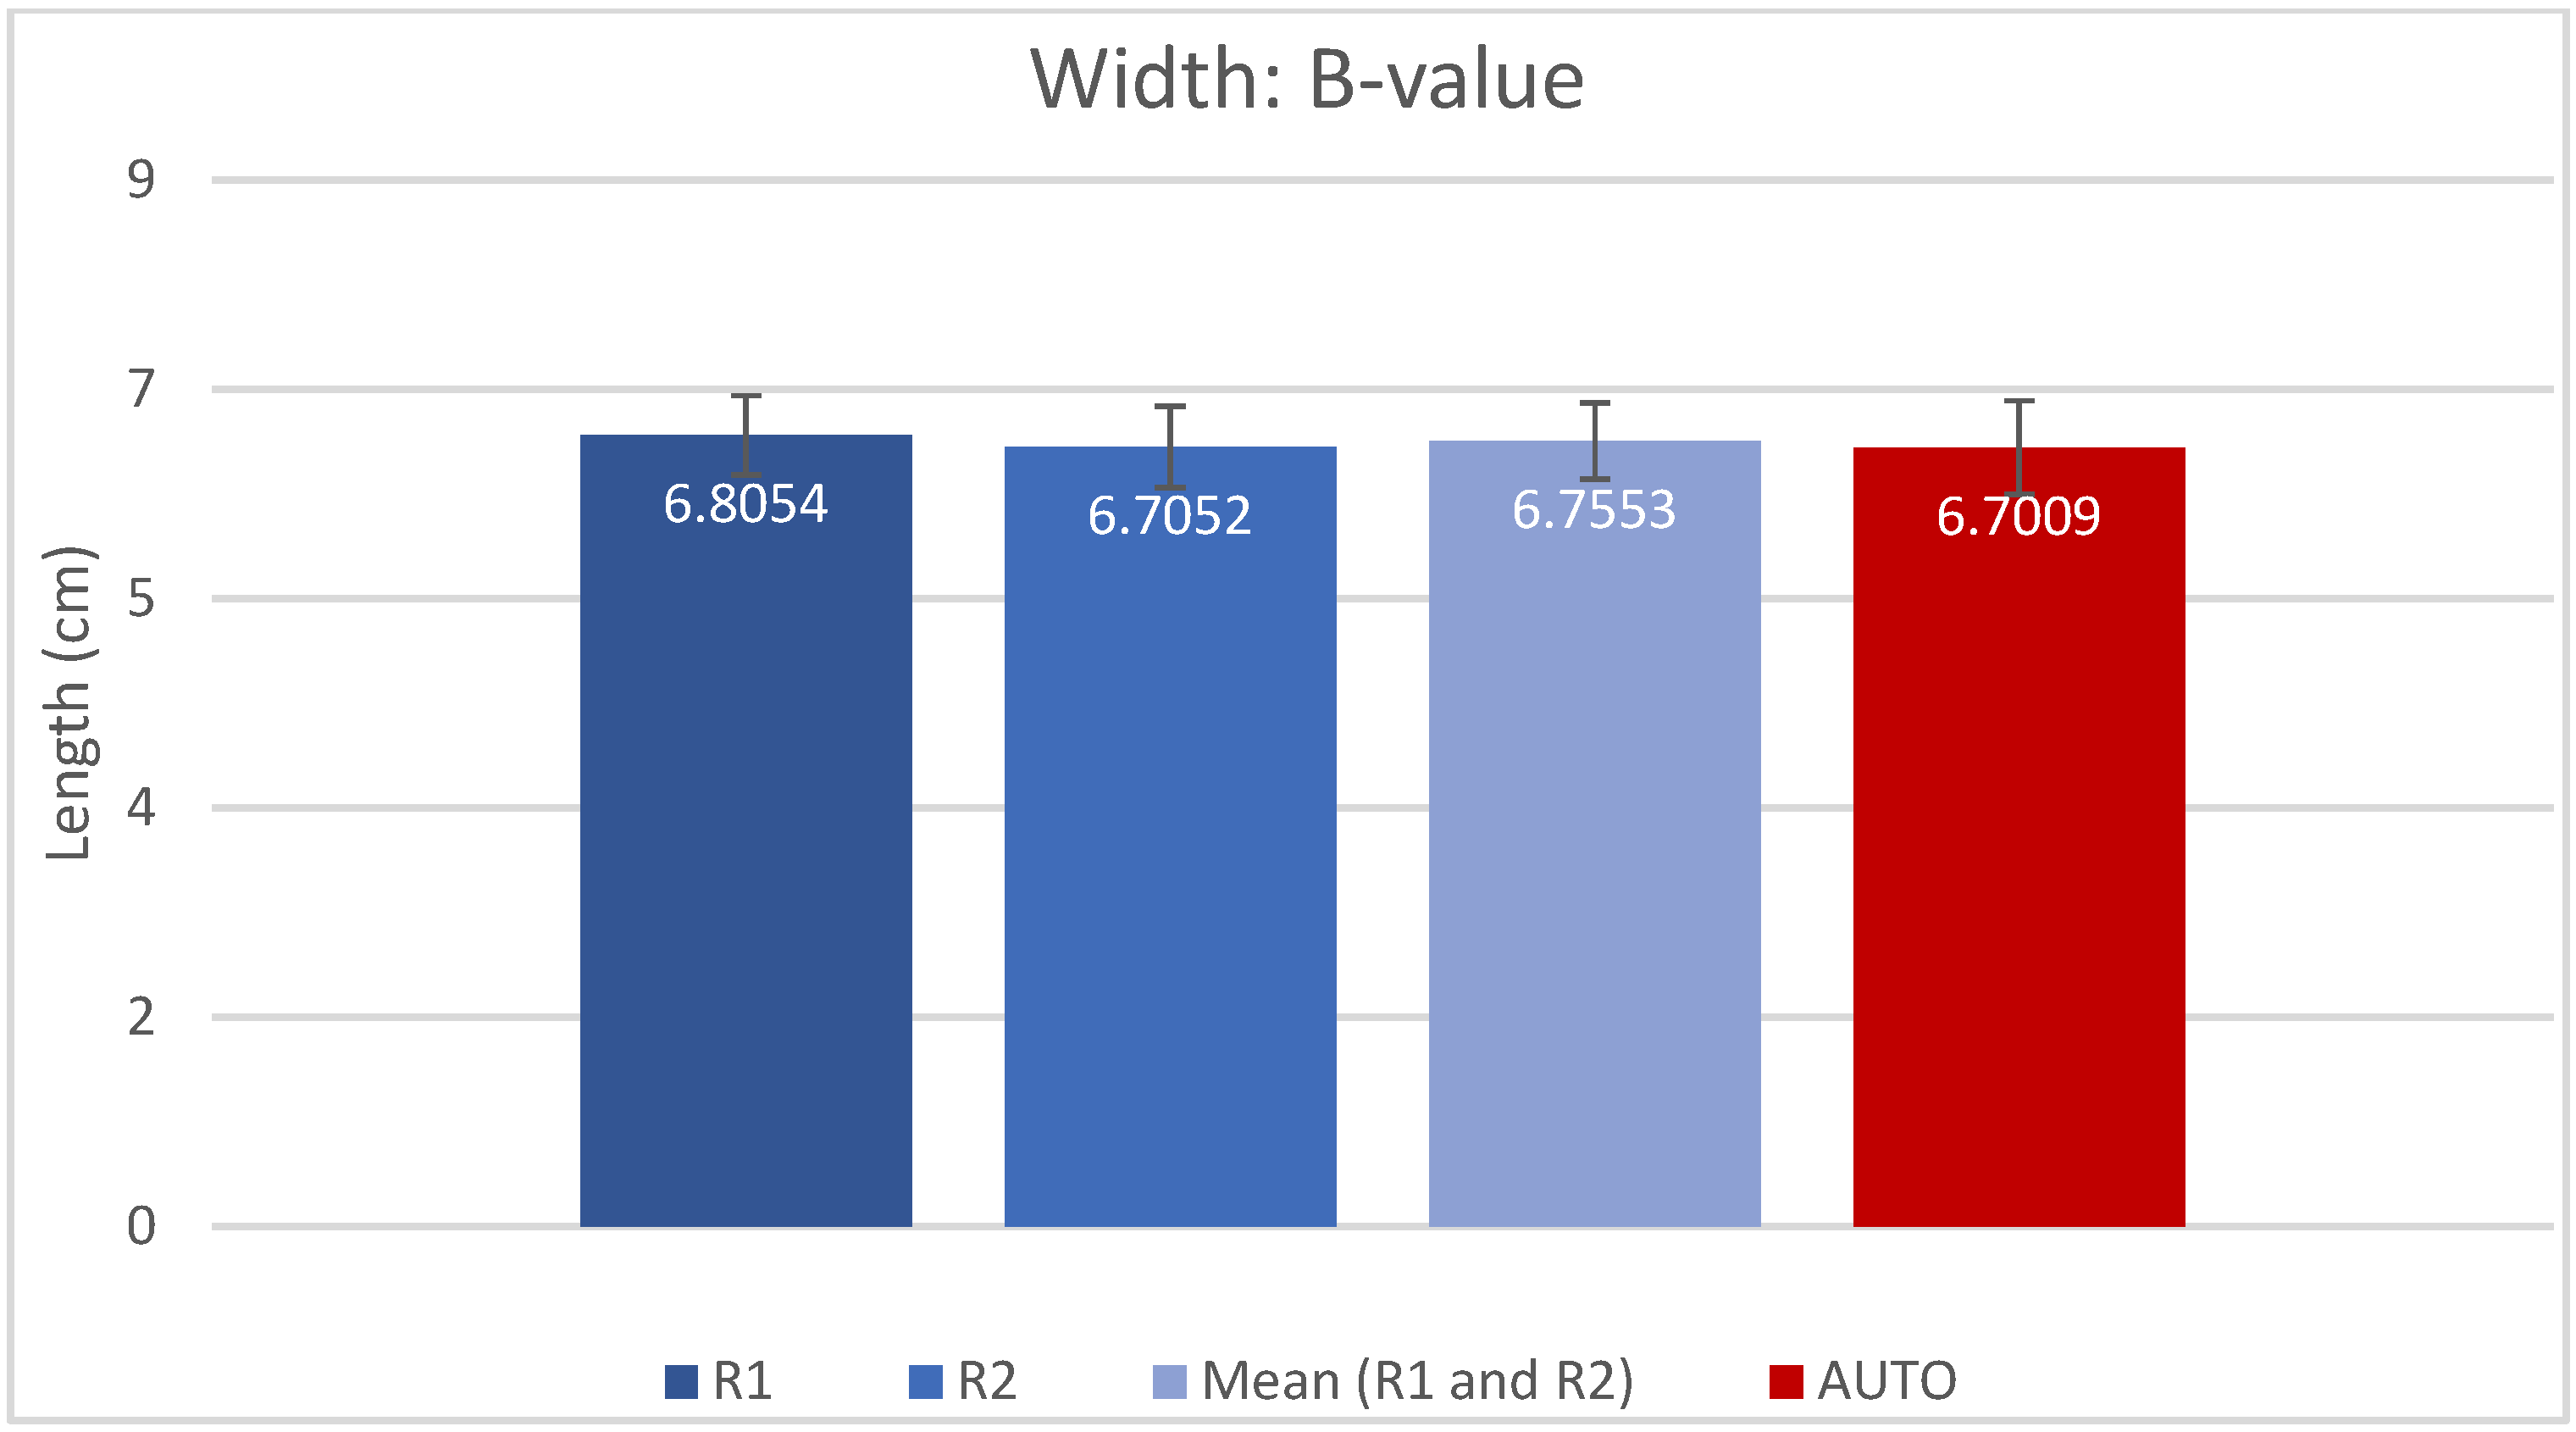
- Width (B-value) as the distance between two furthest points at the opposite sides of the basal turn lateral wall, perpendicular to the A-value line;
- -
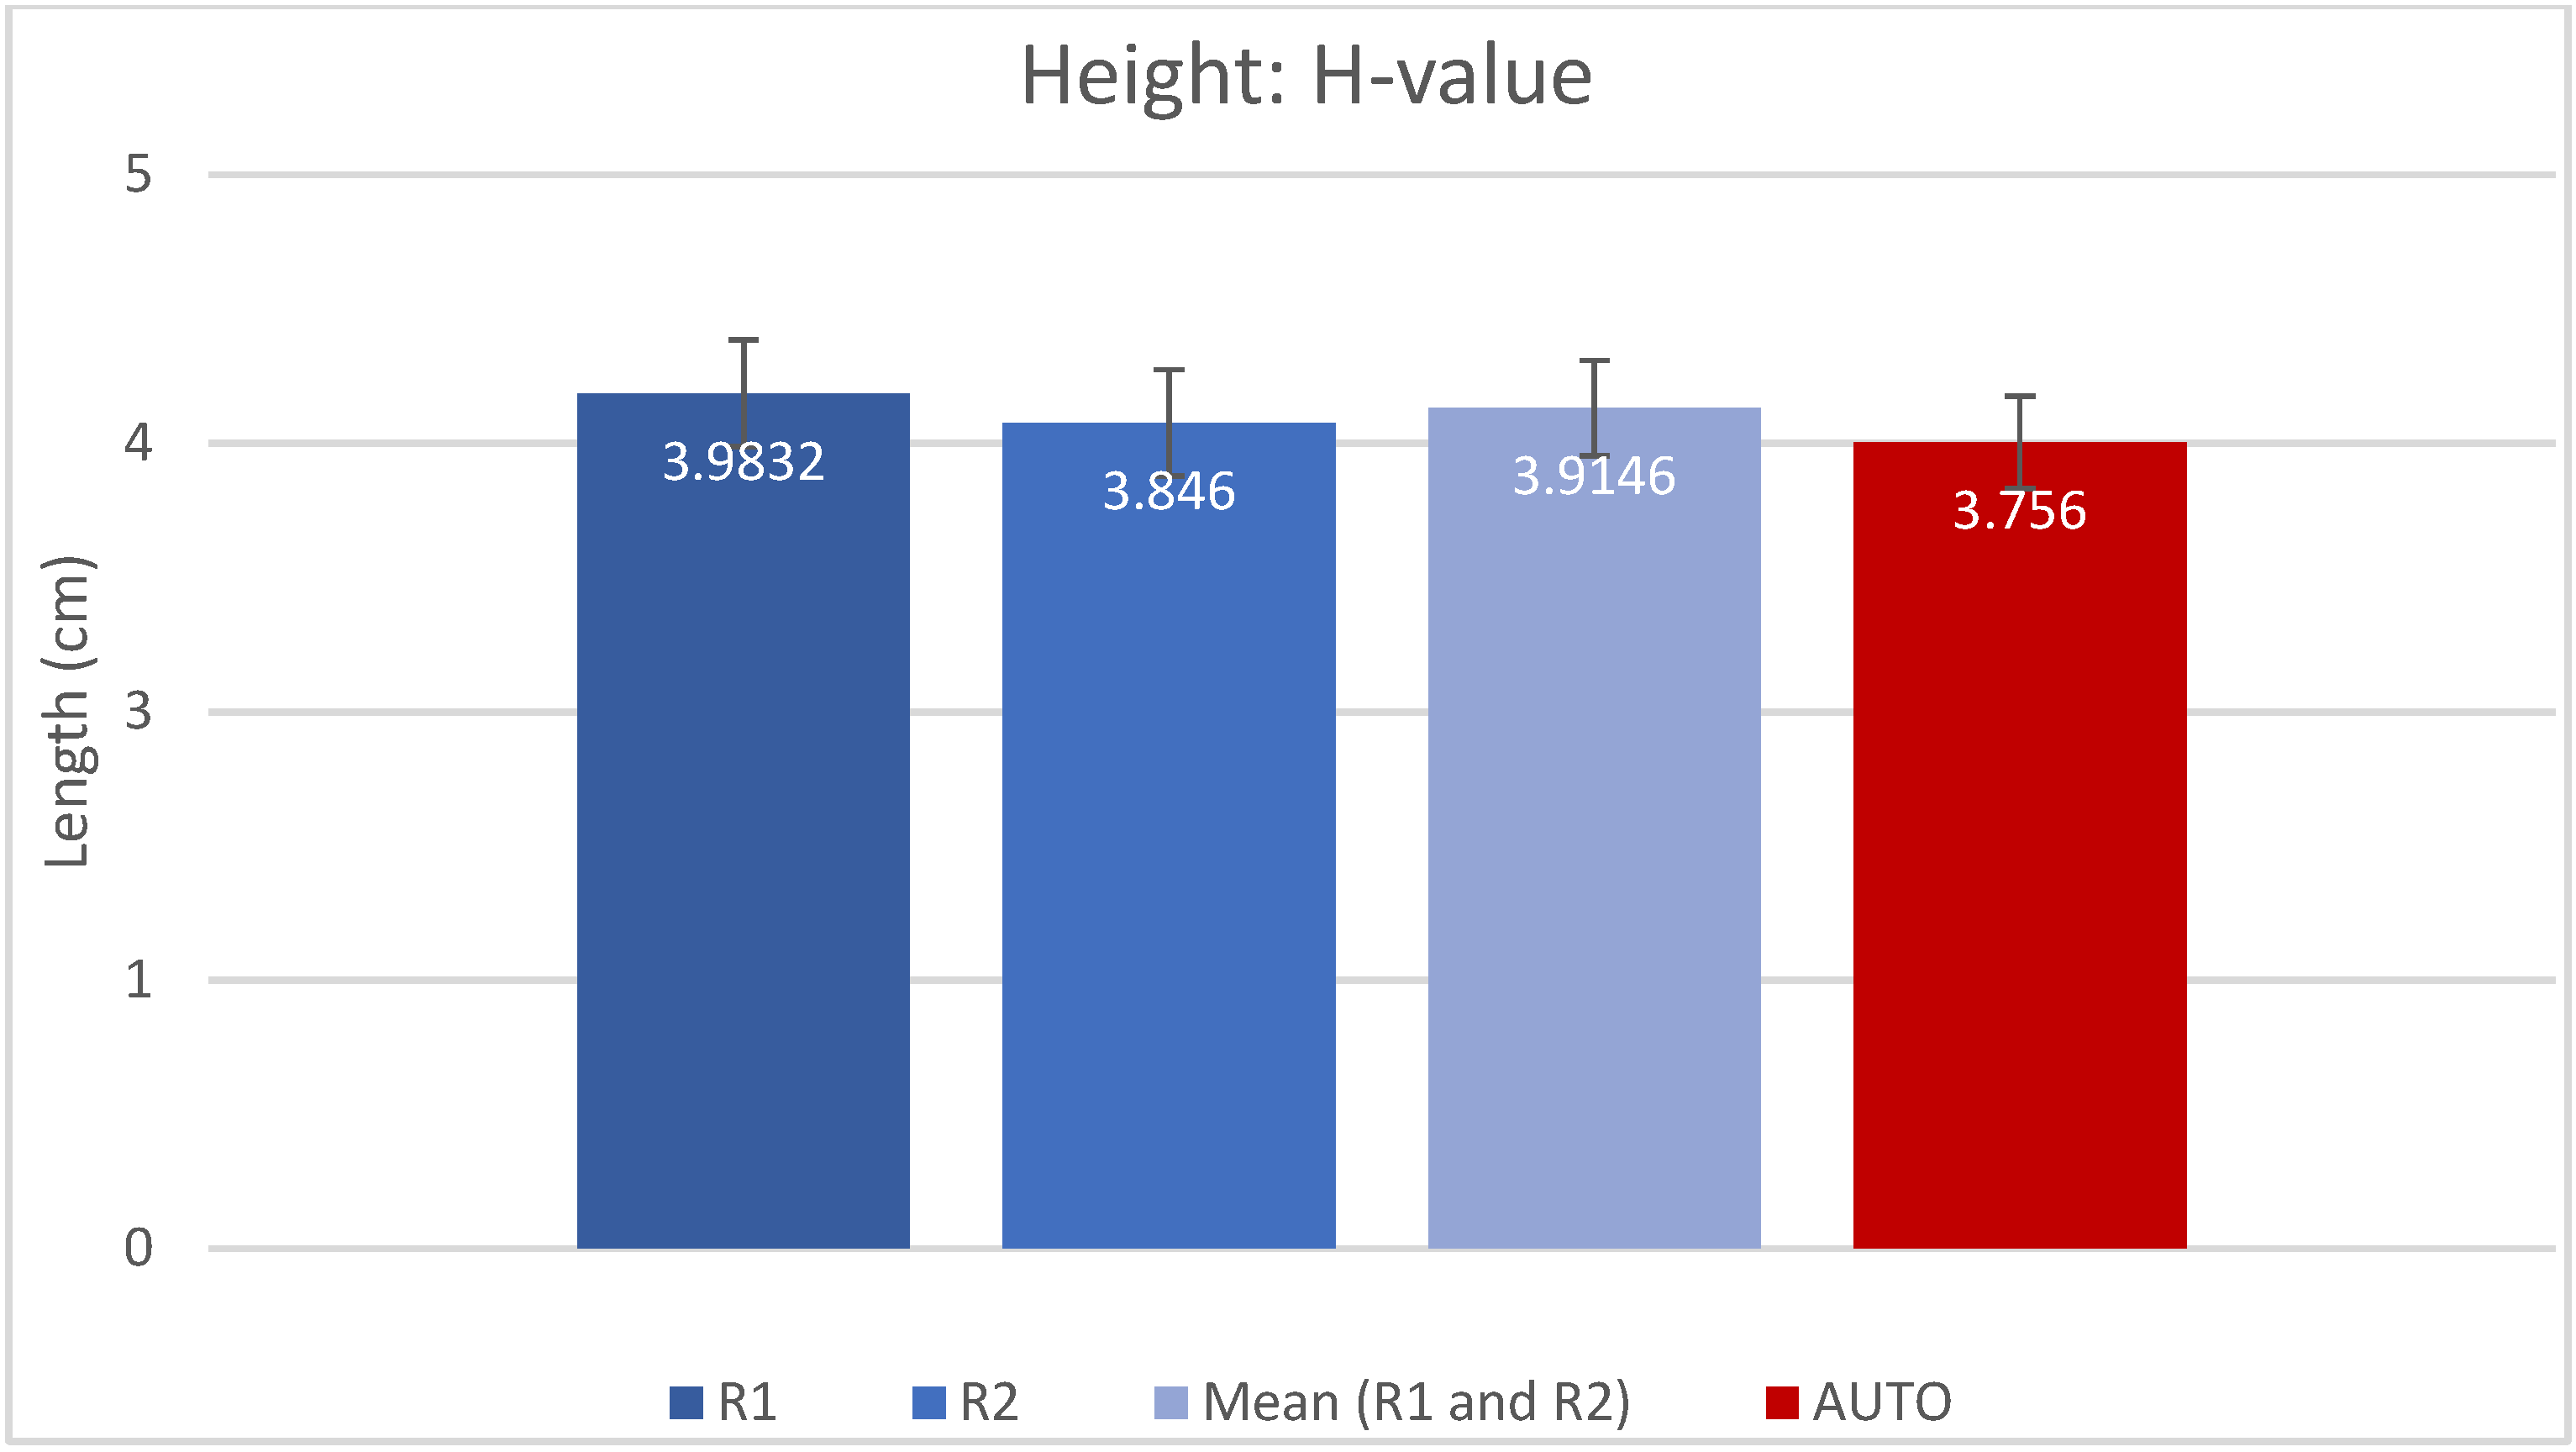
- Height (H-value) as the distance between the lowest part of cochlear basal turn and the tip of the apex, perpendicular to the A-value and B-value lines.
2. Materials and Methods
2.1. Subjects
2.2. Imaging
2.3. The Workflow
2.3.1. Manual Method
- Manually select the ear side;
- Manually rotate the imaging planes to obtain the cochlear view;
- Manually measure A, B and H values;
- The resulting CDLOC is automatically calculated.
2.3.2. AUTO Method
- The automatic method was applied once for each sample, with the following steps:The software automatically:
- Detects the ear side;
- Reconstructs the entire inner ear, including cochlea, semi-circular canals, internal auditory canal, round window membrane and bony overhang;
- Sets the cochlear view;
- Measures A, B and H values and calculates the CDLOC.
2.4. Statistical Analysis
3. Results
4. Discussion
5. Conclusions
Author Contributions
Funding
Institutional Review Board Statement
Informed Consent Statement
Data Availability Statement
Acknowledgments
Conflicts of Interest
References
- Hardy, M. The length of the organ of Corti in man. Am. J. Anat. 1938, 62, 291–311. [Google Scholar] [CrossRef]
- Úlehlová, L.; Voldřich, L.; Janisch, R. Correlative study of sensory cell density and cochlear length in humans. Hear. Res. 1987, 28, 149–151. [Google Scholar] [CrossRef] [PubMed]
- Takagi, A.; Sando, I. Computer-aided three-dimensional reconstruction: A method of measuring temporal bone structures including the length of the cochlea. Ann. Otol. Rhinol. Laryngol. 1989, 98, 515–522. [Google Scholar] [CrossRef] [PubMed]
- Ketten, D.R.; Skinner, M.W.; Wang, G.; Vannier, M.W.; Gates, G.A.; Neely, J.G. In vivo measures of cochlear length and insertion depth of nucleus cochlear implant electrode arrays. Ann. Otol. Rhinol. Laryngol. Suppl. 1998, 175, 1–16. [Google Scholar]
- Li, H.; Helpard, L.; Ekeroot, J.; Rohani, S.A.; Zhu, N.; Rask-Andersen, H.; Ladak, H.M.; Agrawal, S. Three-dimensional tonotopic mapping of the human cochlea based on synchrotron radiation phase-contrast imaging. Sci. Rep. 2021, 11, 4437. [Google Scholar] [CrossRef]
- Verbist, B.M.; Skinner, M.W.; Cohen, L.T.; Leake, P.A.; James, C.; Boëx, C.; Holden, T.A.; Finley, C.C.; Roland, P.S.; Roland, J.T., Jr.; et al. Consensus panel on a cochlear coordinate system applicable in histological, physiological and radiological studies of the human cochlea. Otol. Neurotol. 2010, 31, 722. [Google Scholar] [CrossRef]
- Greenwood, D.D. Critical bandwidth and the frequency coordinates of the basilar membrane. J. Acoust. Soc. Am. 1961, 33, 1344–1356. [Google Scholar] [CrossRef]
- Greenwood, D.D. A cochlear frequency-position function for several species—29 years later. J. Acoust. Soc. Am. 1990, 87, 2592–2605. [Google Scholar] [CrossRef]
- Greenwood, D.D. Critical bandwidth and consonance in relation to cochlear frequency-position coordinates. Hear. Res. 1991, 54, 164–208. [Google Scholar] [CrossRef]
- Boëx, C.; Baud, L.; Cosendai, G.; Sigrist, A.; Kós, M.-I.; Pelizzone, M. Acoustic to Electric Pitch Comparisons in Cochlear Implant Subjects with Residual Hearing. J. Assoc. Res. Otolaryngol. 2006, 7, 110–124. [Google Scholar] [CrossRef]
- Marsh, M.A.; Xu, J.; Blamey, P.J.; Whitford, L.A.; Xu, S.A.; Silverman, J.M.; Clark, G.M. Radiologic evaluation of multichannel intracochlear implant insertion depth. Am. J. Otol. 1993, 14, 386–391. [Google Scholar] [PubMed]
- Cohen, L.T.; Xu, J.; Xu, S.A.; Clark, G.M. Improved and simplified methods for specifying positions of the electrode bands of a cochlear implant array. Am. J. Otol. 1996, 17, 859–865. [Google Scholar] [PubMed]
- Xu, J.; Shepherd, R.K.; Millard, R.E.; Clark, G.M. Chronic electrical stimulation of the auditory nerve at high stimulus rates: A physiological and histopathological study. Hear. Res. 1997, 105, 1–29. [Google Scholar] [CrossRef] [PubMed]
- Kós, M.-I.; Boëx, C.; Sigrist, A.; Guyot, J.-P.; Pelizzone, M. Measurements of electrode position inside the cochlea for different cochlear implant systems. Acta Oto-Laryngol. 2005, 125, 474–480. [Google Scholar] [CrossRef]
- Dhanasingh, A.E.; Rajan, G.; Van De Heyning, P. Presence of the spiral ganglion cell bodies beyond the basal turn of the human cochlea. Cochlear Implant. Int. 2019, 21, 145–152. [Google Scholar] [CrossRef]
- Buchman, C.A.; Dillon, M.T.; King, E.R.; Adunka, M.C.; Adunka, O.F.; Pillsbury, H.C. Influence of cochlear implant insertion depth on performance: A prospective randomized trial. Otol. Neurotol. 2014, 35, 1773–1779. [Google Scholar] [CrossRef]
- O’connell, B.P.; Cakir, A.; Hunter, J.; Francis, D.O.; Noble, J.H.; Labadie, R.F.; Zuniga, M.G.; Dawant, B.M.; Rivas, A.; Wanna, G.B. Electrode Location and Angular Insertion Depth Are Predictors of Audiologic Outcomes in Cochlear Implantation. Otol. Neurotol. 2016, 37, 1016–1023. [Google Scholar] [CrossRef]
- O’Connell, B.P.; Hunter, J.B.; Haynes, D.S.; Holder, J.T.; Dedmon, M.M.; Noble, J.H.; Dawant, B.M.; Wanna, G.B. Insertion depth impacts speech perception and hearing preservation for lateral wall electrodes. Laryngoscope 2017, 127, 2352–2357. [Google Scholar] [CrossRef]
- Canfarotta, M.W.; Dillon, M.T.; Brown, K.D.; Pillsbury, H.C.; Dedmon, M.M.; O’Connell, B.P. Insertion Depth and Cochlear Implant Speech Recognition Outcomes: A Comparative Study of 28- and 31.5-mm Lateral Wall Arrays. Otol. Neurotol. 2021, 43, 183–189. [Google Scholar] [CrossRef]
- Hochmair, I.; Arnold, W.; Nopp, P.; Jolly, C.; Roland, P.; Müller, J. Deep Electrode Insertion in Cochlear Implants: Apical Morphology, Electrodes and Speech Perception Results. Acta Oto-Laryngol. 2003, 123, 612–617. [Google Scholar] [CrossRef]
- Büchner, A.; Illg, A.; Majdani, O.; Lenarz, T. Investigation of the effect of cochlear implant electrode length on speech comprehension in quiet and noise compared with the results with users of electro-acoustic-stimulation, a retrospective analysis. PLoS ONE 2017, 12, e0174900. [Google Scholar] [CrossRef] [PubMed]
- Canfarotta, M.W.; O’Connell, B.P.; Buss, E.; Pillsbury, H.C.; Brown, K.D.; Dillon, M.T. Influence of Age at Cochlear Implantation and Frequency-to-Place Mismatch on Early Speech Recognition in Adults. Otolaryngol. Neck Surg. 2020, 162, 926–932. [Google Scholar] [CrossRef] [PubMed]
- Mertens, G.; Van de Heyning, P.; Vanderveken, O.; Topsakal, V.; Van Rompaey, V. The smaller the frequency–to–place mismatch the better the hearing outcomes in cochlear implant recipients? Eur. Arch. Oto-Rhino-Laryngol. 2022, 279, 1875–1883. [Google Scholar] [CrossRef] [PubMed]
- Xu, J.; Xu, S.A.; Cohen, L.T.; Clark, G.M. Cochlear View: Postoperative Radiography for Cochlear Implantation. Otol Neurotol. 2000, 21, 49–56. [Google Scholar]
- Alexiades, G.; Dhanasingh, A.; Jolly, C. Method to Estimate the Complete and Two-Turn Cochlear Duct Length. Otol. Neurotol. 2015, 36, 904–907. [Google Scholar] [CrossRef]
- Schurzig, D.; Timm, M.E.; Batsoulis, C.; Salcher, R.; Sieber, D.; Jolly, C.; Lenarz, T.; Zoka-Assadi, M. A Novel Method for Clinical Cochlear Duct Length Estimation toward Patient-Specific Cochlear Implant Selection. OTO Open 2018, 2, 2473974X18800238. [Google Scholar] [CrossRef]
- Escudé, B.; James, C.; Deguine, O.; Cochard, N.; Eter, E.; Fraysse, B. The Size of the Cochlea and Predictions of Insertion Depth Angles for Cochlear Implant Electrodes. Audiol. Neurotol. 2006, 11, 27–33. [Google Scholar] [CrossRef]
- Müller-Graff, F.T.; Ilgen, L.; Schendzielorz, P.; Voelker, J.; Taeger, J.; Kurz, A.; Hagen, R.; Neun, T.; Rak, K. Implementation of secondary reconstructions of flat-panel volume computed tomography (fpVCT) and otological planning software for anatomically based cochlear implantation. Eur. Arch. Oto-Rhino-Laryngol. 2021, 279, 2309–2319. [Google Scholar] [CrossRef]
- Almuhawas, F.A.; Dhanasingh, A.E.; Mitrovic, D.; Abdelsamad, Y.; Alzhrani, F.; Hagr, A.; Al Sanosi, A. Age as a Factor of Growth in Mastoid Thickness and Skull Width. Otol. Neurotol. 2020, 41, 709–714. [Google Scholar] [CrossRef]
- Grueninger, I.; Lippl, L.; Canis, M.; Simon, F.; Spiro, J.E.; Spiegel, J.L.; Hempel, J.M.; Müller, J.; Volgger, V. Anatomical Variations of the Epitympanum and the Usable Space for Middle Ear Implants Analyzed with CT-assisted Imaging Using a Tablet-based Software. Otol. Neurotol. 2022, 43, e454–e460. [Google Scholar] [CrossRef]
- Chen, Y.; Chen, J.; Tan, H.; Jiang, M.; Wu, Y.; Zhang, Z.; Li, Y.; Jia, H.; Wu, H. Cochlear Duct Length Calculation: Comparison between Using Otoplan and Curved Multiplanar Reconstruction in Nonmalformed Cochlea. Otol. Neurotol. 2021, 42, e875–e880. [Google Scholar] [CrossRef] [PubMed]
- Lovato, A.; Marioni, G.; Gamberini, L.; Bonora, C.; Genovese, E.; de Filippis, C. OTOPLAN in Cochlear Implantation for Far-advanced Otosclerosis. Otol. Neurotol. 2020, 41, e1024–e1028. [Google Scholar] [CrossRef] [PubMed]
- Lovato, A.; De Filippis, C. Utility of OTOPLAN Reconstructed Images for Surgical Planning of Cochlear Implantation in a Case of Post-meningitis Ossification. Otol. Neurotol. 2019, 40, e60–e61. [Google Scholar] [CrossRef] [PubMed]
- Canfarotta, M.W.; Dillon, M.T.; Buss, E.; Pillsbury, H.C.; Brown, K.D.; O’Connell, B.P. Validating a New Tablet-based Tool in the Determination of Cochlear Implant Angular Insertion Depth. Otol. Neurotol. 2019, 40, 1006–1010. [Google Scholar] [CrossRef] [PubMed]
- Mertens, G.; Van Rompaey, V.; Van de Heyning, P.; Gorris, E.; Topsakal, V. Prediction of the Cochlear Implant Electrode Insertion Depth: Clinical Applicability of two Analytical Cochlear Models. Sci. Rep. 2020, 10, 3340. [Google Scholar] [CrossRef]
- Canfarotta, M.W.; Dillon, M.T.; Buss, E.; Pillsbury, H.C.; Brown, K.D.; O’Connell, B.P. Frequency-to-Place Mismatch: Characterizing Variability and the Influence on Speech Perception Outcomes in Cochlear Implant Recipients. Ear Hear. 2020, 41, 1349–1361. [Google Scholar] [CrossRef]
- Koo, T.K.; Li, M.Y. A Guideline of Selecting and Reporting Intraclass Correlation Coefficients for Reliability Research. J. Chiropr. Med. 2016, 15, 155–163. [Google Scholar] [CrossRef]
- Rivas, A.; Cakir, A.; Hunter, J.; Labadie, R.F.; Zuniga, M.G.; Wanna, G.B.; Dawant, B.M.; Noble, J.H. Automatic Cochlear Duct Length Estimation for Selection of Cochlear Implant Electrode Arrays. Otol. Neurotol. 2017, 38, 339–346. [Google Scholar] [CrossRef]
- Cooperman, S.P.; Aaron, K.A.; Fouad, A.; Tran, E.; Blevins, N.H.; Fitzgerald, M.B. Assessment of Inter- and Intra-Rater Reliability of Tablet-Based Software to Measure Cochlear Duct Length. Otol. Neurotol. 2021, 42, 558–565. [Google Scholar] [CrossRef]
- Breitsprecher, T.; Dhanasingh, A.; Schulze, M.; Kipp, M.; Abu Dakah, R.; Oberhoffner, T.; Dau, M.; Frerich, B.; Weber, M.-A.; Langner, S.; et al. CT imaging-based approaches to cochlear duct length estimation—A human temporal bone study. Eur. Radiol. 2021, 32, 1014–1023. [Google Scholar] [CrossRef]
- Khurayzi, T.; Almuhawas, F.; Alsanosi, A.; Abdelsamad, Y.; Doyle, Ú.; Dhanasingh, A. A novel cochlear measurement that predicts inner-ear malformation. Sci. Rep. 2021, 11, 7339. [Google Scholar] [CrossRef] [PubMed]
- Nash, R.; Otero, S.; Lavy, J. Use of MRI to determine cochlear duct length in patients undergoing cochlear implantation. Cochlear Implant. Int. 2018, 20, 57–61. [Google Scholar] [CrossRef] [PubMed]
- Weber, L.; Kwok, P.; Picou, E.M.; Wendl, C.; Bohr, C.; Marcrum, S.C. Measuring the cochlea using a tablet-based software package: Influence of imaging modality and rater background. HNO 2022, 70, 769–777. [Google Scholar] [CrossRef] [PubMed]
- Thomas, J.P.; Klein, H.; Haubitz, I.; Dazert, S.; Völter, C. Intra- and Interrater Reliability of CT-versus MRI-Based Cochlear Duct Length Measurement in Pediatric Cochlear Implant Candidates and Its Impact on Personalized Electrode Array Selection. J. Pers. Med. 2023, 13, 633. [Google Scholar] [CrossRef]
- George-Jones, N.A.; Tolisano, A.M.; Kutz, J.W., Jr.; Isaacson, B.; Hunter, J.B. Comparing cochlear duct lengths between CT and MR images using an otological surgical planning software. Otol. Neurotol. 2020, 41, e1118–e1121. [Google Scholar] [CrossRef]
- Pearce, M.S.; Salotti, J.A.; Little, M.P.; McHugh, K.; Lee, C.; Kim, K.P.; Howe, N.L.; Ronckers, C.M.; Rajaraman, P.; Craft, A.W.; et al. Radiation exposure from CT scans in childhood and subsequent risk of leukaemia and brain tumours: A retrospective cohort study. Lancet 2012, 380, 499–505. [Google Scholar] [CrossRef]


| A-Value | B-Value | H-Value | CDLOC | |
|---|---|---|---|---|
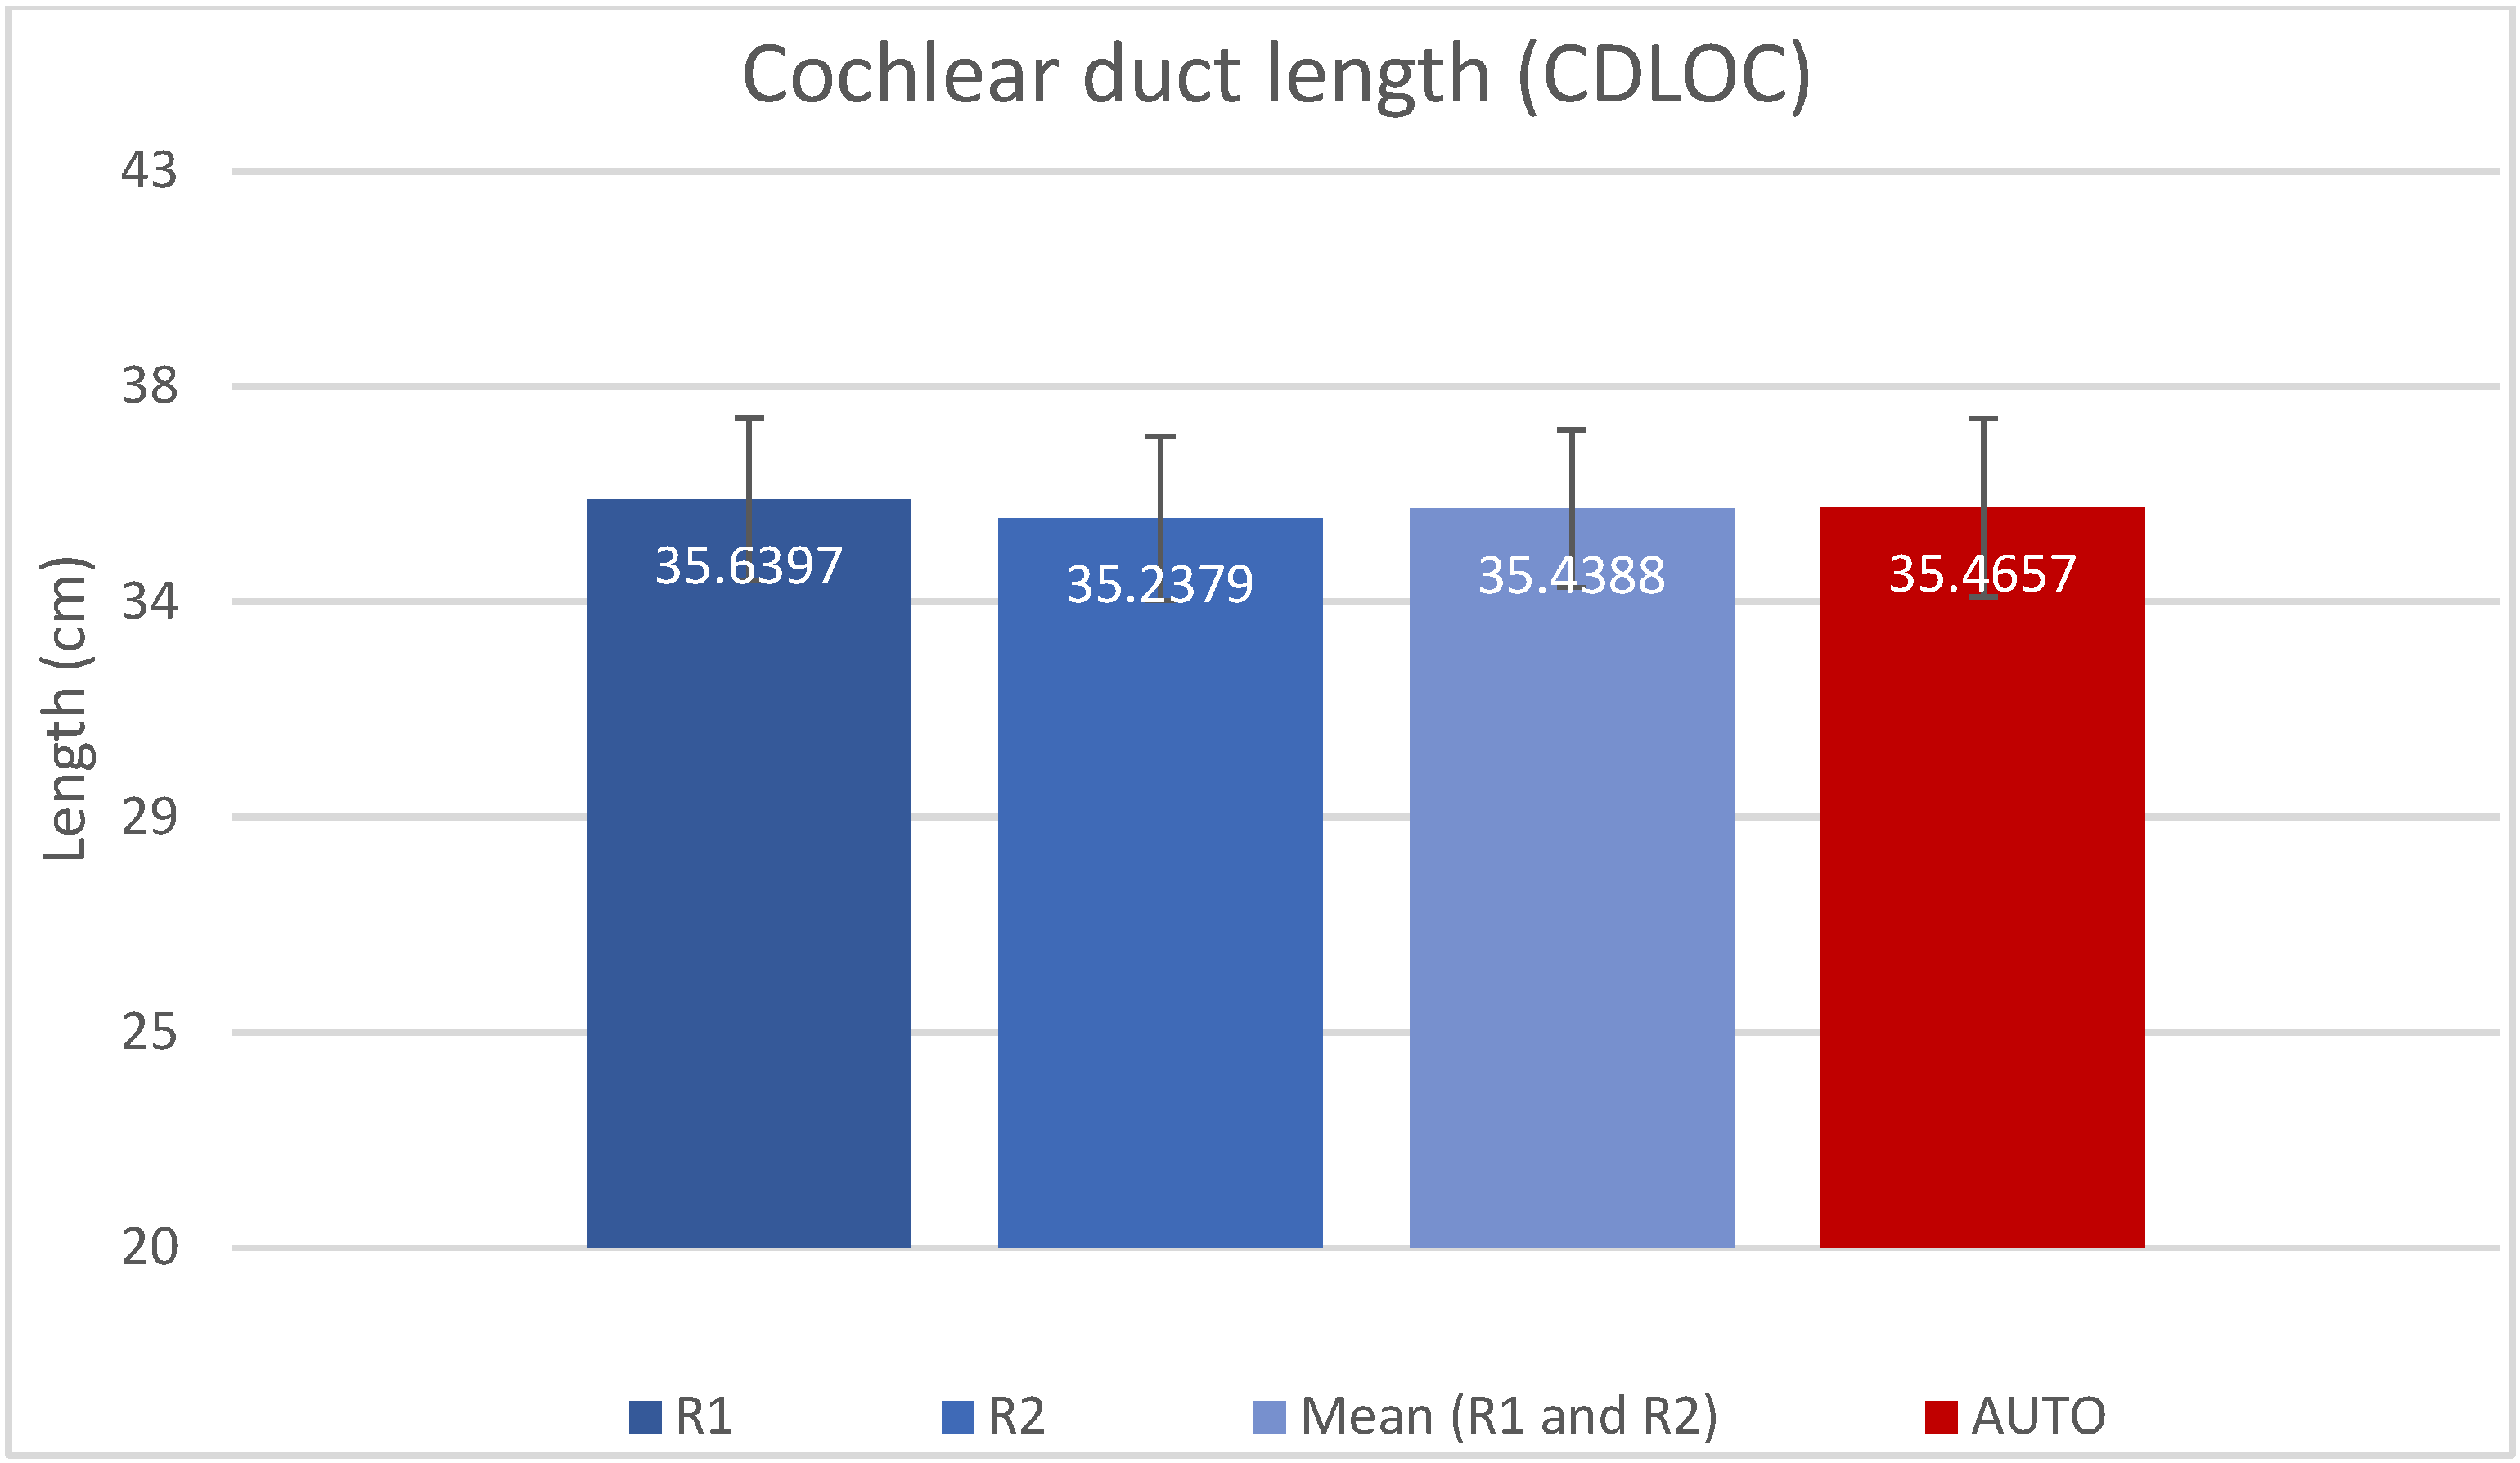
| R1 (Manual) | 9.00 (±0.40) | 6.81 (±0.34) | 3.98 (±0.25) | 35.64 (±1.70) |
| R2 (Manual) | 8.98 (±0.40) | 6.71 (±0.35) | 3.85 (±0.25) | 35.21 (±1.71) |
| AUTO | 9.16 (±0.36) | 6.70 (±0.40) | 3.76 (±0.22) | 35.47 (±1.87) |
| Wilcoxon Signed-Rank Test | p-Value |
|---|---|
| AUTO CDLOC vs. R1 CDLOC | p = 0.831 |
| AUTO CDLOC vs. R2 CDLOC | p = 0.242 |
| AUTO CDLOC vs. Mean R1, R2 CDLOC | p = 0.677 |
Disclaimer/Publisher’s Note: The statements, opinions and data contained in all publications are solely those of the individual author(s) and contributor(s) and not of MDPI and/or the editor(s). MDPI and/or the editor(s) disclaim responsibility for any injury to people or property resulting from any ideas, methods, instructions or products referred to in the content. |
© 2023 by the authors. Licensee MDPI, Basel, Switzerland. This article is an open access article distributed under the terms and conditions of the Creative Commons Attribution (CC BY) license (https://creativecommons.org/licenses/by/4.0/).
Share and Cite
Paouris, D.; Kunzo, S.; Goljerová, I. Validation of Automatic Cochlear Measurements Using OTOPLAN® Software. J. Pers. Med. 2023, 13, 805. https://doi.org/10.3390/jpm13050805
Paouris D, Kunzo S, Goljerová I. Validation of Automatic Cochlear Measurements Using OTOPLAN® Software. Journal of Personalized Medicine. 2023; 13(5):805. https://doi.org/10.3390/jpm13050805
Chicago/Turabian StylePaouris, Dimitrios, Samuel Kunzo, and Irina Goljerová. 2023. "Validation of Automatic Cochlear Measurements Using OTOPLAN® Software" Journal of Personalized Medicine 13, no. 5: 805. https://doi.org/10.3390/jpm13050805