
Association between the Number of Days/Week of Different Levels of Physical Activity and Chronic Pain in People of Different Races: A Mendelian Randomization Study

Abstract
:1. Introduction
2. Methods
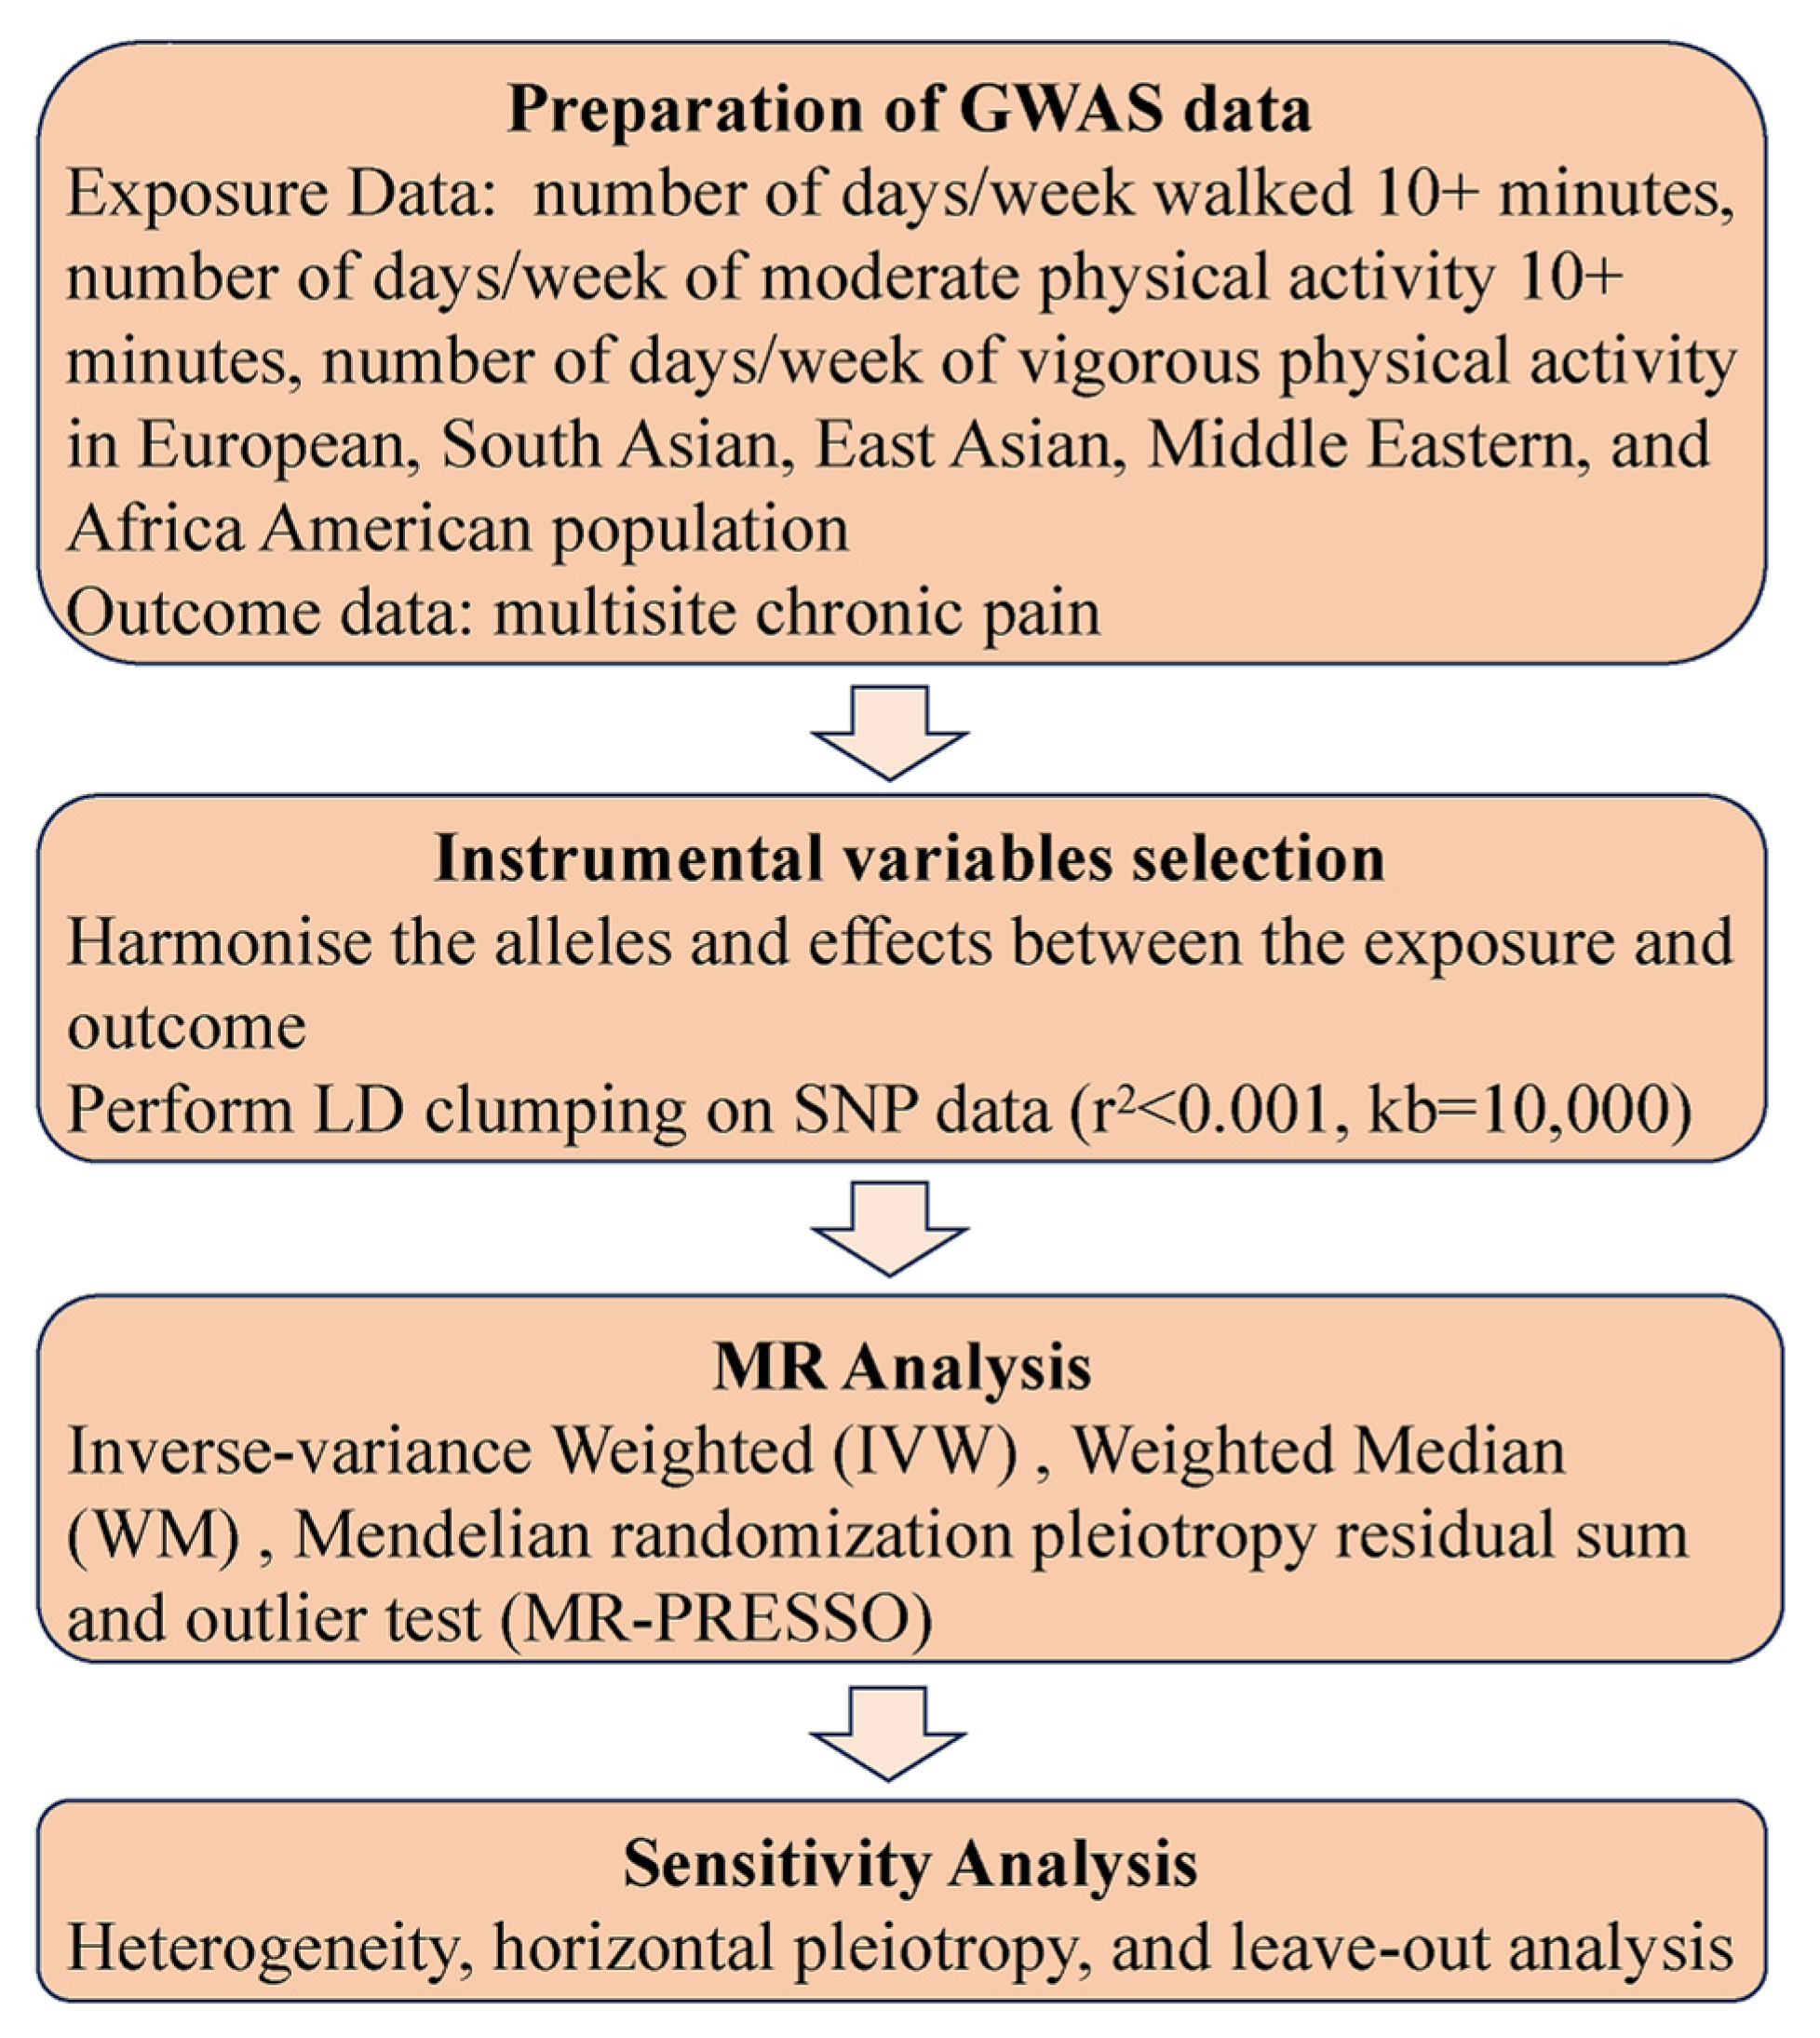
2.1. Study Design
2.2. Physical Activity Samples
2.3. CP Samples
2.4. MR Analysis
2.5. Sensitivity Analysis
3. Results
3.1. Genetic Instruments for the Number of Physical Activities in People of Different Races
3.2. Causal Effects of the Number of Physical Activities on CP in People of Different Races
4. Discussion
5. Conclusions
Supplementary Materials
Author Contributions
Funding
Institutional Review Board Statement
Informed Consent Statement
Data Availability Statement
Conflicts of Interest
References
- Treede, R.D.; Rief, W.; Barke, A.; Aziz, Q.; Bennett, M.I.; Benoliel, R.; Cohen, M.; Evers, S.; Finnerup, N.B.; First, M.B.; et al. A classification of chronic pain for ICD-11. Pain 2015, 156, 1003–1007. [Google Scholar] [CrossRef] [PubMed]
- Dydyk, A.M.; Conermann, T. Chronic Pain. In StatPearls; StatPearls Publishing LLC.: Treasure Island, FL, USA, 2023. [Google Scholar]
- Syed, O.; Jancic, P.; Fink, A.B.; Knezevic, N.N. Drug Safety and Suicidality Risk of Chronic Pain Medications. Pharmaceuticals 2023, 16, 1497. [Google Scholar] [CrossRef] [PubMed]
- Tang, N.K.; Crane, C. Suicidality in chronic pain: A review of the prevalence, risk factors and psychological links. Psychol. Med. 2006, 36, 575–586. [Google Scholar] [CrossRef]
- van Hecke, O.; Torrance, N.; Smith, B.H. Chronic pain epidemiology—Where do lifestyle factors fit in? Br. J. Pain 2013, 7, 209–217. [Google Scholar] [CrossRef]
- Pirnes, K.P.; Kallio, J.; Kankaanpää, A.; Häkkinen, A.; Tammelin, T. Associations of neck and shoulder pain with objectively measured physical activity and sedentary time among school-aged children. Scand. J. Pain 2020, 20, 821–827. [Google Scholar] [CrossRef] [PubMed]
- Zhang, R.; Chomistek, A.K.; Dimitrakoff, J.D.; Giovannucci, E.L.; Willett, W.C.; Rosner, B.A.; Wu, K. Physical activity and chronic prostatitis/chronic pelvic pain syndrome. Med. Sci. Sports Exerc. 2015, 47, 757–764. [Google Scholar] [CrossRef]
- Niederstrasser, N.G.; Attridge, N. Associations between pain and physical activity among older adults. PLoS ONE 2022, 17, e0263356. [Google Scholar] [CrossRef]
- Kędra, A.; Plandowska, M.; Kędra, P.; Czaprowski, D. Physical activity and low back pain in children and adolescents: A systematic review. Eur. Spine J. 2021, 30, 946–956. [Google Scholar] [CrossRef]
- Heneweer, H.; Staes, F.; Aufdemkampe, G.; van Rijn, M.; Vanhees, L. Physical activity and low back pain: A systematic review of recent literature. Eur. Spine J. 2011, 20, 826–845. [Google Scholar] [CrossRef]
- Warner, M.B.; Mason, B.S.; Goosey-Tolfrey, V.L.; Webborn, N. Physical activity levels and shoulder pain in wheelchair users during COVID-19 restrictions. Disabil. Health J. 2022, 15, 101326. [Google Scholar] [CrossRef]
- Matei, R.; Ginsborg, J. Physical Activity, Sedentary Behavior, Anxiety, and Pain Among Musicians in the United Kingdom. Front. Psychol. 2020, 11, 560026. [Google Scholar] [CrossRef]
- Guan, X.; Zhang, D.; Zhang, F.; Zong, Y.; Wang, H.; Shen, Z.; Yin, F. Causal association of physical activity with low back pain, intervertebral disc degeneration and sciatica: A two-sample mendelian randomization analysis study. Front. Cell Dev. Biol. 2023, 11, 1260001. [Google Scholar] [CrossRef] [PubMed]
- Umeda, M.; Escobedo, T. Comparisons of Conditioned Pain Modulation and Physical Activity Between Hispanic and Non-Hispanic White Adults. J. Racial. Ethn. Health Disparities 2019, 6, 472–480. [Google Scholar] [CrossRef]
- Fatoye, F.; Gebrye, T.; Odeyemi, I. Real-world incidence and prevalence of low back pain using routinely collected data. Rheumatol. Int. 2019, 39, 619–626. [Google Scholar] [CrossRef] [PubMed]
- Karimi, R.; Mallah, N.; Nedjat, S.; Beasley, M.J.; Takkouche, B. Association between alcohol consumption and chronic pain: A systematic review and meta-analysis. Br. J. Anaesth. 2022, 129, 355–365. [Google Scholar] [CrossRef] [PubMed]
- Kastelic, K.; Šarabon, N.; Stanford, T.; Dumuid, D.; Pedišić, Ž. Are reallocations of time between physical activity, sedentary behaviour and sleep associated with low back pain? A compositional data analysis. BMJ Open Sport Exerc. Med. 2023, 9, e001701. [Google Scholar] [CrossRef]
- Bonilla-Jaime, H.; Sánchez-Salcedo, J.A.; Estevez-Cabrera, M.M.; Molina-Jiménez, T.; Cortes-Altamirano, J.L.; Alfaro-Rodríguez, A. Depression and Pain: Use of Antidepressants. Curr. Neuropharmacol. 2022, 20, 384–402. [Google Scholar] [CrossRef]
- Strath, L.J.; Sorge, R.E. Racial Differences in Pain, Nutrition, and Oxidative Stress. Pain Ther. 2022, 11, 37–56. [Google Scholar] [CrossRef]
- Bae, S.C.; Lee, Y.H. Causal association between body mass index and risk of rheumatoid arthritis: A Mendelian randomization study. Eur. J. Clin. Investig. 2019, 49, e13076. [Google Scholar] [CrossRef]
- Huang, J.; Zuber, V.; Matthews, P.M.; Elliott, P.; Tzoulaki, J.; Dehghan, A. Sleep, major depressive disorder, and Alzheimer disease: A Mendelian randomization study. Neurology 2020, 95, e1963–e1970. [Google Scholar] [CrossRef]
- Fayaz, A.; Croft, P.; Langford, R.M.; Donaldson, L.J.; Jones, G.T. Prevalence of chronic pain in the UK: A systematic review and meta-analysis of population studies. BMJ Open 2016, 6, e010364. [Google Scholar] [CrossRef] [PubMed]
- Steingrímsdóttir, Ó.A.; Landmark, T.; Macfarlane, G.J.; Nielsen, C.S. Defining chronic pain in epidemiological studies: A systematic review and meta-analysis. Pain 2017, 158, 2092–2107. [Google Scholar] [CrossRef] [PubMed]
- Ray, B.M.; Kelleran, K.J.; Eubanks, J.E.; Nan, N.; Ma, C.; Miles, D. Relationship between Physical Activity and Pain in U.S. Adults. Med. Sci. Sports Exerc. 2023, 55, 497–506. [Google Scholar] [CrossRef] [PubMed]
- Wadley, A.L.; Iacovides, S.; Roche, J.; Scheuermaier, K.; Venter, W.D.F.; Vos, A.G.; Lalla-Edward, S.T. Working nights and lower leisure-time physical activity associate with chronic pain in Southern African long-distance truck drivers: A cross-sectional study. PLoS ONE 2020, 15, e0243366. [Google Scholar] [CrossRef] [PubMed]
- O’Connor, P.J.; Herring, M.P.; McDowell, C.P.; Dishman, R.K. Physical activity is indirectly associated with pain in college women through associations with somatization and panic disorder symptoms: A cross-sectional study. Ann. Epidemiol. 2019, 33, 37–43. [Google Scholar] [CrossRef] [PubMed]
- Schäfer, A.; Laekeman, M.; Egan Moog, M.; Dieterich, A.V. On the move-Prevention of chronic pain with physical activity and movement. Schmerz 2021, 35, 14–20. [Google Scholar] [CrossRef]
- Pirnes, K.P.; Kallio, J.; Hakonen, H.; Hautala, A.; Häkkinen, A.H.; Tammelin, T. Physical activity, screen time and the incidence of neck and shoulder pain in school-aged children. Sci. Rep. 2022, 12, 10635. [Google Scholar] [CrossRef] [PubMed]
- Patel, N.A.; Kianoush, S.; Jia, X.; Nambi, V.; Koh, S.; Patel, J.; Saeed, A.; Ahmed, A.I.; Al-Mallah, M.; Agarwala, A.; et al. Racial/Ethnic Disparities and Determinants of Sufficient Physical Activity Levels. Kans. J. Med. 2022, 15, 267–272. [Google Scholar] [CrossRef]
- Boyer, W.; Churilla, J.; Miller, A.; Gillum, T.; Penny, M. The Independent and Combined Effects of Aerobic Physical Activity and Muscular Strengthening Activity on All-Cause Mortality: An Analysis of Effect Modification by Race-Ethnicity. J. Phys. Act. Health 2020, 17, 881–888. [Google Scholar] [CrossRef]
- Boyer, W.R.; Ehrlich, S.F.; Crouter, S.E.; Churilla, J.R.; Fitzhugh, E.C. Leisure-time aerobic physical activity and the risk of diabetes-related mortality: An analysis of effect modification by race-ethnicity. J. Diabetes Complicat. 2021, 35, 107763. [Google Scholar] [CrossRef]
- Boyer, W.R.; Bassett, D.R.; Fitzhugh, E.C.; Milano, A.N.; Churilla, J.R.; Toth, L.P.; Richardson, M.R. Accelerometer-Measured Physical Activity and Cardiometabolic Risk Factors by Race-Ethnicity: 2003–2006 NHANES. J. Racial. Ethn. Health Disparities 2022, 9, 1607–1615. [Google Scholar] [CrossRef] [PubMed]
- Campbell, C.M.; Edwards, R.R. Ethnic differences in pain and pain management. Pain Manag. 2012, 2, 219–230. [Google Scholar] [CrossRef] [PubMed]
- Tudor-Locke, C. Walk more (frequently, farther, faster): The perfect preventive medicine. Prev. Med. 2012, 55, 540–541. [Google Scholar] [CrossRef] [PubMed]
- Custodero, C.; Agosti, P.; Anton, S.D.; Manini, T.M.; Lozupone, M.; Panza, F.; Pahor, M.; Sabbà, C.; Solfrizzi, V. Effect of Physical Activity Intervention on Gait Speed by Frailty Condition: A Randomized Clinical Trial. J. Am. Med. Dir. Assoc. 2023, 24, 489–496. [Google Scholar] [CrossRef]
- Taylor, W.C.; Muss, H.B. Recent advances: Adjuvant therapy for older women with breast cancer. Cancer J. 2010, 16, 289–293. [Google Scholar] [CrossRef]
- Zhou, B.; Fang, Z.; Zheng, G.; Chen, X.; Liu, M.; Zuo, L.; Jing, C.; Wang, G.; Gao, Y.; Bai, Y.; et al. The objectively measured walking speed and risk of hypertension in Chinese older adults: A prospective cohort study. Hypertens. Res. 2023. [Google Scholar] [CrossRef]
- Mechlin, B.; Heymen, S.; Edwards, C.L.; Girdler, S.S. Ethnic differences in cardiovascular-somatosensory interactions and in the central processing of noxious stimuli. Psychophysiology 2011, 48, 762–773. [Google Scholar] [CrossRef]
- Jia, R.X.; Liang, J.H.; Xu, Y.; Wang, Y.Q. Effects of physical activity and exercise on the cognitive function of patients with Alzheimer disease: A meta-analysis. BMC Geriatr. 2019, 19, 181. [Google Scholar] [CrossRef]
- Cai, W.; Sun, Y.; Peng, K.; Kwok, H.; Lei, L.; Wu, S.; Lam, C.K.; Li, L.; Gao, Y. Physical-Activity-Related Injuries and Risk Factors among Secondary School Students in Hong Kong. Int. J. Environ. Res. Public Health 2020, 17, 747. [Google Scholar] [CrossRef]
- Harper-Hanigan, K.; Gruber, A.H. The Missing Link in Running Injury Research: Nonrunning Physical Activity. J. Orthop. Sports Phys. Ther. 2022, 52, 705–708. [Google Scholar] [CrossRef]
- Hunt, C.; Moman, R.; Peterson, A.; Wilson, R.; Covington, S.; Mustafa, R.; Murad, M.H.; Hooten, W.M. Prevalence of chronic pain after spinal cord injury: A systematic review and meta-analysis. Reg. Anesth. Pain Med. 2021, 46, 328–336. [Google Scholar] [CrossRef] [PubMed]
- Irvine, K.A.; Clark, J.D. Chronic Pain After Traumatic Brain Injury: Pathophysiology and Pain Mechanisms. Pain Med. 2018, 19, 1315–1333. [Google Scholar] [CrossRef] [PubMed]
- Watts, E.L.; Matthews, C.E.; Freeman, J.R.; Gorzelitz, J.S.; Hong, H.G.; Liao, L.M.; McClain, K.M.; Saint-Maurice, P.F.; Shiroma, E.J.; Moore, S.C. Association of Leisure Time Physical Activity Types and Risks of All-Cause, Cardiovascular, and Cancer Mortality Among Older Adults. JAMA Netw. Open 2022, 5, e2228510. [Google Scholar] [CrossRef] [PubMed]
- Sibille, K.T.; Witek-Janusek, L.; Mathews, H.L.; Fillingim, R.B. Telomeres and epigenetics: Potential relevance to chronic pain. Pain 2012, 153, 1789–1793. [Google Scholar] [CrossRef] [PubMed]
- Brandão, A.F.; Bonet, I.J.M.; Pagliusi, M., Jr.; Zanetti, G.G.; Pho, N.; Tambeli, C.H.; Parada, C.A.; Vieira, A.S.; Sartori, C.R. Physical Activity Induces Nucleus Accumbens Genes Expression Changes Preventing Chronic Pain Susceptibility Promoted by High-Fat Diet and Sedentary Behavior in Mice. Front. Neurosci. 2019, 13, 1453. [Google Scholar] [CrossRef] [PubMed]
- Fjeld, M.K.; Årnes, A.P.; Engdahl, B.; Morseth, B.; Hopstock, L.A.; Horsch, A.; Stubhaug, A.; Strand, B.H.; Nielsen, C.S.; Steingrímsdóttir, Ó.A. Consistent pattern between physical activity measures and chronic pain levels: The Tromsø Study 2015 to 2016. Pain 2023, 164, 838–847. [Google Scholar] [CrossRef]
- Korunes, K.L.; Goldberg, A. Human genetic admixture. PLoS Genet. 2021, 17, e1009374. [Google Scholar] [CrossRef]
- Siddall, B.; Ram, A.; Jones, M.D.; Booth, J.; Perriman, D.; Summers, S.J. Short-term impact of combining pain neuroscience education with exercise for chronic musculoskeletal pain: A systematic review and meta-analysis. Pain 2022, 163, e20–e30. [Google Scholar] [CrossRef]
- Traeger, A.C.; Lee, H.; Hübscher, M.; Skinner, I.W.; Moseley, G.L.; Nicholas, M.K.; Henschke, N.; Refshauge, K.M.; Blyth, F.M.; Main, C.J.; et al. Effect of Intensive Patient Education vs Placebo Patient Education on Outcomes in Patients with Acute Low Back Pain: A Randomized Clinical Trial. JAMA Neurol. 2019, 76, 161–169. [Google Scholar] [CrossRef]
- Gorji, S.M.; Mohammadi Nia Samakosh, H.; Watt, P.; Henrique Marchetti, P.; Oliveira, R. Pain Neuroscience Education and Motor Control Exercises versus Core Stability Exercises on Pain, Disability, and Balance in Women with Chronic Low Back Pain. Int. J. Environ. Res. Public Health 2022, 19, 2694. [Google Scholar] [CrossRef]


| GWAS ID | Trait | Sample Size | Case | Control | SNPs | Consortium (Author) | Population | Year |
|---|---|---|---|---|---|---|---|---|
| ukb-a-506 | Number of days/week with ≥10 min of walking | 331,654 | NA | NA | 10,894,596 | Neale Lab | European | 2017 |
| ukb-e-864-AFR | Number of days/week with ≥10 min of walking | 6271 | 6271 | 0 | 15,532,486 | Pan-UKB team | African American or Afro-Caribbean | 2020 |
| ukb-e-864-EAS | Number of days/week with ≥10 min of walking | 2558 | 2558 | 0 | 8,256,758 | Pan-UKB team | East Asian | 2020 |
| ukb-e-864-MID | Number of days/week with ≥10 min of walking | 1508 | 1508 | 0 | 11,867,624 | Pan-UKB team | Greater Middle Eastern (Middle Eastern, North African, or Persian) | 2020 |
| ukb-e-864-CSA | Number of days/week with ≥10 min of walking | 8233 | 8233 | 0 | 9,810,548 | Pan-UKB team | South Asian | 2020 |
| ukb-a-508 | Number of days/week with ≥10 min of moderate physical activity | 321,309 | NA | NA | 10,894,596 | Neale Lab | European | 2017 |
| ukb-e-884-AFR | Number of days/week with ≥10 min of moderate physical activity | 5870 | 5870 | 0 | 15,533,667 | Pan-UKB team | African American or Afro-Caribbean | 2020 |
| ukb-e-884-EAS | Number of days/week with ≥10 min of moderate physical activity | 2402 | 2402 | 0 | 8,263,434 | Pan-UKB team | East Asian | 2020 |
| ukb-e-884-MID | Number of days/week with ≥10 min of moderate physical activity | 1407 | 1407 | 0 | 11,801,052 | Pan-UKB team | Greater Middle Eastern (Middle Eastern, North African, or Persian) | 2020 |
| ukb-e-884-CSA | Number of days/week with ≥10 min of moderate physical activity | 7481 | 7481 | 0 | 9,808,866 | Pan-UKB team | South Asian | 2020 |
| ukb-a-511 | Number of days/week with ≥10 min of vigorous physical activity | 321,533 | NA | NA | 10,894,596 | Neale Lab | European | 2017 |
| ukb-e-904-AFR | Number of days/week with ≥10 min of vigorous physical activity | 5690 | 5690 | 0 | 15,533,580 | Pan-UKB team | African American or Afro-Caribbean | 2020 |
| ukb-e-904-EAS | Number of days/week with ≥10 min of vigorous physical activity | 2365 | 2365 | 0 | 8,264,757 | Pan-UKB team | East Asian | 2020 |
| ukb-e-904-MID | Number of days/week with ≥10 min of vigorous physical activity | 1392 | 1392 | 0 | 11,821,327 | Pan-UKB team | Greater Middle Eastern (Middle Eastern, North African, or Persian) | 2020 |
| ukb-e-904-CSA | Number of days/week with ≥10 min of vigorous physical activity | 7201 | 7201 | 0 | 9,809,619 | Pan-UKB team | South Asian | 2020 |
| ukb-e-MCP_AFR | Multisite chronic pain | 6195 | 6195 | 0 | 15,534,171 | Pan-UKB team | African American or Afro-Caribbean | 2020 |
| Exposure | Forward MR | β | SE | p | OR | 95%CI (OR) |
|---|---|---|---|---|---|---|
| Ukb-a-506 | MR-Egger | −0.006 | 0.05448 | 0.918 | 0.994 | 0.894–1.106 |
| Weighted median | −0.028 | 0.0554 | 0.6121 | 0.972 | 0.872–1.084 | |
| Inverse-variance weighting | 0.022 | 0.03992 | 0.5841 | 1.022 | 0.945–1.105 | |
| Weighted mode | −0.027 | 0.0523 | 0.6059 | 0.973 | 0.878–1.078 | |
| Ukb-e-864-AFR | MR-Egger | 0.019 | 0.027 | 0.477 | 1.019 | 0.967–1.075 |
| Weighted median | −0.009 | 0.015 | 0.576 | 0.991 | 0.962–1.022 | |
| Inverse-variance weighting | −0.021 | 0.011 | 0.045 | 0.979 | 0.959–1.000 | |
| Weighted mode | 0.004 | 0.040 | 0.912 | 1.004 | 0.929–1.086 | |
| Ukb-e-864-EAS | MR-Egger | −0.005 | 0.015 | 0.765 | 0.995 | 0.966–1.025 |
| Weighted median | −0.008 | 0.010 | 0.376 | 0.992 | 0.973–1.010 | |
| Inverse-variance weighting | −0.009 | 0.007 | 0.214 | 0.991 | 0.978–1.005 | |
| Weighted mode | −0.007 | 0.011 | 0.499 | 0.993 | 0.972–1.014 | |
| Ukb-e-864-MID | MR-Egger | 0.020 | 0.015 | 0.195 | 1.020 | 0.990–1.051 |
| Weighted median | −0.001 | 0.008 | 0.929 | 0.999 | 0.983–1.016 | |
| Inverse-variance weighting | −0.001 | 0.006 | 0.873 | 0.999 | 0.988–1.010 | |
| Weighted mode | 0.017 | 0.017 | 0.324 | 1.017 | 0.984–1.052 | |
| Ukb-a-508 | MR-Egger | 0.202 | 0.102 | 0.0499 | 1.223 | 1.002–1.495 |
| Weighted median | 0.137 | 0.070 | 0.050 | 1.147 | 1.000–1.316 | |
| Inverse-variance weighting | 0.139 | 0.045 | 0.002 | 1.149 | 1.052–1.256 | |
| Weighted mode | 0.133 | 0.102 | 0.194 | 1.143 | 0.935–1.396 | |
| Ukb-e-884-AFR | MR-Egger | −0.031 | 0.026 | 0.228 | 0.969 | 0.921–1.019 |
| Weighted median | −0.005 | 0.012 | 0.653 | 0.995 | 0.971–1.018 | |
| Inverse-variance weighting | −0.008 | 0.008 | 0.334 | 0.992 | 0.976–1.008 | |
| Weighted mode | 0.001 | 0.036 | 0.987 | 1.001 | 0.933–1.073 | |
| Ukb-e-884-EAS | MR-Egger | −0.009 | 0.009 | 0.327 | 0.991 | 0.975–1.008 |
| Weighted median | −0.008 | 0.007 | 0.225 | 0.992 | 0.979–1.005 | |
| Inverse-variance weighting | −0.008 | 0.004 | 0.080 | 0.992 | 0.983–1.001 | |
| Weighted mode | −0.008 | 0.007 | 0.254 | 0.992 | 0.979–1.006 | |
| Ukb-e-884-MID | MR-Egger | −0.004 | 0.012 | 0.750 | 0.996 | 0.973–1.020 |
| Weighted median | −0.005 | 0.007 | 0.465 | 0.995 | 0.983–1.008 | |
| Inverse-variance weighting | −0.005 | 0.004 | 0.202 | 0.995 | 0.987–1.003 | |
| Weighted mode | −0.012 | 0.011 | 0.277 | 0.988 | 0.967–1.010 | |
| Ukb-e-884-CSA | MR-Egger | 0.024 | 0.032 | 0.453 | 1.024 | 0.962–1.091 |
| Weighted median | 0.014 | 0.019 | 0.456 | 1.014 | 0.978–1.052 | |
| Inverse-variance weighting | 0.032 | 0.012 | 0.007 | 1.032 | 1.009–1.056 | |
| Weighted mode | 0.012 | 0.024 | 0.602 | 1.012 | 0.967–1.060 | |
| Ukb-a-511 | MR-Egger | 0.243 | 0.207 | 0.242 | 1.275 | 0.850–1.913 |
| Weighted median | 0.147 | 0.098 | 0.133 | 1.158 | 0.956–1.402 | |
| Inverse-variance weighting | 0.217 | 0.067 | 0.001 | 1.243 | 1.090–1.416 | |
| Weighted mode | 0.047 | 0.171 | 0.782 | 1.049 | 0.750–1.466 | |
| Ukb-e-904-AFR | MR-Egger | 0.009 | 0.031 | 0.780 | 1.009 | 0.949–1.072 |
| Weighted median | −0.031 | 0.014 | 0.023 | 0.969 | 0.944–0.996 | |
| Inverse-variance weighting | −0.025 | 0.010 | 0.010 | 0.975 | 0.957–0.994 | |
| Weighted mode | −0.036 | 0.035 | 0.297 | 0.964 | 0.901–1.032 | |
| Ukb-e-904-EAS | MR-Egger | 0.004 | 0.017 | 0.812 | 1.004 | 0.971–1.039 |
| Weighted median | −0.011 | 0.012 | 0.335 | 0.989 | 0.967–1.012 | |
| Inverse-variance weighting | 0.004 | 0.007 | 0.576 | 1.004 | 0.990–1.018 | |
| Weighted mode | −0.014 | 0.013 | 0.295 | 0.986 | 0.960–1.012 | |
| Ukb-e-904-MID | MR-Egger | 0.000 | 0.0118 | 0.993 | 1.000 | 0.977–1.023 |
| Weighted median | 0.001 | 0.007 | 0.913 | 1.001 | 0.987–1.015 | |
| Inverse-variance weighting | 0.001 | 0.005 | 0.813 | 1.001 | 0.991–1.011 | |
| Weighted mode | −0.006 | 0.014 | 0.690 | 0.994 | 0.967–1.023 | |
| Ukb-e-904-CSA | MR-Egger | −0.011 | 0.028 | 0.692 | 0.989 | 0.937–1.044 |
| Weighted median | −0.005 | 0.017 | 0.792 | 0.996 | 0.963–1.029 | |
| Inverse-variance weighting | 0.001 | 0.014 | 0.956 | 1.001 | 0.974–1.028 | |
| Weighted mode | 0.0001 | 0.018 | 0.993 | 0.100 | 0.965–1.035 |
| 9 | Heterogeneity Statistics | Horizontal Pleiotropy | |||
|---|---|---|---|---|---|
| MR-Egger p Value | IVW p Value | Egger Regression Intercept | Standard Error | Directionality p Value | |
| Ukb-a-506 | 0.108 | 0.113 | 0.002 | 0.003 | 0.459 |
| Ukb-e-864-AFR | 0.937 | 0.917 | −0.009 | 0.006 | 0.107 |
| Ukb-e-864-EAS | 0.106 | 0.122 | −0.002 | 0.007 | 0.749 |
| Ukb-e-864-MID | 0.604 | 0.564 | −0.011 | 0.007 | 0.146 |
| Ukb-a-508 | 0.229 | 0.238 | −0.003 | 0.004 | 0.496 |
| Ukb-e-884-AFR | 0.759 | 0.760 | 0.006 | 0.006 | 0.344 |
| Ukb-e-884-EAS | 0.845 | 0.836 | 0.001 | 0.006 | 0.926 |
| Ukb-e-884-MID | 0.143 | 0.157 | −0.001 | 0.007 | 0.902 |
| Ukb-e-884-CSA | 0.191 | 0.215 | 0.002 | 0.008 | 0.800 |
| Ukb-a-511 | 0.143 | 0.157 | 0.001 | 0.006 | 0.895 |
| Ukb-e-904-AFR | 0.845 | 0.836 | −0.008 | 0.007 | 0.252 |
| Ukb-e-904-EAS | 0.689 | 0.726 | −0.00004 | 0.007 | 0.996 |
| Ukb-e-904-MID | 0.013 | 0.015 | 0.001 | 0.007 | 0.918 |
| Ukb-e-904-CSA | 0.004 | 0.004 | 0.004 | 0.008 | 0.624 |
Disclaimer/Publisher’s Note: The statements, opinions and data contained in all publications are solely those of the individual author(s) and contributor(s) and not of MDPI and/or the editor(s). MDPI and/or the editor(s) disclaim responsibility for any injury to people or property resulting from any ideas, methods, instructions or products referred to in the content. |
© 2023 by the authors. Licensee MDPI, Basel, Switzerland. This article is an open access article distributed under the terms and conditions of the Creative Commons Attribution (CC BY) license (https://creativecommons.org/licenses/by/4.0/).
Share and Cite
Luo, S.; Yang, M.; Yang, H.; Guo, Q.; Wang, Y.; Wang, E. Association between the Number of Days/Week of Different Levels of Physical Activity and Chronic Pain in People of Different Races: A Mendelian Randomization Study. J. Pers. Med. 2024, 14, 50. https://doi.org/10.3390/jpm14010050
Luo S, Yang M, Yang H, Guo Q, Wang Y, Wang E. Association between the Number of Days/Week of Different Levels of Physical Activity and Chronic Pain in People of Different Races: A Mendelian Randomization Study. Journal of Personalized Medicine. 2024; 14(1):50. https://doi.org/10.3390/jpm14010050
Chicago/Turabian StyleLuo, Sumei, Minjing Yang, Haojun Yang, Qulian Guo, Yunjiao Wang, and E Wang. 2024. "Association between the Number of Days/Week of Different Levels of Physical Activity and Chronic Pain in People of Different Races: A Mendelian Randomization Study" Journal of Personalized Medicine 14, no. 1: 50. https://doi.org/10.3390/jpm14010050