
Computational Analysis of Deleterious nsSNPs in INS Gene Associated with Permanent Neonatal Diabetes Mellitus
 , , , , , ,
Abstract
:1. Introduction
2. Methodology
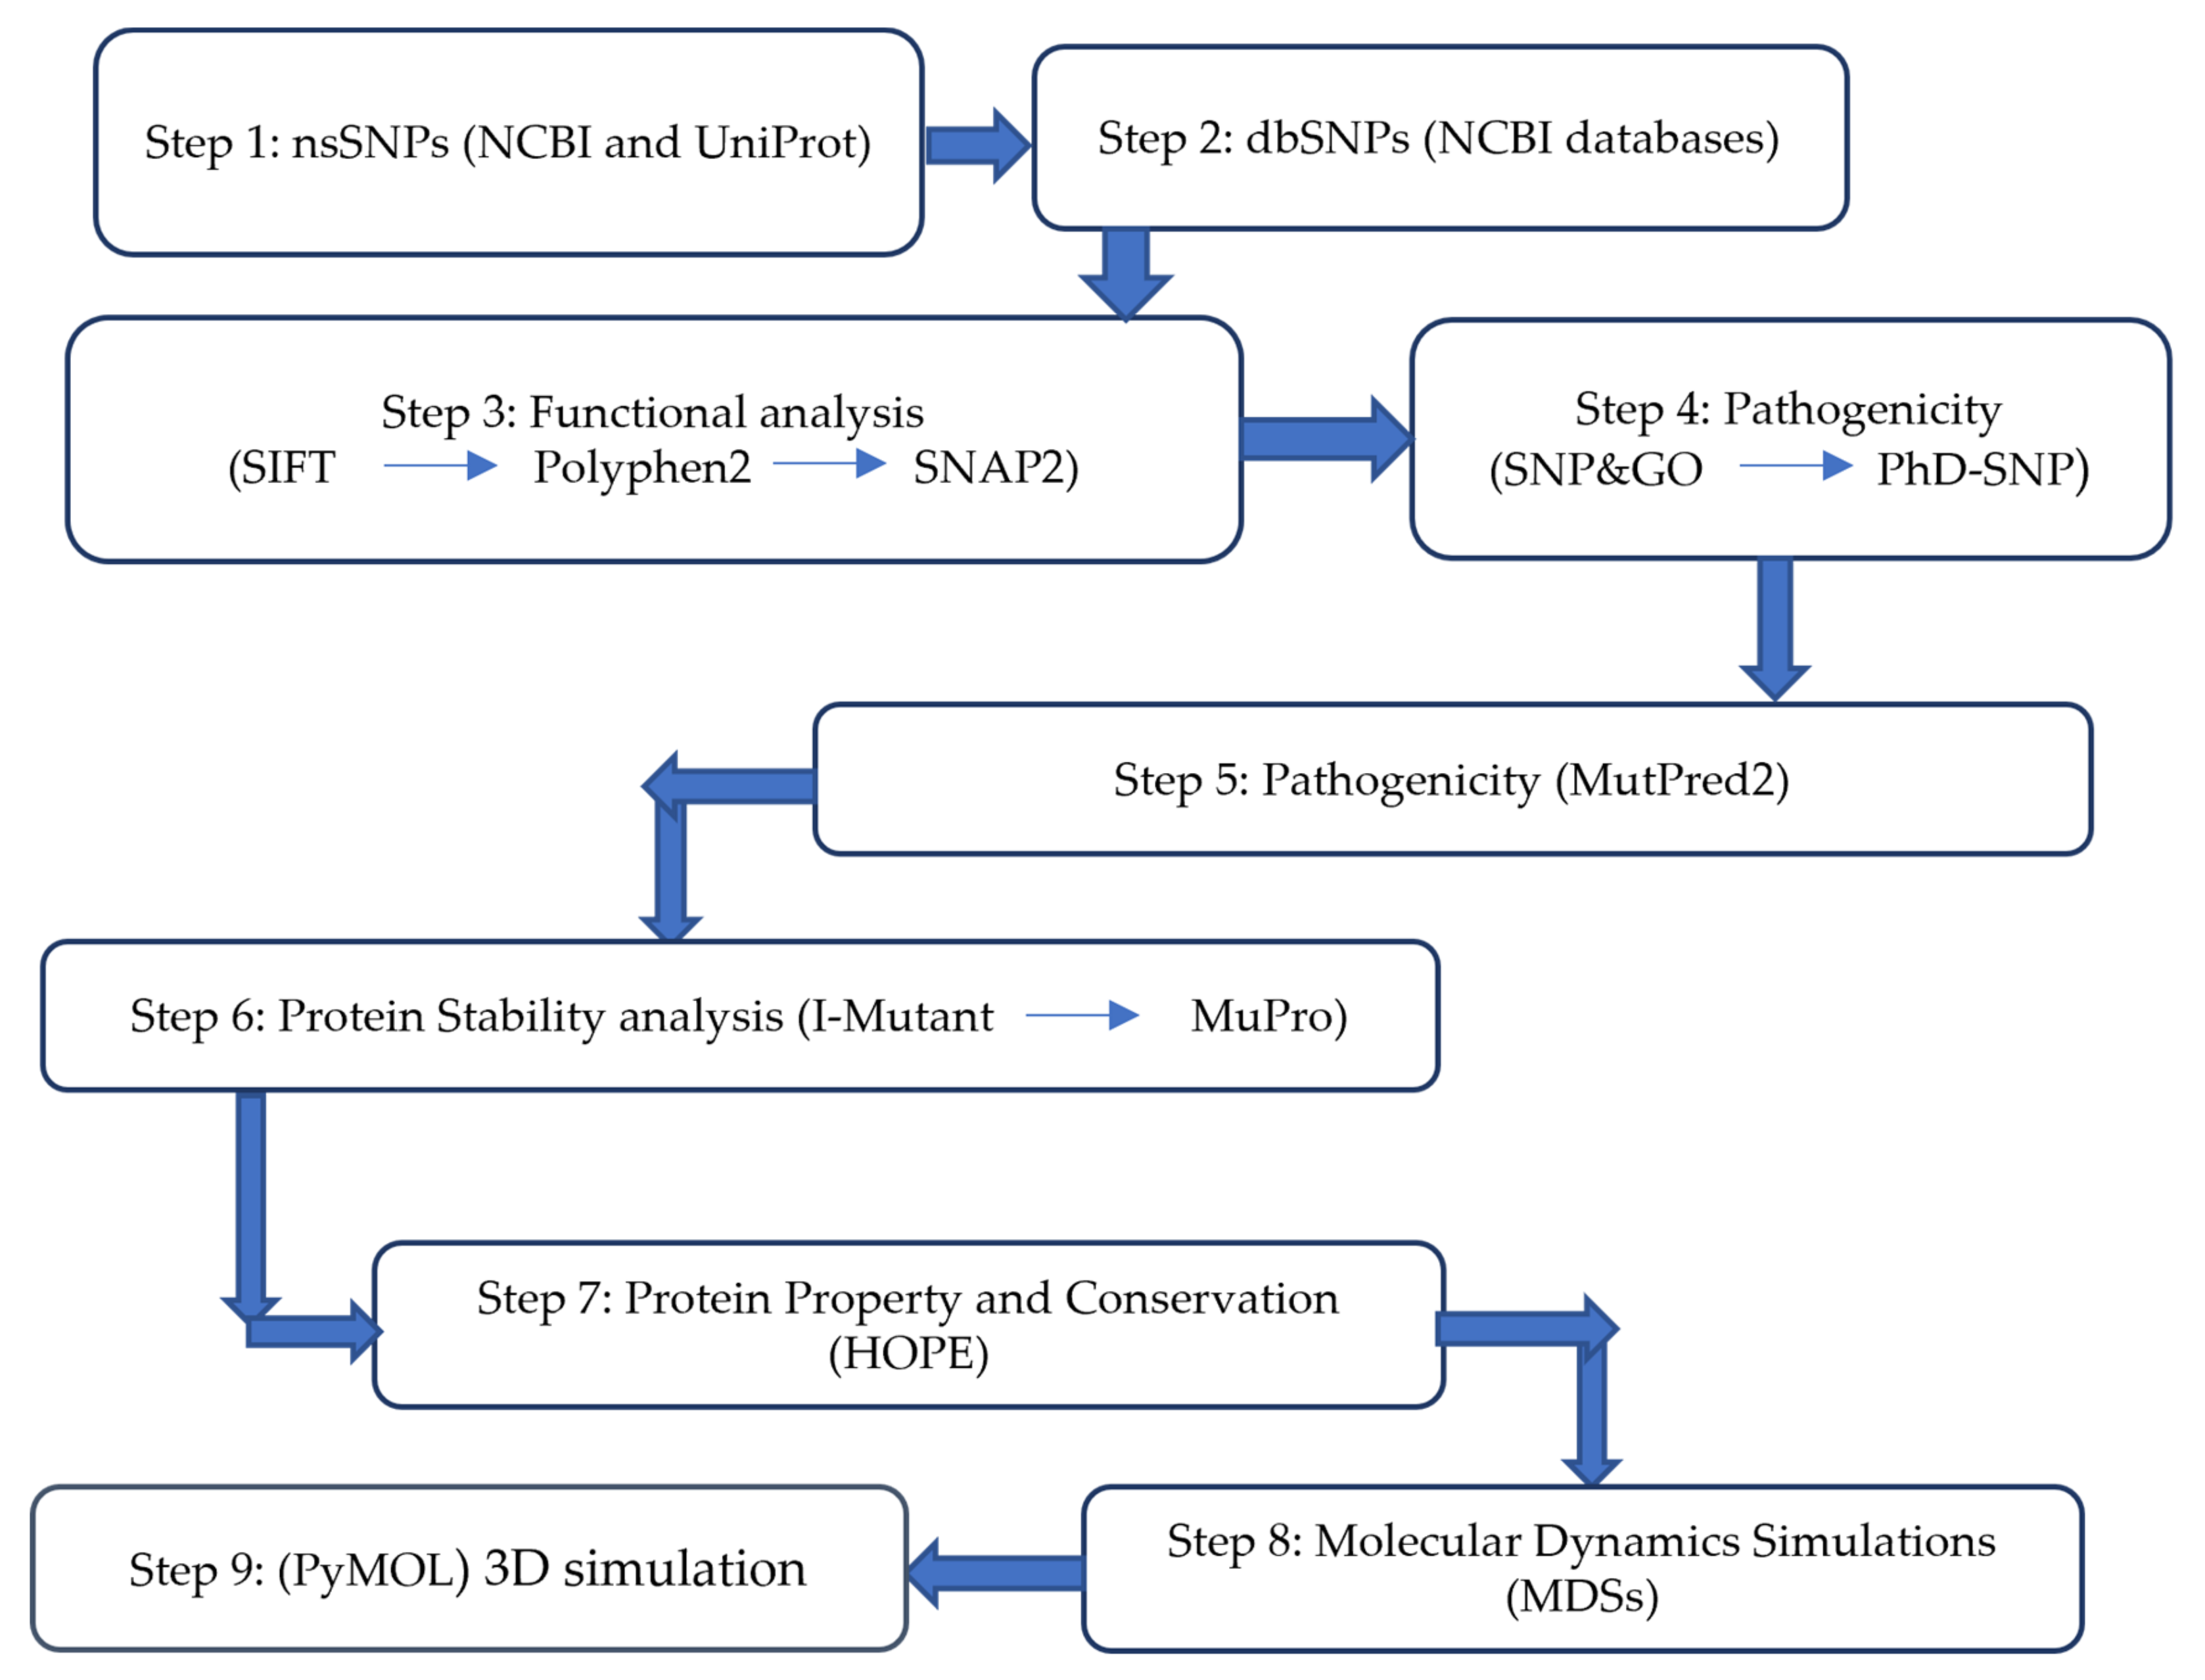
2.1. Work Plan
2.2. Data Collection
2.3. Investigation of the Impact of nsSNPs on Protein Function
2.4. Prediction of SNP Disease Association
2.5. Prediction of SNPs on INS Protein Function Related to Pathogenicity
2.6. Impact of SNPs on Protein Stability
2.7. Analysis of Protein Properties Utilizing the HOPE Tool
2.8. Performing of Molecular Dynamics Simulations (MDSs)
2.9. Displaying Three-Dimensional Structural Change Using PyMol Software
3. Results
3.1. Data Collection
3.2. Exploring the Influence of SNPs on Protein Function
3.3. Prediction of SNP–Disease Association
3.4. Prediction of SNPs on INS Protein Function Related to Pathogenicity
3.5. Predicting the Impact of SNPs on Protein Stability
3.6. Analysis of Protein Properties
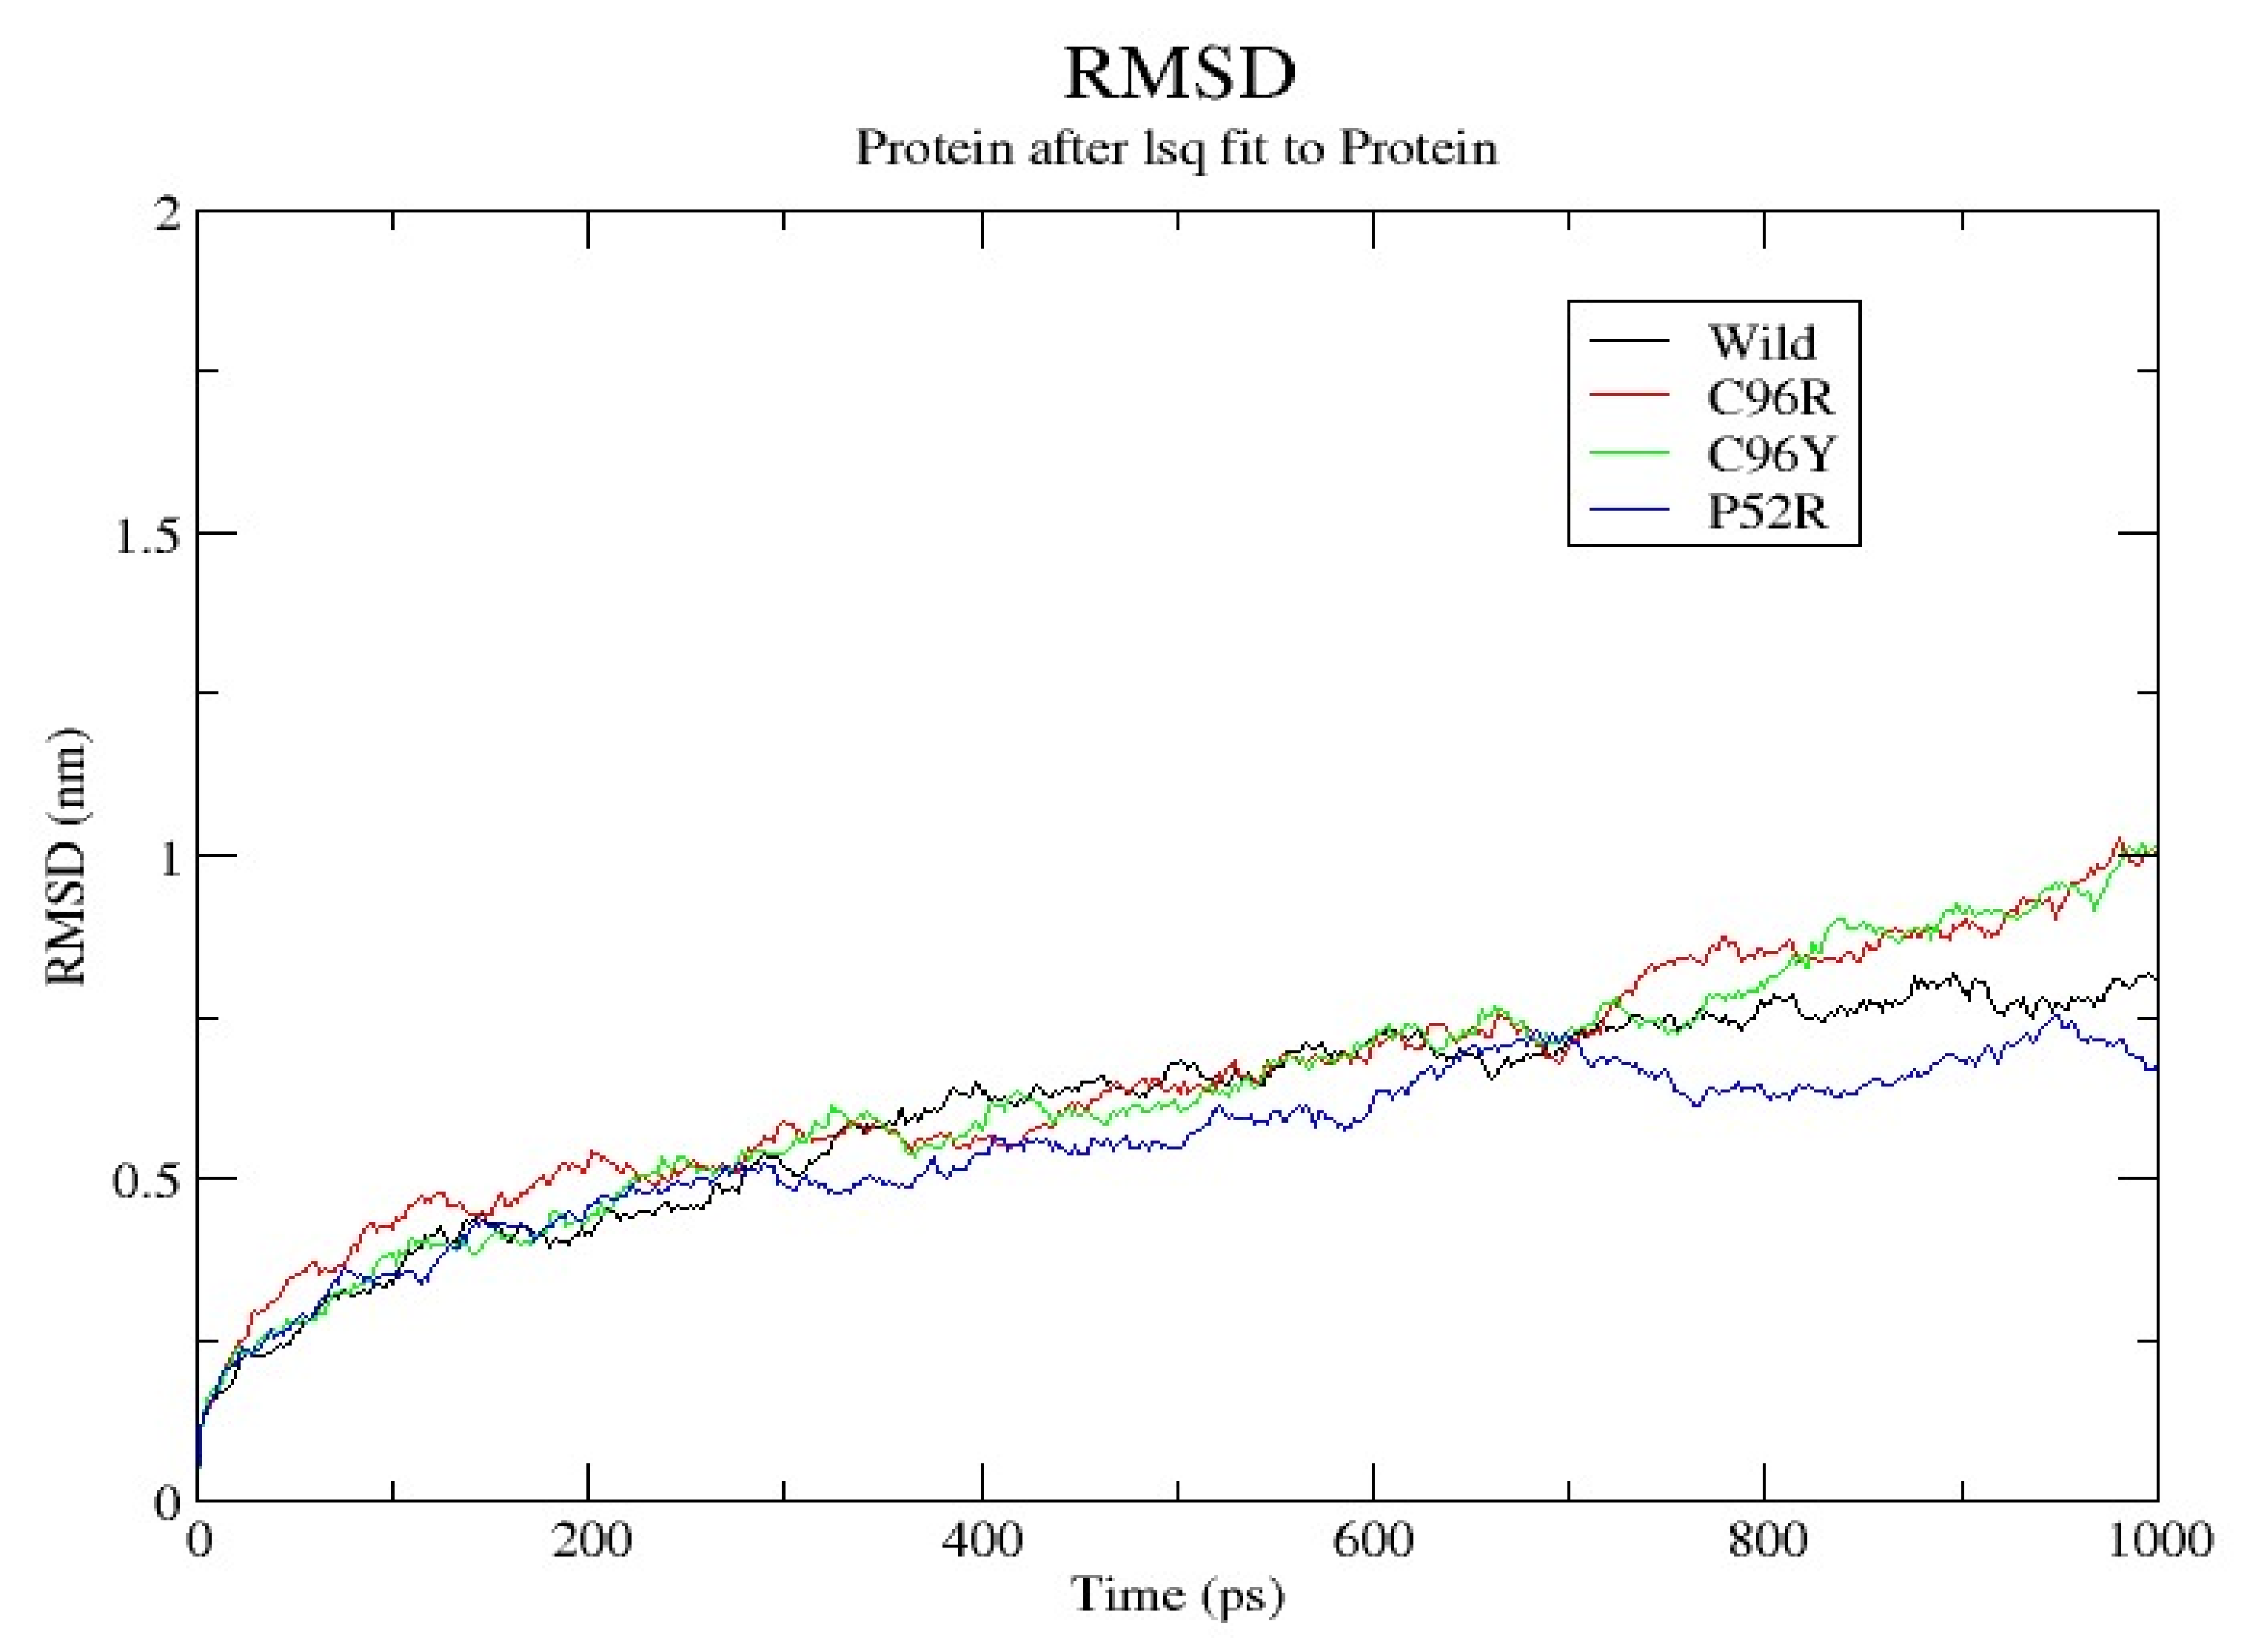
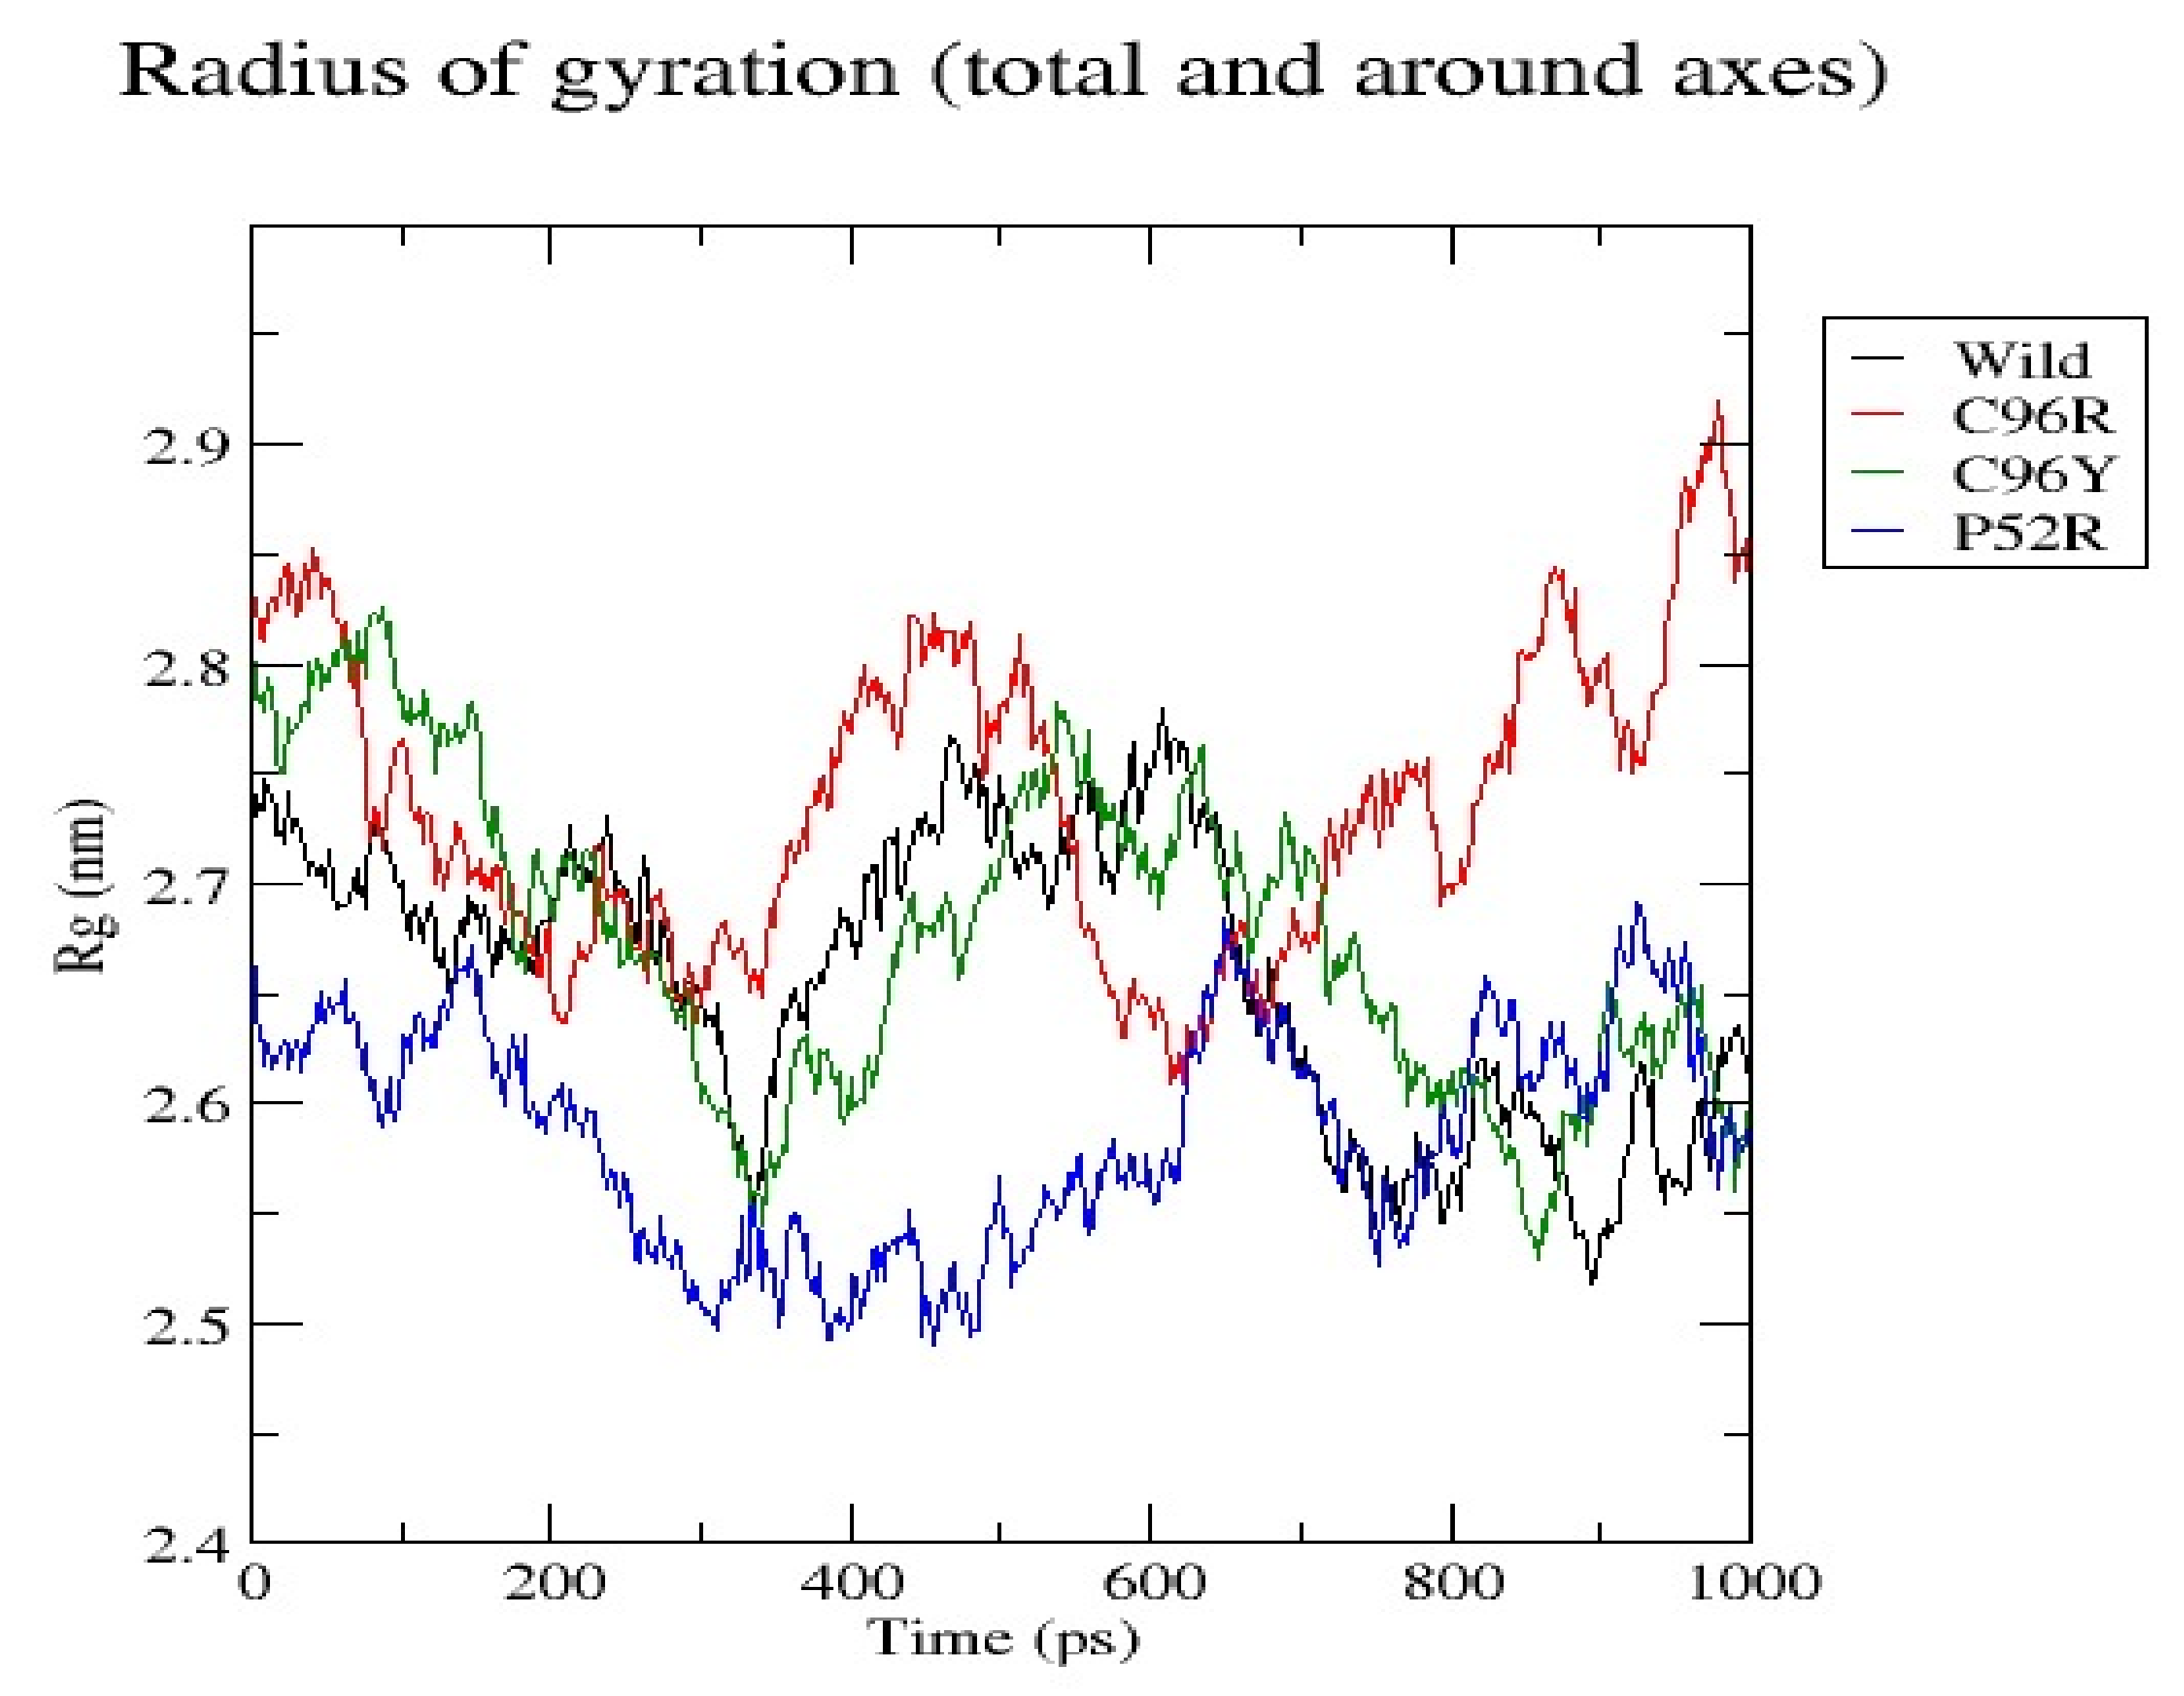
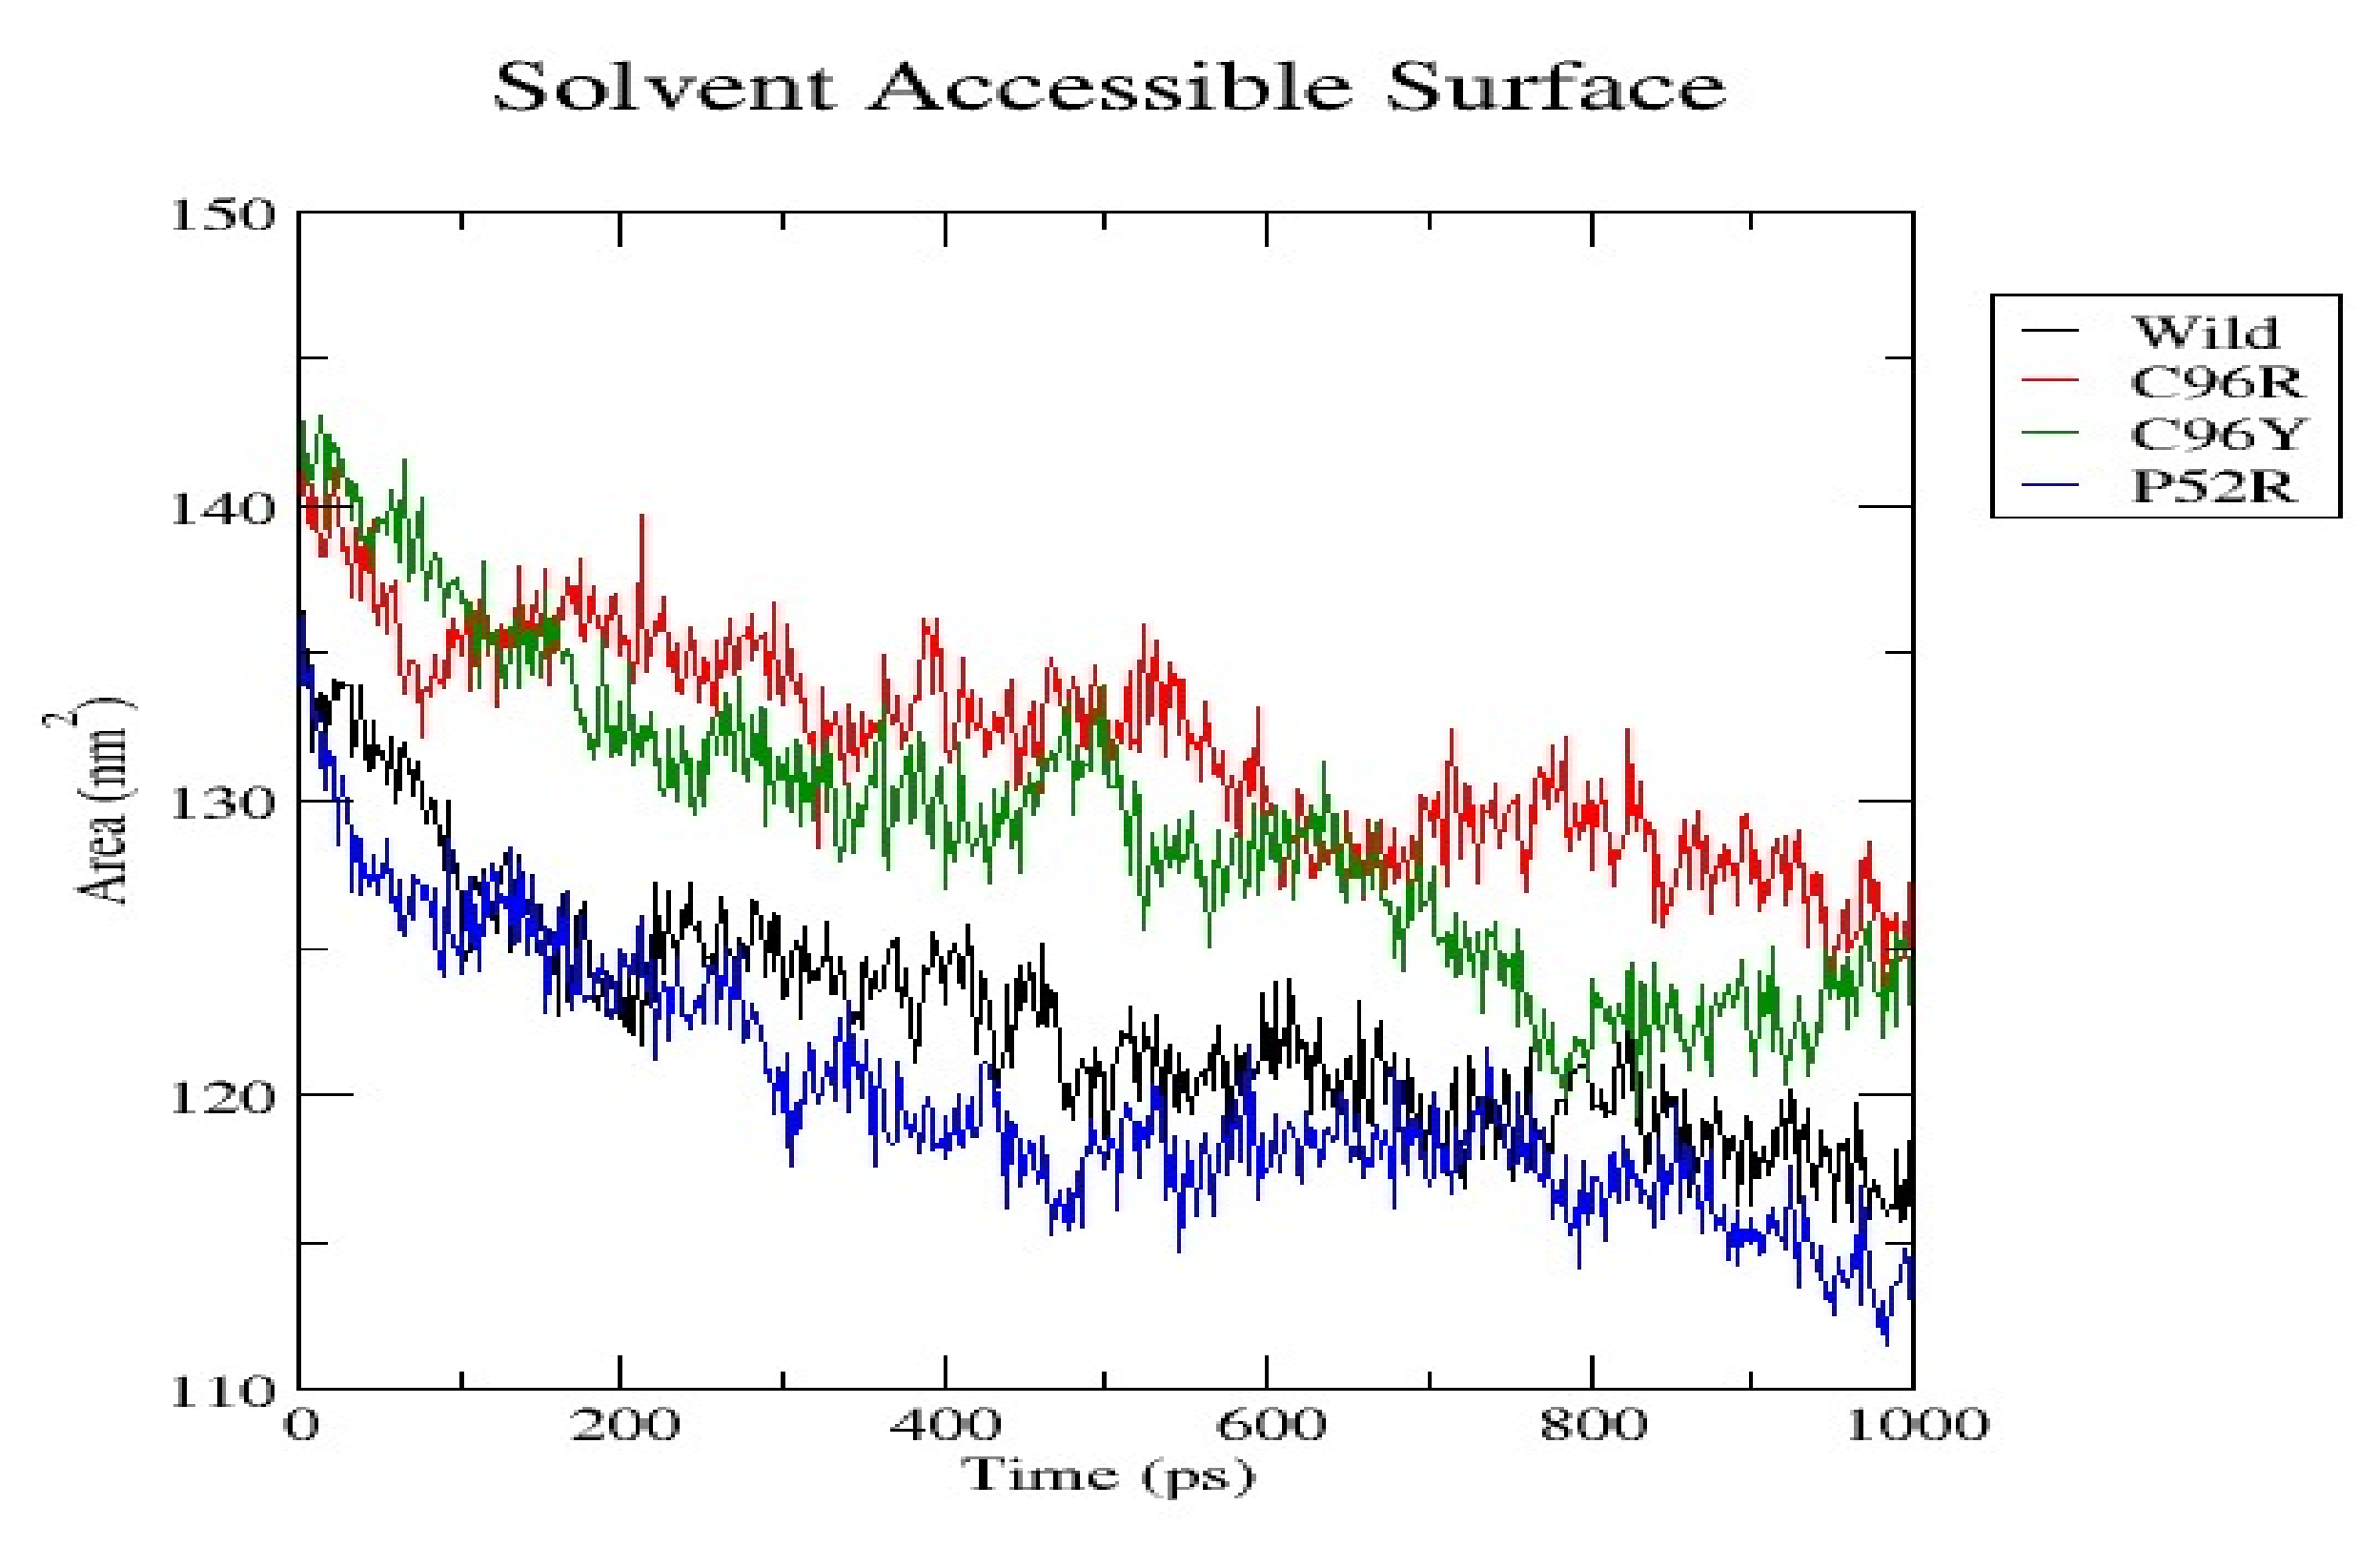
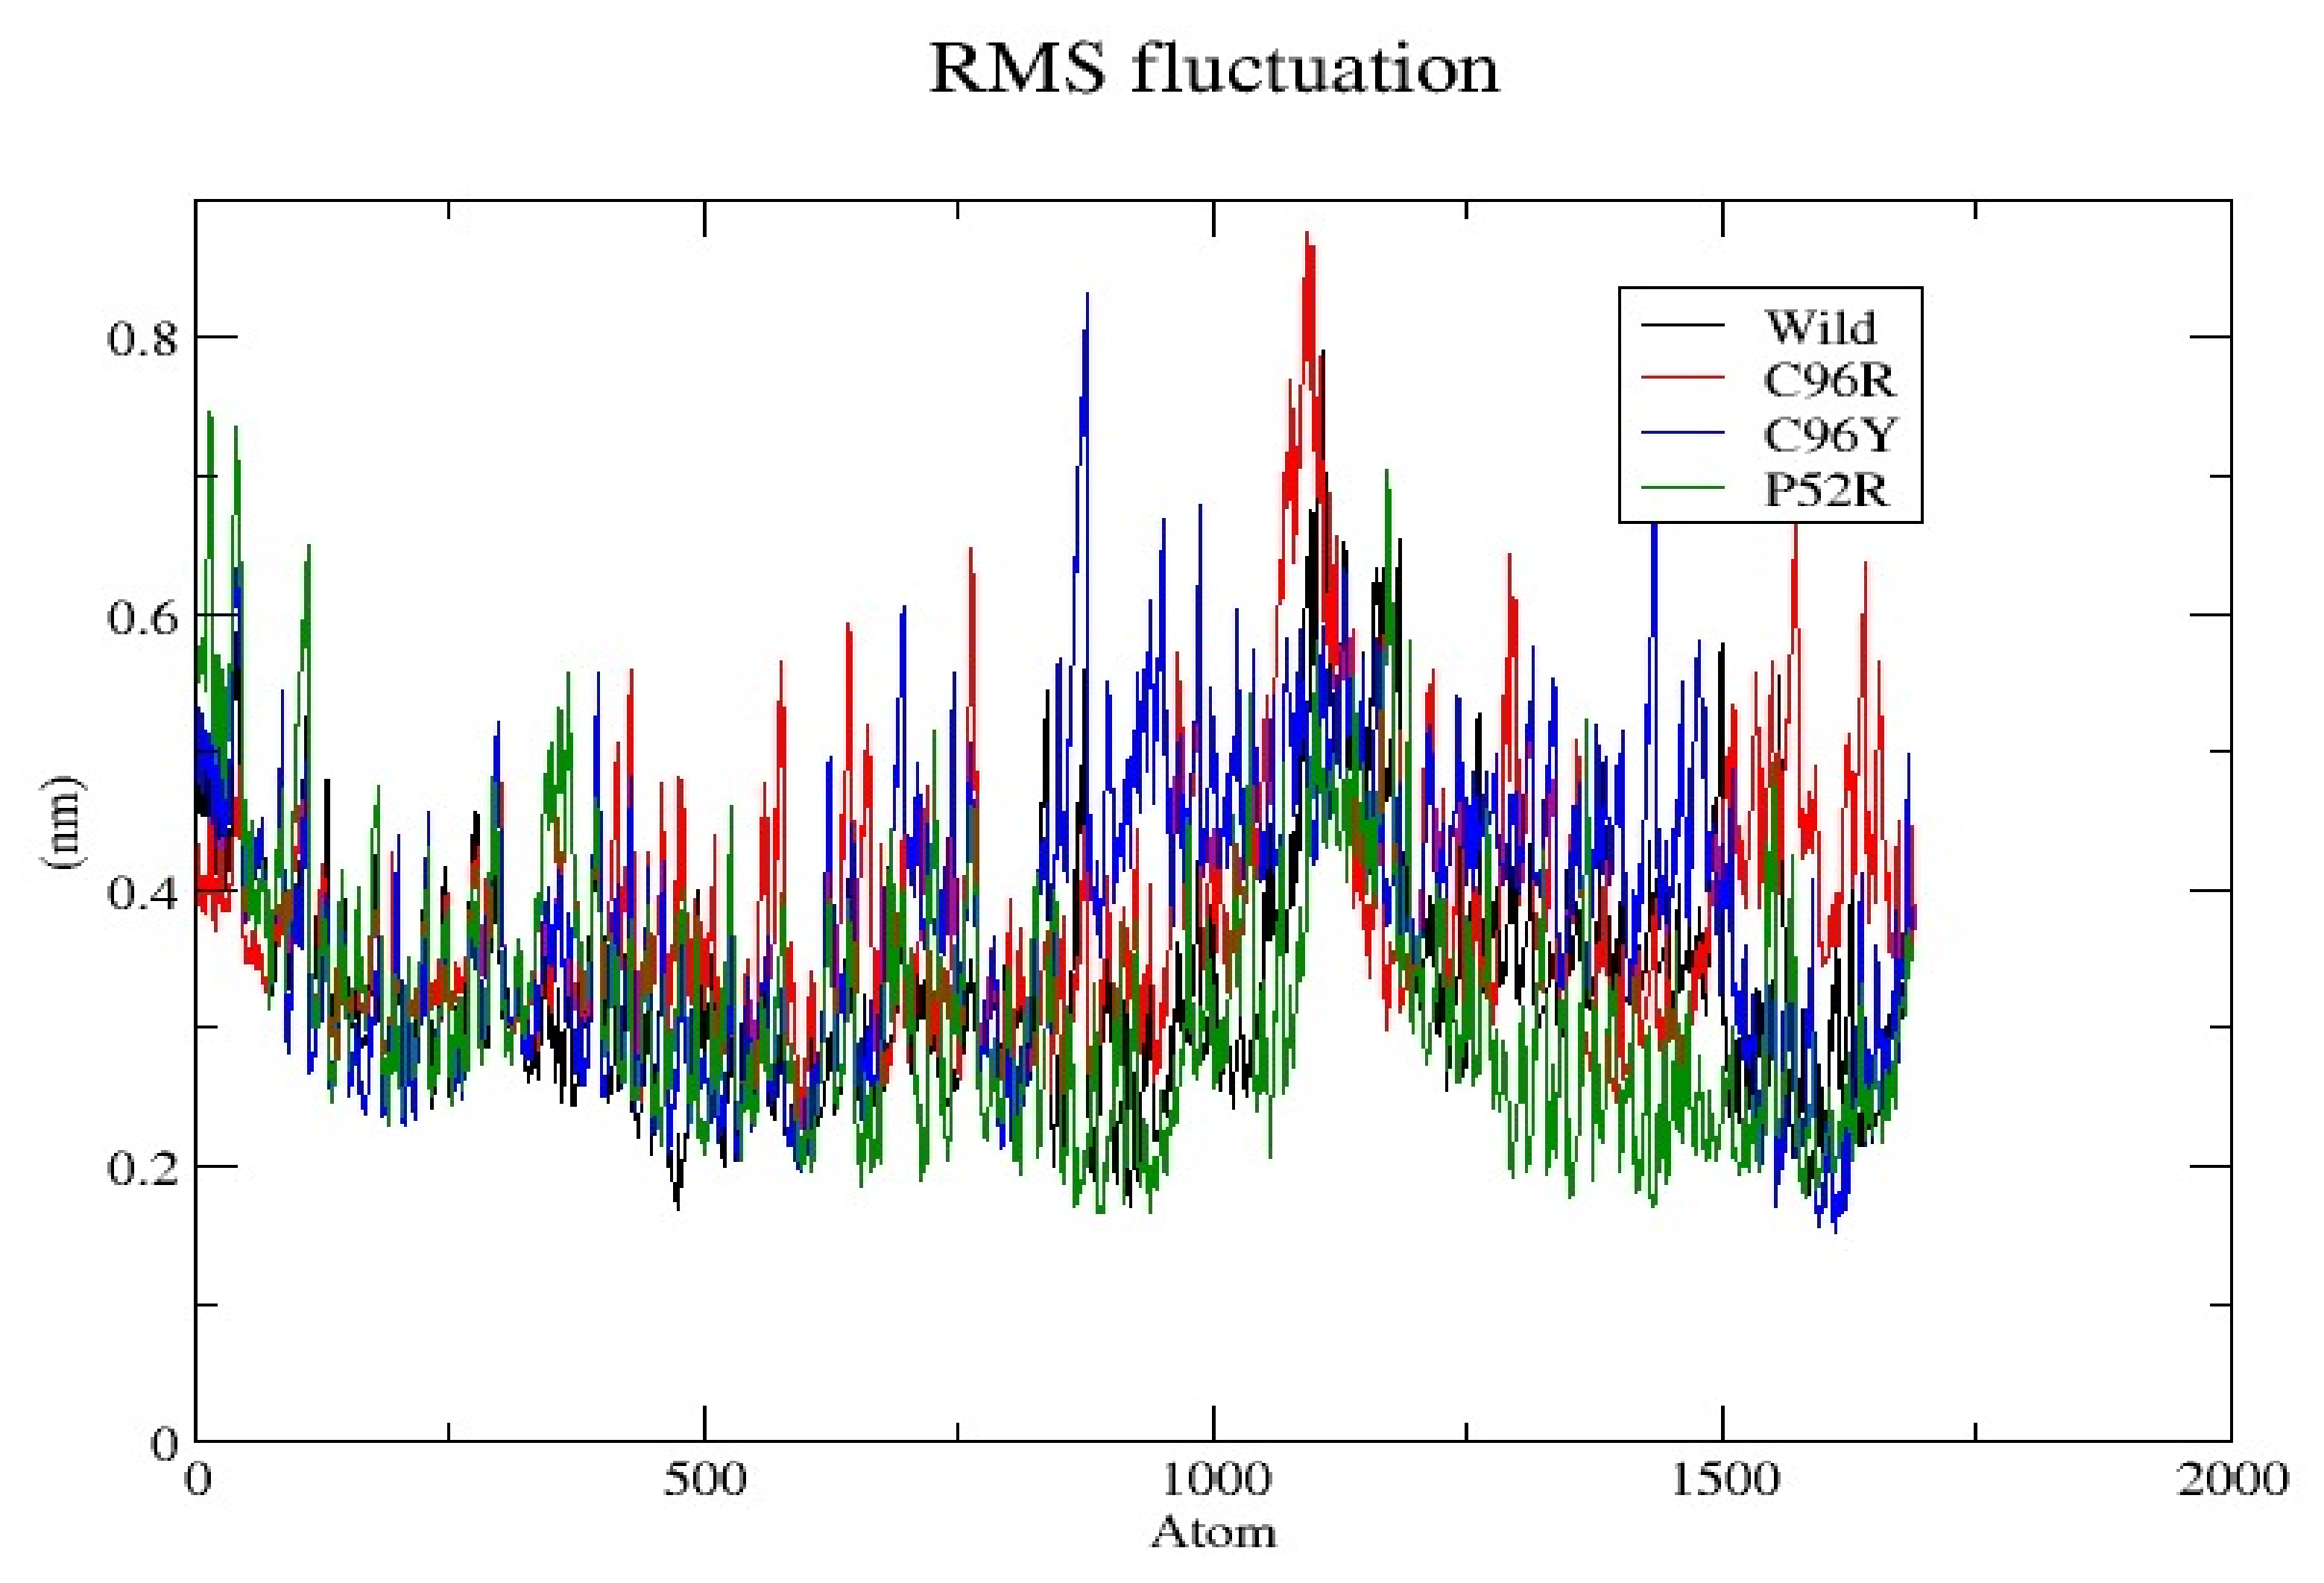
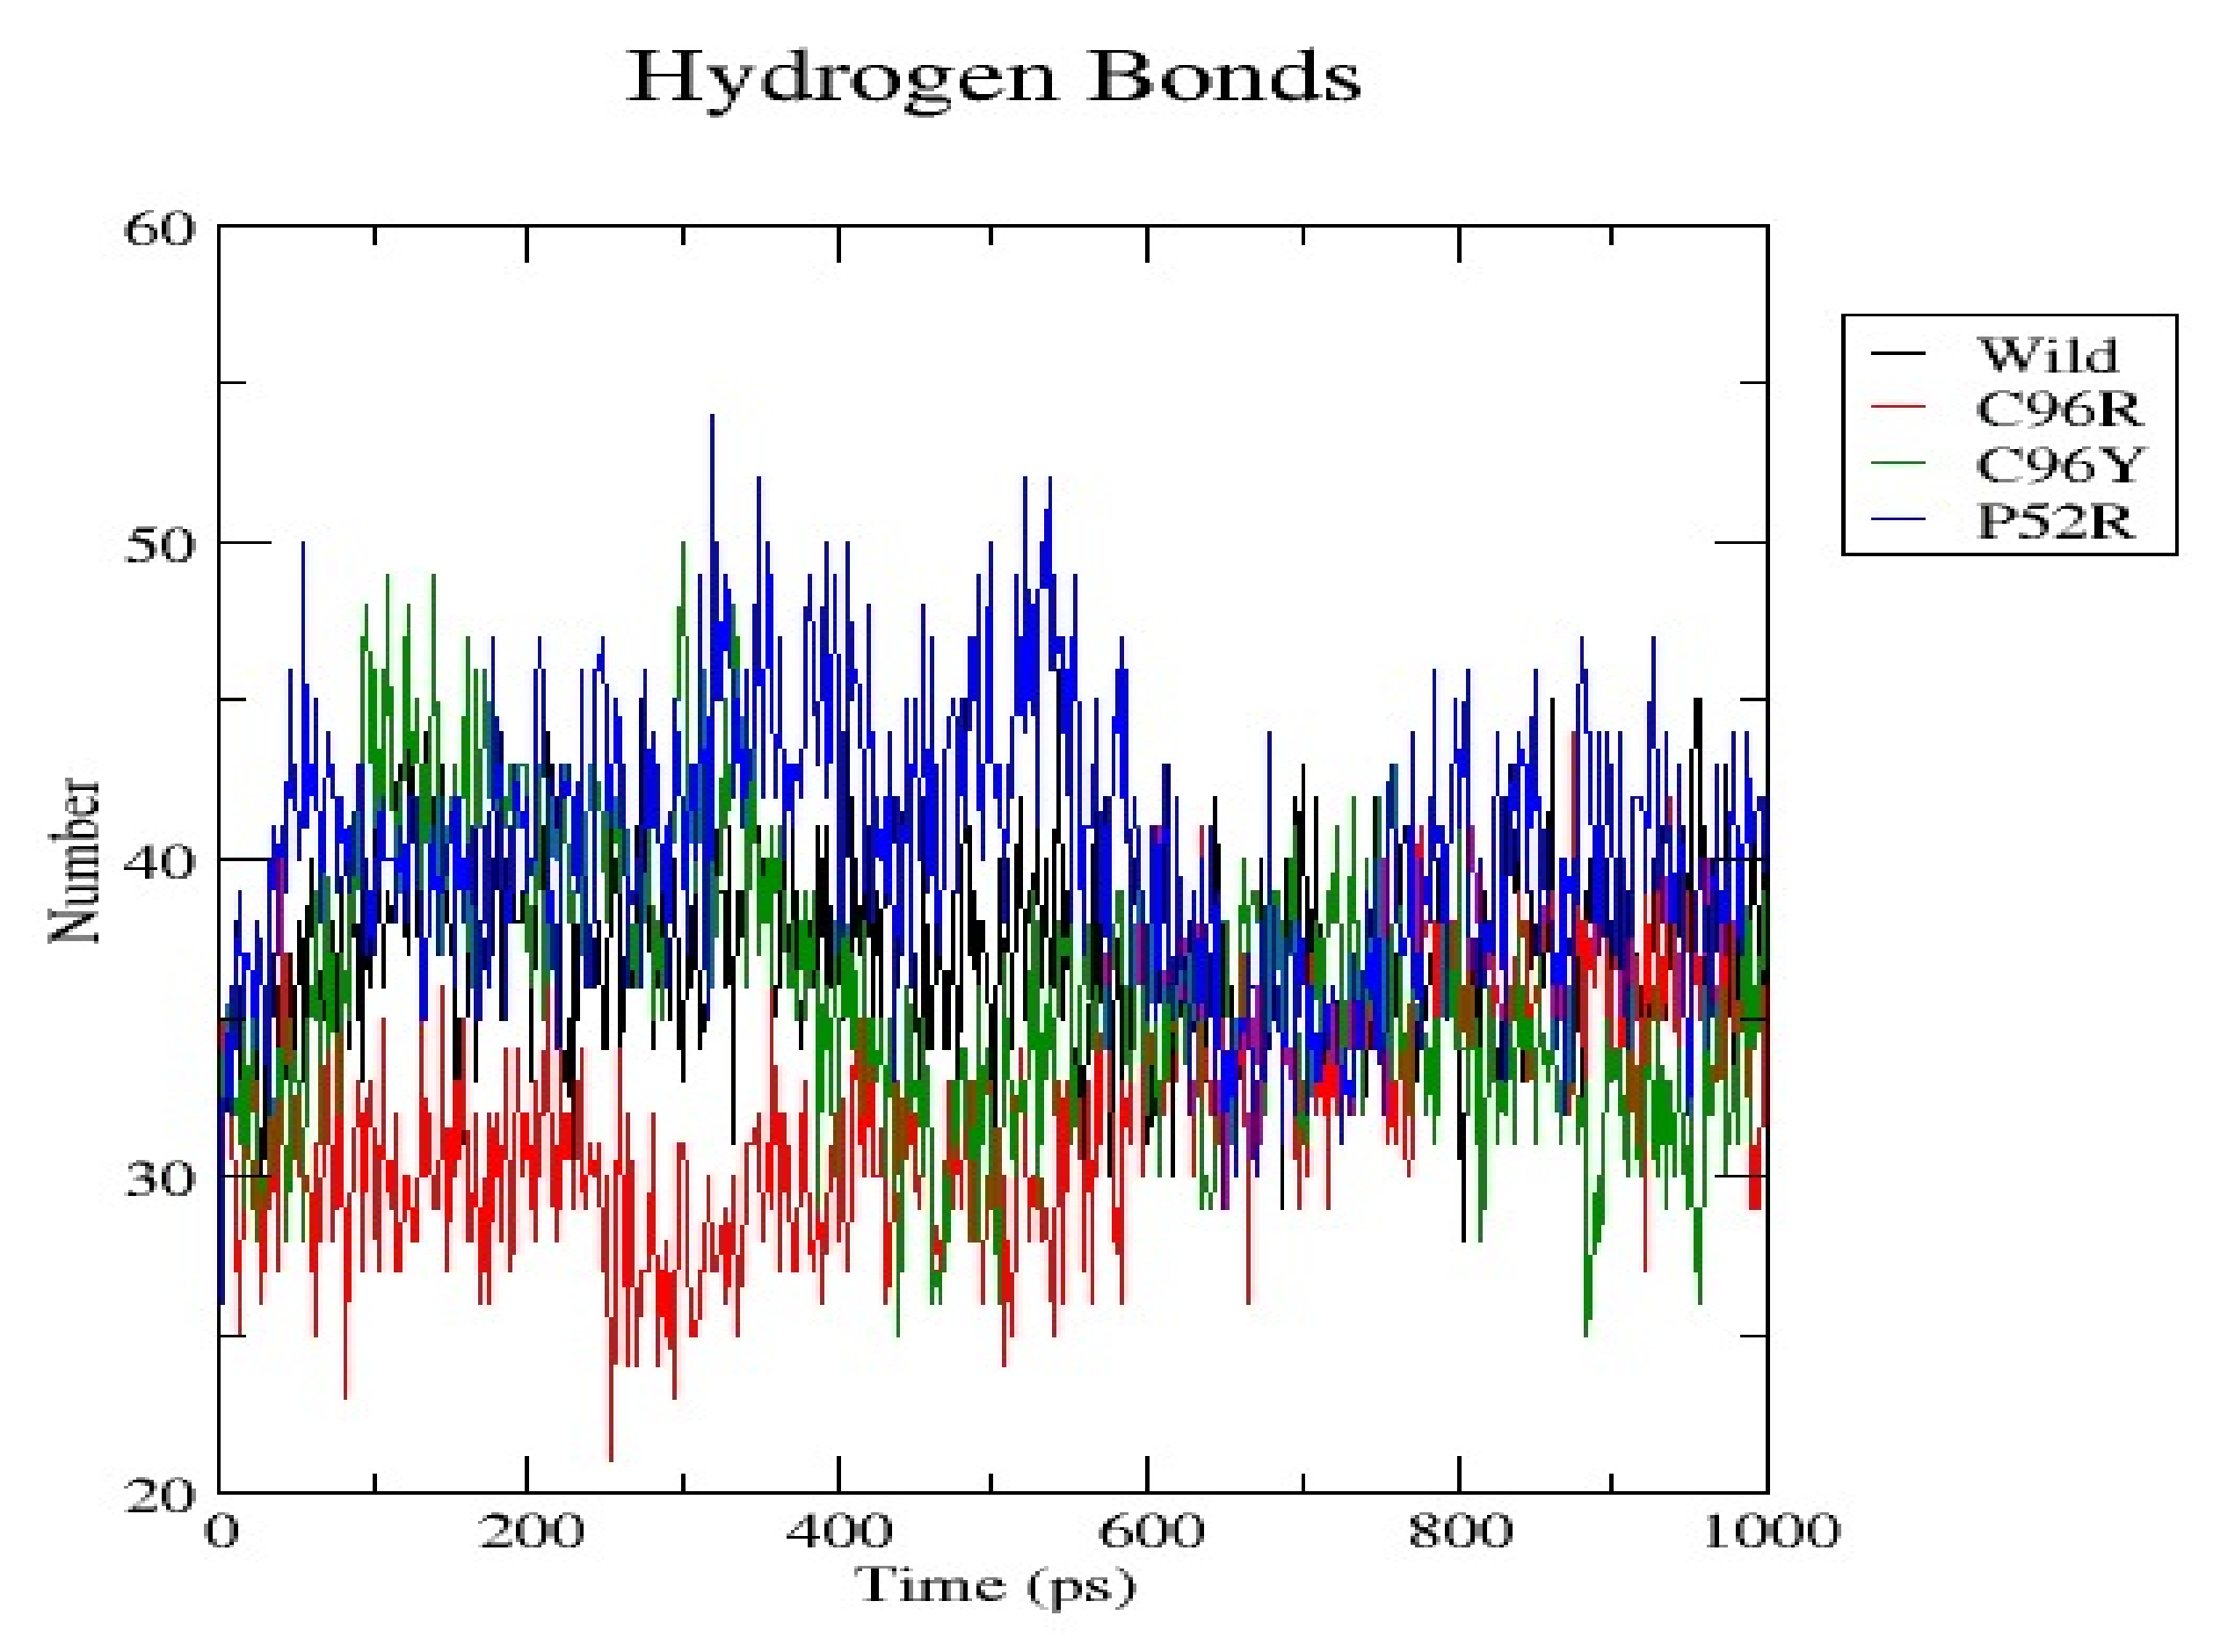
3.7. Molecular Dynamics Simulation (MDS) Results
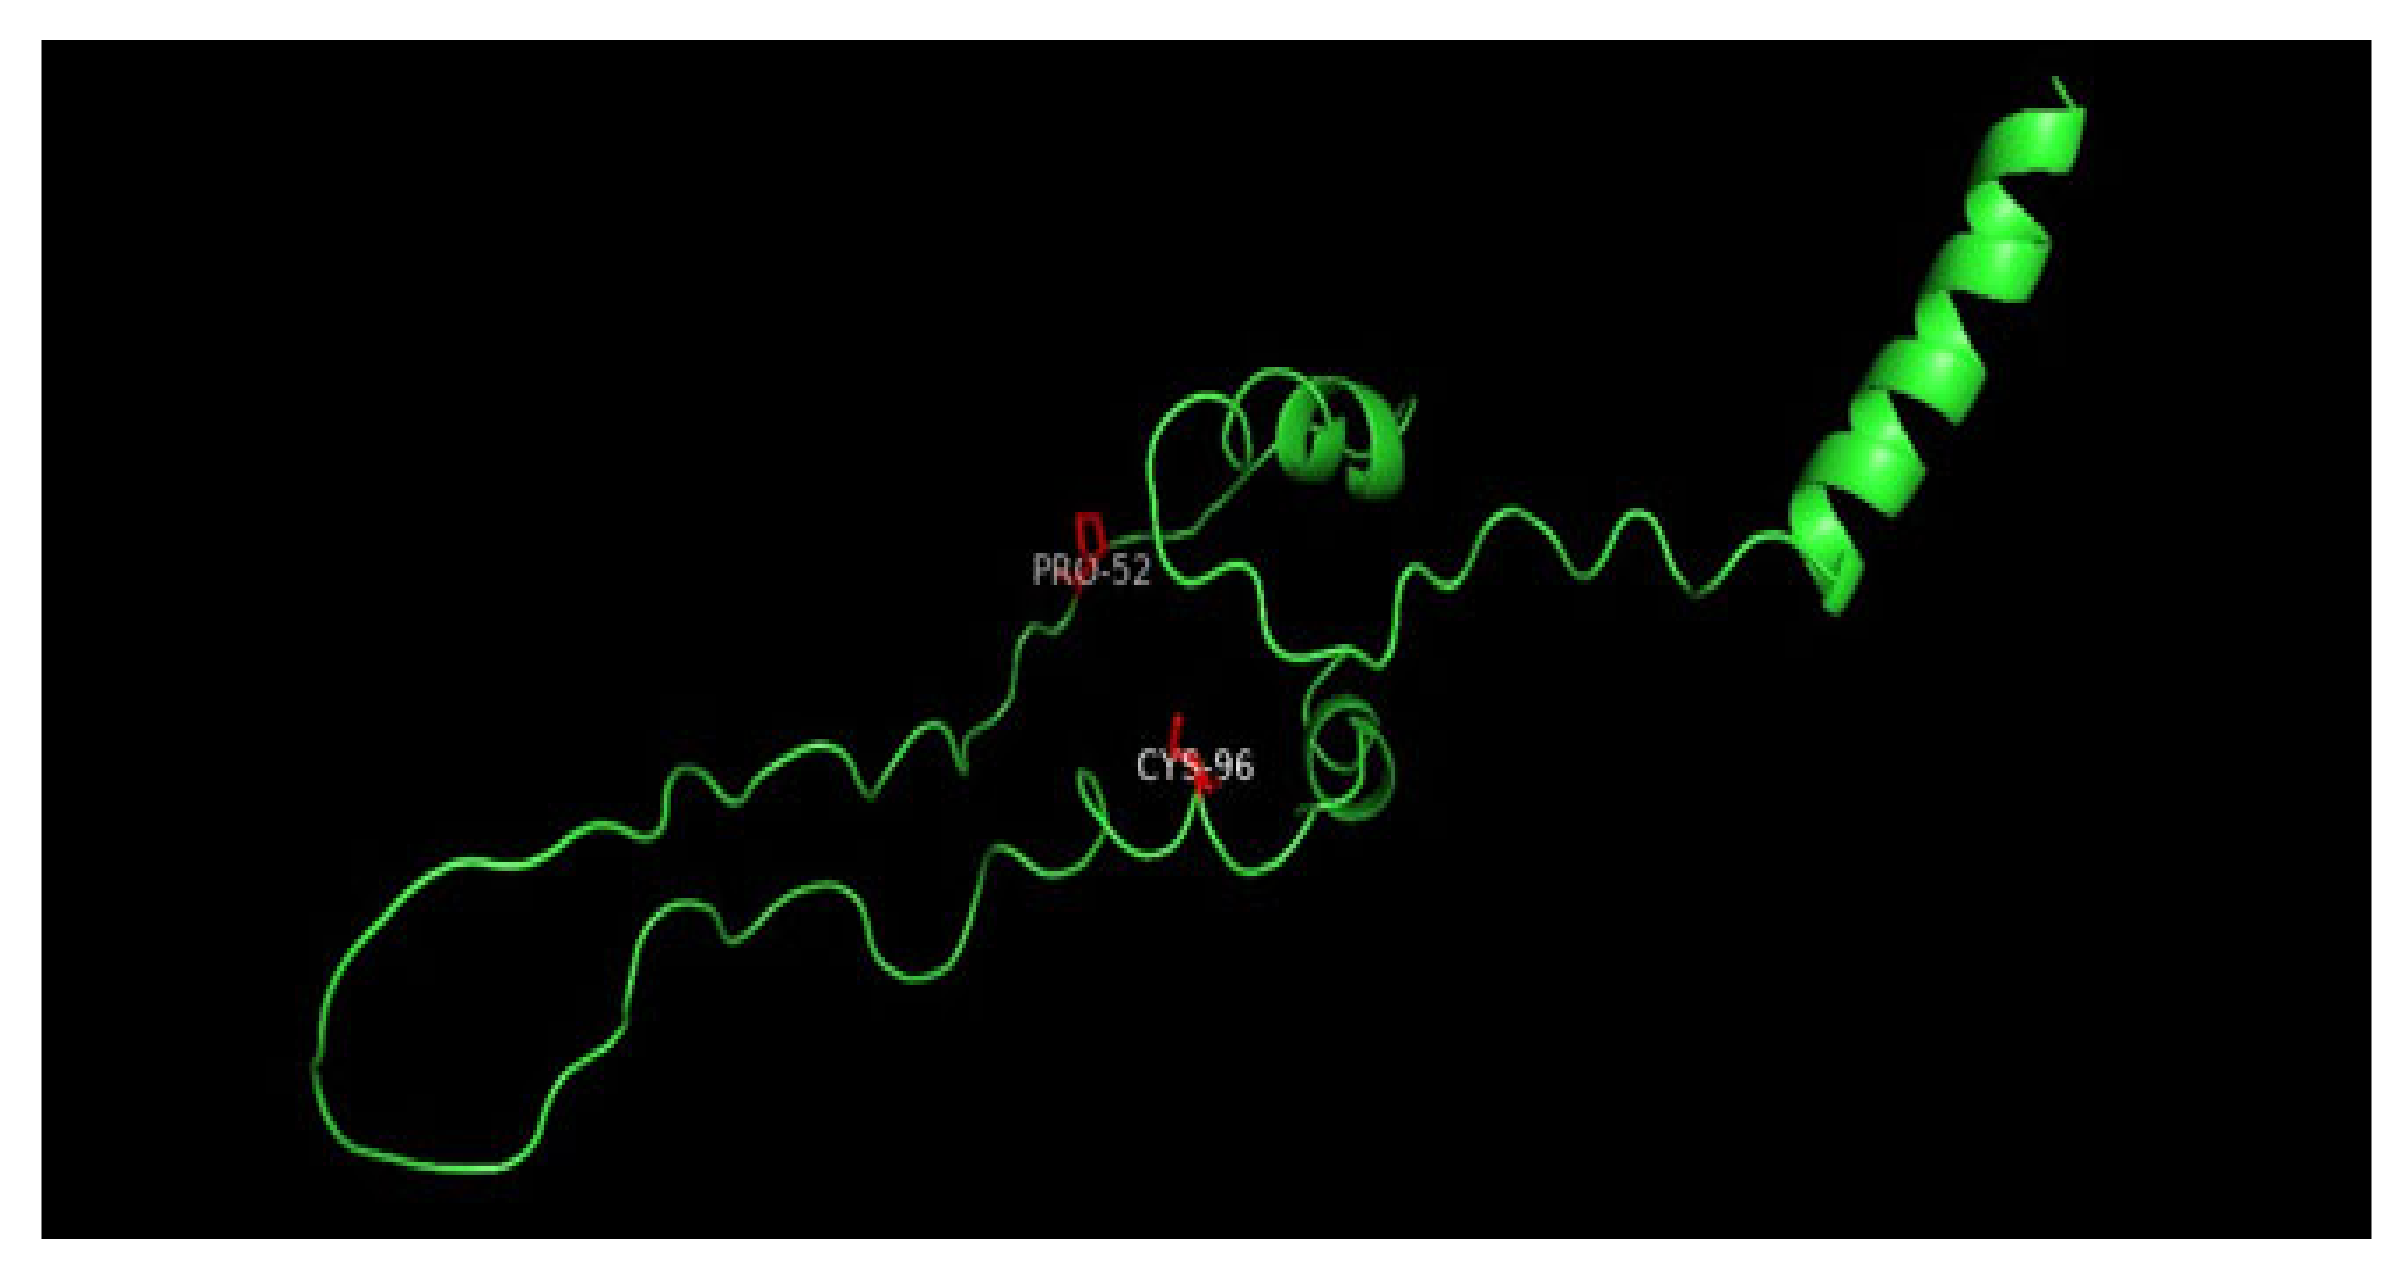
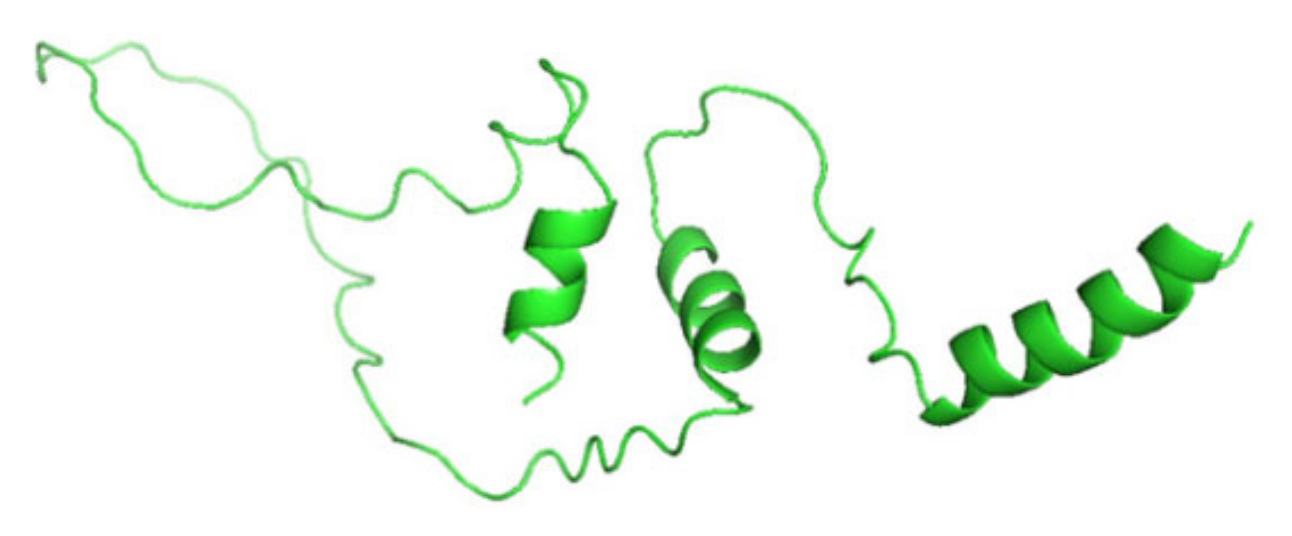
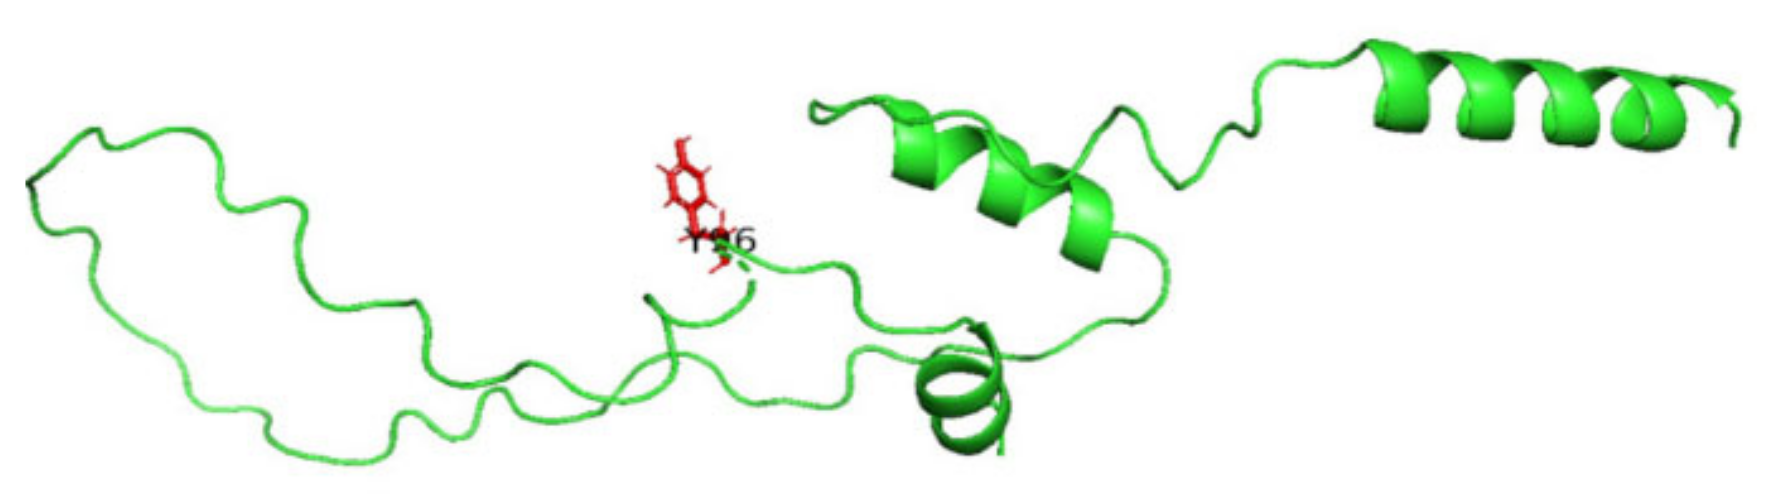
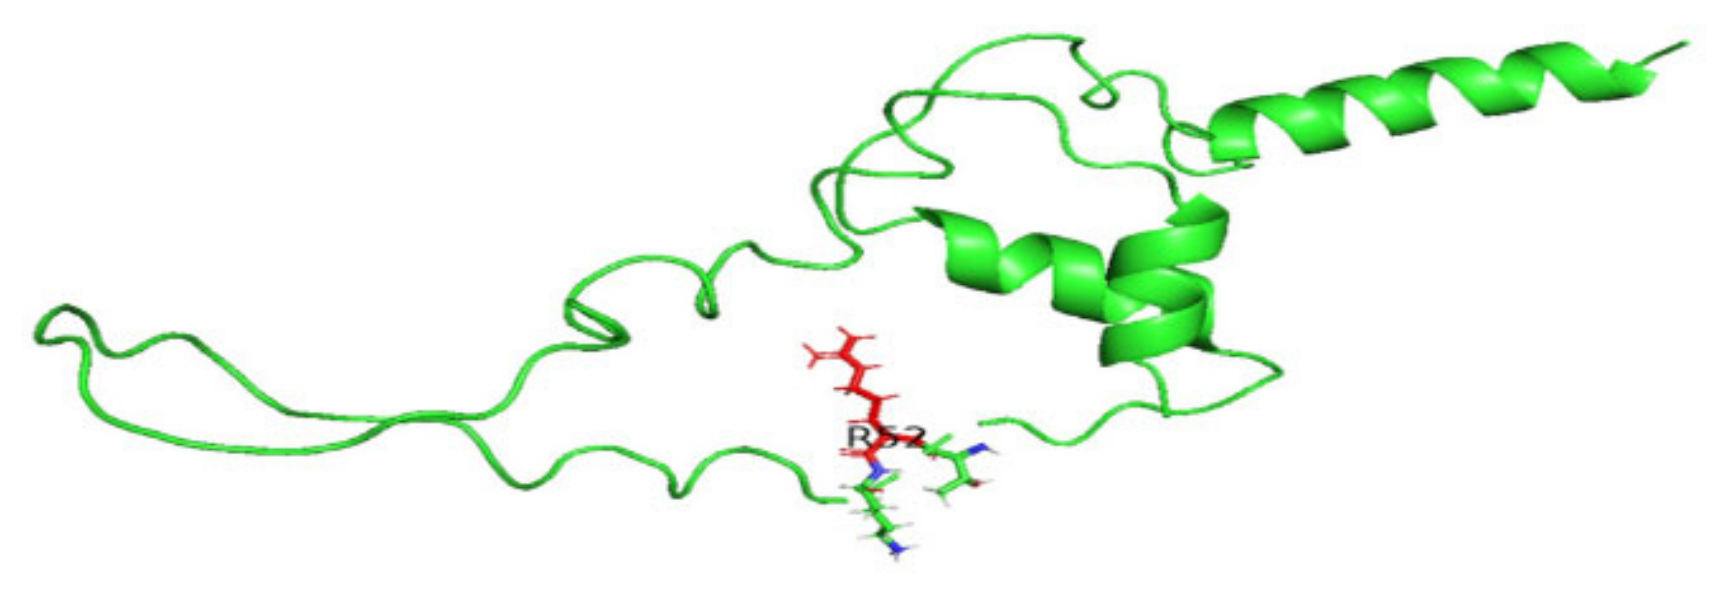
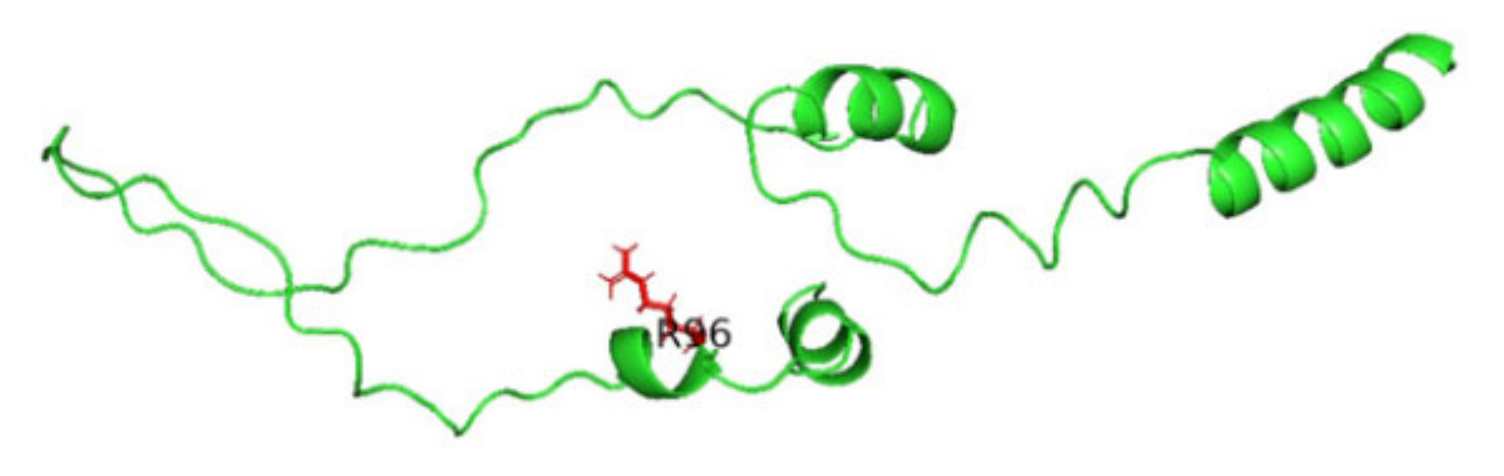
3.8. Displaying Three-Dimensional Structural Changes Using PyMol Software
4. Discussion
5. Conclusions
Author Contributions
Funding
Institutional Review Board Statement
Informed Consent Statement
Data Availability Statement
Acknowledgments
Conflicts of Interest
References
- Dilworth, L.; Facey, A.; Omoruyi, F. Diabetes Mellitus and Its Metabolic Complications: The Role of Adipose Tissues. Int. J. Mol. Sci. 2021, 22, 7644. [Google Scholar] [CrossRef]
- Wang, H.; Saint-Martin, C.; Xu, J.; Ding, L.; Wang, R.; Feng, W.; Liu, M.; Shu, H.; Fan, Z.; Haataja, L.; et al. Biological behaviors of mutant proinsulin contribute to the phenotypic spectrum of diabetes associated with insulin gene mutations. Mol. Cell. Endocrinol. 2020, 518, 111025. [Google Scholar] [CrossRef] [PubMed]
- Owerbach, D.; Bell, G.I.; Rutter, W.J.; Brown, J.A.; Shows, T.B. The insulin gene is located on the short arm of chromosome 11 in humans. Diabetes 1981, 30, 267–270. [Google Scholar] [CrossRef] [PubMed]
- Murthy, M.H.; Jasbi, P.; Lowe, W.; Kumar, L.; Olaosebikan, M.; Roger, L.; Yang, J.; Lewinski, N.; Daniels, N.; Cowen, L.; et al. Insulin signaling and pharmacology in humans and in corals. PeerJ 2024, 12, e16804. [Google Scholar] [CrossRef] [PubMed]
- Ataie-Ashtiani, S.; Forbes, B. A review of the biosynthesis and structural implications of insulin gene mutations linked to human disease. Cells 2023, 12, 1008. [Google Scholar] [CrossRef] [PubMed]
- Jamiołkowska-Sztabkowska, M.; Głowińska-Olszewska, B.; Bossowski, A. C-peptide and residual β-cell function in pediatric diabetes—State of the art. Pediatr. Endocrinol. Diabetes Metab. 2021, 27, 123–133. [Google Scholar] [CrossRef]
- Rorsman, P.; Ashcroft, F.M. Pancreatic β-Cell Electrical Activity and Insulin Secretion: Of Mice and Men. Physiol. Rev. 2018, 98, 117–214. [Google Scholar] [CrossRef]
- Liu, M.; Sun, J.; Cui, J.; Chen, W.; Guo, H.; Barbetti, F.; Arvan, P. INS-gene mutations: From genetics and beta cell biology to clinical disease. Mol. Asp. Med. 2015, 42, 3–18. [Google Scholar] [CrossRef] [PubMed]
- Balboa, D.; Saarimäki-Vire, J.; Borshagovski, D.; Survila, M.; Lindholm, P.; Galli, E.; Eurola, S.; Ustinov, J.; Grym, H.; Huopio, H.; et al. Insulin mutations impair beta-cell development in a patient-derived iPSC model of neonatal diabetes. eLife 2018, 7, e38519. [Google Scholar] [CrossRef] [PubMed]
- Haris, B.; Mohammed, I.; Al-Khawaga, S.; Hussain, K. Homozygous Insulin Promotor Gene Mutation Causing Permanent Neonatal Diabetes Mellitus and Childhood Onset Autoantibody Negative Diabetes in the Same Family. Int. Med. Case Rep. J. 2022, 15, 35–41. [Google Scholar] [CrossRef] [PubMed]
- Tikhonovich, Y.V.; Petryaykina, E.E.; Timofeev, A.V.; Zubkova, N.A.; Kolodkina, A.A.; Sorkina, E.L.; Vasiliev, E.V.; Petrov, V.M.; Andrianova, E.A.; Zilberman, L.I.; et al. Clinical, hormonal, and molecular-genetic characteristics of monogenic diabetes mellitus associated with the mutations in the INS gene. Diabetes Mellit. 2021, 24, 414–421. [Google Scholar] [CrossRef]
- Can, N.T.; Vu, D.C.; Bui, T.P.; Nguyen, K.N.; Nguyen, D.P.; Craig, M.; Ellard, S.; Nguyen, H.T. AB125. Neonatal diabetes mellitus due to insulin gene mutation. Ann. Transl. Med. 2015, 3 (Suppl. S2), AB125. [Google Scholar] [CrossRef]
- Bee, Y.M.; Zhao, Y.; Ellard, S.; Hattersley, A.T.; Yap, F. Permanent neonatal diabetes in siblings with novel C109Y INS mutation transmitted by an unaffected parent with somatic mosaicism. Pediatr. Diabetes 2014, 15, 324–328. [Google Scholar] [CrossRef] [PubMed]
- Al Shaikh, A.; Shirah, B.; Alzelaye, S. A homozygous mutation in the insulin gene (INS) causing autosomal recessive neonatal diabetes in Saudi families. Ann. Pediatr. Endocrinol. Metab. 2020, 25, 42. [Google Scholar] [CrossRef] [PubMed]
- Islam, M.J.; Parves, M.R.; Mahmud, S.; Tithi, F.A.; Reza, M.A. Assessment of structurally and functionally high-risk nsSNPs impacts on human bone morphogenetic protein receptor type IA (BMPR1A) by computational approach. Comput. Biol. Chem. 2019, 80, 31–45. [Google Scholar] [CrossRef] [PubMed]
- Sim, N.L.; Kumar, P.; Hu, J.; Henikoff, S.; Schneider, G.; Ng, P.C. SIFT web server: Predicting effects of amino acid substitutions on proteins. Nucleic Acids Res. 2012, 40, W452–W457. [Google Scholar] [CrossRef] [PubMed]
- Adzhubei, I.; Jordan, D.M.; Sunyaev, S.R. Predicting functional effect of human missense mutations using PolyPhen-2. Curr. Protoc. Hum. Genet. 2013, 76, 7–20. [Google Scholar] [CrossRef] [PubMed]
- Hecht, M.; Bromberg, Y.; Rost, B. Better prediction of functional effects for sequence variants. BMC Genom. 2015, 16, S1. [Google Scholar] [CrossRef] [PubMed]
- Manfredi, M.; Savojardo, C.; Martelli, P.L.; Casadio, R. E-SNPs&GO: Embedding of protein sequence and function improves the annotation of human pathogenic variants. Bioinformatics 2022, 38, 5168–5174. [Google Scholar] [PubMed]
- Capriotti, E.; Calabrese, R.; Casadio, R. Predicting the insurgence of human genetic diseases associated to single point protein mutations with support vector machines and evolutionary information. Bioinformatics 2006, 22, 2729–2734. [Google Scholar] [CrossRef] [PubMed]
- Pejaver, V.; Urresti, J.; Lugo-Martinez, J.; Pagel, K.A.; Lin, G.N.; Nam, H.J.; Mort, M.; Cooper, D.N.; Sebat, J.; Iakoucheva, L.M.; et al. Inferring the molecular and phenotypic impact of amino acid variants with MutPred2. Nat. Commun. 2020, 11, 5918. [Google Scholar] [CrossRef] [PubMed]
- Stenson, P.D.; Mort, M.; Ball, E.V.; Evans, K.; Hayden, M.; Heywood, S.; Hussain, M.; Phillips, A.D.; Cooper, D.N. The Human Gene Mutation Database: Towards a comprehensive repository of inherited mutation data for medical research, genetic diagnosis, and next-generation sequencing studies. Hum. Genet. 2017, 136, 665–677. [Google Scholar] [CrossRef] [PubMed]
- Bava, K.A.; Gromiha, M.M.; Uedaira, H.; Kitajima, K.; Sarai, A. ProTherm, version 4.0: Thermodynamic database for proteins and mutants. Nucleic Acids Res. 2004, 32, D120–D121. [Google Scholar] [CrossRef] [PubMed]
- Cheng, J.; Randall, A.; Baldi, P. Prediction of protein stability changes for single-site mutations using support vector machines. Proteins Struct. Funct. Bioinform. 2006, 62, 1125–1132. [Google Scholar] [CrossRef] [PubMed]
- Venselaar, H.; Te Beek, T.A.; Kuipers, R.K.; Hekkelman, M.L.; Vriend, G. Protein structure analysis of mutations causing inheritable diseases. An e-Science approach with life scientist friendly interfaces. BMC Bioinform. 2010, 11, 548. [Google Scholar] [CrossRef] [PubMed]
- Khetan, S.; Kursawe, R.; Youn, A.; Lawlor, N.; Jillette, A.; Marquez, E.J.; Ucar, D.; Stitzel, M.L. Type 2 Diabetes-Associated Genetic Variants Regulate Chromatin Accessibility in Human Islets. Diabetes 2018, 67, 2466–2477. [Google Scholar] [CrossRef] [PubMed]
- Kumar, P.; Henikoff, S.; Ng, P.C. A comprehensive evaluation of the SIFT and PolyPhen2 algorithms for predicting the impact of amino acid substitutions on protein function. Bioinformatics 2009, 25, 2843–2844. [Google Scholar]
- Ioannidis, N.M.; Rothstein, J.H.; Pejaver, V.; Middha, S.; McDonnell, S.K.; Baheti, S.; Musolf, A.; Li, Q.; Holzinger, E.; Karyadi, D.; et al. REVEL: An ensemble method for predicting the pathogenicity of rare missense variants. Am. J. Hum. Genet. 2016, 99, 877–885. [Google Scholar] [CrossRef] [PubMed]
- Martelotto, L.G.; Ng, C.K.; Piscuoglio, S.; Weigelt, B.; Reis-Filho, J.S. Breast cancer intra-tumor heterogeneity. Breast Cancer Res. 2014, 16, 210. [Google Scholar] [CrossRef] [PubMed]
- Bendl, J.; Stourac, J.; Salanda, O.; Pavelka, A.; Wieben, E.D.; Zendulka, J.; Brezovsky, J.; Damborsky, J. PredictSNP: Robust and accurate consensus classifier for prediction of disease-related mutations. PLoS Comput. Biol. 2014, 10, e1003440. [Google Scholar] [CrossRef] [PubMed]
- Khan, S.; Vihinen, M. Performance of protein stability predictors. Hum. Mutat. 2010, 31, 675–684. [Google Scholar] [CrossRef] [PubMed]
- Laurenzano, S.E.; McFall, C.; Nguyen, L.; Savla, D.; Coufal, N.G.; Wright, M.S.; Tokita, M.; Dimmock, D.; Kingsmore, S.F.; Newfield, R.S. Neonatal diabetes mellitus due to a novel variant in the INS gene. Mol. Case Stud. 2019, 5, a004085. [Google Scholar] [CrossRef] [PubMed]


| NCBI DATABASE | SIFT | PolyPhen-2 | SNAP2 | ||||||
|---|---|---|---|---|---|---|---|---|---|
| Variant ID | Allele | MAF | Mutation | Prediction | Score | Prediction | Score | Prediction | Accuracy % |
| rs28933985 | C|G | T = 0./0 | R89P | deleterious | 0.00 | Probably | 1.00 | 74/85 | 85% |
| rs28933985 | C|T | T = 0./0 | R89H | deleterious | 0.00 | Probably | 1.00 | 68/80 | 80% |
| rs80356664 | C|G | T = 0./0 | G32R | deleterious | 0.00 | Probably | 1.00 | 95/95 | 95% |
| rs80356664 | C|T | T = 0./0 | G32S | deleterious | 0.00 | Probably | 1.00 | 88//91 | 91% |
| rs80356666 | A|C | C = 0./0 | C43G | deleterious | 0.00 | Probably | 1.00 | 86/91 | 91% |
| rs80356667 | C|A | A = 0./0 | G47V | deleterious | 0.00 | Probably | 1.00 | 85/91 | 91% |
| rs80356668 | A|C | C = 0./0 | F48C | deleterious | 0.00 | Probably | 1.00 | 81/91 | 91% |
| rs80356668 | A|G | C = 0./0 | F48S | deleterious | 0.00 | Probably | 1.00 | 89/91 | 91% |
| rs80356669 | G|A | NA | R89C | deleterious | 0.00 | Probably | 1.00 | 62/80 | 80% |
| rs80356670 | C|A | A = 0./0 | G90C | deleterious | 0.00 | Probably | 1.00 | 65//80 | 80% |
| rs80356671 | C|G | T = 0./0 | C96S | deleterious | 0.01 | Probably | 0.995 | 81/91 | 91% |
| rs80356671 | C|T | T = 0./0 | C96Y | deleterious | 0.00 | Probably | 1.00 | 87/91 | 91% |
| rs80356672 | T|C | C = 0./0 | Y108C | deleterious | 0.00 | Probably | 1.00 | 78/85 | 85% |
| rs121908261 | G|A | A = 0./0 | R55C | deleterious | 0.00 | Probably | 1.00 | 61/80 | 80% |
| rs121908272 | G|C | NA | H29D | deleterious | 0.01 | Probably | 1.00 | 78/85 | 85% |
| rs121908273 | A|G | T = 0./0 | L35P | deleterious | 0.00 | Probably | 1.00 | 96/95 | 95% |
| rs121908273 | A|T | T = 0./0 | L35Q | deleterious | 0.00 | Probably | 1.00 | 91/95 | 95% |
| rs121908276 | G|C | NA | S101C | deleterious | 0.00 | Probably | 1.00 | 54/75 | 75% |
| rs121908277 | T|C | NA | Y103C | deleterious | 0.02 | Probably | 1.00 | 55/75 | 75% |
| rs121918102 | C|A | NA | V92L | deleterious | 0.00 | Probably | 1.00 | 77/85 | 85% |
| rs145038693 | G|A | C = 0./0 | P52L | deleterious | 0.00 | Probably | 1.00 | 73/85 | 85% |
| rs145038693 | G|C | C = 0./0 | P52R | deleterious | 0.00 | Probably | 0.998 | 77/85 | 85% |
| rs145038693 | G|T | C = 0./0 | P52H | deleterious | 0.00 | Probably | 1.00 | 75/85 | 85% |
| rs148685531 | G|C | A = 0.000142/2 | F49L | deleterious | 0.00 | Probably | 0.994 | 81/91 | 91% |
| rs397515521 | C|A | NA | M1I | deleterious | 0.00 | Probably | 0.981 | 77/85 | 85% |
| rs397515521 | C|T | NA | M1I | deleterious | 0.00 | Probably | 0.981 | 77/85 | 85% |
| rs765512575 | C|T | T = 0.000105/2 | G44R | deleterious | 0.00 | Probably | 0.996 | 86/91 | 91% |
| rs1057524907 | T|C | NA | E93G | deleterious | 0.01 | Probably | 0.979 | 77/85 | 85% |
| rs1252051752 | T|A | NA | S98C | deleterious | 0.04 | Probably | 0.996 | 37/66 | 66% |
| rs1278232284 | G|A | A = 0.000004/1 | L35V | deleterious | 0.00 | Probably | 1.00 | 75/85 | 85% |
| rs1278232284 | G|C | A = 0.000004/1 | L35M | deleterious | 0.00 | Probably | 1.00 | 77/85 | 85% |
| rs1564912274 | T|C | C = 0.000004/1 | H34R | deleterious | 0.00 | Probably | 0.997 | 64/80 | 80% |
| rs1564912274 | T|G | C = 0.000004/1 | H34P | deleterious | 0.00 | Probably | 0.999 | 82/91 | 91% |
| rs1845839718 | A|G | NA | C96R | deleterious | 0.00 | Probably | 1.00 | 90/95 | 95% |
| rs2133672742 | C|A | NA | C109F | deleterious | 0.00 | Probably | 1.00 | 83//91 | 91% |
| rs2133672778 | A|C | NA | Y108D | deleterious | 0.00 | Probably | 1.00 | 90/95 | 95% |
| rs2133676660 | G|A | NA | L39F | deleterious | 0.00 | Probably | 1.00 | 72/85 | 85% |
| rs2133676747 | C|A | NA | G32V | deleterious | 0.00 | Probably | 1.00 | 88/91 | 91% |
| rs2133676771 | A|C | NA | C31G | deleterious | 0.00 | Probably | 1.00 | 90//95 | 95% |
| rs28933985 | C|T | T = 0./0 | R89H | deleterious | 0.00 | Probably | 1.00 | 68/80 | 80% |
| rs80356664 | C|G | T = 0./0 | G32R | deleterious | 0.00 | Probably | 1.00 | 95/95 | 95% |
| rs80356664 | C|T | T = 0./0 | G32S | deleterious | 0.00 | Probably | 1.00 | 88/91 | 91% |
| rs80356666 | A|C | C = 0./0 | C43G | deleterious | 0.00 | Probably | 1.00 | 86//91 | 91% |
| rs80356667 | C|A | A = 0./0 | G47V | deleterious | 0.00 | Probably | 1.00 | 85/91 | 91% |
| rs80356668 | A|C | C = 0./0 | F48C | deleterious | 0.00 | Probably | 1.00 | 78/85 | 85% |
| rs80356668 | A|G | C = 0./0 | F48S | deleterious | 0.00 | Probably | 1.00 | 77/85 | 85% |
| rs80356669 | G|A | NA | R89C | deleterious | 0.00 | Probably | 1.00 | 62/80 | 80% |
| rs80356670 | C|A | A = 0./0 | G90C | deleterious | 0.00 | Probably | 1.00 | 65/80 | 80% |
| rs80356671 | C|G | T = 0./0 | C96S | deleterious | 0.01 | Probably | 0.995 | 81/91 | 91% |
| rs80356672 | T|C | C = 0./0 | Y108C | deleterious | 0.00 | Probably | 1.00 | 78/85 | 85% |
| rs11557614 | G|A | A = 0./0 | A38V | deleterious | 0.01 | Probably | 0.991 | 70/85 | 85% |
| rs144093133 | C|A | T = 0.000061/6 | G75V | deleterious | 0.00 | Probably | 0.999 | 38/66 | 66% |
| rs202244834 | T|G | G = 0./0 | K53T | deleterious | 0.02 | Probably | 0.963 | 54/75 | 75% |
| rs760425445 | C|T | T = 0.000004/1 | G90D | deleterious | 0.00 | Probably | 0.987 | 80/91 | 91% |
| rs781016664 | G|A | A = 0.000012/3 | R56W | deleterious | 0.00 | Probably | 1.00 | 76/85 | 85% |
| rs983508038 | C|T | T = 0.000004/1 | R56Q | deleterious | 0.00 | Probably | 1.00 | 57/75 | 75% |
| rs1182567488 | T|G | G = 0.000071/1 | Q28H | deleterious | 0.00 | Probably | 0.995 | 58/75 | 75% |
| rs1184417816 | C|T | T = 0.000111/1 | R55H | deleterious | 0.02 | Probably | 1.00 | 60/80 | 80% |
| rs1213888316 | A|G | G = 0./0 | L11P | deleterious | 0.00 | Probably | 0.994 | 61/80 | 80% |
| rs1313322794 | C|G | G = 0.000004/1 | G47R | deleterious | 0.00 | Probably | 1.00 | 91/95 | 95% |
| rs1313490068 | A|G | G = 0.000224/1 | L13P | deleterious | 0.00 | Probably | 0.997 | 83/91 | 91% |
| rs1460766978 | G|A | A = 0./0 | P52S | deleterious | 0.00 | Probably | 1.00 | 64/80 | 80% |
| rs1460766978 | G|T | A = 0./0 | P52T | deleterious | 0.00 | Probably | 1.00 | 67/80 | 80% |
| rs1845838687 | T|C | C = 0./0 | Q104R | deleterious | 0.02 | Probably | 0.976 | 59/75 | 75% |
| rs1845873763 | C|T | T = 0.00005/1 | E59K | deleterious | 0.02 | Probably | 0.986 | 35/66 | 66% |
| rs1845879949 | A|T | T = 0./0 | L14Q | deleterious | 0.00 | Probably | 1.00 | 61/80 | 80% |
| rs2133677126 | A|T | T = 0.00007/2 | M1K | deleterious | 0.00 | Probably | 0.995 | 94/95 | 95% |
| NCBI DATABASE | SNPs & GO | PhD-SNP. | ||||
|---|---|---|---|---|---|---|
| Variant ID | Allele | Mutation | Prediction | SCORE | Prediction | SCORE |
| rs28933985 | C|G | R89P | DISESASE | 10 | DISESASE | 2 |
| rs80356671 | C|T | C96Y | DISESASE | 10 | DISESASE | 1 |
| rs121908273 | A|G | L35P | DISESASE | 10 | DISESASE | 3 |
| rs145038693 | G|A | P52L | DISESASE | 10 | DISESASE | 1 |
| rs145038693 | G|C | P52R | DISESASE | 10 | DISESASE | 2 |
| rs145038693 | G|T | P52H | DISESASE | 9 | DISESASE | 1 |
| rs765512575 | C|T | G44R | DISESASE | 10 | DISESASE | 0 |
| rs1564912274 | T|C | H34R | DISESASE | 10 | DISESASE | 2 |
| rs1564912274 | T|G | H34P | DISESASE | 10 | DISESASE | 1 |
| rs1845839718 | A|G | C96R | DISESASE | 10 | DISESASE | 5 |
| rs1460766978 | G|A | P52S | DISESASE | 10 | DISESASE | 0 |
| rs1845879949 | A|T | L14Q | DISESASE | 9 | DISESASE | 5 |
| NCBI DATABASE | MUTPRED2 | |||
|---|---|---|---|---|
| Variant ID | Allele | Mutation | EFFECT | SCORE |
| rs28933985 | C|G | R89P | Affect | 0.791 |
| rs80356671 | C|T | C96Y | Affect | 0.860 |
| rs121908273 | A|G | L35P | Affect | 0.925 |
| rs145038693 | G|C | P52R | Affect | 0.570 |
| rs765512575 | C|T | G44R | Affect | 0.716 |
| rs1564912274 | T|G | H34P | Affect | 0.663 |
| rs1845839718 | A|G | C96R | Affect | 0.910 |
| rs1845879949 | A|T | L14Q | Affect | 0.627 |
| NCBI DATABASE | I-MUTANT | MuPro | ||||
|---|---|---|---|---|---|---|
| Variant ID | Allele | Mutation | Stability | Reliability Index | EFFECT | Confidence Score |
| rs28933985 | C|G | R89P | DECREASE | 5 | Increase | 0.078515012 |
| rs80356671 | C|T | C96Y | DECREASE | 4 | Decrease | −0.080856117 |
| rs121908273 | A|G | L35P | DECREASE | 4 | Increase | 0.065423903 |
| rs145038693 | G|C | P52R | DECREASE | 0 | Decrease | −1.0 |
| rs765512575 | C|T | G44R | DECREASE | 1 | Increase | 0.49104088 |
| rs1845839718 | A|G | C96R | DECREASE | 8 | Decrease | −0.574683230494305 |
| rs1845879949 | A|T | L14Q | DECREASE | 8 | Decrease | −0.62610731178958 |
| Variant ID | rs145038693 | rs80356671 | rs1845839718 | rs1845879949 |
|---|---|---|---|---|
| Mutations | P52R | C96Y | C96R | L14Q |
| Proline into Arginine at position 52 | Cysteine into Tyrosine at position 96 | Cysteine into Arginine at position 96 | Leucine into Glutamine at position 14 | |
| Allele | G|C | C|T | A|G | A|T |
| Amino Acids Properties | ||||
| Size | The mutant residue is bigger than the wild-type residue. | The mutant residue is bigger than the wild-type residue. | The mutant residue is bigger than the wild-type residue | The mutant residue is bigger than the wild-type residue. |
| Hydrophobicity value | Wild-type residue is more hydrophobic than the mutant residue. | Wild-type residue is more hydrophobic than the mutant residue. | Wild-type residue is more hydrophobic than the mutant residue | Wild-type residue is more hydrophobic than the mutant residue. |
| Charge | Wild-type residue charge was NEUTRAL | No change | Wild-type residue charge was NEUTRAL | No change |
| Mutant residue charge was POSITIVE | --- | Mutant residue charge was POSITIVE. | ---- | |
| Variant’s score | 0.90322566 | 0.9947578 | 0.9939898 | 0.8815106 |
| Conservation | Mutant and wild-type residues were not very similar | Wild-type residue was very conserved | Wild-type residue was very conserved | Wild-type residue was very conserved |
| The mutant residue was located near a highly conserved position | The mutant residue was located near a highly conserved position | Mutant residue was located near a highly conserved position | ||
| Effect of mutation on protein | Probably damaging to the protein. | Probably damaging to the protein. | Probably damaging to the protein. | Mutation occurs without damaging the protein |
| Studies on INS Gene Mutations Associated with PNDM | ||||
|---|---|---|---|---|
| This Study | Laurenzano et al. 2019 [32] | Balboa et al. 2018 [9] | Liu et al. 2015 [8] | |
| Mutations | P52R | P9R | C96R | L13R |
| C96R | C109Y | |||
| C96Y | ||||
Disclaimer/Publisher’s Note: The statements, opinions and data contained in all publications are solely those of the individual author(s) and contributor(s) and not of MDPI and/or the editor(s). MDPI and/or the editor(s) disclaim responsibility for any injury to people or property resulting from any ideas, methods, instructions or products referred to in the content. |
© 2024 by the authors. Licensee MDPI, Basel, Switzerland. This article is an open access article distributed under the terms and conditions of the Creative Commons Attribution (CC BY) license (https://creativecommons.org/licenses/by/4.0/).
Share and Cite
Ahmed, E.M.; Elangeeb, M.E.; Adam, K.M.; Abuagla, H.A.; MohamedAhmed, A.A.E.; Ali, E.W.; Eltieb, E.I.; Edris, A.M.; Ali Osman, H.M.; Idris, E.S.; et al. Computational Analysis of Deleterious nsSNPs in INS Gene Associated with Permanent Neonatal Diabetes Mellitus. J. Pers. Med. 2024, 14, 425. https://doi.org/10.3390/jpm14040425
Ahmed EM, Elangeeb ME, Adam KM, Abuagla HA, MohamedAhmed AAE, Ali EW, Eltieb EI, Edris AM, Ali Osman HM, Idris ES, et al. Computational Analysis of Deleterious nsSNPs in INS Gene Associated with Permanent Neonatal Diabetes Mellitus. Journal of Personalized Medicine. 2024; 14(4):425. https://doi.org/10.3390/jpm14040425
Chicago/Turabian StyleAhmed, Elsadig Mohamed, Mohamed E. Elangeeb, Khalid Mohamed Adam, Hytham Ahmed Abuagla, Abubakr Ali Elamin MohamedAhmed, Elshazali Widaa Ali, Elmoiz Idris Eltieb, Ali M. Edris, Hiba Mahgoub Ali Osman, Ebtehal Saleh Idris, and et al. 2024. "Computational Analysis of Deleterious nsSNPs in INS Gene Associated with Permanent Neonatal Diabetes Mellitus" Journal of Personalized Medicine 14, no. 4: 425. https://doi.org/10.3390/jpm14040425
APA StyleAhmed, E. M., Elangeeb, M. E., Adam, K. M., Abuagla, H. A., MohamedAhmed, A. A. E., Ali, E. W., Eltieb, E. I., Edris, A. M., Ali Osman, H. M., Idris, E. S., & Khalil, K. A. A. (2024). Computational Analysis of Deleterious nsSNPs in INS Gene Associated with Permanent Neonatal Diabetes Mellitus. Journal of Personalized Medicine, 14(4), 425. https://doi.org/10.3390/jpm14040425