Article

Fasting Blood Glucose-Based Novel Predictors in Detecting Metastases and Predicting Prognosis for Patients with PNENs

1
Department of Emergency Medicine, Union Hospital, Tongji Medical College, Huazhong University of Science and Technology, Wuhan 430022, China
2
Department of Endocrinology, Union Hospital, Tongji Medical College, Huazhong University of Science and Technology, Wuhan 430022, China
*
Author to whom correspondence should be addressed.
These authors have contributed equally to this work.
J. Pers. Med. 2024, 14(7), 760; https://doi.org/10.3390/jpm14070760 (registering DOI)
Submission received: 21 May 2024 / Revised: 26 June 2024 / Accepted: 9 July 2024 / Published: 17 July 2024
(This article belongs to the Special Issue Biomarkers and Personalized Therapy in Solid Tumors)

Abstract

:
Objective: To explore three novel fasting blood glucose (FBG)-based novel indicators, including the FBG-to-albumin ratio (FAR), FBG-to-lymphocytes ratio (FLR), and FBG-to-hemoglobin ratio (FHR), in predicting prognosis and detecting metastasis for patients with pancreatic neuroendocrine neoplasms (pNENs) after resection. Materials and Methods: A total of 178 pNENs patients who underwent surgical resection were included in this study. Receiver operating characteristic (ROC) curves were used to evaluate the diagnosis values of FAR, FLR, and FHR, and the cutoff values were obtained for further analyses. Univariate and multivariate analyses were conducted to determine the independent predictors. The Kaplan–Meier method was used to evaluate the progression-free survival (PFS) and overall survival (OS) of the pNENs patients. Results: The optimal cutoff values of FAR, FLR, and FHR were 0.17, 2.85, and 0.028, respectively. As for PFS, the area under the curve (AUC) was 0.693 for FAR, 0.690 for FLR, and 0.661 for FHR, respectively. The AUC was 0.770, 0.692, and 0.715 accordingly for OS. The groups with lower FAR, FLR, and FHR were significantly associated with prolonged PFS and OS (p < 0.05). In patients with metastasis, the lower FAR group was correlated with significantly longer PFS and OS (p = 0.022 and 0.002, respectively). The FLR was an independent predictor of PFS in pNENs patients, and the FAR was a predictor of OS. FAR was an independent indicator of PFS in patients with metastasis. Conclusions: Preoperative FAR, FLR, and FHR are effective in predicting the prognosis of pNEN patients and detecting the synchronous metastases.

1. Introduction

Pancreatic neuroendocrine neoplasms (pNENs) rank as the third most common neuroendocrine tumor subtype in the gastro-entero-pancreatic system [1,2]. The incidence presents a steady rise over the last few decades worldwide, with a five-year survival of 37.6% [3]. However, even in the pathologically well-differentiated tumors, the high heterogeneity of pNENs exhibits distinct biological behavior that affects the treatment decision and patient prognosis.
The classifications of pNENs according to the histological grade and the staging by American Joint Committee on Cancer (AJCC) have been widely applied in clinical practice [4]. These indices offer guidance on the course of treatment as well as insights into the patient prognosis. However, the AJCC staging system is based on the imaging examination, which is costly and often diagnosed pNENs occasionally when adopted for other diseases. Additionally, the prognostic value of this staging system is limited for patients without metastasis.
Laboratory tests are generally inexpensive and easily acquirable in clinic. Nonetheless, the prognostic value of hematological indices is frequently underestimated, particularly for those that appear to have no direct correlation with tumor behaviors. For instance, blood serum levels of alkaline phosphatase (ALP) and albumin (Alb) are not tumor biomarkers, but their ratio (ALP to Alb ratio, APAR) can be useful in predicting a patients’ prognosis for a variety of cancer types [5,6,7]. However, a previous study indicated that the APAR is insufficient to predict the overall survival (OS) of pNENs [5]. Therefore, it is imperative to explore more reliable indicators for these patients.
Recent studies have suggested that hyperglycemia may contribute to the cancer progression, though no substantial evidence indicates the possible link among them [8]. The prediction value of fasting blood glucose (FBG) for cancer patients is still under investigation due to the rarely relevant study. Additionally, the nutrition and inflammatory status of patients are linked to their outcomes. Some studies reported that the high C-reactive protein (CRP), low albumin, and low hemoglobin showed an increased risk trend of negative prognosis, but there are no significant differences [9]. These findings indicated that a single indicator is insufficient to predict the patients’ outcome.
Given these limitations, we conducted the present study to explore the value of three novel indicators, which are the FBG-to-albumin ratio (FAR), FBG-to-lymphocytes ratio (FLR), and FBG-to-hemoglobin ratio (FHR), for predicting the prognosis of pNEN patients and detecting their synchronous metastasis. As far as we know, there are no reports about these three indicators.

2. Materials and Methods

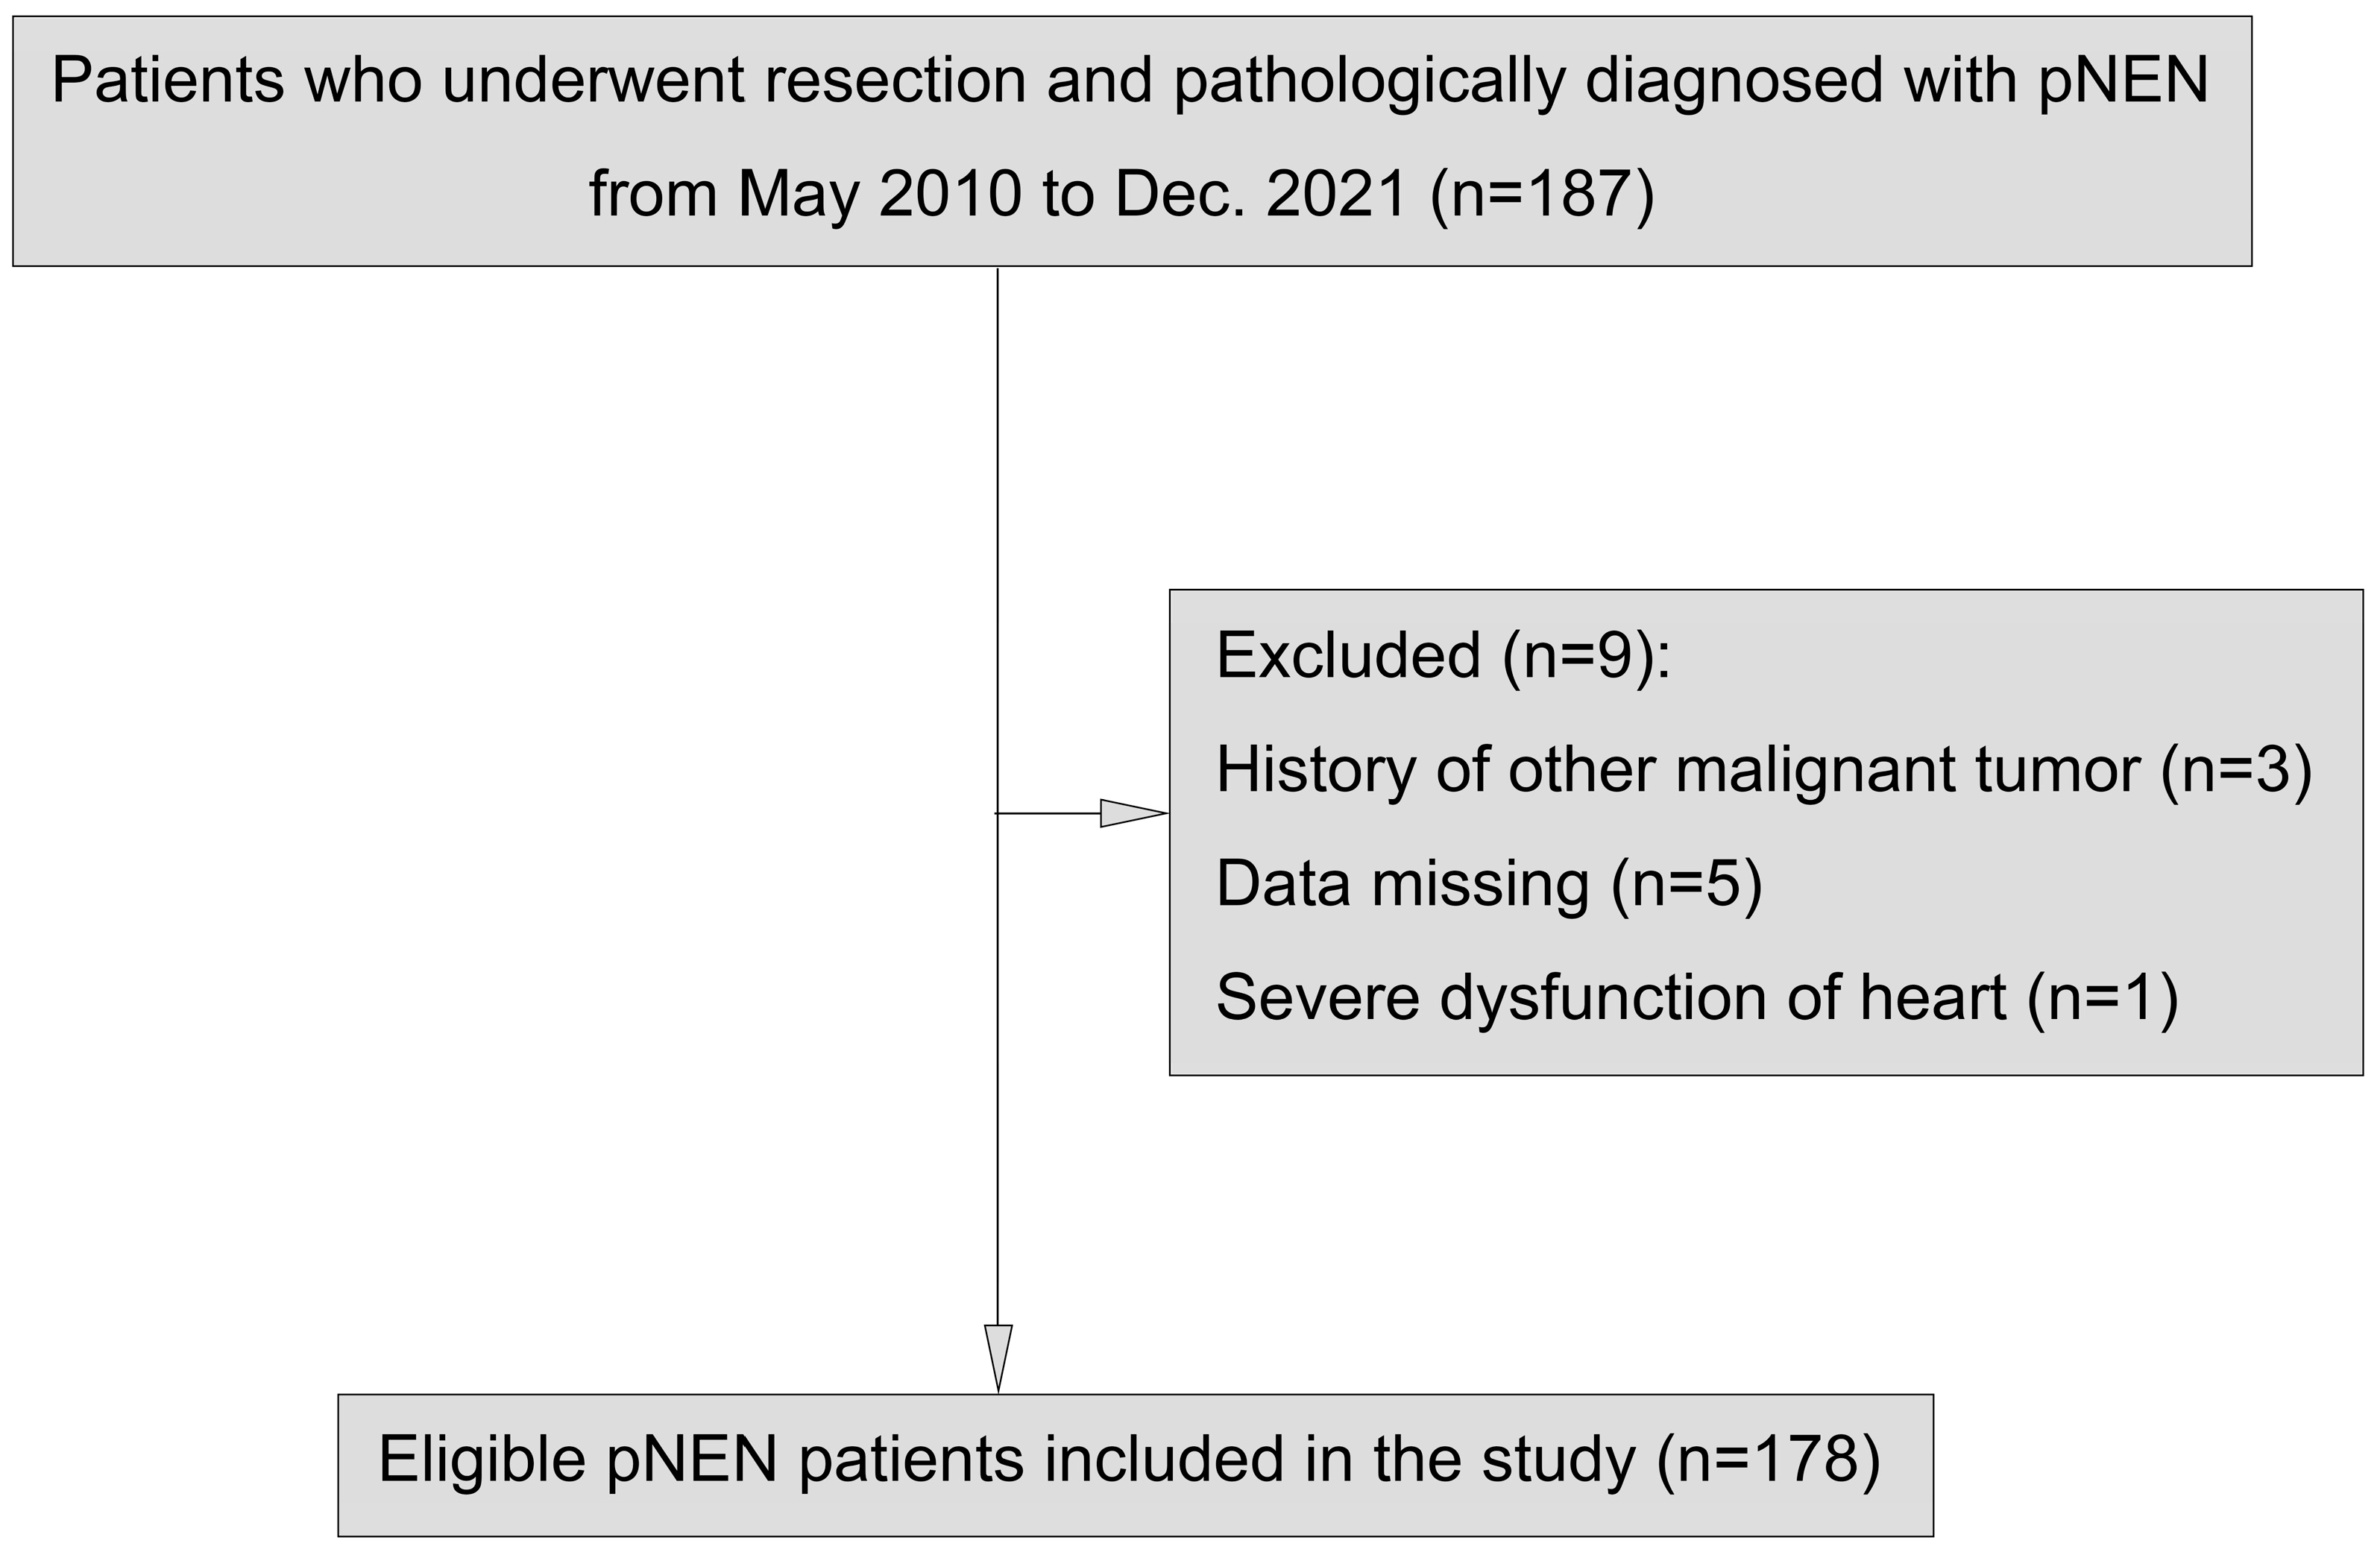
2.1. Patient Selection

Consecutive patients who underwent surgical resection and were pathologically diagnosed with pNEN at our center from 1 May 2010 to 31 December 2021 were reviewed. The exclusion criteria were as follows: patients who (a) are previously diagnosed with other malignant tumors; (b) complicated with serious comorbidities, such as severe dysfunction of the liver, kidney or heart; and (c) have missing data.
The demographic, clinical, laboratory, imaging, and pathological data of included patients were collected from our hospital medical record system. The histological grade was defined by the Ki-67 index and mitotic rate according to the 2019 World Health Organization (WHO) classification of endocrine organ tumors. The TNM stages were defined according to the 8th version of classification system by the AJCC. Functional tumors are defined as having particular symptoms and signs associated with hormone excess, such as insulinoma (hyperinsulinemia) and glucagonoma (hyperglycemia), etc. One lesion was defined as single, and the tumor number ≥2 was defined as multiple.

2.2. Follow-Up

The follow-up was conducted by telephone or outpatient visit with a deadline of 30 June 2022. The treatment efficacy was evaluated based on their imaging examination of computed tomography or magnetic resonance imaging. Progression-free survival (PFS) was defined as the duration from the first surgery procedure to the date of tumor progression confirmed radiologically. Overall survival (OS) was defined as the duration from the first surgery procedure to the death or the last follow-up.

2.3. Statistical Analysis

All statistical analyses were conducted by SPSS (version 26.0) and Graph-Pad Prism (version 8.0) software. Continuous variables were presented as mean ± standard deviation (SD), and differences between groups were analyzed using t-test between two groups and ANOVA analysis among three groups (including the comparison among any two groups). The categorical variables were expressed as frequencies and percentages, and the differences were analyzed by the Chi-square test. Uni-and multivariable Cox proportional hazard regression models were performed to explore the effects of several prognostic factors. The cross-validation was conducted using bootstrap method to demonstrate the predictive ability of FBG-based predictors (bootstrap replicates = 1000). Variables with p < 0.05 in univariate analysis were entered into the multivariate analysis. The time-dependent receiver operating characteristic (ROC) curves were plotted and the Youden indices were calculated to determine optimal cutoff value. The Kaplan–Meier method was used to estimate the survival curve which was compared by the log-rank test. A two-tailed p < 0.05 was considered to be statistically significant.

3. Results

3.1. Baseline Characteristics

A total of 187 pNEN patients underwent surgical resection were reviewed, and there were 178 patients eligible for further analyses (Figure 1). The whole cohort comprised 83 (46.6%) males and 95 (53.4%) females, with a mean age of 48.1 ± 13.5 years. The symptoms of hypoglycemia (palpitation, excessive perspiration, tremor, and starvation, etc., n = 58), abdominal bloating (n = 6), and diarrhea (n = 2), etc., were observed in patients with a functional tumor. There were 98 (55.1%), 68 (38.2%), and 12 (6.7%) patients at the histological grade of G1, G2, and G3, respectively, and 134 (75.3%), 17 (9.6%), 6 (3.4%), and 21 (11.8%) patients at the AJCC stages of I, II, III, and IV, respectively. The baseline characteristics of the included patients were summarized in Table 1.

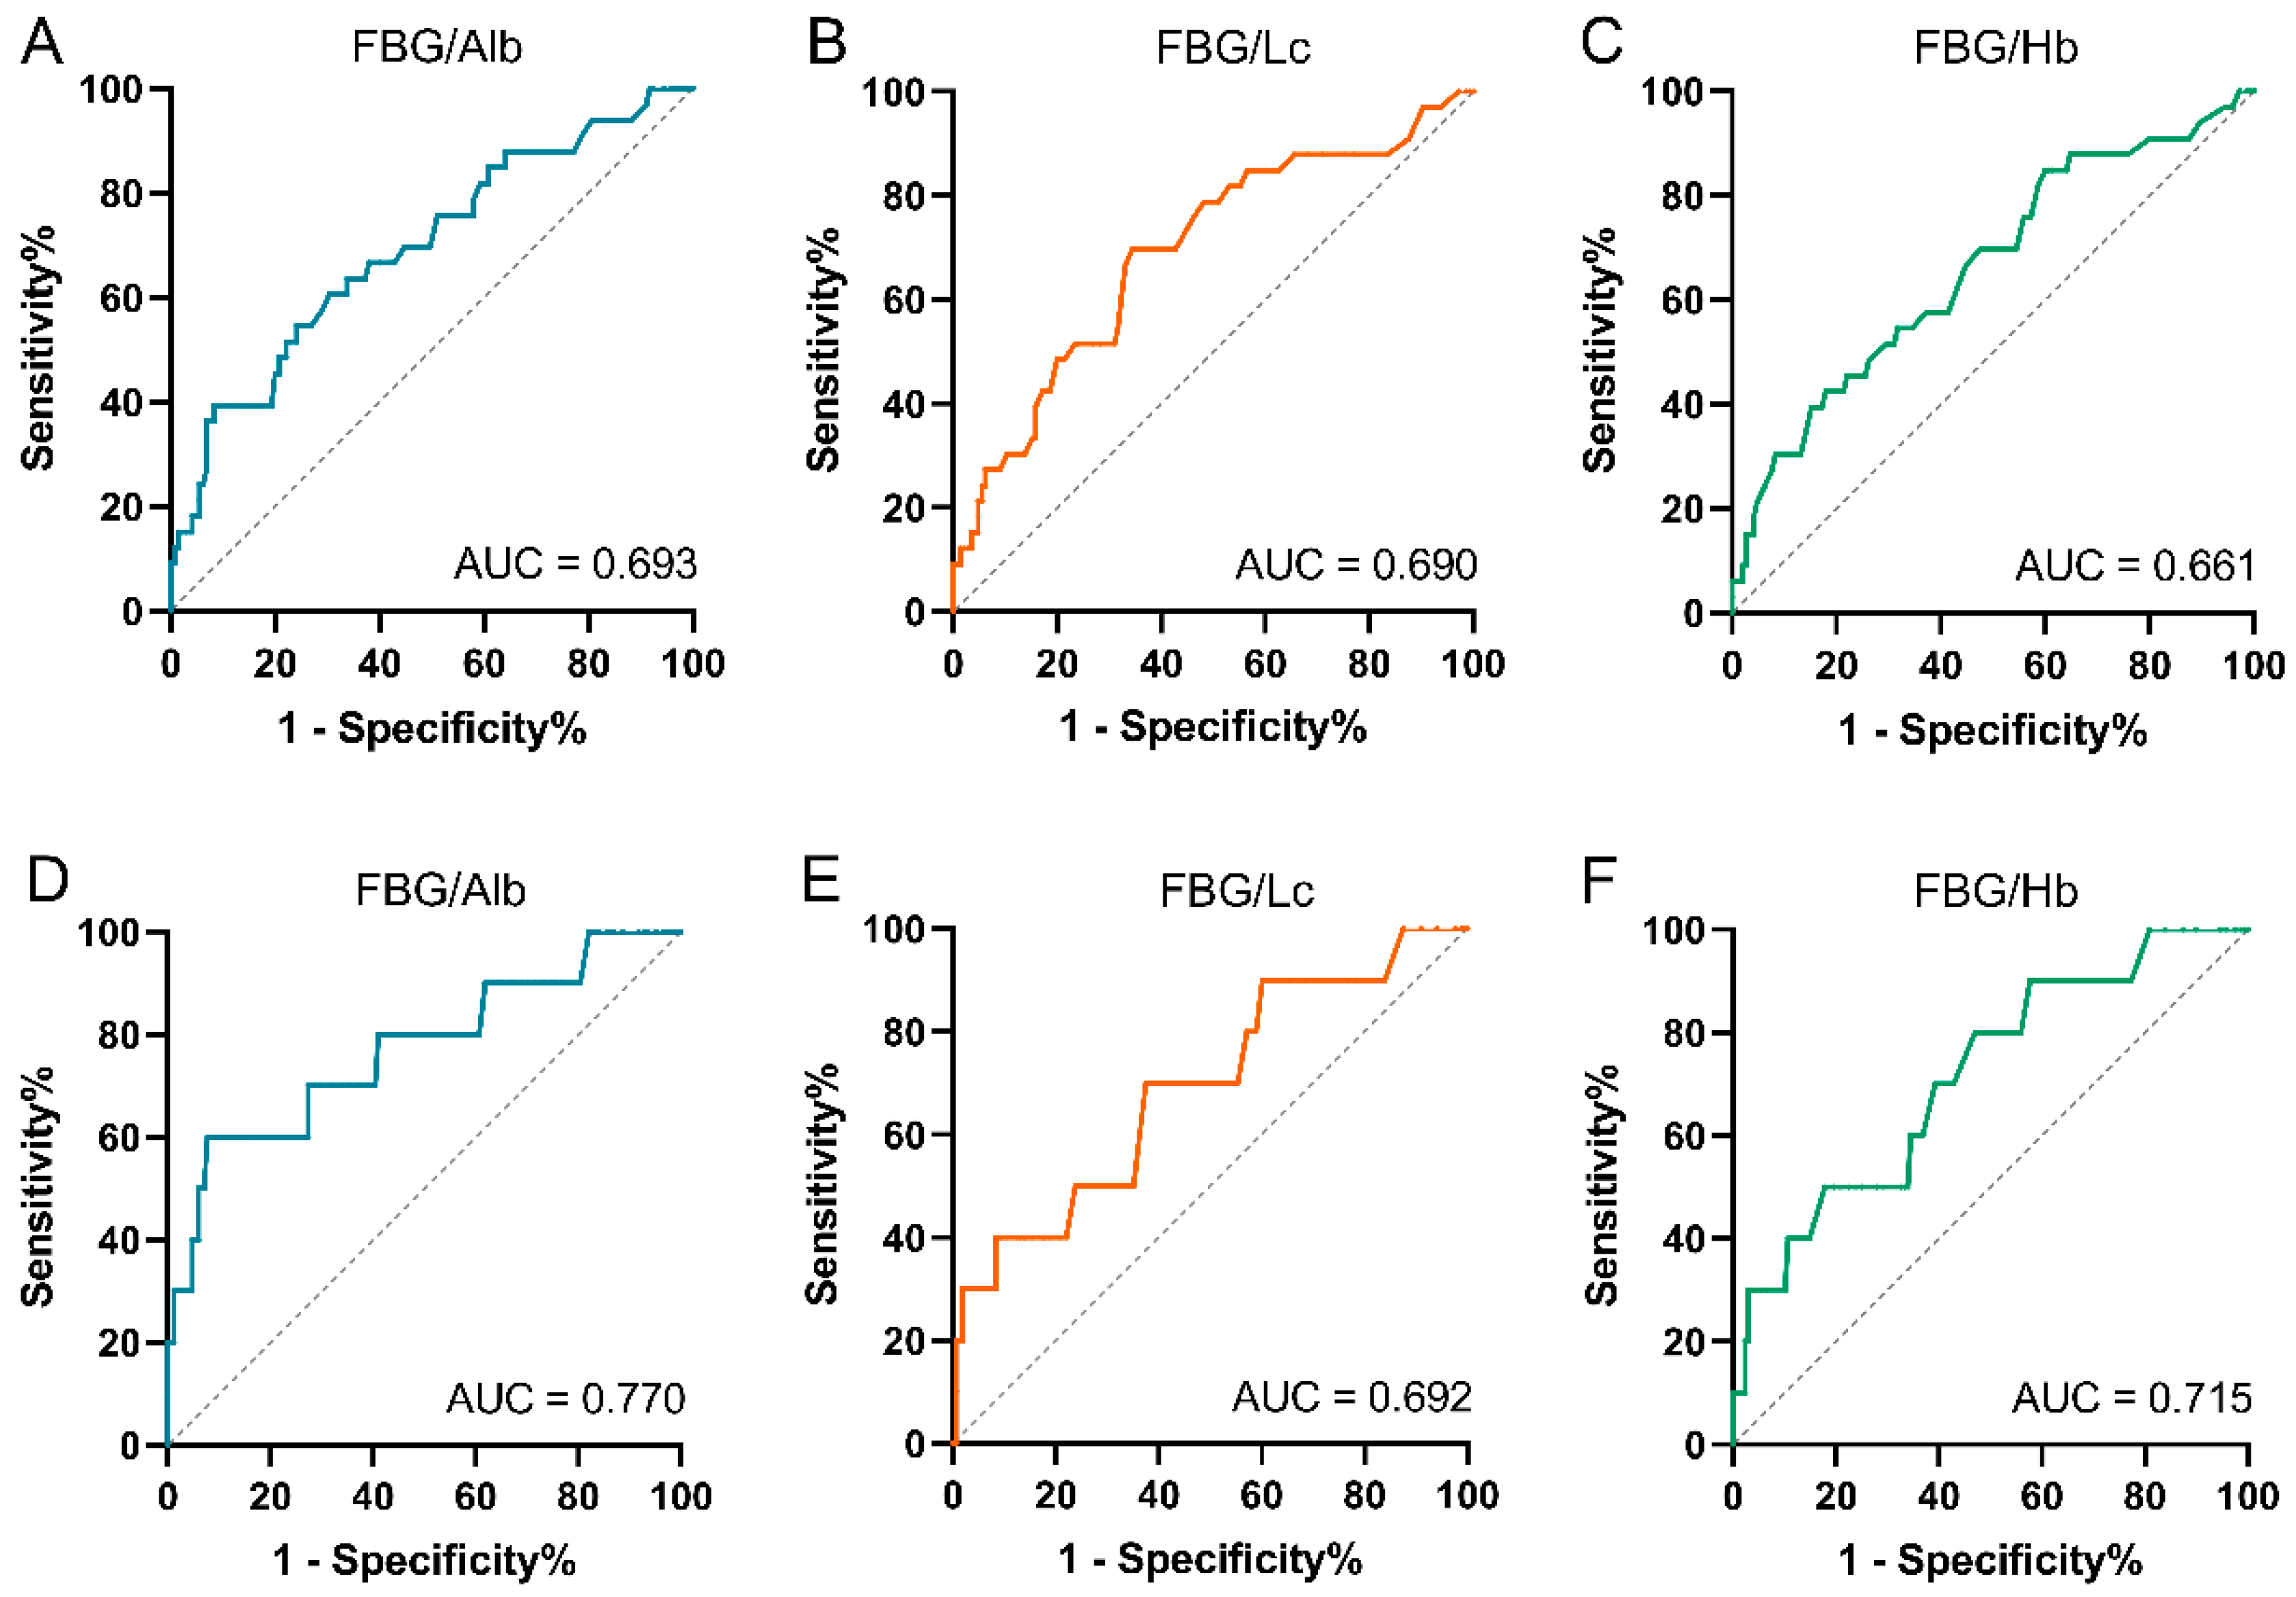
3.2. Cutoff Values of Fasting Blood Glucose-Based Novel Indexes

ROC curves were generated to determine the value of FAR, FLR, and FHR for prediction. As for PFS (Figure 2A,C), the area under the curve (AUC) was 0.693 for FAR, 0.690 for FLR, and 0.661 for FHR, respectively. The optimal cutoff value was 0.17 for FAR, 2.85 for FLR, and 0.028 for FHR, respectively. To further assess the predictive efficacy of these cutoff values for OS, ROC curves were also established (Figure 2D,F). The results showed that the AUC was 0.770, 0.692, and 0.715 for FAR, FLR, and FHR, respectively. Additionally, the APAR was also incorporated. To confirm the reliability of these results, the cross-validation was conducted by bootstrap. The bootstrap performances (Supplementary Materials Figure S1) were echoed with the above results. The optimal cutoff value of APAR was 2.2, the AUC was 0.730 for PFS and 0.725 for OS, respectively.

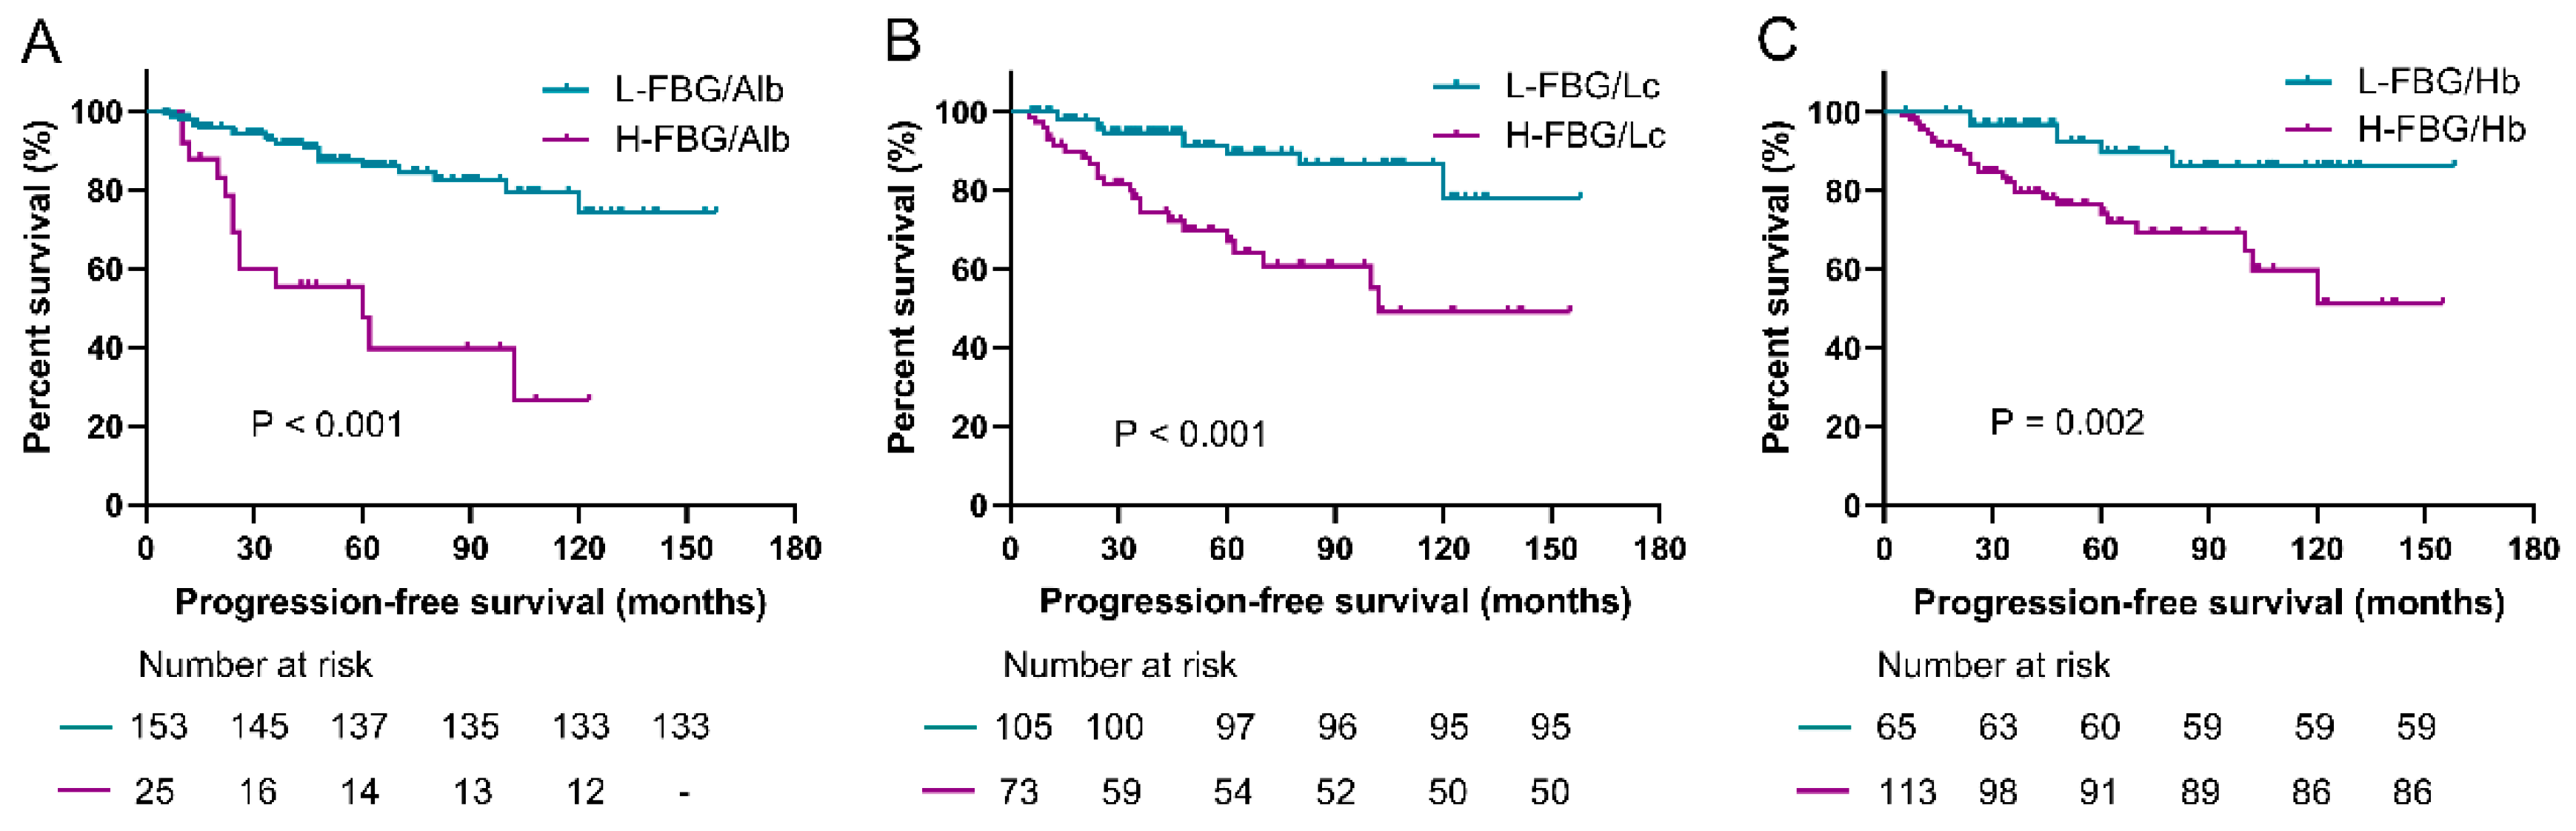
3.3. Prediction Roles of Fasting Blood Glucose-Based Indexes for PFS

Subgroup analyses were conducted to evaluate the value of FAR, FLR, and FHR in predicting PFS among the above resected groups. As shown in Figure 3, the PFS (median PFS was not applicable) in the low-FAR group (<0.17) was significantly longer than the higher value group (median, 60.0 ± 19.1 months) (p < 0.001). The low-FLR group (<2.85) was associated with significantly better PFS compared with the higher value group (p < 0.001). Additionally, the PFS in the low-FHR group (<0.028) was also significantly prolonged compared with the high-FHR group (p = 0.002).

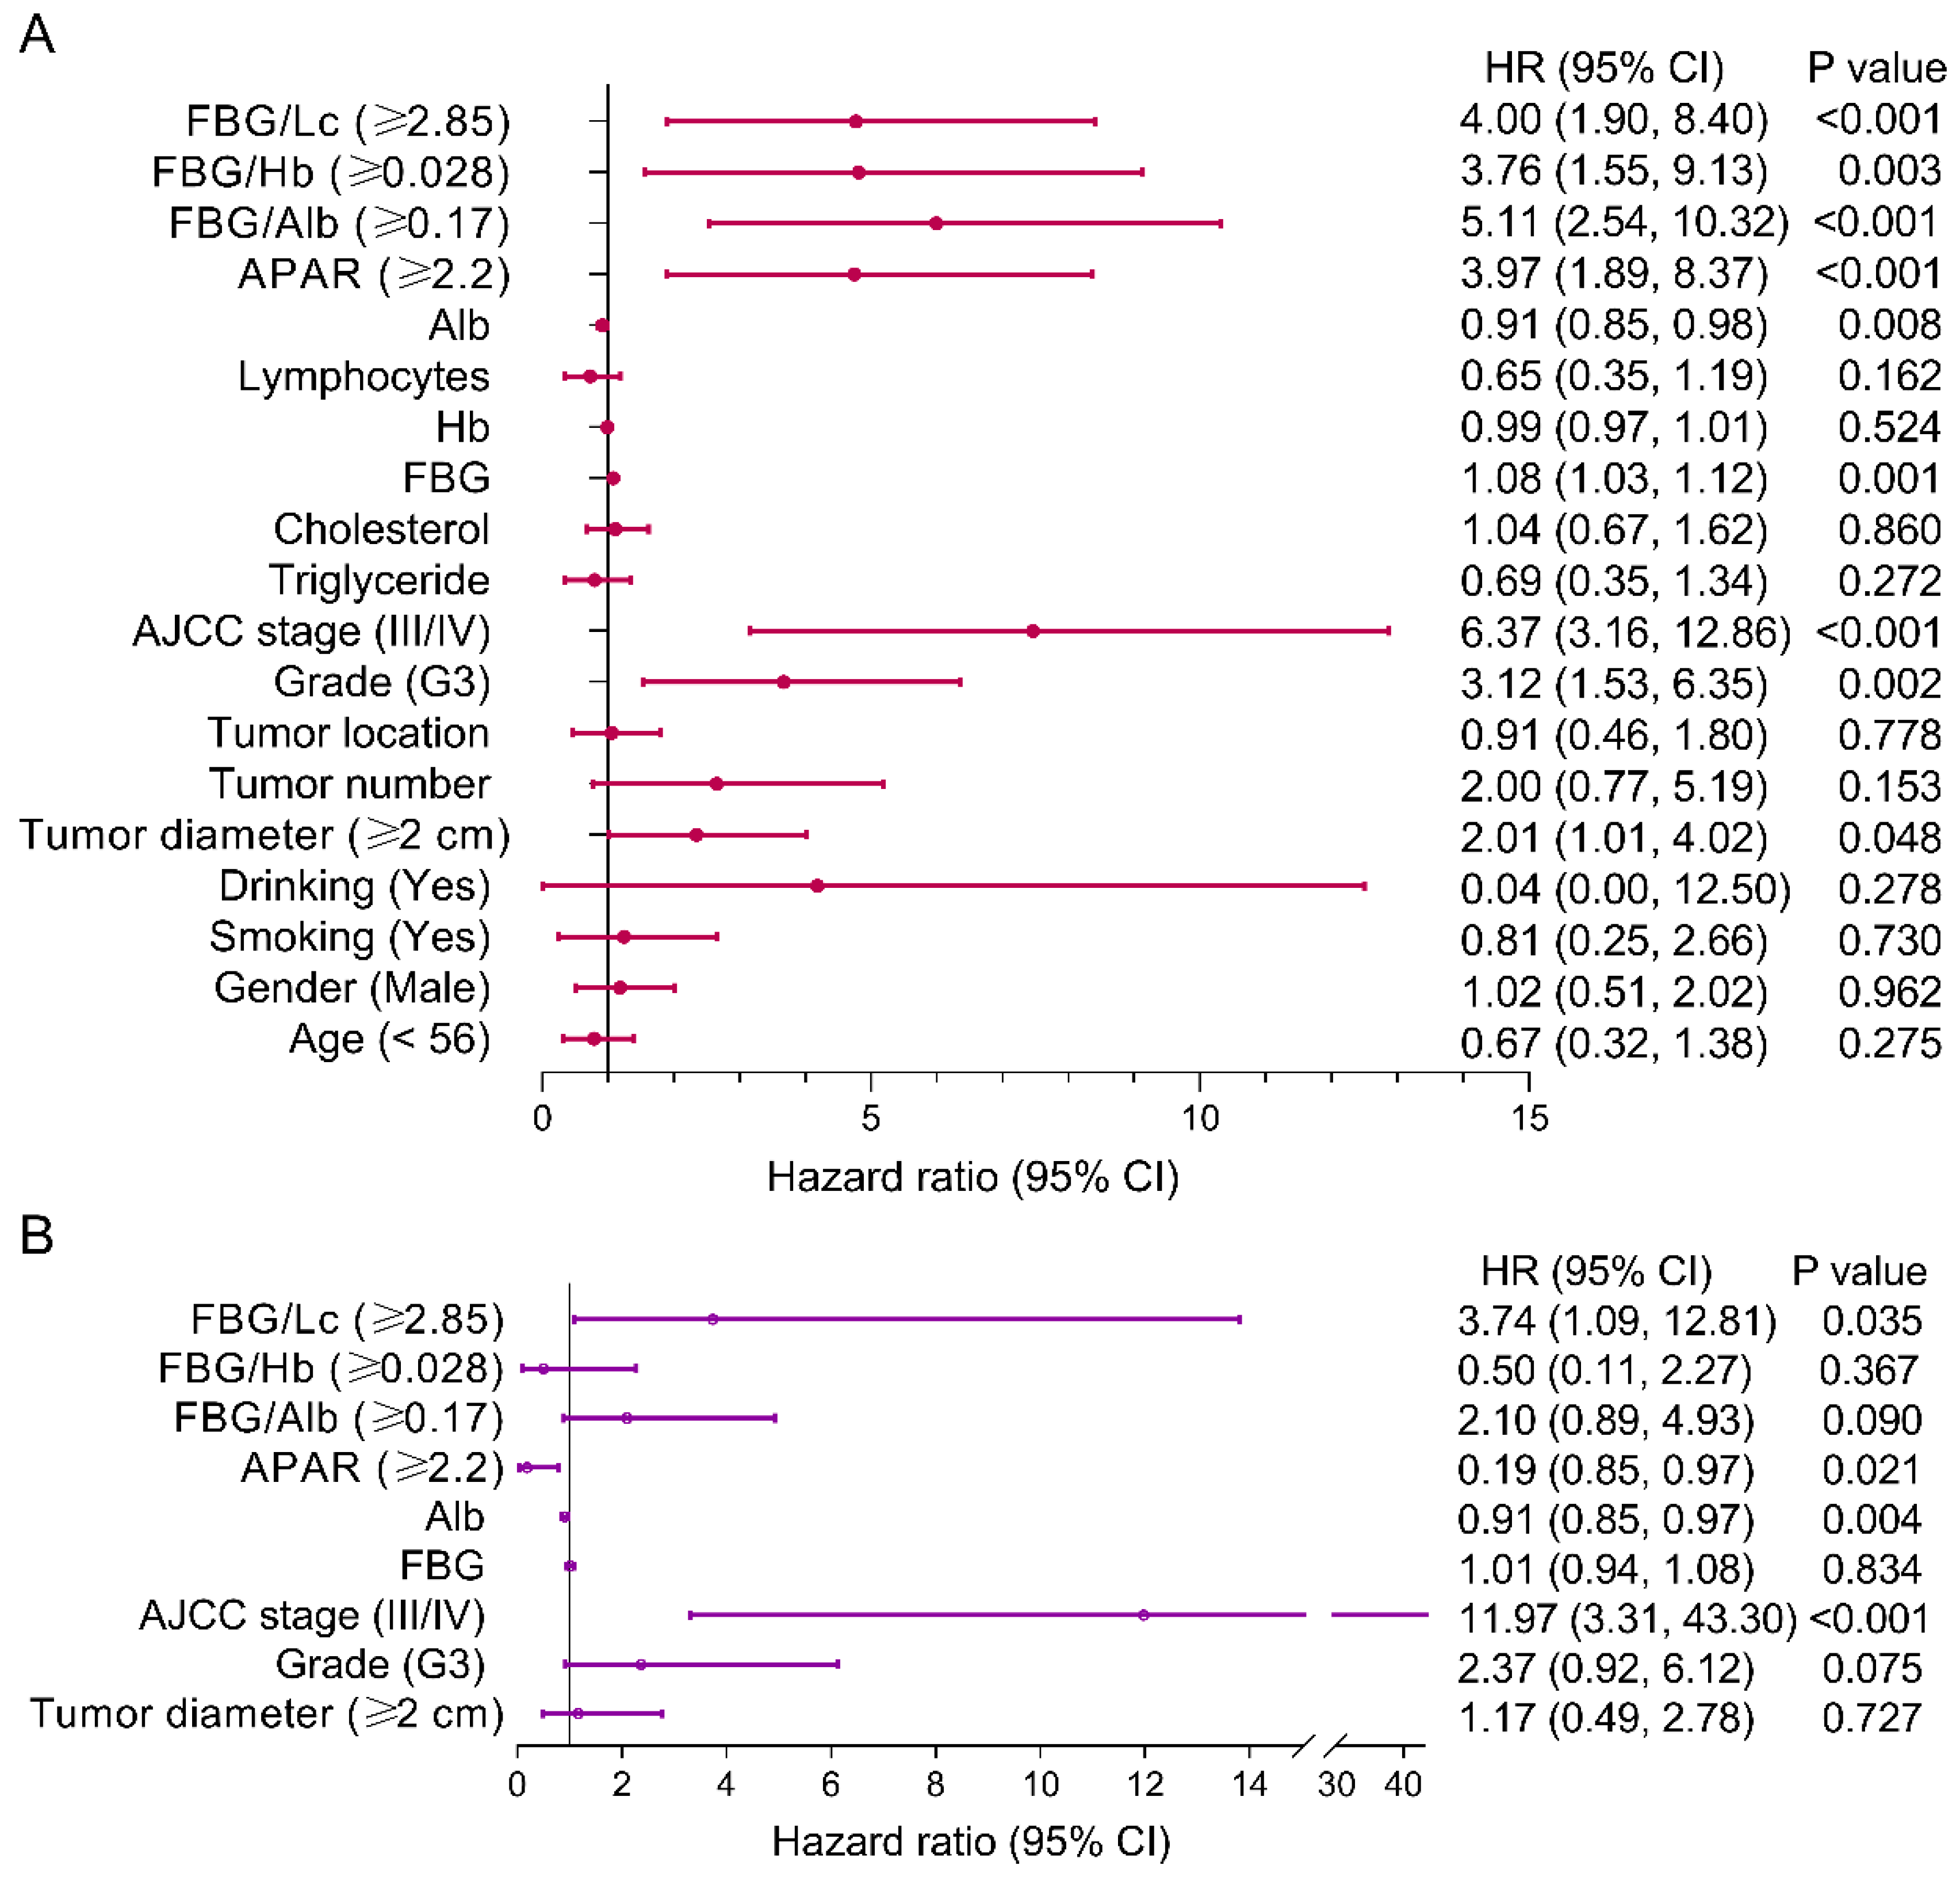
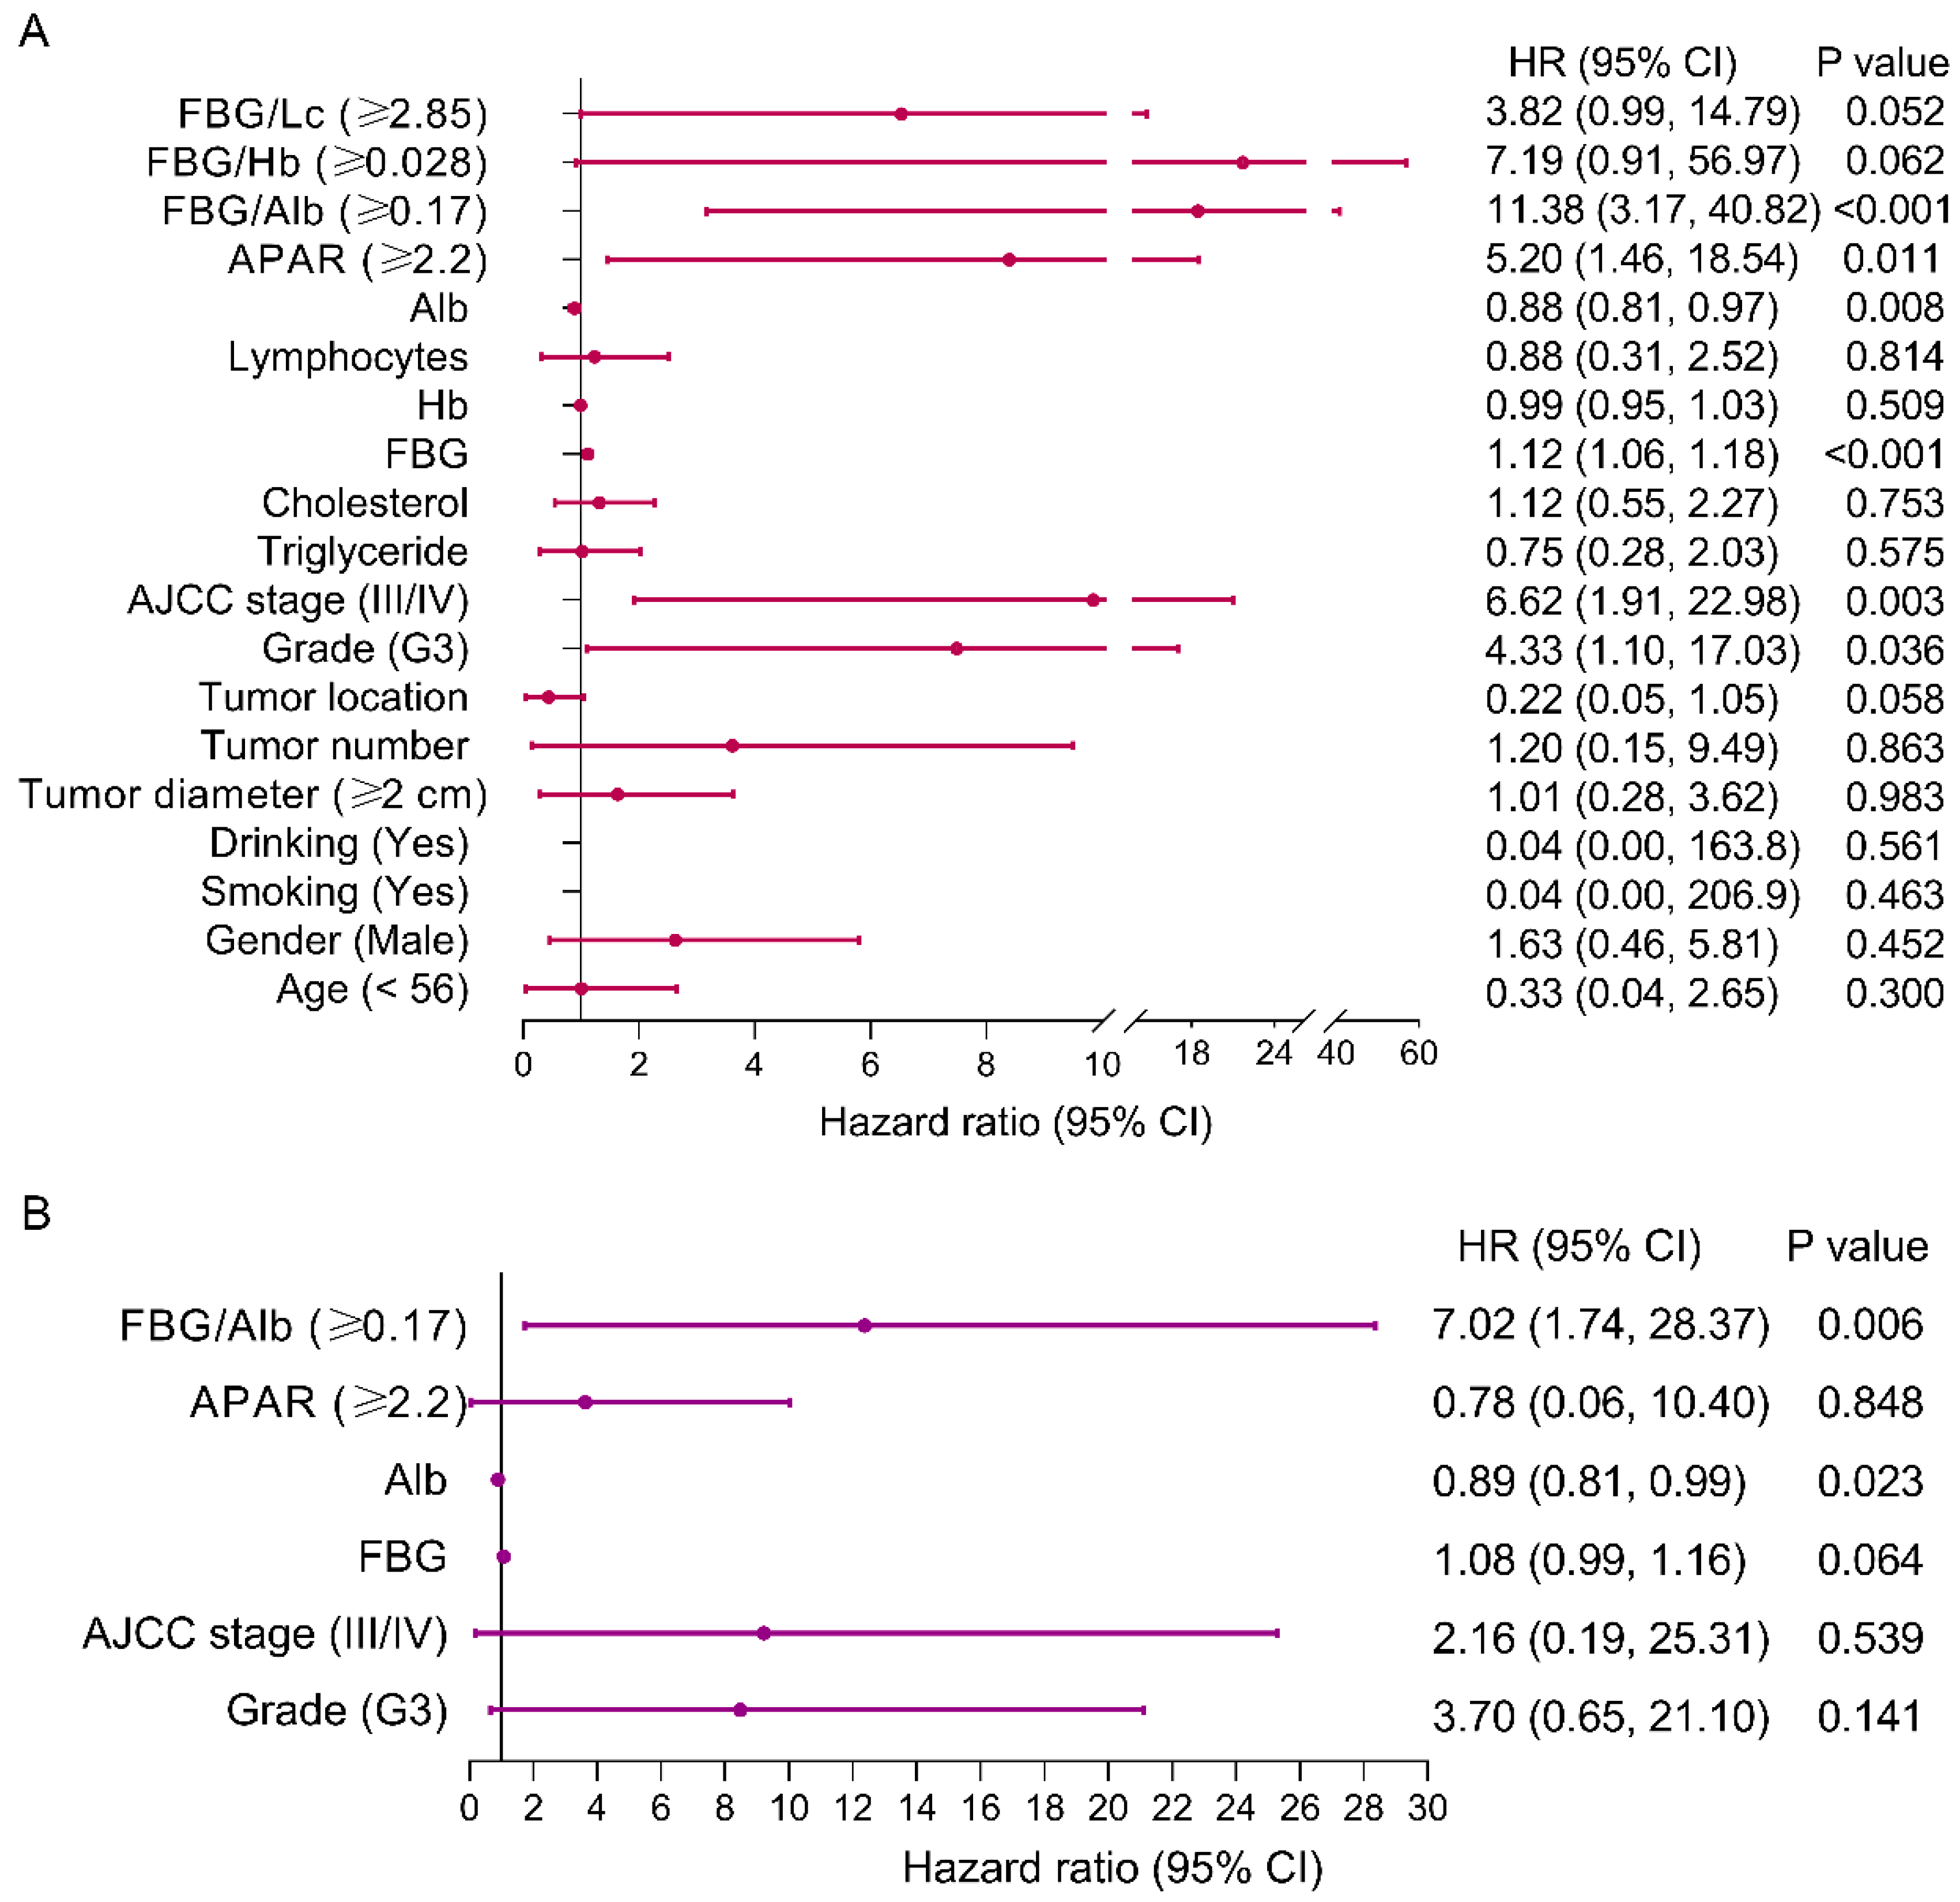
3.4. Risk Factors of PFS for pNEN Patients

Univariate and multivariate analyses were performed to determine the risk factors of PFS for pNEN patients (Figure 4). The results of univariate analysis showed that the FAR (p < 0.001), FLR (p < 0.001), FHR (p = 0.003), APAR (p < 0.001), albumin (p = 0.008), FBG, AJCC stage (p < 0.001), histological grade (p = 0.002), and tumor diameter (p = 0.048) were significantly associated with PFS. The results of multivariate analysis demonstrated that the FLR (hazard ratio (HR), 3.74; 95% confidence interval (CI), 1.09, 12.81; p = 0.035), APAR (HR, 0.19; 95% CI: 0.85, 0.97; p = 0.021), albumin (HR, 0.91; 95% CI: 0.85, 0.97; p = 0.004), and AJCC stage (HR, 11.97; 95% CI: 3.31, 43.30; p < 0.001) were independent predictors of PFS for pNEN patients.

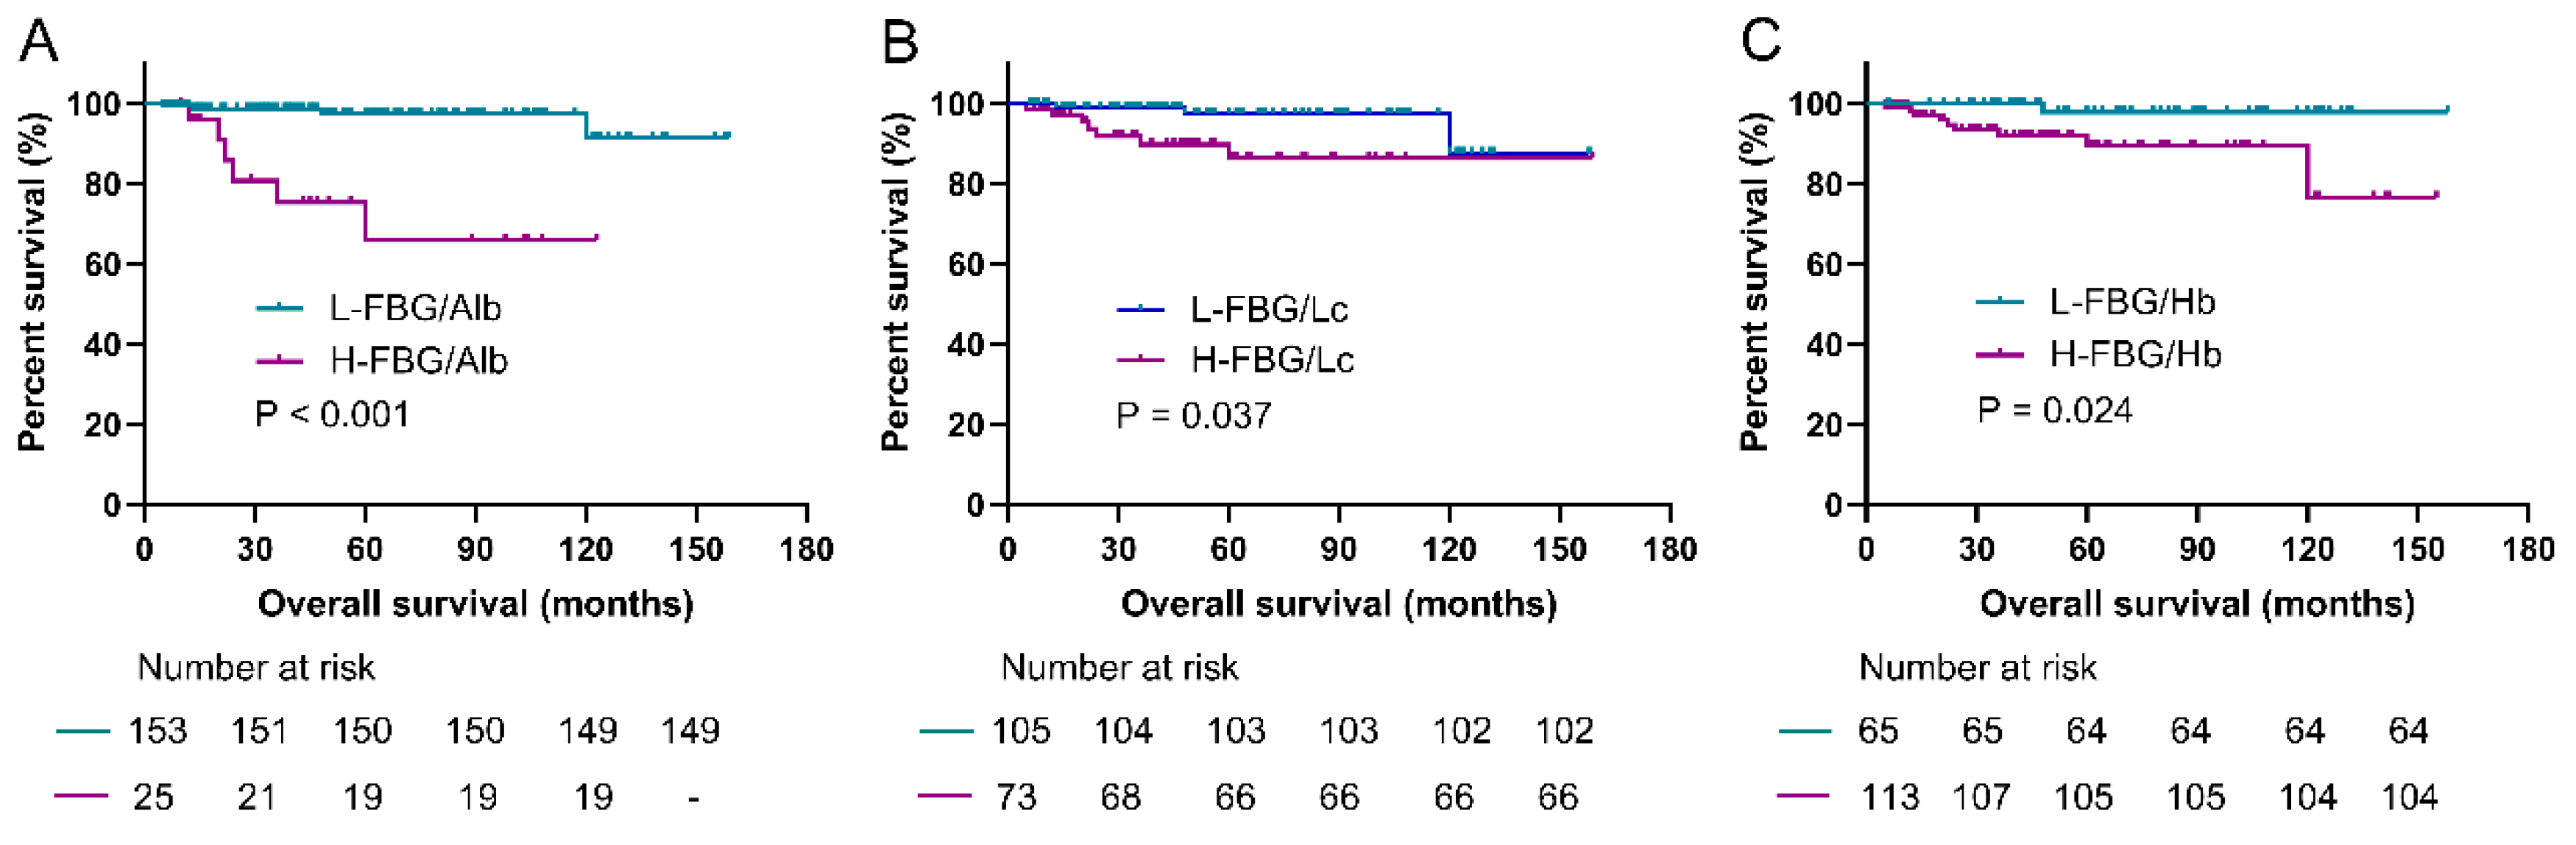
3.5. Prediction Roles of Fasting Blood Glucose-Based Indexes for OS

As shown in Figure 5, the low-FAR was related to significantly better OS than the higher value group (p < 0.001). The OS was significantly prolonged in the low-FLR group compared with the high-FLR group (p = 0.037). Additionally, the low-FHR group also showed significantly longer OS than the higher value group (p = 0.024).

3.6. Risk Factors of OS for pNEN Patients

The results of univariate analyses (Figure 6) presented that the FAR (p < 0.001), APAR (p = 0.011), albumin (p = 0.008), FBG (p < 0.001), AJCC stage (p = 0.003), and histological grade (p = 0.036) were independent predictors of OS for pNEN patients. Further multivariate analyses showed that the FAR (HR, 7.02; 95% CI: 1.74, 28.37; p = 0.006) and albumin (HR, 0.89; 95% CI: 0.81, 0.99; p = 0.023) were independent predictors of OS.

3.7. Baseline Characteristics and Risk Factors of PFS for Patients with pNEN and Metastasis

A total of 30 pNEN patients were concurrent with metastasis, and their demographic characteristics were summarized in Table 2.
The results of univariate analysis of PFS (Table 3) showed that the FAR was the single independent predictor of patients with pNEN and metastasis (HR, 3.34; 95% CI: 1.11, 10.06; p = 0.032), and the FBG was the predictor of OS (Table 4) for these patients (HR, 1.15; 95% CI: 1.03, 1.28; p = 0.012).

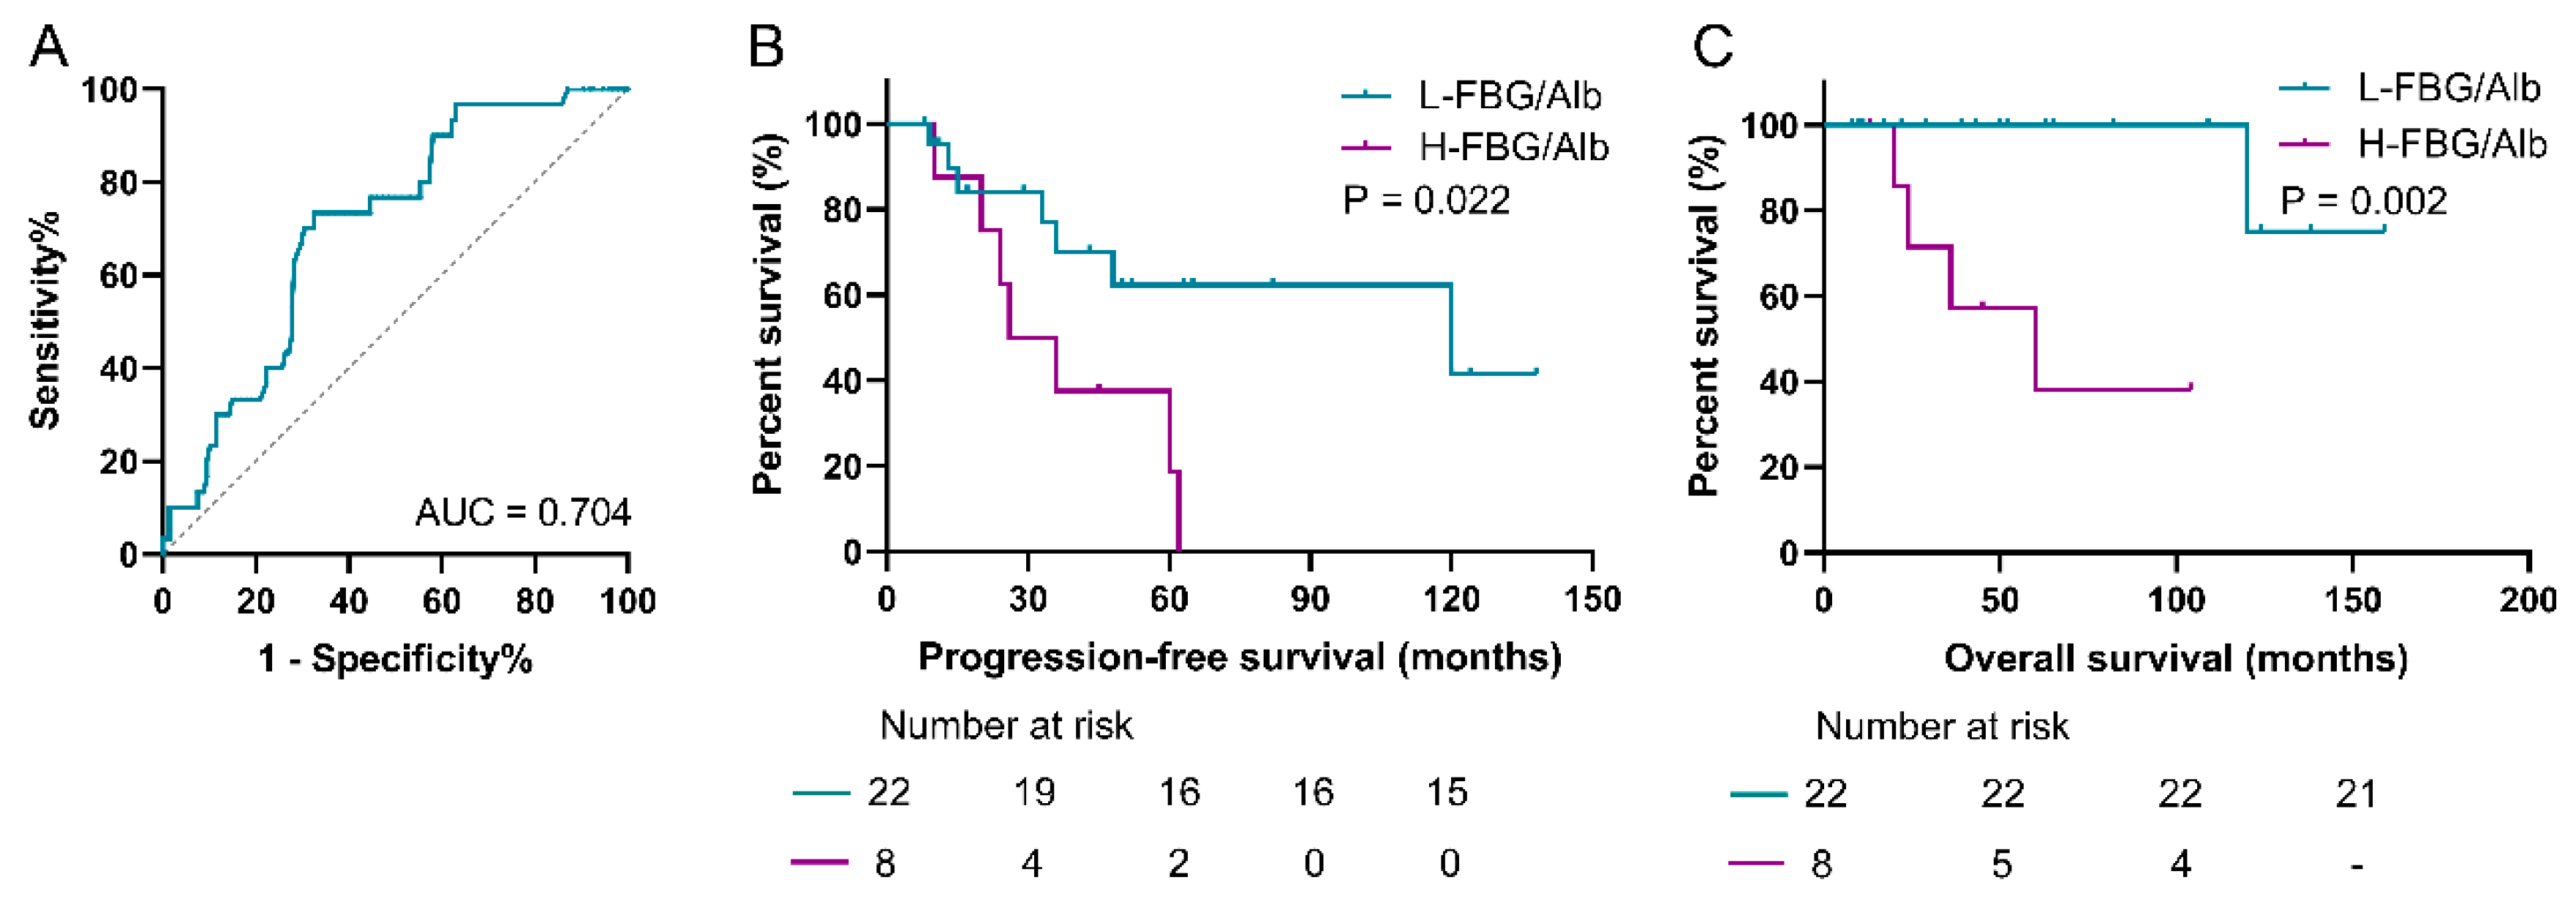
3.8. Prediction Role of FAR for Patients with pNEN and Metastasis

As for distinguishing the synchronous metastasis in pNEN patients, the ROC curve showed that the AUC was 0.704 (Figure 7). The low-FAR group was correlated with significantly better PFS compared with the higher-value group (p = 0.022). Moreover, the lower-value cohort (median, not applicable) also presented significantly prolonged OS when compared with the high-FAR group (median, 60.0 ± 25.1 months) (p = 0.002).

4. Discussion

The highly heterogeneous prognosis of pNEN patients indicates that risk assessment and the development of new reliable indicators are particularly required [3,10]. Blood markers are regularly measured and easily accessible, which has attracted growing interest and they are widely used in predicting the prognoses of various malignancies. The findings in previous studies are meaningful but still unsatisfactory [9,10]. Therefore, a new prognostic predictor is required to efficiently assess the patient prognosis. Our study provides three novel FBG-based indexes, which firstly, connected FBG with albumin, lymphocytes, and hemoglobin, in effectively predicting the prognosis of pNEN patients, and also identified their metastases prior to treatment. As far as we know, these three indicators have not been previously reported.
Although earlier studies suggested other reliable indexes, such as APAR and neutrophil-to-lymphocyte ratio, there were limitations when they were used as independent factors [5,10]. For instance, in a previous study, APAR was shown to be associated with recurrence-free survival of pNEN patients in the nonmetastatic cohort, but failed to play the prediction role in the multivariate analysis [5]. Moreover, no statistical correlation was found between APAR and OS [5]. In contrast, our study found that the cutoff values of FAR, FLR, and FHR not only significantly distinguished the PFS and OS of the total pNEN patients, the univariate and multivariate analyses also revealed that the FAR was an independent predictor of OS for these patients. The FAR was also an independent factor for detecting patients with pNEN and metastasis according to the multivariate analysis. Additionally, a lower FAR was associated with better PFS and OS in these patients. Therefore, our study demonstrated the effectiveness of pretreatment FAR in detecting metastasis prior to therapy and predicting their prognosis after treatment. Moreover, the FLR was an independent predictor of PFS for the total patients. Although the FHR is effective for predicting PFS and OS in pNEN patients, it was not an independent indicator according to the multivariate analysis. Taken together, our results suggested that the FBG-based indices could be the promising indicators for prognosis and identifying the synchronous metastases, especially combining the FAR with FLR.
Previous research reported that the random blood sugar level was connected with a linearly increased risk of all cancers, and type 2 diabetes mellitus (T2DM) also raised the risk of cancer mortality by 26% [11,12]. In contrast, fasting settings can lead to differential stress sensitization, which makes distinct tumors susceptible to chemotherapy and other therapies while also killing cancer cells as effectively as chemotherapy [13]. Thus, FBG does affect the development of malignancies, and a higher FBG level promotes the progression of cancer. However, the mechanism between FBG and cancer progression remains clarified. The high level of FBG could disturb the homeostatic balance of some endogenous mediators, such as insulin and insulin-like growth factors, which is pro-tumorgenic [14]. Additionally, during the high FBG state, the phosphoinositide-3-kinase (PI-3K), hyperglycemia-associated transcriptional, post-transcriptional factors, and AMP-activated protein kinase probably also contribute to the advancement of cancer [8]. For instance, because the PI-3K singling pathway is crucial for the energy consumption of tumor cells, inhibiting PI-3K could effectively hinder the tumor growth [15]. In hyperglycemia, the integrity of the cellular DNA can be drastically jeopardized, the expression of messenger RNA, long non-coding RNA, and microRNA can be modified, and the post-translational modifications like acetylation can also be altered [16,17,18]. In the present study, the groups of higher FAR, FLR, and FHR all presented worse outcomes as compared with lower cohorts, which echoed with the findings mentioned above.
The nutrition status of a patient plays an important role in cancer development. A prior study demonstrated that the low albumin correlated with a higher risk of negative outcomes [9]. As we all know, cancer cells have a high demand for amino acids to support their proliferation, like serine and glutamine. Serine is necessary for cancer cells to synthesize nucleotide, and glutamine provides the main source of nitrogen to sustain the biosynthesis of new molecules [19,20]. The decomposition products of albumin could provide these amino acids. The progressive cancer cells with chronic wasting biology could consume an amount of albumin, and a lower level of albumin implies a more advanced stage of disease, which was linked to a worse prognosis [21,22]. In addition to the impact on the metabolism, hypoalbuminemia also affects the immunity, such as inducing the cytokines of tumor necrosis factor-a, interleukin-6, and interleukin-1, which promotes the cancer progression [23]. Taken together, hyperglycemia or low albumin means a higher FAR, which is theoretically correlated with poor outcomes. This notion was supported by the findings of our study, which indicated that the low-FAR group had considerably longer PFS and OS.
Hemoglobin also implies the nutritional status to some extent, and recent studies found that hemoglobin is associated with cancer immunity, which attracts growing attention [24,25]. On the one hand, malignancies during progression suppress the synthesis of hemoglobin, and anemia is very common in patients with cancer [22,26]. However, the relationship between hemoglobin and the cancer patients’ outcome has been rarely investigated. The decrease in hemoglobin concentration induces the hypoxic condition, which promotes the invasive phenotype of cancer cells, stimulates neovascularization in tumor tissue via vascular endothelial growth factor signaling pathway, inhibits tumor immune microenvironment, and accelerates cancer progression [26,27,28]. The lower hemoglobin concentration has been reported to be associated with a poor prognosis in certain cancers [29,30]. However, the single parameter of hemoglobin may not be stable enough for prediction [23]. Thereby, a higher hemoglobin concentration, consistent with a lower FBG level, theoretically suggests better outcomes. Our study also demonstrated this hypothesis in which a lower FHR was associated with better outcomes in pNEN patients.
Lymphocytes play a central role in human immunity, which is vital for immunological surveillance and specific anti-tumor immune responses. Higher numbers of lymphocytes may have more reservations and stronger antitumor effects. Research in recent decades has demonstrated that tumor-infiltrating lymphocytes, recruited from circulating blood, are critical for tumor growth. Katz et al. recently demonstrated that a reduced level of tumor-infiltrating lymphocytes is significantly associated with worse PFS in patients with neuroendocrine tumors after resection [31]. Previous study demonstrated that the lymphocyte-based indexes, such as the neutrophil-to-lymphocyte ratio and lymphocyte-to-monocyte ratio, could be effective predictors for various malignancies after treatment [10]. The result of the present study demonstrated that the novel indicator of FHR was significantly correlated with the prognosis of pNEN patients after resection, that is, a lower FHR with better PFS and OS.
Interestingly, our results demonstrated the value of FAR for distinguishing synchronous metastasis in pNEN patients. Metastasis seriously affects the prognosis of pNEN patients [32], and early detection of metastasis could provide important messages for doctors’ decision-making in the following practices, which would help improve the treatment outcomes of these patients. However, the mechanism between a lower FAR and better prognosis requires further investigation.
There is a limitation in the study to be mentioned. This is a single-center retrospective study and selection bias could not be avoided, although the patient number included in this study is large in the pNEN cohort and is followed up in a long-term period.

5. Conclusions

Our study provides three novel FBG-based indices, including FAR, FLR, and FHR, which are effective in predicting the prognosis of pNEN patients, as well as detecting their metastases prior to treatment. These markers are inexpensive and easily available in clinical practice, which supports surgeons in making optimal therapy and surveillance strategies for individuals. Moreover, these novel markers have the potential of predicting the outcomes of various other malignancies.

Supplementary Materials

The following supporting information can be downloaded at: https://www.mdpi.com/article/10.3390/jpm14070760/s1, Figure S1: Bootstrapped ROC performance of FAR, FLR, and FHR according to PFS and OS.

Author Contributions

Conception and design: H.S.; development of methodology: L.Y. (Li Yu) and M.F.; acquisition of data: L.Y. (Li Yu), M.F. and L.Y. (Liu Yang); analysis and interpretation of data: L.Y. (Li Yu) and M.F.; writing, review, and/or revision of the manuscript: H.S., L.Y. (Li Yu) and M.F.; administrative, technical, or material support: H.S. All authors have read and agreed to the published version of the manuscript.

Funding

This research received no external funding.

Institutional Review Board Statement

The ethical approval was waived by our institution of Union Hospital, Tongji Medical College, Huazhong University of Science and Technology, since it is a retrospective study.

Informed Consent Statement

Not applicable.

Data Availability Statement

The data can be obtained from the corresponding author upon requirement.

Acknowledgments

The authors thank the participating patients for the source of clinical blood samples.

Conflicts of Interest

The authors declare no conflicts of interest.

Abbreviations

PNENspancreatic neuroendocrine neoplasms
AJCCAmerican Joint Committee on Cancer
ALPalkaline phosphatase
Albalbumin
APARalkaline phosphatase to albumin ratio
OSoverall survival
FBGfasting blood-glucose
CRPC-reactive protein
FARFBG-to-albumin ratio
FLRFBG-to-lymphocytes ratio
FHRFBG-to-hemoglobin ratio
WHOWorld Health Organization
PFSProgression-free survival
SDmean ± standard deviation
ROCreceiver operating characteristic

References

  1. Dasari, A.; Shen, C.; Halperin, D.; Zhao, B.; Zhou, S.; Xu, Y.; Shih, T.; Yao, J.C. Trends in the incidence, prevalence, and survival outcomes in patients with neuroendocrine tumors in the united states. JAMA Oncol. 2017, 3, 1335–1342. [Google Scholar] [CrossRef] [PubMed]
  2. Falconi, M.; Eriksson, B.; Kaltsas, G.; Bartsch, D.K.; Capdevila, J.; Caplin, M.; Kos-Kudla, B.; Kwekkeboom, D.; Rindi, G.; Klöppel, G.; et al. Enets consensus guidelines update for the management of patients with functional pancreatic neuroendocrine tumors and non-functional pancreatic neuroendocrine tumors. Neuroendocrinology 2016, 103, 153–171. [Google Scholar] [CrossRef]
  3. Forsythe, S.D.; Pu, T.; Andrews, S.G.; Madigan, J.P.; Sadowski, S.M. Models in pancreatic neuroendocrine neoplasms: Current perspectives and future directions. Cancers 2023, 15, 3756. [Google Scholar] [CrossRef] [PubMed]
  4. Chun, Y.S.; Pawlik, T.M.; Vauthey, J.N. 8th edition of the ajcc cancer staging manual: Pancreas and hepatobiliary cancers. Ann. Surg. Oncol. 2018, 25, 845–847. [Google Scholar] [CrossRef] [PubMed]
  5. Zhou, W.; Fang, Y.; Han, X.; Kuang, T.; Xu, X.; Lou, W.; Wang, D. The value of alkaline phosphatase-to-albumin ratio in detecting synchronous metastases and predicting postoperative relapses among patients with well-differentiated pancreatic neuroendocrine neoplasms. J. Oncol. 2020, 2020, 8927531. [Google Scholar] [CrossRef] [PubMed]
  6. Pu, N.; Gao, S.; Xu, Y.; Zhao, G.; Lv, Y.; Nuerxiati, A.; Li, J.A.; Wang, D.; Xu, X.; Kuang, T.; et al. Alkaline phosphatase-to-albumin ratio as a prognostic indicator in pancreatic ductal adenocarcinoma after curative resection. J. Cancer 2017, 8, 3362–3370. [Google Scholar] [CrossRef] [PubMed]
  7. Wang, Y.; Bi, X.; Zhao, H.; Li, Z.; Zhao, J.; Zhou, J.; Huang, Z.; Zhang, Y.; Chen, X.; Zhang, C.; et al. Prognostic significance of the preoperative alkaline phosphatase-to-albumin ratio in patients with hepatocellular carcinoma after hepatic resection. Oncol. Lett. 2023, 25, 147. [Google Scholar] [CrossRef] [PubMed]
  8. Vulichi, S.R.; Runthala, A.; Begari, N.; Rupak, K.; Chunduri, V.R.; Kapur, S.; Chippada, A.R.; Sistla, D.S.M. Type-2 diabetes mellitus-associated cancer risk: In pursuit of understanding the possible link. Diabetes Metab. Syndr. 2022, 16, 102591. [Google Scholar] [CrossRef] [PubMed]
  9. van Holstein, Y.; van den Berkmortel, P.J.E.; Trompet, S.; van Heemst, D.; van den Bos, F.; Roemeling-van Rhijn, M.; de Glas, N.A.; Beekman, M.; Slagboom, P.E.; Portielje, J.E.A.; et al. The association of blood biomarkers with treatment response and adverse health outcomes in older patients with solid tumors: A systematic review. J. Geriatr. Oncol. 2023, 14, 101567. [Google Scholar] [CrossRef]
  10. Zhou, W.; Kuang, T.; Han, X.; Chen, W.; Xu, X.; Lou, W.; Wang, D. Prognostic role of lymphocyte-to-monocyte ratio in pancreatic neuroendocrine neoplasms. Endocr. Connect. 2020, 9, 289–298. [Google Scholar] [CrossRef]
  11. Pan, X.F.; He, M.; Yu, C.; Lv, J.; Guo, Y.; Bian, Z.; Yang, L.; Chen, Y.; Wu, T.; Chen, Z.; et al. Type 2 diabetes and risk of incident cancer in china: A prospective study among 0.5 million chinese adults. Am. J. Epidemiol. 2018, 187, 1380–1391. [Google Scholar] [CrossRef] [PubMed]
  12. Chen, Y.; Wu, F.; Saito, E.; Lin, Y.; Song, M.; Luu, H.N.; Gupta, P.C.; Sawada, N.; Tamakoshi, A.; Shu, X.O.; et al. Association between type 2 diabetes and risk of cancer mortality: A pooled analysis of over 771,000 individuals in the asia cohort consortium. Diabetologia 2017, 60, 1022–1032. [Google Scholar] [CrossRef] [PubMed]
  13. Buono, R.; Longo, V.D. Starvation, stress resistance, and cancer. Trends Endocrinol. Metab. 2018, 29, 271–280. [Google Scholar] [CrossRef]
  14. Klil-Drori, A.J.; Azoulay, L.; Pollak, M.N. Cancer, obesity, diabetes, and antidiabetic drugs: Is the fog clearing? Nat. Rev. Clin. Oncol. 2017, 14, 85–99. [Google Scholar] [CrossRef] [PubMed]
  15. Goncalves, M.D.; Hopkins, B.D.; Cantley, L.C. Phosphatidylinositol 3-kinase, growth disorders, and cancer. N. Engl. J. Med. 2018, 379, 2052–2062. [Google Scholar] [CrossRef] [PubMed]
  16. Ramteke, P.; Deb, A.; Shepal, V.; Bhat, M.K. Hyperglycemia associated metabolic and molecular alterations in cancer risk, progression, treatment, and mortality. Cancers 2019, 11, 1402. [Google Scholar] [CrossRef] [PubMed]
  17. Biswas, S.; Chakrabarti, S. Increased extracellular matrix protein production in chronic diabetic complications: Implications of non-coding RNAs. Noncoding RNA 2019, 5, 30. [Google Scholar] [CrossRef] [PubMed]
  18. Yan, B.; Tao, Z.F.; Li, X.M.; Zhang, H.; Yao, J.; Jiang, Q. Aberrant expression of long noncoding RNAs in early diabetic retinopathy. Investig. Ophthalmol. Vis. Sci. 2014, 55, 941–951. [Google Scholar] [CrossRef]
  19. Yang, M.; Vousden, K.H. Serine and one-carbon metabolism in cancer. Nat. Rev. Cancer 2016, 16, 650–662. [Google Scholar] [CrossRef]
  20. Carnero, A.; Lleonart, M. The hypoxic microenvironment: A determinant of cancer stem cell evolution. BioEssays 2016, 38 (Suppl. 1), S65–S74. [Google Scholar] [CrossRef]
  21. Shi, Y.; Shen, G.; Zeng, Y.; Ju, M.; Chen, X.; He, C.; Liang, L.; Ge, X.; Sun, X.; Di, X. Predictive values of the hemoglobin, albumin, lymphocyte and platelet score (HALP) and the modified-gustave roussy immune score for esophageal squamous cell carcinoma patients undergoing concurrent chemoradiotherapy. Int. Immunopharmacol. 2023, 123, 110773. [Google Scholar] [CrossRef] [PubMed]
  22. Tuncel, E.T.; Parvizi, M.; Kut, E.; Aydın, M.; Kasap, E. Prognostic significance of hemoglobin/prognostic nutritional index and hemoglobin/red blood cell distribution in rectal cancer. Turk. J. Gastroenterol. 2023, 34, 128–134. [Google Scholar] [CrossRef]
  23. Zhao, S.T.; Chen, X.X.; Yang, X.M.; He, S.C.; Qian, F.H. Application of monocyte-to-albumin ratio and neutrophil percentage-to-hemoglobin ratio on distinguishing non-small cell lung cancer patients from healthy subjects. Int. J. Gen. Med. 2023, 16, 2175–2185. [Google Scholar] [CrossRef] [PubMed]
  24. Ryan, A.M.; Power, D.G.; Daly, L.; Cushen, S.J.; Ní Bhuachalla, Ē.; Prado, C.M. Cancer-associated malnutrition, cachexia and sarcopenia: The skeleton in the hospital closet 40 years later. Proc. Nutr. Soc. 2016, 75, 199–211. [Google Scholar] [CrossRef] [PubMed]
  25. Efremova, M.; Rieder, D.; Klepsch, V.; Charoentong, P.; Finotello, F.; Hackl, H.; Hermann-Kleiter, N.; Löwer, M.; Baier, G.; Krogsdam, A.; et al. Targeting immune checkpoints potentiates immunoediting and changes the dynamics of tumor evolution. Nat. Commun. 2018, 9, 32. [Google Scholar] [CrossRef] [PubMed]
  26. Chen, J.L.; Wu, J.N.; Lv, X.D.; Yang, Q.C.; Chen, J.R.; Zhang, D.M. The value of red blood cell distribution width, neutrophil-to-lymphocyte ratio, and hemoglobin-to-red blood cell distribution width ratio in the progression of non-small cell lung cancer. PLoS ONE 2020, 15, e0237947. [Google Scholar] [CrossRef] [PubMed]
  27. Wei, Y.S.; Zhou, Y.G.; Wang, G.Y.; Liang, Z.H.; Luo, M.R.; Yang, T.A.; Huang, J. The impact of chemotherapy-associated hemoglobin on prognosis of colorectal cancer patients receiving adjuvant chemotherapy. Cancer Biomark. 2017, 20, 627–635. [Google Scholar] [CrossRef]
  28. De Francesco, E.M.; Pellegrino, M.; Santolla, M.F.; Lappano, R.; Ricchio, E.; Abonante, S.; Maggiolini, M. Gper mediates activation of hif1α/vegf signaling by estrogens. Cancer Res. 2014, 74, 4053–4064. [Google Scholar] [CrossRef] [PubMed]
  29. Mori, K.; Janisch, F.; Mostafaei, H.; Lysenko, I.; Karakiewicz, P.I.; Enikeev, D.V.; Briganti, A.; Kimura, S.; Egawa, S.; Shariat, S.F. Prognostic value of hemoglobin in metastatic hormone-sensitive prostate cancer: A systematic review and meta-analysis. Clin. Genitourin. Cancer 2020, 18, e402–e409. [Google Scholar] [CrossRef]
  30. Magrowski, Ł.; Masri, O.; Ciepał, J.; Depowska, G.; Nowicka, Z.; Stando, R.; Chimiak, K.; Bylica, G.; Czapla, B.; Masri, M.; et al. Pre-treatment hemoglobin concentration and absolute monocyte count as independent prognostic factors for survival in localized or locally advanced prostate cancer patients undergoing radiotherapy. Biomedicines 2022, 10, 2514. [Google Scholar] [CrossRef]
  31. Katz, S.C.; Donkor, C.; Glasgow, K.; Pillarisetty, V.G.; Gönen, M.; Espat, N.J.; Klimstra, D.S.; D’Angelica, M.I.; Allen, P.J.; Jarnagin, W.; et al. T cell infiltrate and outcome following resection of intermediate-grade primary neuroendocrine tumours and liver metastases. HPB 2010, 12, 674–683. [Google Scholar] [CrossRef] [PubMed]
  32. Bai, J.; Song, J.; Zhang, Y.; Li, X.; Yan, L.; Hu, P.; Tang, Q. Transcatheter arterial embolization in patients with neuroendocrine neoplasms related to liver metastasis with different blood supplies. Cancer Med. 2023, 12, 18578–18587. [Google Scholar] [CrossRef] [PubMed]
Figure 1. Flow diagram shows patients selection. pNEN, pancreatic neuroendocrine neoplasm.
Jpm 14 00760 g001
Figure 2. ROC curve analyses of FAR, FLR, and FHR according to PFS and OS. (AC) According to PFS, the AUC of FAR, FLR, and FHR was 0.693, 0.690, and 0.661, respectively. (DF) According to OS, the AUC of FAR, FLR, and FHR was 0.770, 0.692, and 0.715, respectively. ROC, receiver operating characteristic; AUC, area under the curve; FBG, fasting blood glucose; FAR, FBG-to-albumin ratio; FLR, FBG-to-lymphocytes ratio; FHR, FBG-to-hemoglobin ratio; PFS, progression-free survival; OS, overall survival.
Jpm 14 00760 g002
Figure 3. Forest plot showing predictors of PFS in pNEN patients. (A) Univariate analysis presented that the FAR, FLR, FHR, and APAR et al. were predictors of PFS in pNEN patients. (B) Multivariate analysis showed that the FLR was independent of PFS in pNEN patients. PNEN, pancreatic neuroendocrine neoplasm; FBG, fasting blood glucose; FAR, FBG-to-albumin ratio; FLR, FBG-to-lymphocytes ratio; FHR, FBG-to-hemoglobin ratio; PFS, progression-free survival; APAR, alkaline phosphatase-to-albumin ratio; Alb, albumin; Hb, hemoglobin.
Jpm 14 00760 g003
Figure 4. Kaplan–Meier curves of PFS in the high- and low-value groups according to the cutoff values of FAR, FLR, and FHR. (A) The median PFS in the low-FAR group was significantly longer compared with the high FAR group (p < 0.001). (B) The median PFS in the low-FLR group was significantly longer compared with the high FLR group (p < 0.001). (C) The median PFS in the low-FHR group was significantly longer compared with the high FHR group (p = 0.002). FBG, fasting blood glucose; FAR, FBG-to-albumin ratio; FLR, FBG-to-lymphocytes ratio; FHR, FBG-to-hemoglobin ratio; PFS, progression-free survival.
Jpm 14 00760 g004
Figure 5. Forest plot showing predictors of OS in pNEN patients. (A) Univariate analysis presented that the FAR, APAR, and albumin et al. were predictors of OS in pNEN patients. (B) Multivariate analysis showed that the FAR was an independent predictor of OS in pNEN patients. pNEN, pancreatic neuroendocrine neoplasm; FBG, fasting blood glucose; FAR, FBG-to-albumin ratio; OS, overall survival; APAR, alkaline phosphatase-to-albumin ratio; Alb, albumin; Hb, hemoglobin.
Jpm 14 00760 g005
Figure 6. Kaplan–Meier curves of OS in the high- and low-value groups according to the cutoff values of FAR, FLR, and FHR. (A) The median OS in the low-FAR group was significantly longer compared with the high FAR group (p < 0.001). (B) The median OS in the low-FLR group was significantly longer compared with the high FLR group (p = 0.037). (C) The median PFS in the low-FHR group was significantly longer compared with the high-FHR group (p = 0.024). FBG, fasting blood glucose; FAR, FBG-to-albumin ratio; FLR, FBG-to-lymphocytes ratio; FHR, FBG-to-hemoglobin ratio; OS, overall survival.
Jpm 14 00760 g006
Figure 7. Prediction value of FAR in patients with pNEN and synchronous metastasis. (A) ROC curve analysis of FAR showed the AUC was 0.704. (B) Kaplan–Meier curves of PFS presented that the low-FAR group was significantly prolonged compared with the high-value cohort (p = 0.022). (C) Kaplan–Meier curves of OS presented that the low-FAR group was significantly prolonged compared with the high-value cohort (p = 0.002). PNEN, pancreatic neuroendocrine neoplasm; FBG, fasting blood glucose; FAR, FBG-to-albumin ratio; ROC, receiver operating characteristic; AUC, area under the curve; PFS, progression-free survival; OS, overall survival.
Jpm 14 00760 g007
Table 1. Baseline characteristics of patients with pNEN.
CharacteristicsAll (N = 178)Recover (N = 145)Progress (N = 33)p-Value
Onset age (years)48.1 ± 13.547.6 ± 13.750.6 ± 12.30.247
Operative age (years)50.6 ± 13.049.8 ± 13.454.0 ± 10.60.095
Gender 0.312
Male83 (46.6%)65 (44.8%)18 (54.5%)
Female95 (53.4%)80 (55.2%)15 (45.5%)
BMI (kg/m2)23.9 ± 3.724.3 ± 3.622.2 ± 3.60.003
Region 0.185
Urban94 (52.8%)80 (55.2%)14 (42.4%)
Rural84 (47.2)65 (44.8%)19 (57.6%)
Smoking21 (11.8%)18 (12.4%)3 (9.1%)0.593
Drinking12 (6.7%)12 (8.1%)1 (3.0%)0.296
Hypertension21 (11.8%)14 (9.7%)7 (21.2%)0.063
Diabetes16 (9.0%)11(7.6%)5 (15.2%)0.170
Tumor
Diameter (cm)2.4 ± 1.62.2 ± 1.33.1 ± 2.30.002
Number 0.670
Single164 (92.1%)133 (91.7%)31 (93.9%)
Multiple14 (7.9%)12 (8.3%)2 (6.1%)
Location 0.791
Head-neck88 (50.6%)71 (49.0%)17 (51.5%)
Body-tail90 (49.4%)74 (51.0%)16 (48.5%)
Type 0.031
Function84 (47.2%)74 (51.0%)10 (30.3%)
Nonfunction94 (52.8%)71 (49.0%)23 (69.7%)
Metastasis <0.001
Yes30 (16.9%)0 (0%)3 (9.1%)
No148 (83.1%)145 (100.0%)30 (90.9%)
Ki-67 index4.4 ± 6.53.1 ± 3.610.2 ± 11.6<0.001
Histological grade <0.001
G198 (55.1%)89 (61.45)9 (27.3%)
G268 (38.2%)53 (36.6%)15 (45.5%)
G312 (6.7%)5 (2.1%)9 (27.3%)
AJCC stage <0.001
I134 (75.3%)132 (91.0%)2 (6.1%)
II17 (9.6%)13 (9.0%)4 (12.1%)
III6 (3.4)0 (0%)6 (18.2%)
IV21 (11.8%)0 (0%)21 (63.6%)
FBG (mmol/L)4.7 ± 3.84.1 ± 2.37.3 ± 6.9<0.001
Albumin (g/L)39.2 ± 4.439.2 ± 4.539.4 ± 3.60.803
ALP (U/L)85.7 ± 56.178.6 ± 42.3117.1 ± 90.0<0.001
Lymphocytes1.7 ± 0.61.7 ± 0.61.6 ± 0.70.126
Hb128.2 ± 16.5128.8 ± 17.0125.7 ± 13.80.335
Cholesterol (mmol/L)4.4 ± 1.04.4 ± 1.14.4 ± 0.90.964
Triglycerides (mmol/L)1.4 ± 1.21.5 ± 1.21.2 ± 0.70.315
The bold font represent p < 0.05; pNEN, pancreatic neuroendocrine neoplasm; BMI, body mass index; AJCC, American Joint Committee on Cancer; FBG, fasting blood glucose; ALP, alkaline phosphatase; Hb, hemoglobin.
Table 2. Baseline characteristics of patients with pNEN and metastasis.
CharacteristicsAll (N = 30)
Onset age (years)49.8 ± 11.6
Operative age (years)52.7 ± 9.9
Gender
Male17 (43.3%)
Female13 (56.7%)
BMI (kg/m2)22.0 ± 3.5
Region
Urban14 (46.7%)
Rural16 (53.3%)
Smoking2 (6.7%)
Drinking1 (3.3%)
Hypertension3 (10.0%)
Diabetes3 (10.0%)
Tumor
Diameter (cm)3.1 ± 2.4
Number
Single28 (93.3%)
Multiple2 (6.7%)
Location
Head-neck14 (46.7%)
Body-tail16 (53.3%)
Type
Function9 (30.0%)
Nonfunction21 (70.0%)
Ki-67 index10.1 ± 11.9
Histological grade
G18 (26.7%)
G214 (46.7%)
G38 (26.7%)
AJCC stage
I0
II0
III6 (20.0%)
IV21 (70%)
FBG (mmol/L)6.6 ± 5.4
Albumin (g/L)39.4 ± 3.8
ALP (U/L)120.0 ± 93.9
Lymphocytes1.6 ± 0.7
Hb126.1 ± 13.7
Cholesterol (mmol/L)4.4 ± 0.9
Triglycerides (mmol/L)1.2 ± 0.7
PNEN, pancreatic neuroendocrine neoplasm; BMI, body mass index; AJCC, American Joint Committee on Cancer; FBG, fasting blood glucose; ALP, Alkaline phosphatase; Hb, hemoglobin.
Table 3. Univariate and multivariate analysis of PFS for patients with pNEN and metastasis.
CharacteristicsUnivariate AnalysisMultivariate Analysis
HR (95% CI)p-ValueHR (95% CI)p-Value
Age0.88 (0.24, 3.20)0.845
<56
≥56 *
Gender0.50 (0.17, 1.44)0.199
Male
Female *
Smoking0.04 (0.00, 178.2)0.448
Yes
No *
Drinking0.04 (0.00, 178.2)0.448
Yes
No *
Tumor
Diameter0.48 (0.19, 1.18)0.109
<2 cm
≥2 cm *
Number1.56 (0.20, 12.28)0.671
Location1.70 (0.58, 4.97)0.337
Head-Neck
Body-Tail *
Grade1.30 (0.36, 4.70)0.685
G1/2
G3 *
AJCC stage32.51 (0.12, 9220)0.227
I/II
III/IV *
Triglyceride
Cholesterol
FBG1.06 (0.98, 1.14)0.152
Hb0.99 (0.96, 1.03)0.712
Lymphocytes0.82 (0.37, 1.79)0.611
Alb0.99 (0.86, 1.14)0.880
APAR1.53 (0.48, 4.88)0.476
<2.2
≥2.2 *
FBG/Alb3.34 (1.11, 10.06)0.0323.34 (1.11, 10.06)0.032
<0.17
≥0.17 *
FBG/Hb2.13 (0.27, 16.59)0.470
<0.028
≥0.028 *
FBG/Lc2.02 (0.62, 6.55)0.243
<2.85
≥2.85 *
*, reference index; The bold font represent p < 0.05; PFS, progression-free survival; HR, hazard ratio; CI, confidence interval; AJCC, American Joint Committee on Cancer; FBG, fasting blood glucose; Hb, hemoglobin; Alb, albumin; APAR, alkaline phosphatase-to-albumin ratio; Lc, lymphocytes.
Table 4. Univariate and multivariate analysis of OS for patients with pNEN and metastasis.
CharacteristicsUnivariate AnalysisMultivariate Analysis
HR (95% CI)p ValueHR (95% CI)p Value
Age2.30 (0.38, 13.86)0.365
<56
≥56 *
Gender0.31 (0.05, 1.88)0.204
Male
Female *
Smoking0.04 (0.00, 20,227)0.626
Yes
No *
Drinking0.04 (0.00, 20,227)0.626
Yes
No *
Tumor
Diameter0.84 (0.21, 3.33)0.799
<2 cm
≥2 cm *
Number0.05 (0.00, 355,142)0.738
Location6.21 (0.67, 57.56)0.108
Head-Neck
Body-Tail *
Grade1.58 (0.18, 14.25)0.685
G1/2
G3 *
AJCC stage29.18 (0.00, 41,576)0.489
I/II
III/IV *
Triglyceride
Cholesterol
FBG1.15 (1.03, 1.28)0.012
Hb1.03 (0.96, 1.10)0.448
Lymphocytes0.88 (0.25, 3.03)0.837
Alb1.10 (0.88, 1.38)0.392
APAR2.38 (0.26, 21.60)0.441
<2.2
≥2.2 *
FBG/Alb250.7 (0.01, 59,184)0.282
<0.17
≥0.17 *
FBG/Hb27 (0.00, 1,398,079)0.552
<0.028
≥0.028 *
FBG/Lc3.32 (0.37, 30.07)0.285
<2.85
≥2.85 *
*, reference index; The bold font represent p < 0.05; OS, overall survival; HR, hazard ratio; CI, confidence interval; AJCC, American Joint Committee on Cancer; FBG, fasting blood glucose; Hb, hemoglobin; Alb, albumin; APAR, alkaline phosphatase-to-albumin ratio; Lc, lymphocytes.
Disclaimer/Publisher’s Note: The statements, opinions and data contained in all publications are solely those of the individual author(s) and contributor(s) and not of MDPI and/or the editor(s). MDPI and/or the editor(s) disclaim responsibility for any injury to people or property resulting from any ideas, methods, instructions or products referred to in the content.

