
Development of a User-Friendly Self-Screening Tool for Assessing Metabolic Syndrome Risk in Youths from Economically Challenged Regions

 , ,
, ,  , , ,
, , ,  , ,
, ,
Abstract
:1. Introduction
2. Materials and Methods
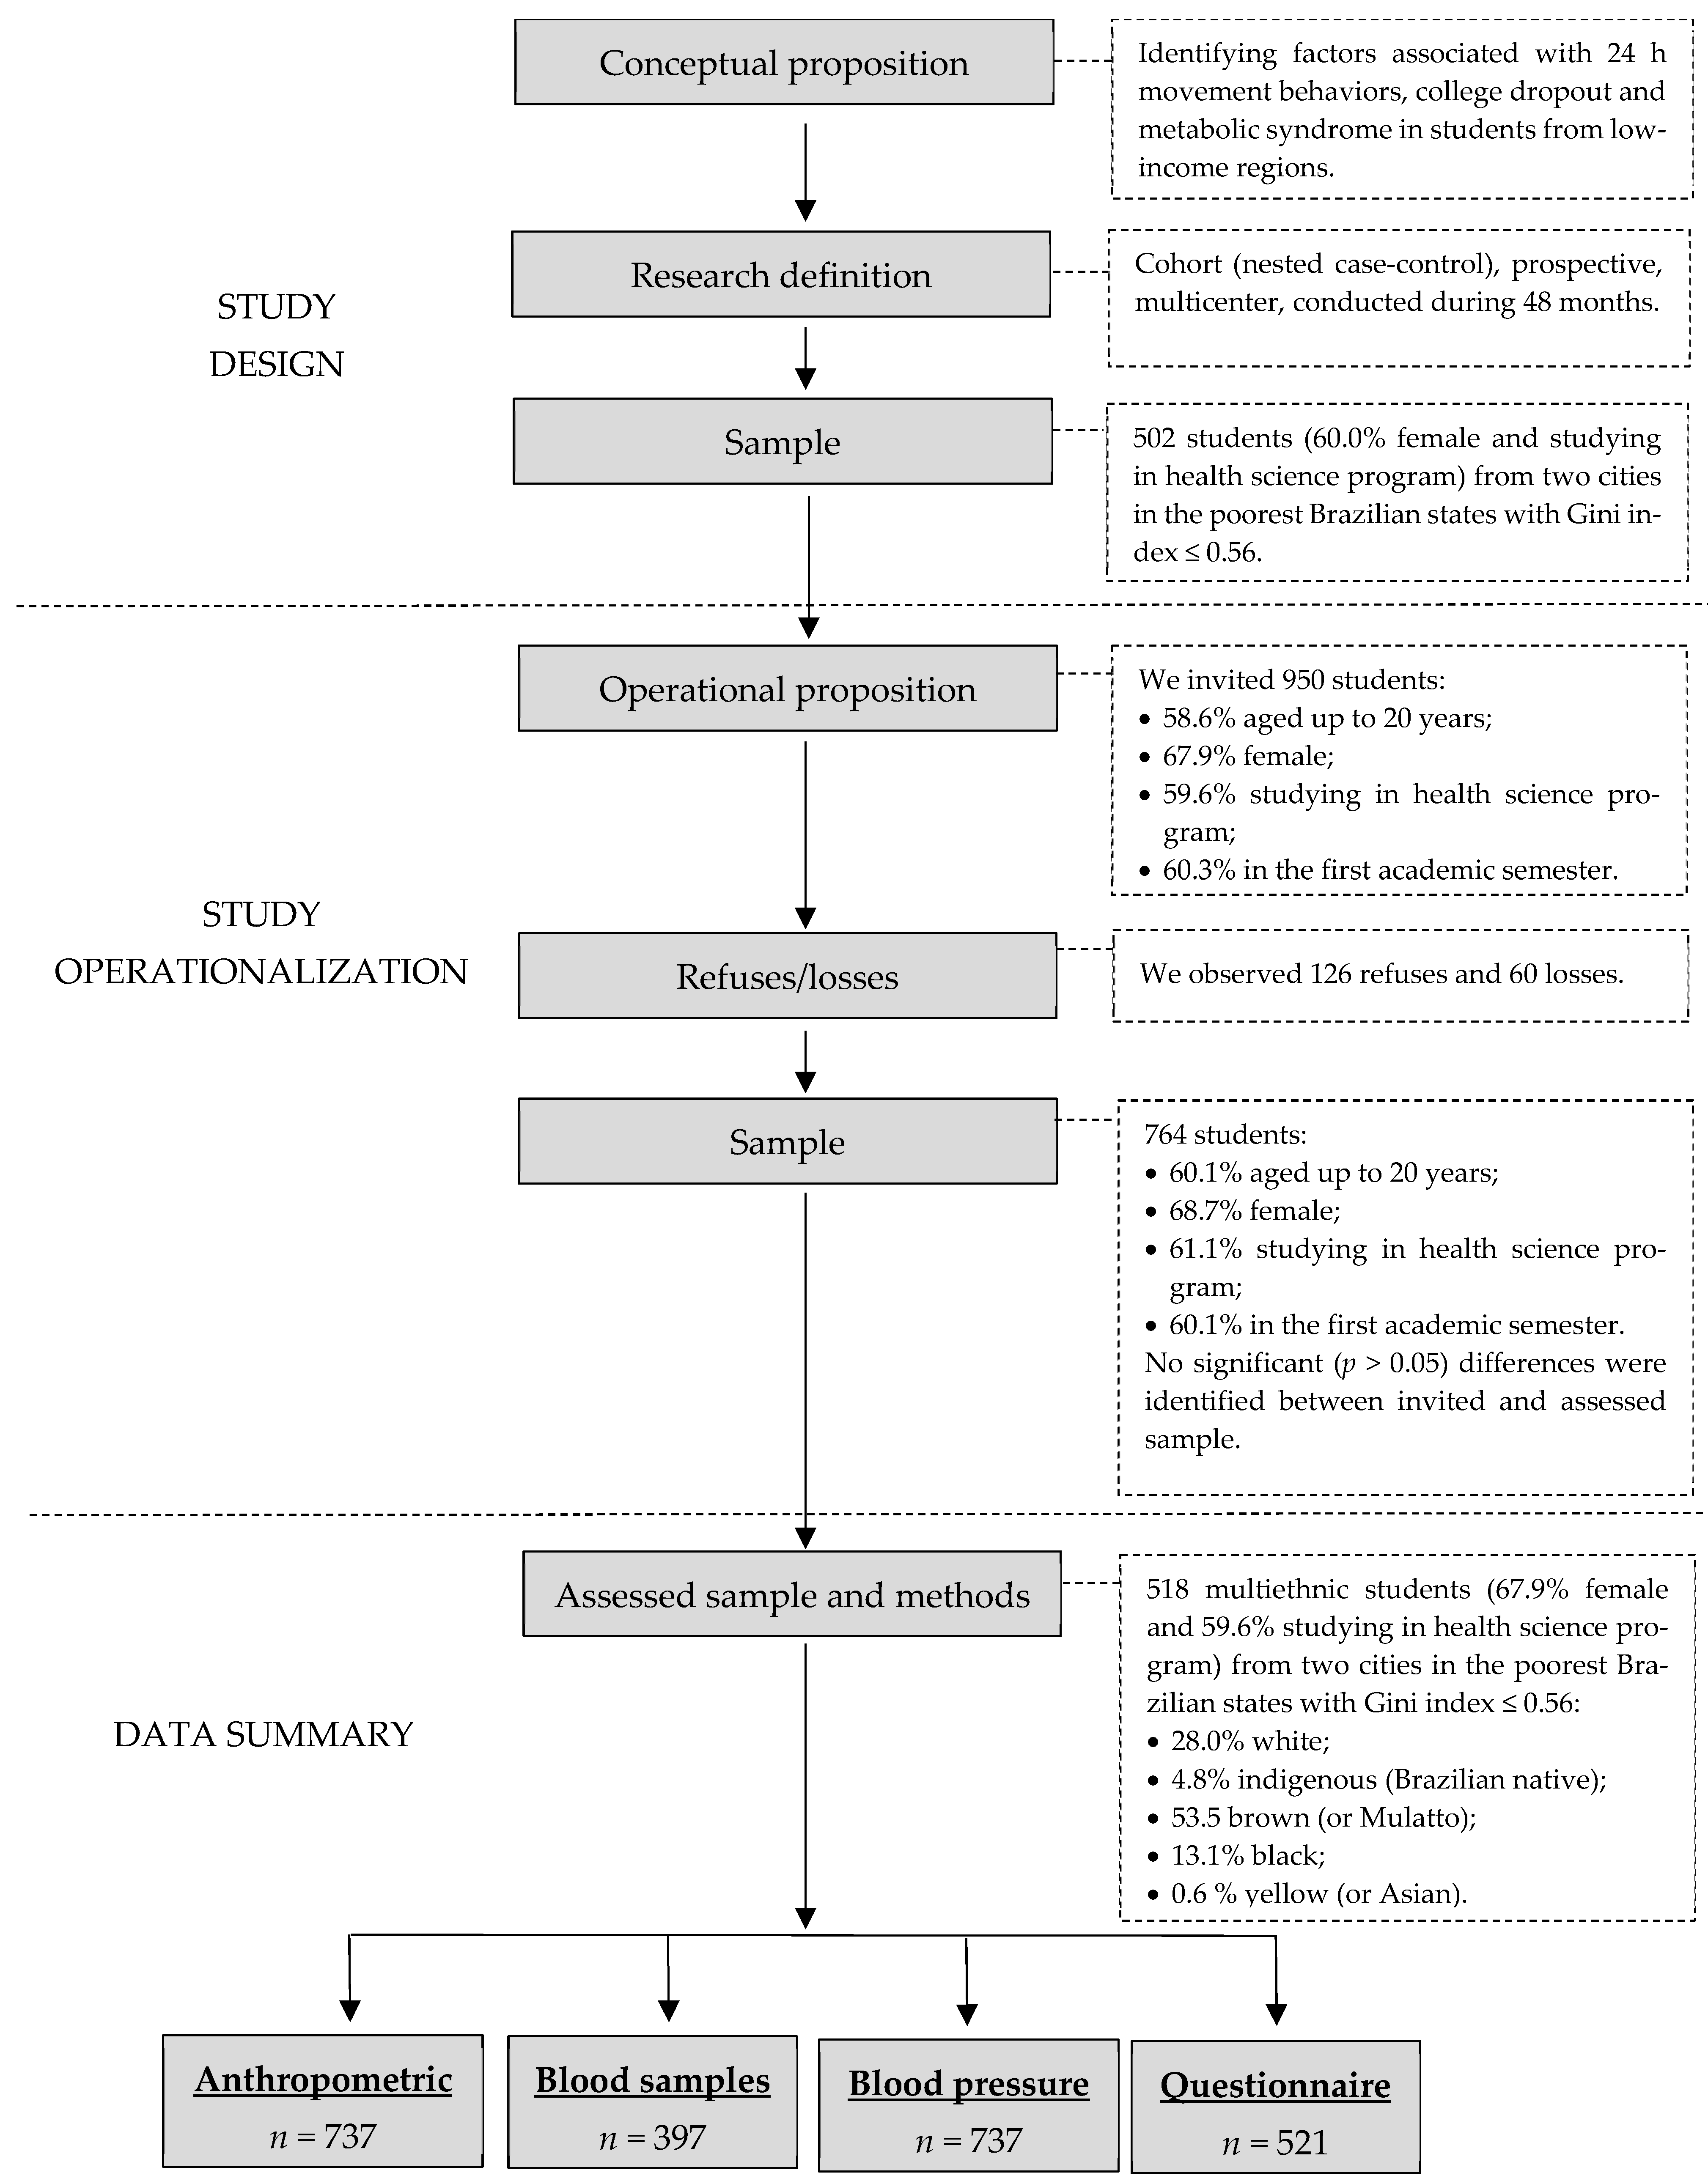
2.1. Study Design
2.2. Ethical Aspects
2.3. Participants
2.4. Variables
2.4.1. Demographic and Economic Variables
2.4.2. School Context
2.4.3. 24 h Movement Behaviors
2.4.4. Body Weight
2.4.5. Abdominal Obesity
2.4.6. Metabolic Syndrome
2.5. Procedures
2.6. Statistical Analysis
3. Results
4. Discussion
5. Conclusions
Author Contributions
Funding
Institutional Review Board Statement
Informed Consent Statement
Data Availability Statement
Acknowledgments
Conflicts of Interest
References
- Alberti, K.G.; Eckel, R.H.; Grundy, S.M.; Zimmet, P.Z.; Cleeman, J.I.; Donato, K.A.; Fruchart, J.C.; James, W.P.T.; Loria, C.M.; Smith, S.C., Jr. Harmonizing the metabolic syndrome: A joint interim statement of the International Diabetes Federation Task Force on Epidemiology and Prevention; National Heart, Lung, and Blood Institute; American Heart Association; World Heart Federation; International Atherosclerosis Society; and International Association for the Study of Obesity. Circulation 2009, 120, 1640–1645. [Google Scholar] [CrossRef]
- Noubiap, J.J.; Nansseu, J.R.; Lontchi-Yimagou, E.; Nkeck, J.R.; Nyaga, U.F.; Ngouo, A.T.; Tounouga, D.N.; Tianyi, F.L.; Foka, A.J.; Ndoadoumgue, A.L.; et al. Global, regional, and country estimates of metabolic syndrome burden in children and adolescents in 2020: A systematic review and modelling analysis. Lancet Child Adolesc. Health 2022, 6, 158–170. [Google Scholar] [CrossRef]
- Orsini, F.; D’ambrosio, F.; Scardigno, A.; Ricciardi, R.; Calabrò, G.E. Epidemiological Impact of Metabolic Syndrome in Overweight and Obese European Children and Adolescents: A Systematic Literature Review. Nutrients 2023, 15, 3895. [Google Scholar] [CrossRef]
- Ward, Z.J.; Long, M.W.; Resch, S.C.; Giles, C.M.; Cradock, A.L.; Gortmaker, S.L. Simulation of Growth Trajectories of Childhood Obesity into Adulthood. N. Engl. J. Med. 2017, 377, 2145–2153. [Google Scholar] [CrossRef]
- Krishnamoorthy, Y.; Rajaa, S.; Murali, S.; Sahoo, J.; Kar, S.S. Association Between Anthropometric Risk Factors and Metabolic Syndrome Among Adults in India: A Systematic Review and Meta-Analysis of Observational Studies. Prev. Chronic Dis. 2022, 19, E24. [Google Scholar] [CrossRef]
- Crouch, E.; Abshire, D.A.; Wirth, M.D.; Hung, P.; Benavidez, G.A. Rural–Urban Differences in Overweight and Obesity, Physical Activity, and Food Security Among Children and Adolescents. Prev. Chronic Dis. 2023, 20, E92. [Google Scholar] [CrossRef]
- Macías, N.; Espinosa-Montero, J.; Monterrubio-Flores, E.; Hernández-Barrera, L.; Medina-Garcia, C.; Gallegos-Carrillo, K.; Campos-Nonato, I. Screen-Based Sedentary Behaviors and Their Association with Metabolic Syndrome Components Among Adults in Mexico. Prev. Chronic Dis. 2021, 18, E95. [Google Scholar] [CrossRef]
- González-Domínguez, Á.; Belmonte, T.; González-Domínguez, R. Childhood obesity, metabolic syndrome, and oxidative stress: MicroRNAs go on stage. Rev. Endocr. Metab. Disord. 2023, 24, 1147–1164. [Google Scholar] [CrossRef]
- Shin, M.-S.; Lee, J.-Y. Building a Nomogram for Metabolic Syndrome Using Logistic Regression with a Complex Sample—A Study with 39,991,680 Cases. Healthcare 2022, 10, 372. [Google Scholar] [CrossRef] [PubMed]
- Balachandran, V.P.; Gonen, M.; Smith, J.J.; DeMatteo, R.P. Nomograms in oncology: More than meets the eye. Lancet Oncol. 2015, 16, e173–e180. [Google Scholar] [CrossRef] [PubMed]
- Nascimento-Ferreira, M.V.; Berg, G.; Zapata, L.I.G.; De Moraes, A.C.F.; Carvalho, H.B. Individualised prognosis for risk of developing abdominal obesity in the paediatric population. Clin. Nutr. ESPEN 2021, 45, 333–340. [Google Scholar] [CrossRef]
- Wang, S.; Jiang, S.; Ye, Q. An anthropometry-based nomogram for predicting metabolic syndrome in the working population. Eur. J. Cardiovasc. Nurs. 2020, 19, 223–229. [Google Scholar] [CrossRef]
- Lan, J.; Zhou, X.; Huang, Q.; Zhao, L.; Li, P.; Xi, M.; Luo, M.; Wu, Q.; Tang, L. Development and validation of a simple-to-use nomogram for self-screening the risk of dyslipidemia. Sci. Rep. 2023, 13, 9169. [Google Scholar] [CrossRef] [PubMed]
- Liu, Q.; Yuan, J.; Bakeyi, M.; Li, J.; Zhang, Z.; Yang, X.; Gao, F. Development and Validation of a Nomogram to Predict Type 2 Diabetes Mellitus in Overweight and Obese Adults: A Prospective Cohort Study from 82938 Adults in China. Int. J. Endocrinol. 2020, 2020, 8899556. [Google Scholar] [CrossRef]
- Yang, J.; Wang, X.; Jiang, S. Development and validation of a nomogram model for individualized prediction of hypertension risk in patients with type 2 diabetes mellitus. Sci. Rep. 2023, 13, 1298. [Google Scholar] [CrossRef]
- Zhou, B.; Yuan, Y.; Wang, K.; Niu, W.; Zhang, Z. Interaction effects of significant risk factors on overweight or obesity among 7222 preschool–aged children from Beijing. Aging 2020, 12, 15462–15477. [Google Scholar] [CrossRef]
- Liang, J.-H.; Zhao, Y.; Chen, Y.-C.; Huang, S.; Zhang, S.-X.; Jiang, N.; Kakaer, A.; Chen, Y.-J. Development and Validation of a Nomogram-Based Prognostic Model to Predict High Blood Pressure in Children and Adolescents—Findings From 342,736 Individuals in China. Front. Cardiovasc. Med. 2022, 9, 884508. [Google Scholar] [CrossRef] [PubMed]
- Blanquet, M.; Legrand, A.; Pélissier, A.; Mourgues, C. Socio-economics status and metabolic syndrome: A meta-analysis. Diabetes Metab. Syndr. 2019, 13, 1805–1812. [Google Scholar] [CrossRef] [PubMed]
- Homan, P.; Brown, T.H.; King, B. Structural Intersectionality as a New Direction for Health Disparities Research. J. Health Soc. Behav. 2021, 62, 350–370. [Google Scholar] [CrossRef]
- Rollo, S.; Antsygina, O.; Tremblay, M.S. The whole day matters: Understanding 24-hour movement guideline adherence and relationships with health indicators across the lifespan. J. Sport Health Sci. 2020, 9, 493–510. [Google Scholar] [CrossRef]
- Nascimento-Ferreira, M.; Marin, K.A.; Abrão Ferreira, R.; Oliveira, L.F.; Bandeira, A.C.; Sousa, P.S.; de Sousa, J.M.; Cardoso, A.G.d.A.; da Silva, L.C.C.; Rosa, A.C.A.; et al. 24 h movement behavior and metabolic syndrome study protocol: A prospective cohort study on lifestyle and risk of developing metabolic syndrome in undergraduate students from low-income regions during a pandemic. Front. Epidemiology 2022, 2, 1010832. [Google Scholar] [CrossRef] [PubMed]
- Brasil. Índice de Gini da renda domiciliar per capita Maranhão (Período: 1991, 2000 e 2010) Ministério da Saúde. Available online: http://tabnet.datasus.gov.br/cgi/ibge/censo/cnv/ginima.def (accessed on 4 April 2022).
- Brasil. Pesquisa de Orçamento Familiar (POF). Available online: https://cidades.ibge.gov.br/brasil/to/miracema-do-tocantins/pesquisa/36/30246 (accessed on 21 May 2021).
- Miranda, A.L.C.; da Paixão, A.R.T.; Pedroso, A.O.; Lima, L.D.E.S.; Parente, A.T.; Botelho, E.P.; Polaro, S.H.I.; Silva, A.C.d.O.e.; Reis, R.K.; Ferreira, G.R.O.N. Demographic, social, and clinical aspects associated with access to COVID-19 health care in Pará province, Brazilian Amazon. Sci. Rep. 2024, 14, 8776. [Google Scholar] [CrossRef] [PubMed]
- Ross, R.; Chaput, J.-P.; Giangregorio, L.M.; Janssen, I.; Saunders, T.J.; E Kho, M.; Poitras, V.J.; Tomasone, J.R.; El-Kotob, R.; McLaughlin, E.C.; et al. Canadian 24-Hour Movement Guidelines for Adults aged 18–64 years and Adults aged 65 years or older: An integration of physical activity, sedentary behaviour, and sleep. Appl. Physiol. Nutr. Metab. 2020, 45 (Suppl. S2), S57–S102. [Google Scholar] [CrossRef] [PubMed]
- Matsudo, S.; Araújo, T.; Marsudo, V.; Andrade, D.; Andrade, E.; Braggion, G. Questionário Internacional de Atividade Física (IPAQ): Estudo de validade e reproduti-bilidade no Brasil. Rev. Bras. Atividade Física Saúde 2001, 6, 5–18. [Google Scholar]
- Nascimento-Ferreira, M.V.; Rosa, A.C.A.; Azevedo, J.C.; Santos, A.R.A.; De Araujo-Moura, K.; Ferreira, K.A. Psychometric Properties of the Online International Physical Activity Questionnaire in College Students. Int. J. Environ. Res. Public Health 2022, 19, 15380. [Google Scholar] [CrossRef] [PubMed]
- De Moraes, A.C.F.; Nascimento-Ferreira, M.V.; Forjaz, C.L.d.M.; Aristizabal, J.C.; Azzaretti, L.; Junior, W.V.N.; Miguel-Berges, M.L.; Skapino, E.; Delgado, C.; Moreno, L.A.; et al. Reliability and validity of a sedentary behavior questionnaire for South American pediatric population: SAYCARE study. BMC Med. Res. Methodol. 2020, 20, 5. [Google Scholar] [CrossRef] [PubMed]
- de Oliveira, L.F.; dos Santos, E.A.; Franco, A.M.; Marin, K.A.; Nascimento-Ferreira, M.V. Assessment of the validity of a sedentary behavior questionnaire among university students from low-income regions. Nutr. Hosp. 2023, 40, 771–777. [Google Scholar] [CrossRef]
- Buysse, D.J.; Reynolds, C.F., III; Monk, T.H.; Berman, S.R.; Kupfer, D.J. The Pittsburgh sleep quality index: A new instrument for psychiatric practice and research. Psychiatry Res. 1989, 28, 193–213. [Google Scholar] [CrossRef]
- Bertolazi, A.N.; Fagondes, S.C.; Hoff, L.S.; Dartora, E.G.; Miozzo, I.C.d.S.; de Barba, M.E.F.; Barreto, S.S.M. Validation of the Brazilian Portuguese version of the Pittsburgh Sleep Quality Index. Sleep Med. 2011, 12, 70–75. [Google Scholar] [CrossRef]
- Tremblay, M.S.; Carson, V.; Chaput, J.-P.; Gorber, S.C.; Dinh, T.; Duggan, M.; Faulkner, G.; Gray, C.E.; Gruber, R.; Janson, K.; et al. Canadian 24-Hour Movement Guidelines for Children and Youth: An Integration of Physical Activity, Sedentary Behaviour, and Sleep. Appl. Physiol. Nutr. Metab. 2016, 41 (Suppl. S3), S311–S327. [Google Scholar] [CrossRef]
- de Onis, M.; Onyango, A.W.; Van den Broeck, J.; Chumlea, W.C.; Martorell, R. Measurement and standardization protocols for anthropometry used in the construction of a new international growth reference. Food Nutr. Bull. 2004, 25 (Suppl. S1), S15–S26. [Google Scholar] [CrossRef]
- Mokha, J.S.; Srinivasan, S.R.; DasMahapatra, P.; Fernandez, C.; Chen, W.; Xu, J.; Berenson, G.S. Utility of waist-to-height ratio in assessing the status of central obesity and related cardiometabolic risk profile among normal weight and overweight/obese children: The Bogalusa Heart Study. BMC Pediatr. 2010, 10, 73. [Google Scholar] [CrossRef] [PubMed]
- Pickering, T.G.; Hall, J.E.; Appel, L.J.; Falkner, B.E.; Graves, J.; Hill, M.N.; Jones, D.W.; Kurtz, T.; Sheps, S.G.; Roccella, E.J. Recommendations for blood pressure measurement in humans and experimental animals: Part 1: Blood pressure measurement in humans: A statement for professionals from the Subcommittee of Professional and Public Education of the American Heart Association Council on High Blood Pressure Research. Hypertension 2005, 45, 142–161. [Google Scholar] [CrossRef] [PubMed]
- Araújo-Moura, K.; De Moraes, A.C.F.; Forkert, E.C.; Berg, G.; Cucato, G.G.; Forjaz, C.L.d.M.; Moliterno, P.; Gaitan-Charry, D.; Delgado, C.A.; González-Gil, E.M.; et al. Is the Measurement of Blood Pressure by Automatic Monitor in the South American Pediatric Population Accurate? SAYCARE Study. Obesity (Silver Spring) 2018, 26, S41–S46. [Google Scholar] [CrossRef] [PubMed]
- López, G.; Serruya, R.A.; Barchuk, M.; Gaitan-Charry, D.; Torres-Leal, F.L.; Moreno, L.A.; Delgado, C.A.; Carvalho, H.B.; De Moraes, A.C.F.; Berg, G. Sampling and processing blood samples within the South American Youth/Child cARdiovascular and Environmental (SAYCARE) Study. Sci. Rep. 2020, 10, 637. [Google Scholar] [CrossRef] [PubMed]
- Zhang, Z. Model building strategy for logistic regression: Purposeful selection. Ann. Transl. Med. 2016, 4, 111. [Google Scholar] [CrossRef] [PubMed]
- Mandrekar, J.N. Receiver operating characteristic curve in diagnostic test assessment. J. Thorac. Oncol. 2010, 5, 1315–1316. [Google Scholar] [CrossRef] [PubMed]
- Bailey, C.P.; Elmi, A.F.; Hoban, M.T.; Kukich, C.; Napolitano, M.A. Associations between college/university campus characteristics and student body mass index. Environ. Health Prev. Med. 2022, 27, 12. [Google Scholar] [CrossRef]
- Gray, H.L.; Buro, A.W.; Ikan, J.B.; Wang, W.; Stern, M. School-level factors associated with obesity: A systematic review of longitudinal studies. Obes. Rev. 2019, 20, 1016–1032. [Google Scholar] [CrossRef]
- Lehmann, F.; Varnaccia, G.; Zeiher, J.; Lange, C.; Jordan, S. Influencing factors of obesity in school-age children and adolescents—A systematic review of the literature in the context of obesity monitoring. J. Health Monit. 2020, 5 (Suppl. S2), 2–23. [Google Scholar] [CrossRef]
- Bellicha, A.; van Baak, M.A.; Battista, F.; Beaulieu, K.; Blundell, J.E.; Busetto, L.; Carraça, E.V.; Dicker, D.; Encantado, J.; Ermolao, A.; et al. Effect of exercise training on weight loss, body composition changes, and weight maintenance in adults with overweight or obesity: An overview of 12 systematic reviews and 149 studies. Obes. Rev. 2021, 22 (Suppl. S4), e13256. [Google Scholar] [CrossRef] [PubMed]
- Paley, C.A.; Johnson, M.I. Abdominal obesity and metabolic syndrome: Exercise as medicine? BMC Sports Sci. Med. Rehabil. 2018, 10, 7. [Google Scholar] [CrossRef] [PubMed]
- Fahed, G.; Aoun, L.; Bou Zerdan, M.; Allam, S.; Bouferraa, Y.; Assi, H.I. Metabolic Syndrome: Updates on Pathophysiology and Management in 2021. Int. J. Mol. Sci. 2022, 23, 786. [Google Scholar] [CrossRef] [PubMed]
- Adams, R.J.; Piantadosi, C.; Ettridge, K.; Miller, C.; Wilson, C.; Tucker, G.; Hill, C.L. Functional health literacy mediates the relationship between socio-economic status, perceptions and lifestyle behaviors related to cancer risk in an Australian population. Patient Educ. Couns. 2013, 91, 206–212. [Google Scholar] [CrossRef] [PubMed]
- Szklo, M.; Nieto, J. Epidemiology: Beyond the Basics, 3rd ed.; Jones & Bartlett Learning: Burlington, MA, USA, 2014; p. 515. [Google Scholar]
- Boateng, G.O.; Neilands, T.B.; Frongillo, E.A.; Melgar-Quiñonez, H.R.; Young, S.L. Best Practices for Developing and Validating Scales for Health, Social, and Behavioral Research: A Primer. Front. Public Health 2018, 6, 149. [Google Scholar] [CrossRef]
- Peduzzi, P.; Concato, J.; Kemper, E.; Holford, T.R.; Feinstein, A.R. A simulation study of the number of events per variable in logistic regression analysis. J. Clin. Epidemiol. 1996, 49, 1373–1379. [Google Scholar] [CrossRef]

| Variables | Abdominal Obesity | ||
|---|---|---|---|
| No (%) | Yes (%) | p Value | |
| Age | |||
| ≤18 years | 86.4 | 13.6 | <0.001 |
| 19–20 years | 79.2 | 20.8 | |
| ≥21 years | 65.9 | 34.1 | |
| Biological Sex | |||
| Female | 74.4 | 25.6 | 0.031 |
| Male | 83.2 | 16.8 | |
| Race/Ethnicity | |||
| White | 78.4 | 21.6 | 0.371 |
| Indigenous (Brazilian native) | 62.5 | 37.5 | |
| Brown (or Mulatto) | 77.7 | 22.3 | |
| Black and Yellow (or Asian) | 75.8 | 24.2 | |
| Working student | |||
| No | 80.4 | 19.6 | 0.012 |
| Yes | 70.5 | 29.6 | |
| Monthly household income, R$ * | |||
| <1 minimum wage | 82.2 | 17.8 | 0.025 |
| 1–2 minimum wages | 69.9 | 30.0 | |
| ≥3 minimum wages | 67.4 | 32.6 | |
| Score 24 h ‡ | |||
| 0 Meeting 24-h movement | 85.0 | 15.0 | 0.011 |
| 1 Meeting 24-h movement | 71.2 | 28.8 | |
| 2 Meeting 24-h movement | 76.2 | 23.8 | |
| 3 Meeting 24-h movement | 89.7 | 10.3 | |
| Metabolic syndrome | |||
| No | 83.7 | 16.3 | <0.001 |
| Yes | 0.0 | 100.0 | |
| Elementary School—Variables | Abdominal Obesity | p Value | |
| No (%) | Yes (%) | ||
| Grade retention | |||
| No | 78.2 | 21.8 | 0.240 |
| Yes | 71.8 | 28.2 | |
| PE facilities | |||
| No | 68.3 | 31.7 | 0.009 |
| Yes | 70.8 | 20.2 | |
| PE preferred subject | |||
| No | 77.0 | 23.0 | 0.879 |
| Yes | 77.8 | 22.2 | |
| PE classes per week | |||
| No classes | 61.5 | 38.5 | 0.043 |
| 1 class | 77.2 | 22.8 | |
| ≥2 classes | 79.9 | 20.1 | |
| Enrollment in sports training (per week) | |||
| No enrollment | 77.9 | 22.1 | |
| 1 session | 68.1 | 31.9 | 0.121 |
| 2 sessions | 76.5 | 23.5 | |
| ≥3 sessions | 85.7 | 14.3 | |
| Enrollment in sports competition | |||
| No | 73.2 | 26.8 | 0.077 |
| Yes | 79.9 | 20.1 | |
| High school—variables | Abdominal obesity | p value | |
| No (%) | Yes (%) | ||
| Grade retention | |||
| No | 78.8 | 21.2 | 0.014 |
| Yes | 64.4 | 35.6 | |
| PE facilities | |||
| No | 70.0 | 30.0 | 0.063 |
| Yes | 78.8 | 21.2 | |
| PE preferred subject | |||
| No | 77.3 | 22.7 | 0.758 |
| Yes | 75.4 | 24.6 | |
| PE classes per week | |||
| No classes | 70.8 | 29.2 | 0.410 |
| 1 class | 77.4 | 22.6 | |
| ≥2 classes | 78.8 | 21.2 | |
| Enrollment in sports training (per week) | |||
| No enrollment | 79.9 | 20.1 | 0.160 |
| 1 session | 67.2 | 32.8 | |
| 2 sessions | 73.8 | 26.2 | |
| ≥3 sessions | 75.0 | 25.0 | |
| Enrollment in sports competition | |||
| No | 78.4 | 21.6 | 0.414 |
| Yes | 75.2 | 24.8 | |
| Predictors | Model | Potential Equation * | p Value | Deviance | Hosmer-Lemeshow Test | AUROC (95% CI) |
|---|---|---|---|---|---|---|
| Distal: sociodemographic and economic | Level 1 | Model 1: Model 0 † | −249.7 | |||
| +Age | 0.031 | |||||
| +Biological sex | <0.001 | |||||
| +Race/Ethnicity | 0.477 | |||||
| Level 2 | Model 2: Model 1 | |||||
| +Working student | 0.400 | |||||
| +Monthly household income | 0.827 | |||||
| Mesial: Elementary school | Level 1 | Model 3: Model 2 | −173.4 | |||
| +Grade retention | 0.926 | |||||
| +PE facilities | 0.038 | |||||
| Level 2 | Model 4: Model 3 | −241.4 | ||||
| +PE as preferred subject | 0.744 | |||||
| +PE classes per week | 0.442 | |||||
| +Enrollment in sports training | 0.369 | |||||
| +Enrollment in sport competition | 0.148 | |||||
| Mesial: High school | Level 1 | Model 5: Model 4 | −241.6 | |||
| +Grade retention | 0.133 | |||||
| +PE facility | 0.558 | |||||
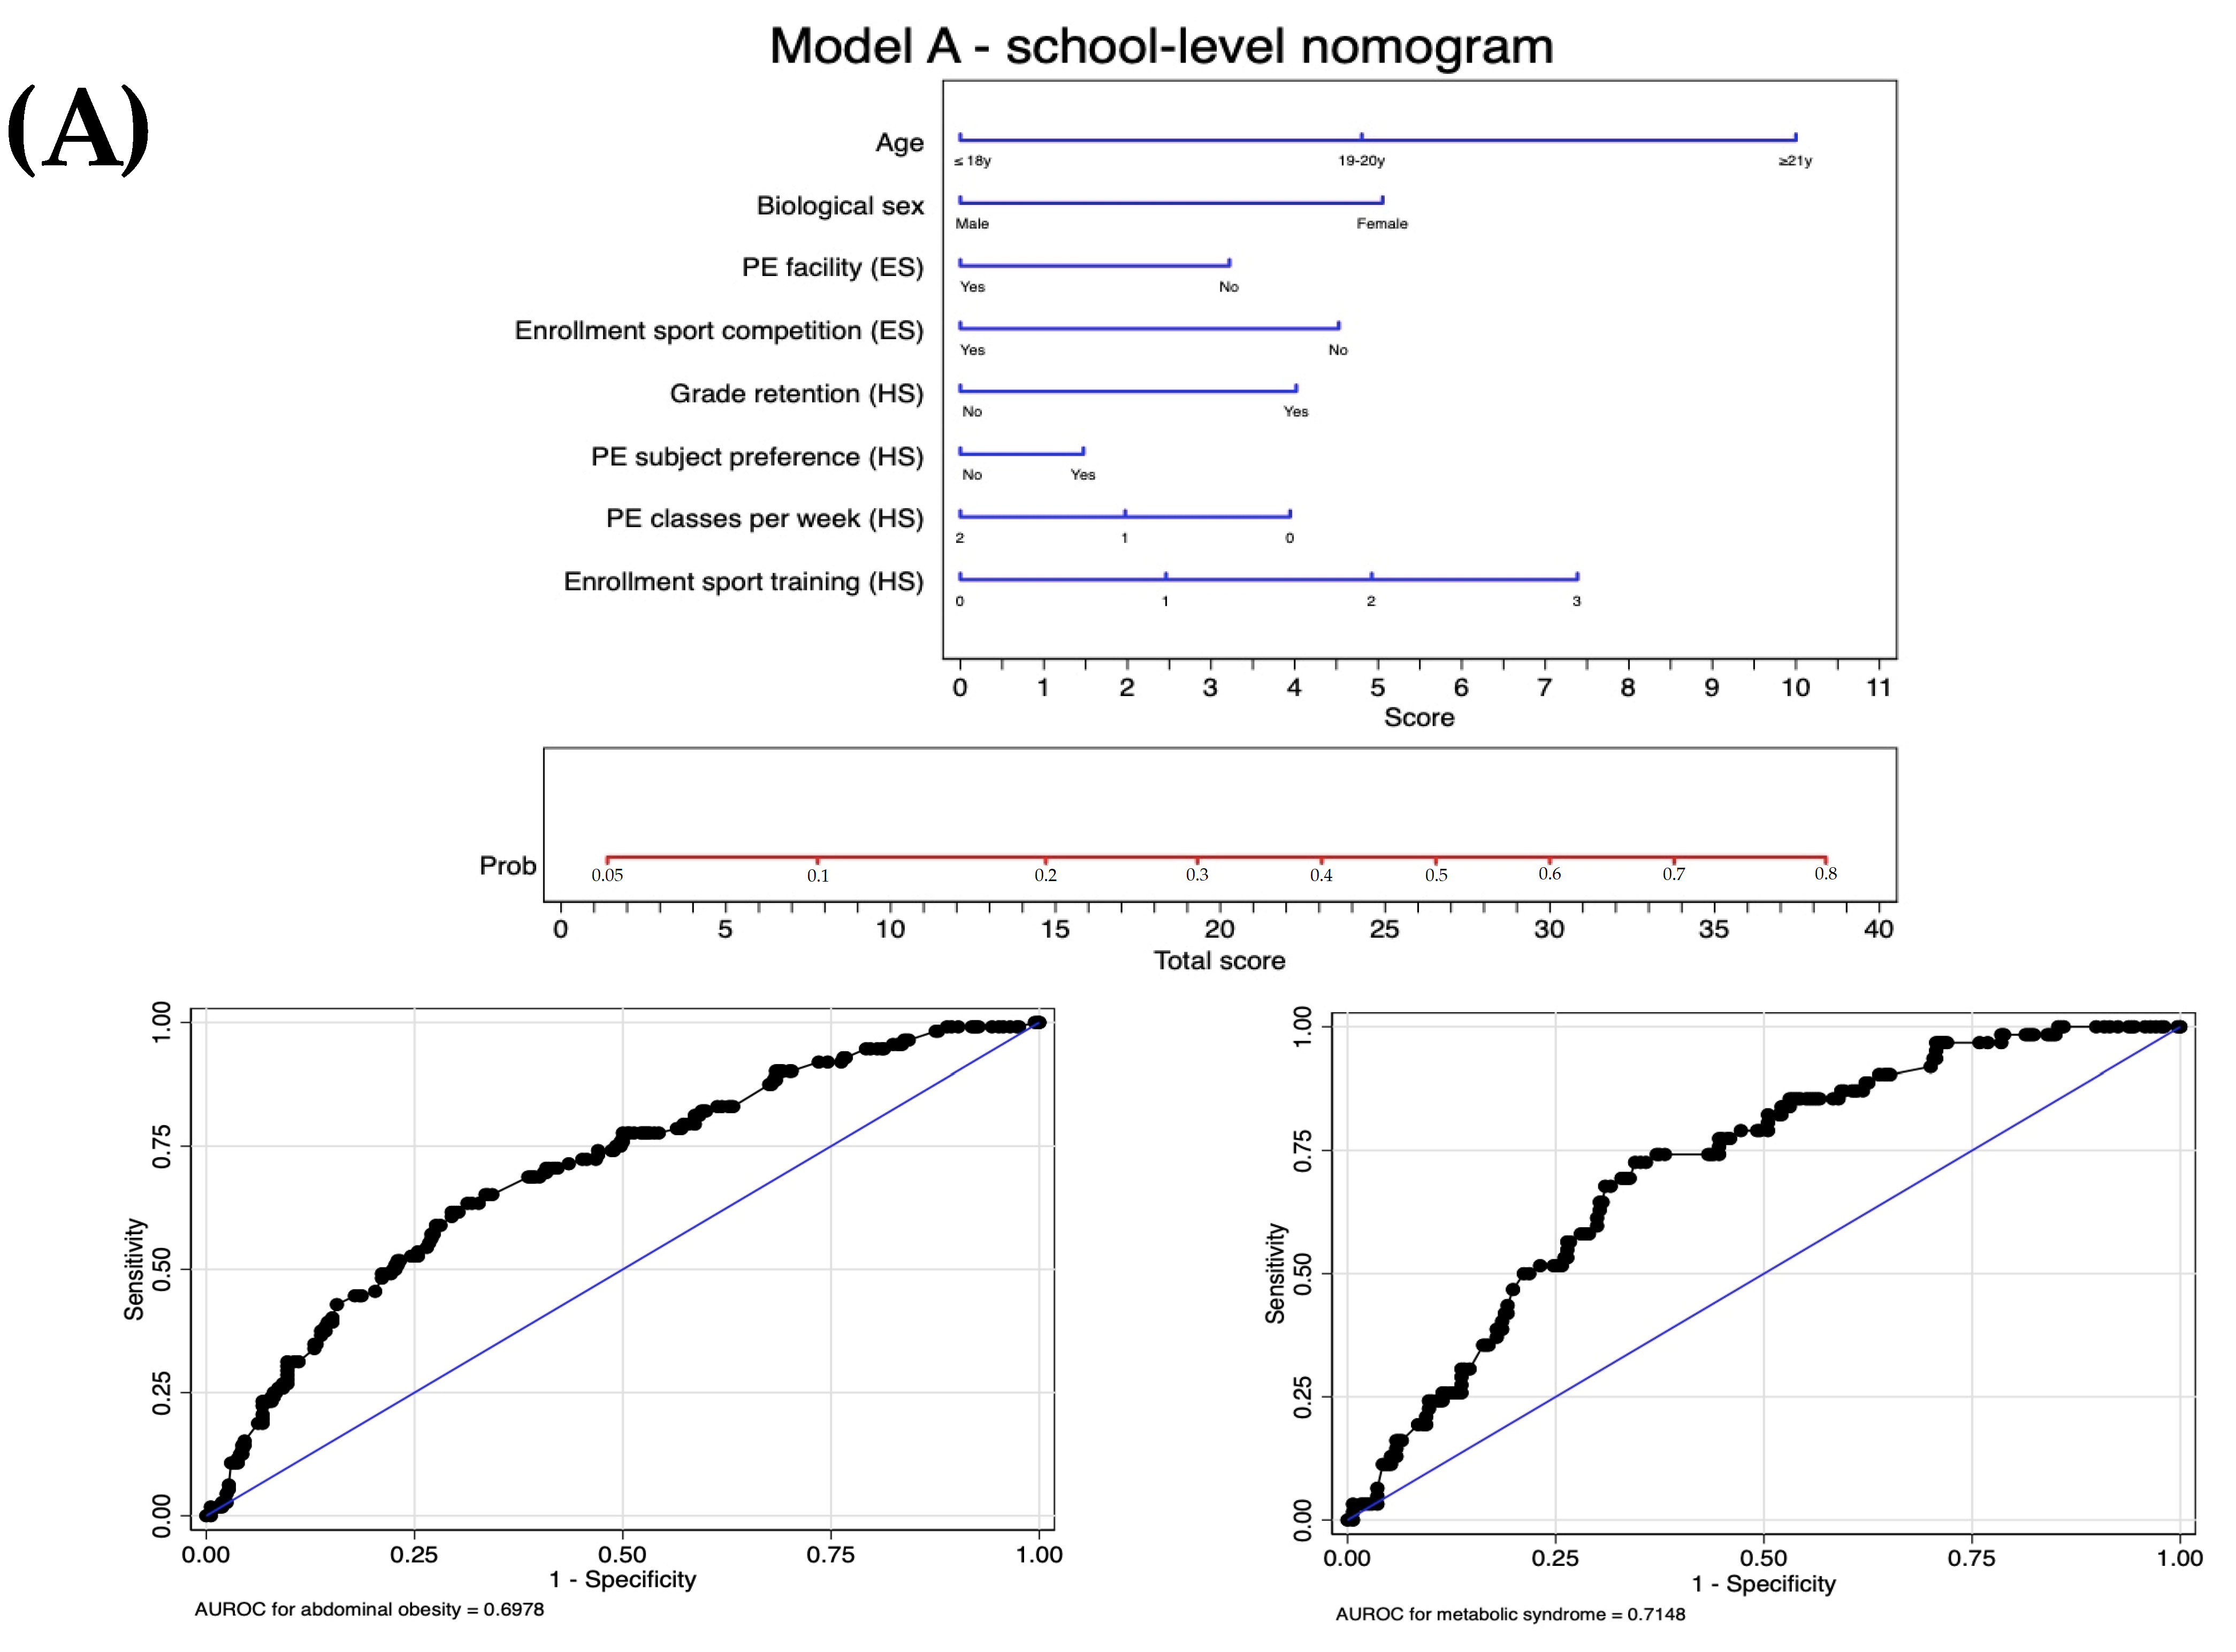
| Level 2: Screening tool A | Model A: Model 5 | −240.3 | 0.46 | 0.70 (0.64 to 0.75) | ||
| +PE as preferred subject | 0.673 | |||||
| +PE classes per week | 0.176 | |||||
| +Enrollment in sports training | 0.115 | |||||
| +Enrollment in sports competition | 0.430 | |||||
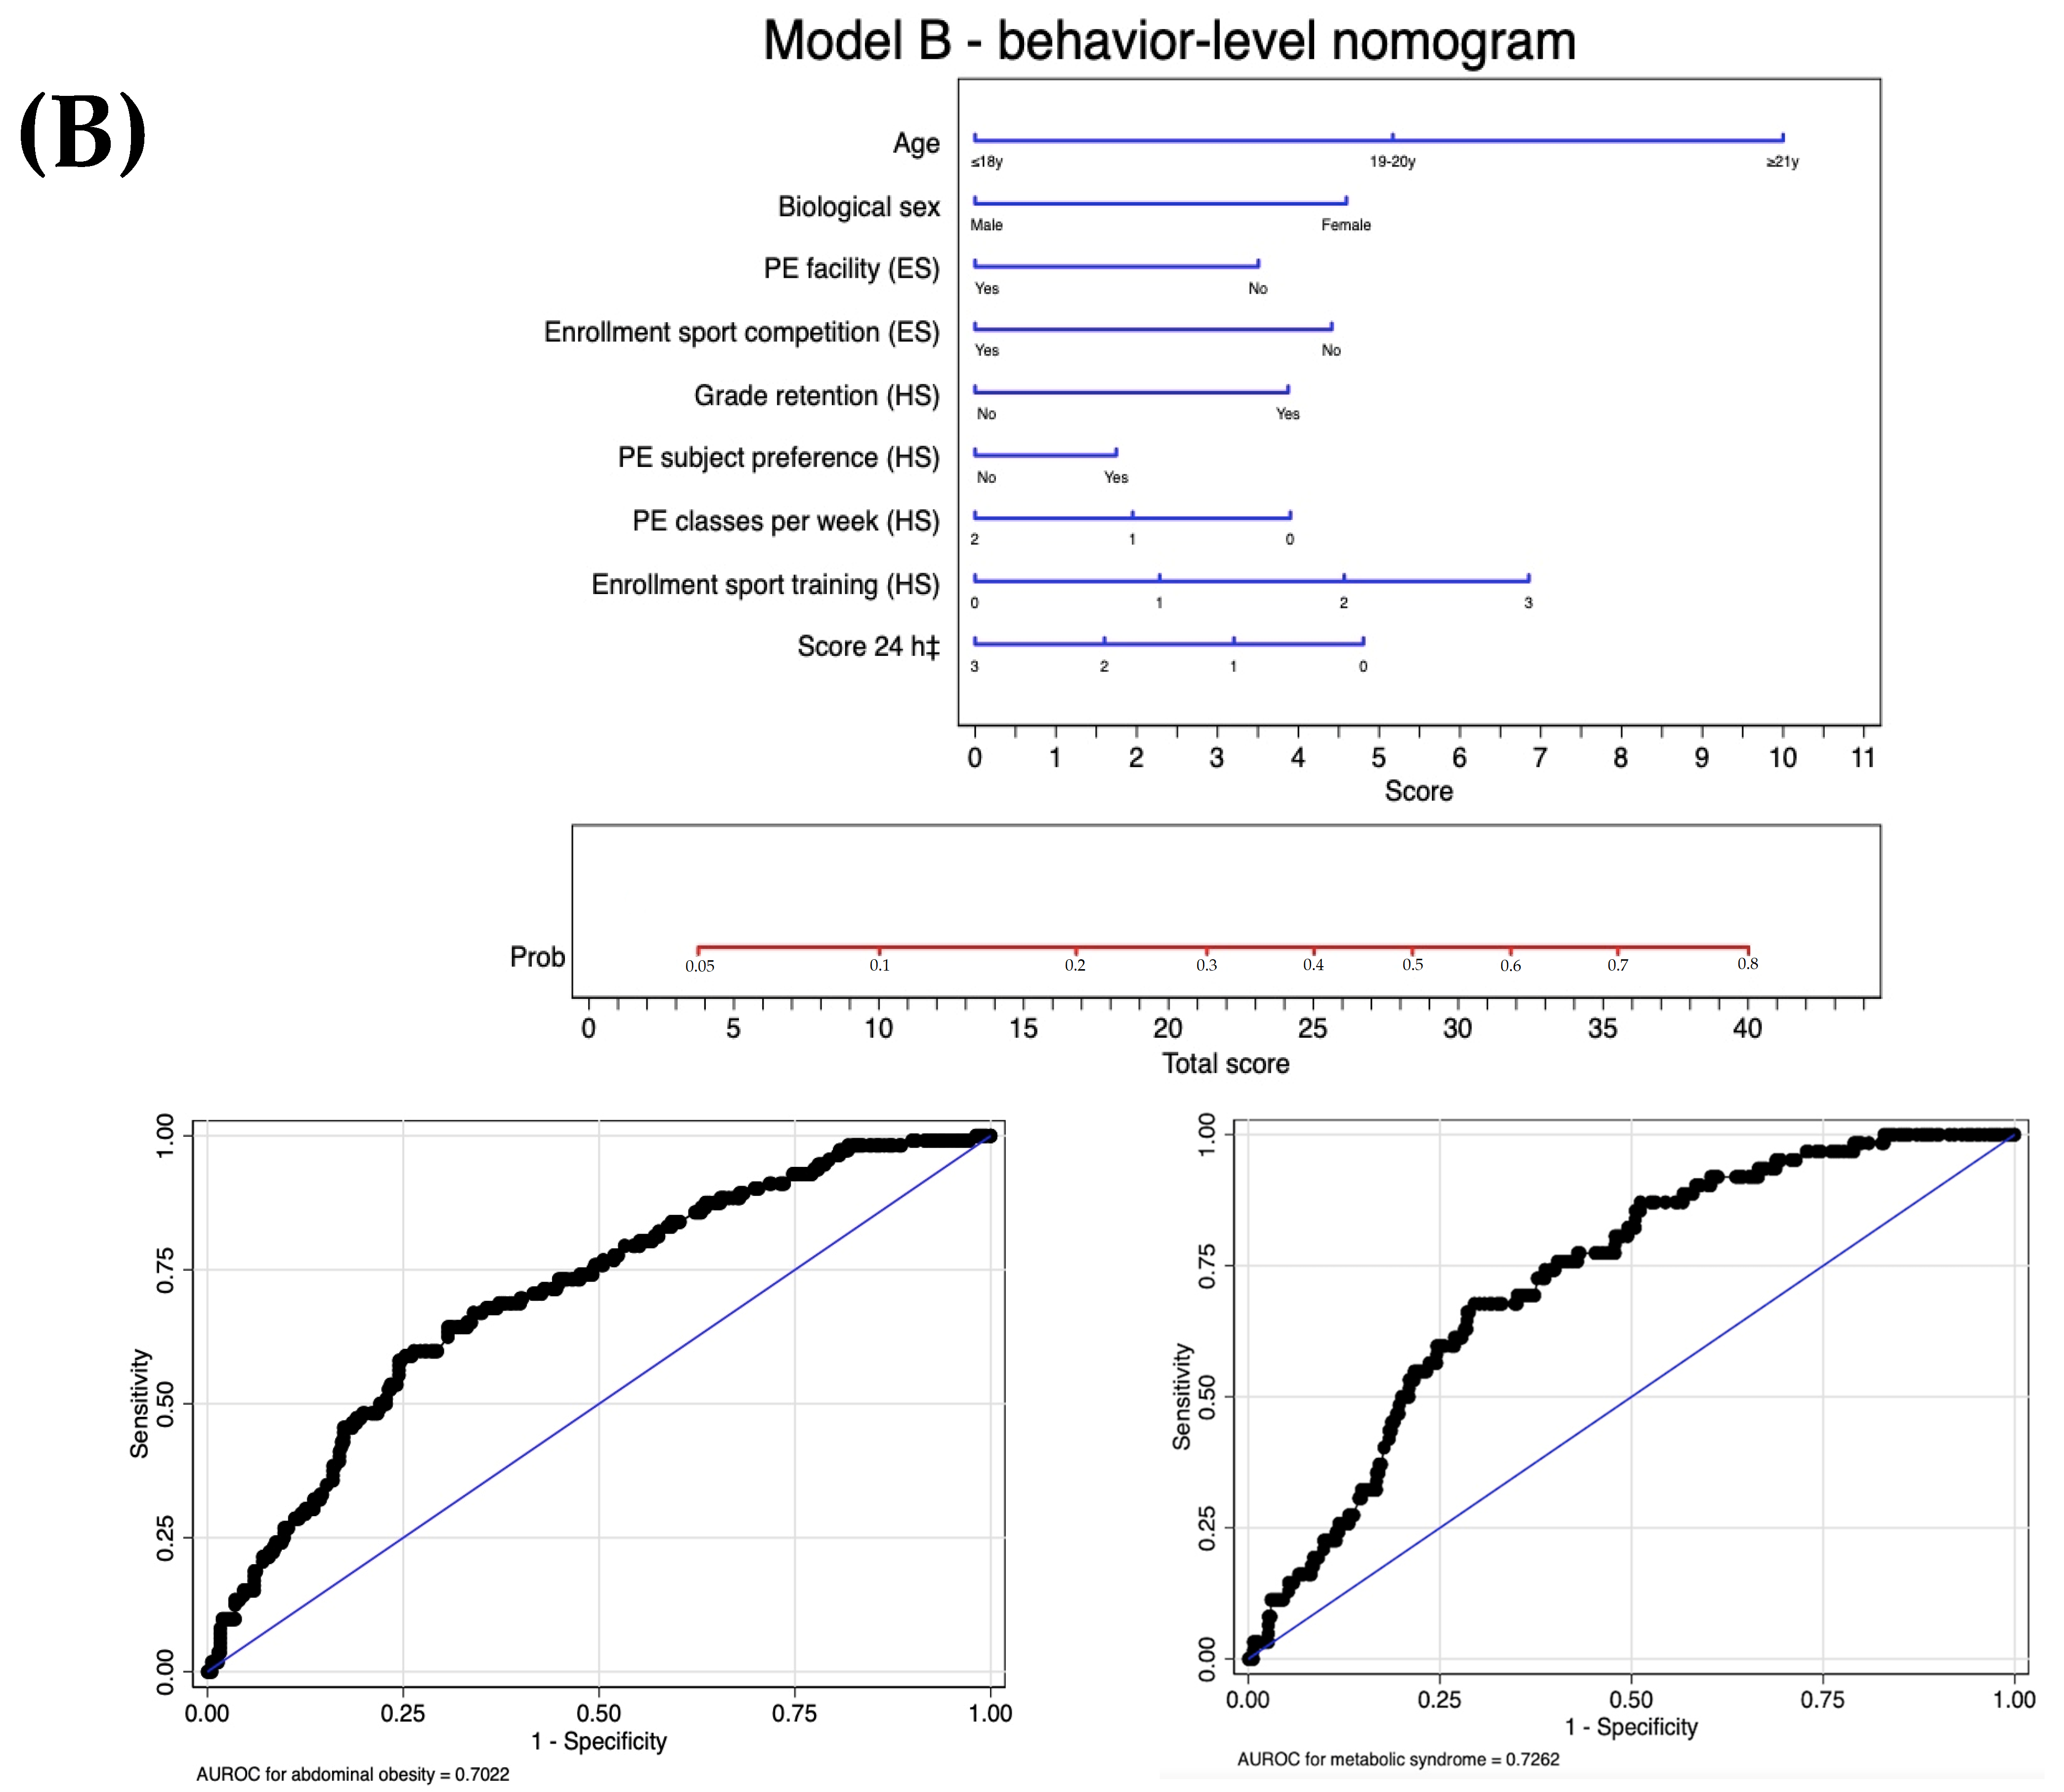
| Proximal: behaviors | Level 1: Screening tool B | Model B: Model A | −239.1 | 0.77 | 0.70 (0.65 to 0.76) | |
| +Score 24 h ‡ | 0.164 | |||||
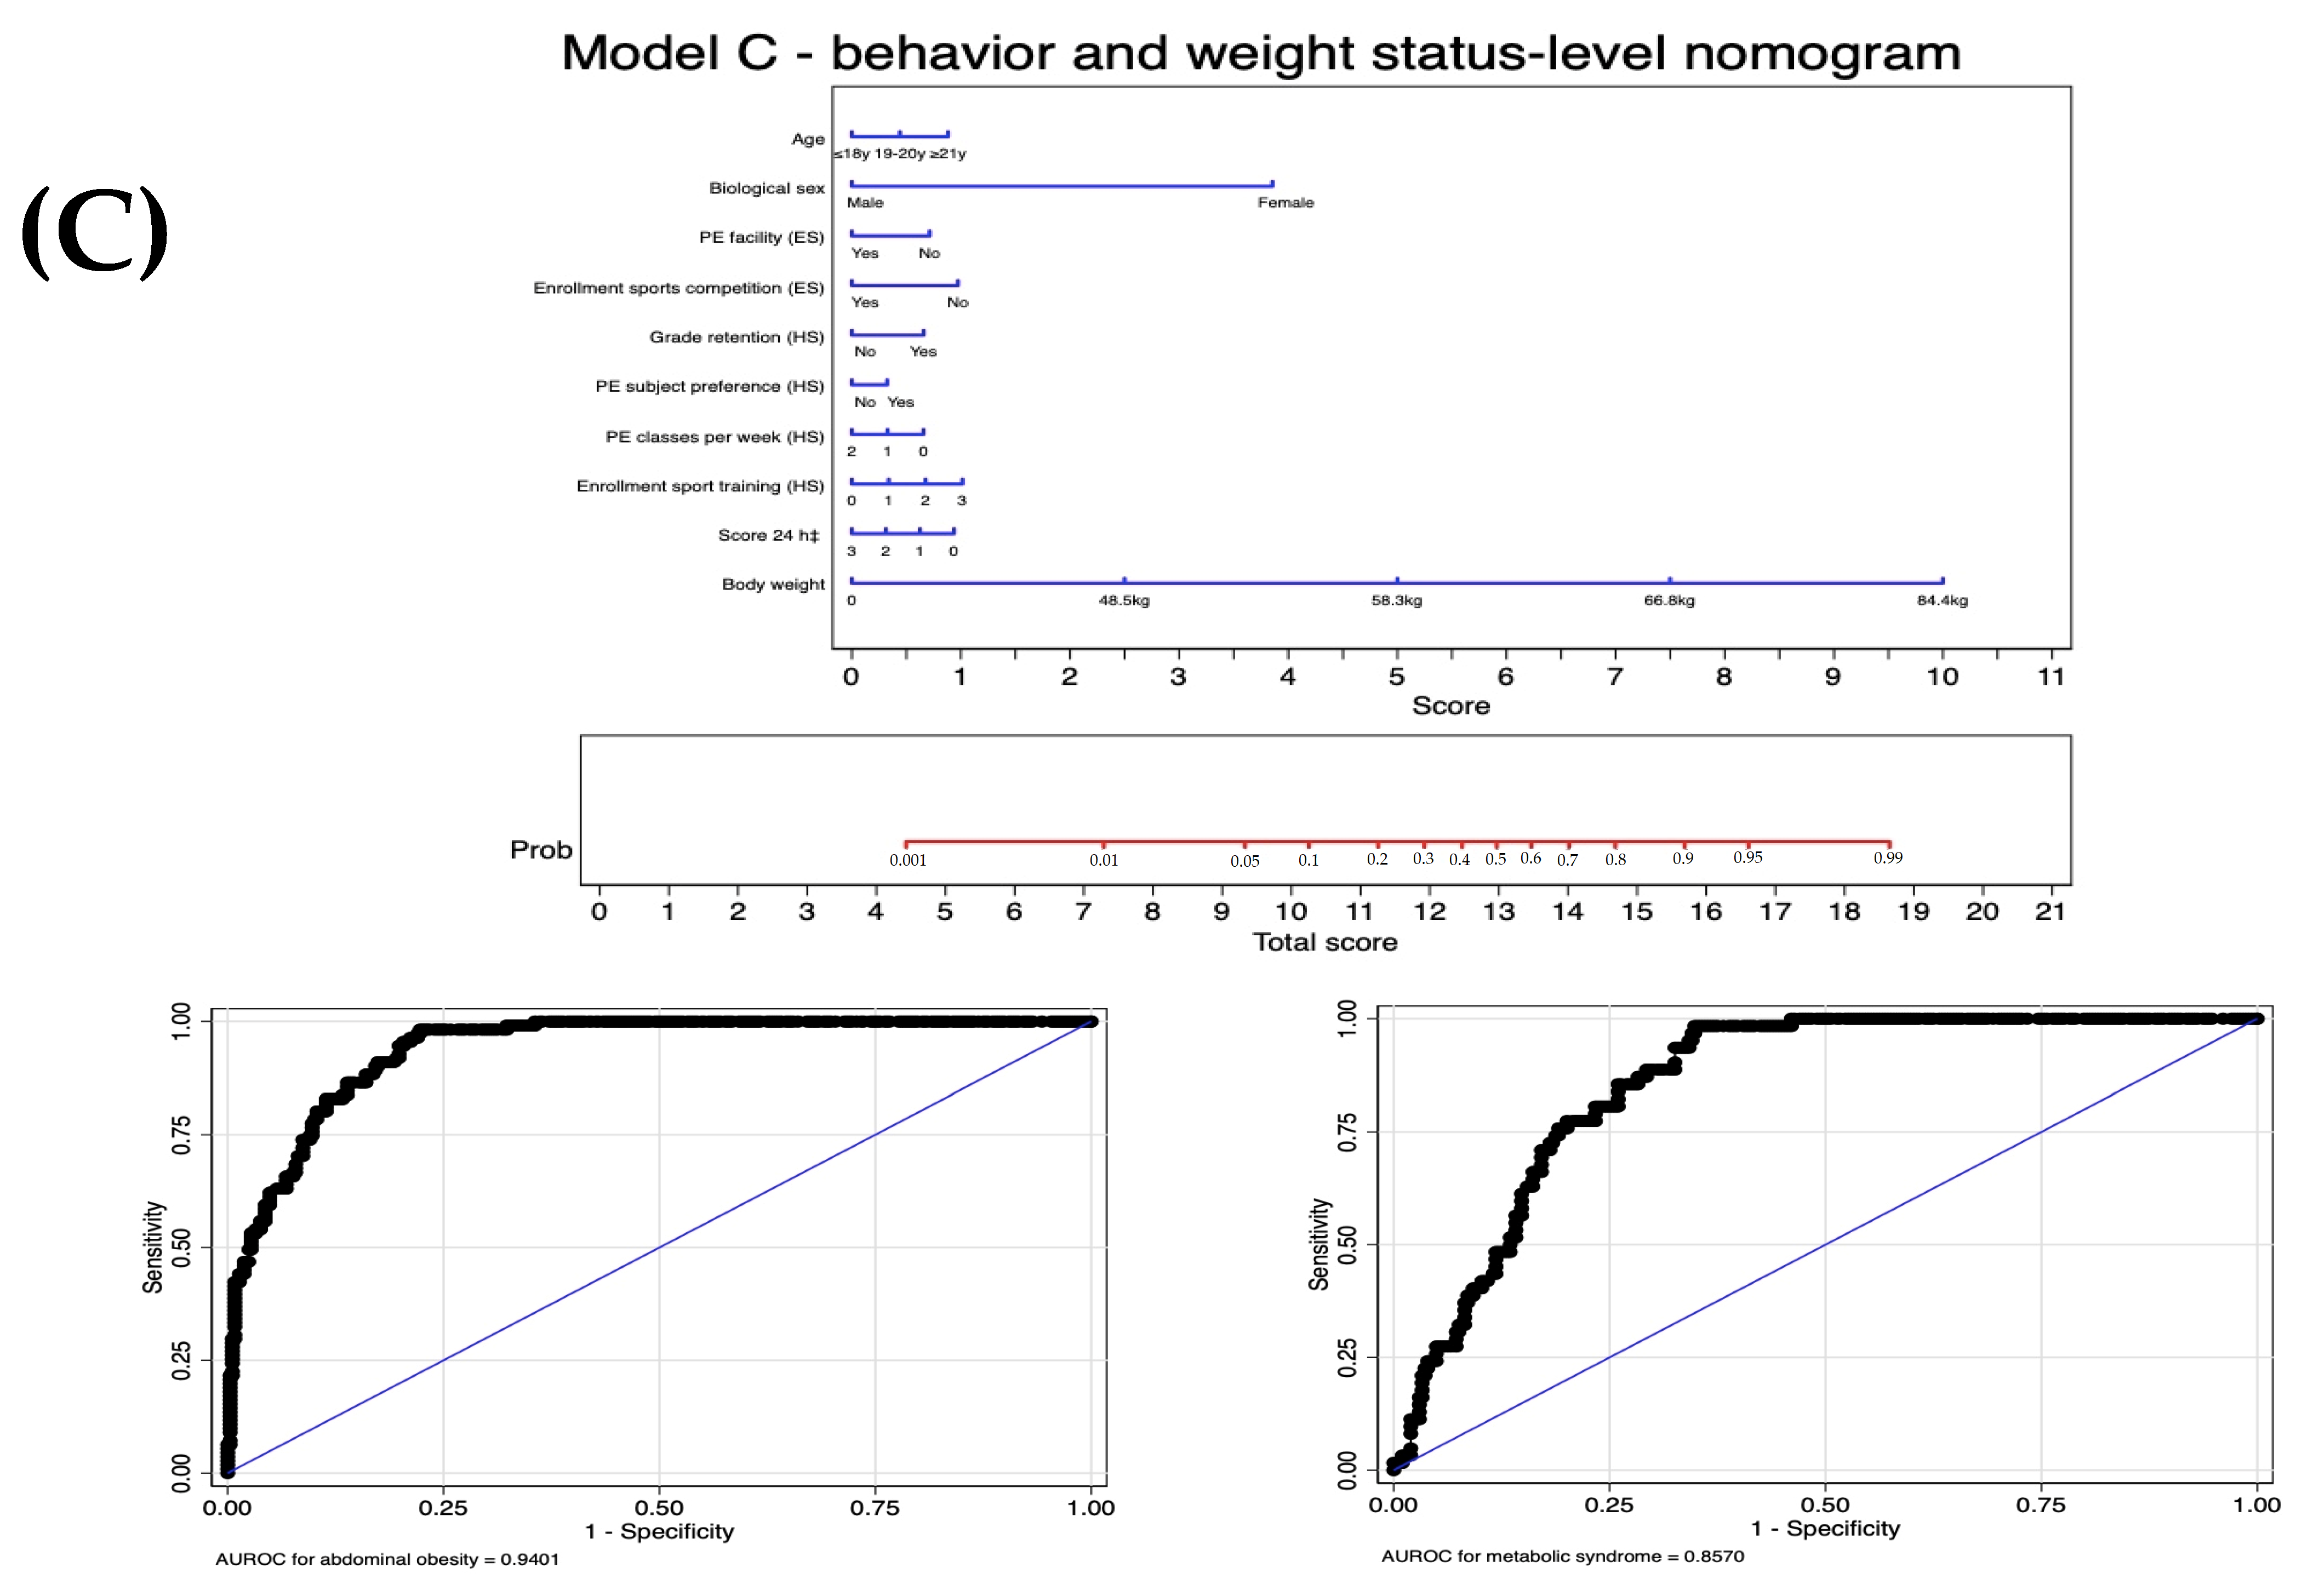
| Proximal: behaviors and weight | Level 2: Screening tool C | Model C: Model B | −124.0 | 0.93 | 0.94 (0.92 to 0.96) | |
| +Body weight | <0.001 |
Disclaimer/Publisher’s Note: The statements, opinions and data contained in all publications are solely those of the individual author(s) and contributor(s) and not of MDPI and/or the editor(s). MDPI and/or the editor(s) disclaim responsibility for any injury to people or property resulting from any ideas, methods, instructions or products referred to in the content. |
© 2024 by the authors. Licensee MDPI, Basel, Switzerland. This article is an open access article distributed under the terms and conditions of the Creative Commons Attribution (CC BY) license (https://creativecommons.org/licenses/by/4.0/).
Share and Cite
Xavier, J.F.d.S.; Feuerstein, S.C.; De Moraes, A.C.F.; de Oliveira, T.A.; da Silva Gomes, E.R.; de Almeida Silva, M.I.A.; de Oliveira, L.F.; de Carvalho, H.B.; Marin, K.A.; Nascimento-Ferreira, M.V. Development of a User-Friendly Self-Screening Tool for Assessing Metabolic Syndrome Risk in Youths from Economically Challenged Regions. J. Pers. Med. 2024, 14, 810. https://doi.org/10.3390/jpm14080810
Xavier JFdS, Feuerstein SC, De Moraes ACF, de Oliveira TA, da Silva Gomes ER, de Almeida Silva MIA, de Oliveira LF, de Carvalho HB, Marin KA, Nascimento-Ferreira MV. Development of a User-Friendly Self-Screening Tool for Assessing Metabolic Syndrome Risk in Youths from Economically Challenged Regions. Journal of Personalized Medicine. 2024; 14(8):810. https://doi.org/10.3390/jpm14080810
Chicago/Turabian StyleXavier, Jacqueline Fernandes de Sa, Shirley C. Feuerstein, Augusto Cesar Ferreira De Moraes, Tiago Almeida de Oliveira, Evellyn Ravena da Silva Gomes, Maria Isabela Alves de Almeida Silva, Luiz Fernando de Oliveira, Heraclito Barbosa de Carvalho, Kliver Antonio Marin, and Marcus Vinicius Nascimento-Ferreira. 2024. "Development of a User-Friendly Self-Screening Tool for Assessing Metabolic Syndrome Risk in Youths from Economically Challenged Regions" Journal of Personalized Medicine 14, no. 8: 810. https://doi.org/10.3390/jpm14080810