

Comparing Optical Coherence Tomography Angiography Metrics in Healthy Chinese and Caucasian Adults

 , , , and
Abstract
:1. Introduction
2. Materials and Methods
2.1. Study Design
2.2. Study Participants
2.3. Ophthalmic Examination
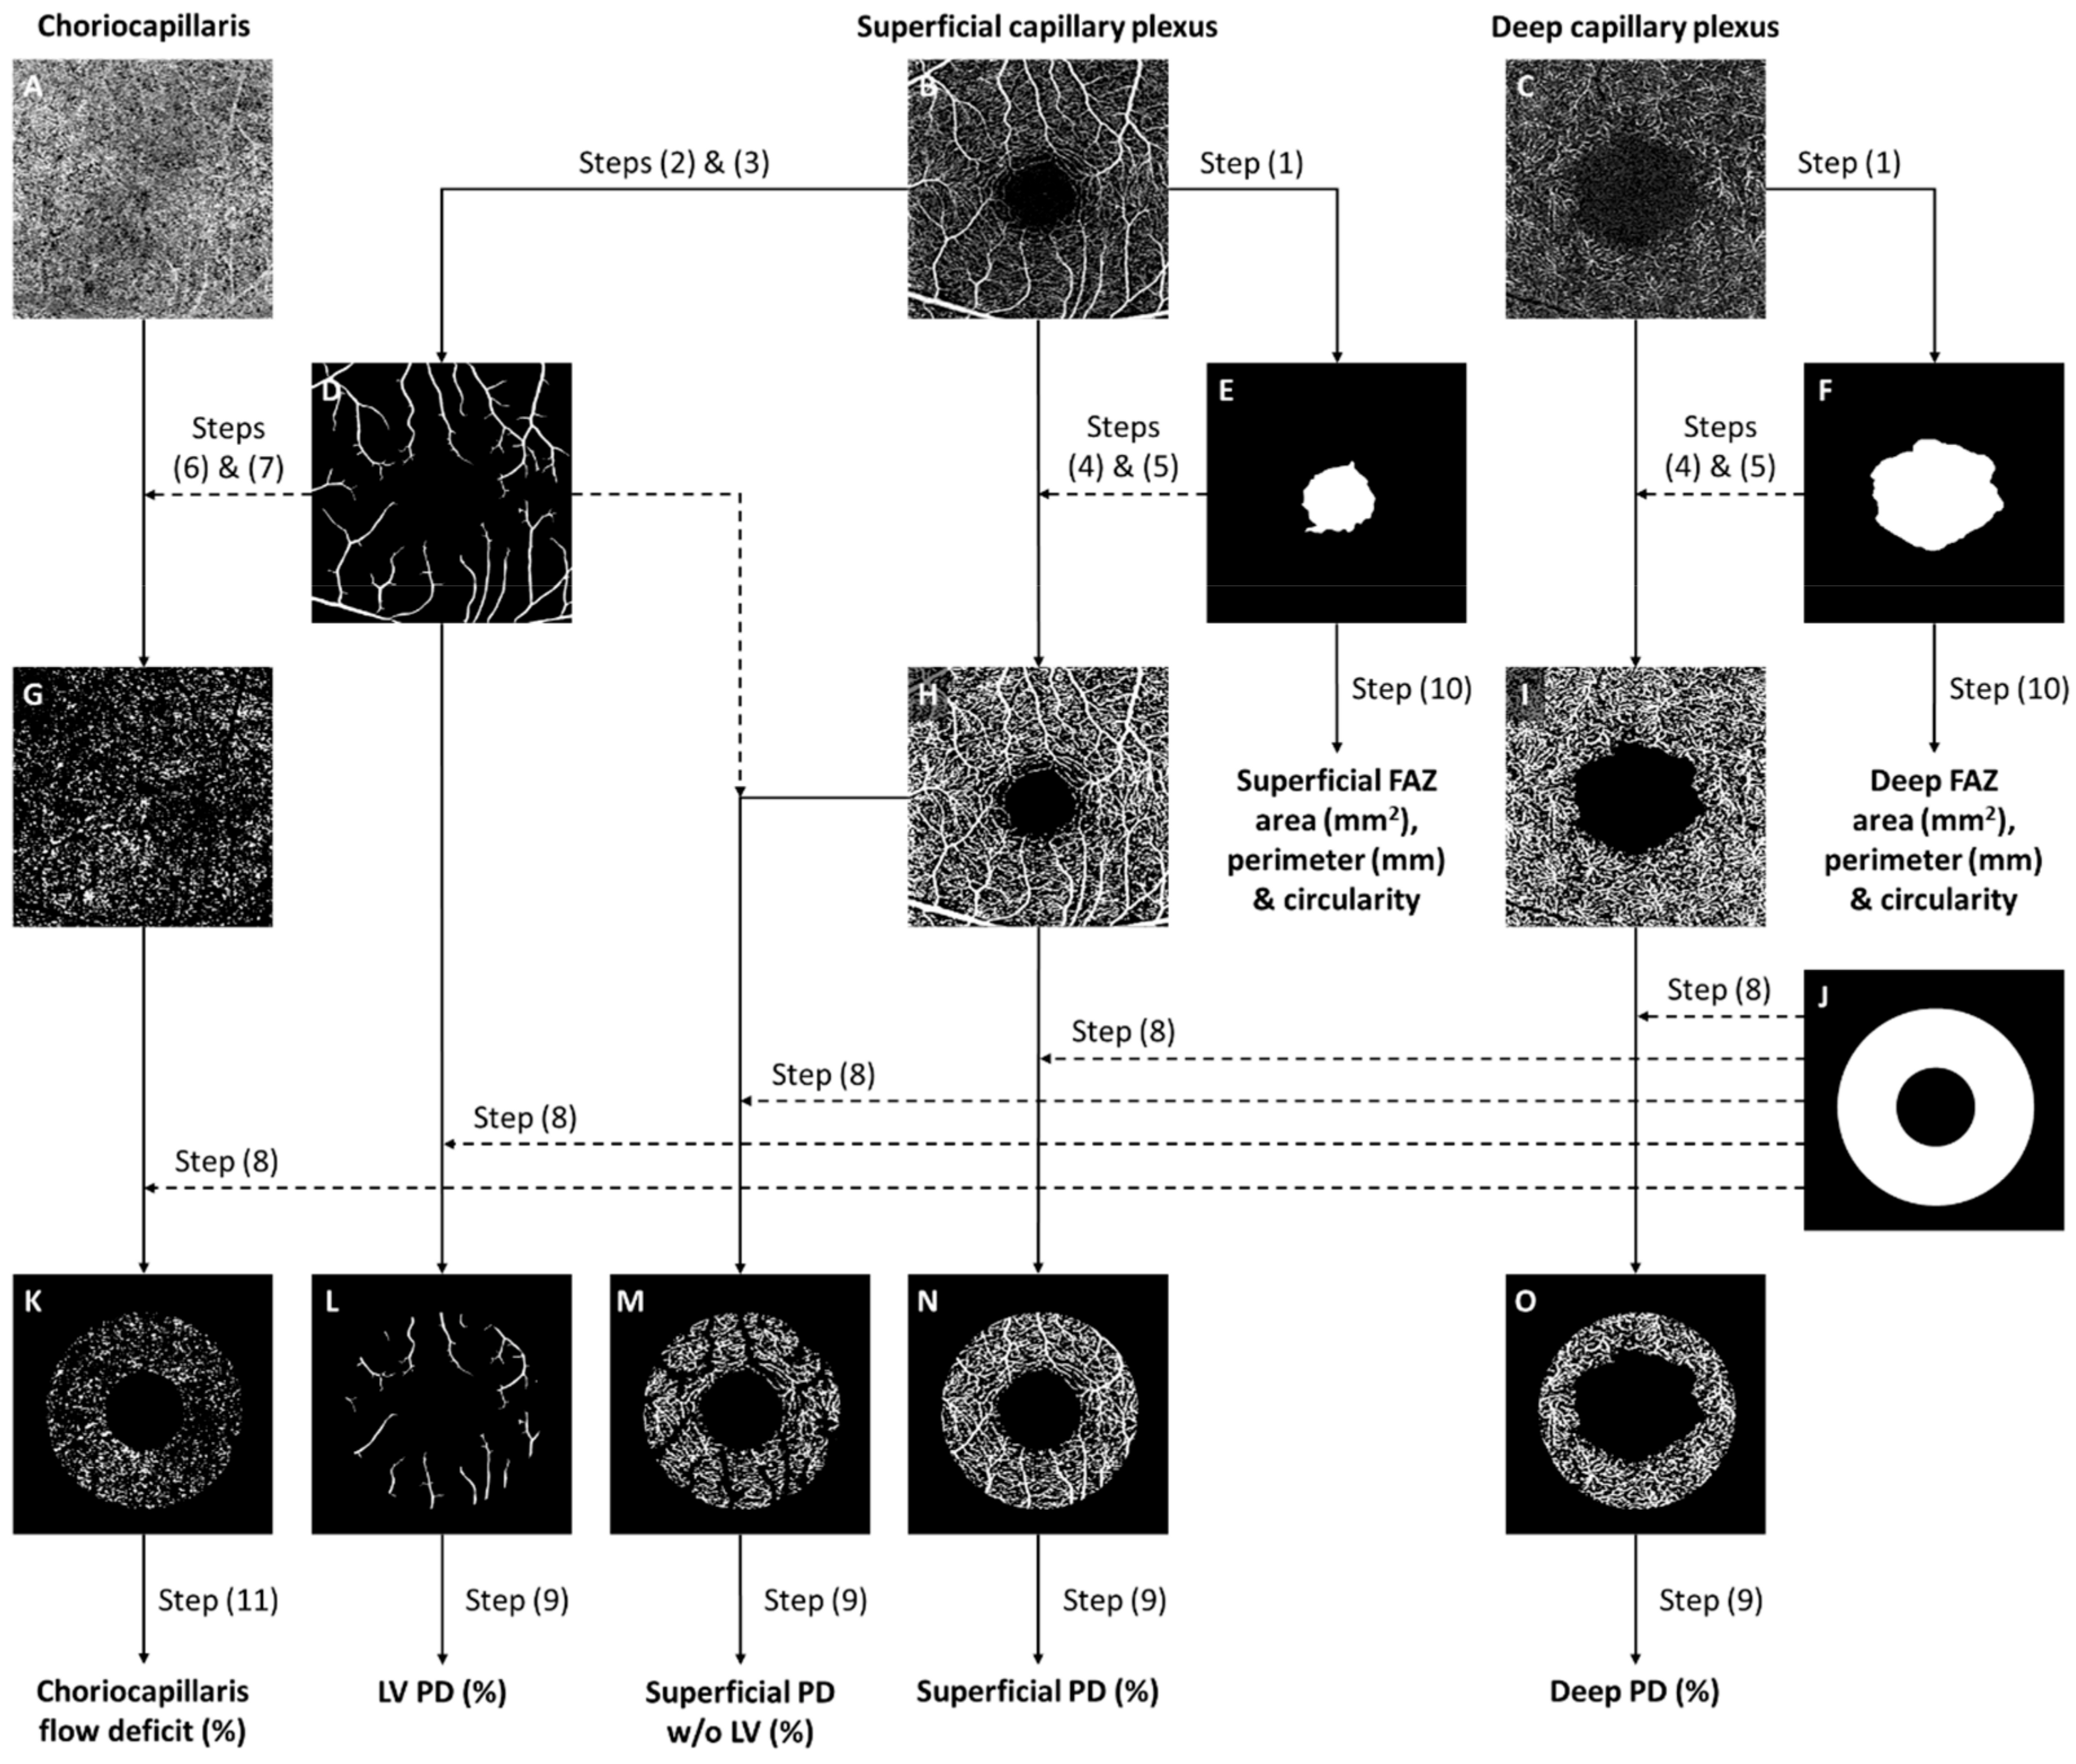
2.4. Optical Coherence Tomography Angiography
2.5. Statistical Analyses
3. Results
4. Discussion
5. Conclusions
Supplementary Materials
Author Contributions
Funding
Institutional Review Board Statement
Informed Consent Statement
Data Availability Statement
Acknowledgments
Conflicts of Interest
References
- Ikram, M.K.; Ong, Y.T.; Cheung, C.Y.; Wong, T.Y. Retinal Vascular Caliber Measurements: Clinical Significance, Current Knowledge and Future Perspectives. Ophthalmologica 2013, 229, 125–136. [Google Scholar] [CrossRef] [PubMed]
- Heitmar, R.; Blann, A.D.; Cubbidge, R.P.; Lip, G.Y.H.; Gherghel, D. Continuous Retinal Vessel Diameter Measurements: The Future in Retinal Vessel Assessment? Investig. Opthalmol. Vis. Sci. 2010, 51, 5833. [Google Scholar] [CrossRef] [PubMed]
- Garhofer, G.; Bek, T.; Boehm, A.G.; Gherghel, D.; Grunwald, J.; Jeppesen, P.; Kergoat, H.; Kotliar, K.; Lanzl, I.; Lovasik, J.V.; et al. Use of the retinal vessel analyzer in ocular blood flow research. Acta Ophthalmol. 2010, 88, 717–722. [Google Scholar] [CrossRef] [PubMed]
- Li, X.; Wong, W.L.; Cheung, C.Y.; Cheng, C.-Y.; Ikram, M.K.; Li, J.; Chia, K.S.; Wong, T.Y. Racial Differences in Retinal Vessel Geometric Characteristics: A Multiethnic Study in Healthy Asians. Investig. Opthalmol. Vis. Sci. 2013, 54, 3650. [Google Scholar] [CrossRef] [PubMed]
- Rochtchina, E.; Wang, J.J.; Taylor, B.; Wong, T.Y.; Mitchell, P. Ethnic Variability in Retinal Vessel Caliber: A Potential Source of Measurement Error from Ocular Pigmentation?—The Sydney Childhood Eye Study. Investig. Opthalmol. Vis. Sci. 2008, 49, 1362. [Google Scholar] [CrossRef] [PubMed]
- Smith, W.; Kotliar, K.E.; Lammertyn, L.; Ramoshaba, N.E.; Vilser, W.; Huisman, H.W.; Schutte, A.E. Retinal vessel caliber and caliber responses in true normotensive black and white adults: The African-PREDICT study. Microvasc. Res. 2020, 128, 103937. [Google Scholar] [CrossRef] [PubMed]
- Huang, D.; Swanson, E.A.; Lin, C.P.; Schuman, J.S.; Stinson, W.G.; Chang, W.; Hee, M.R.; Flotte, T.; Gregory, K.; Puliafito, C.A.; et al. Optical Coherence Tomography. Science 1991, 254, 1178–1181. [Google Scholar] [CrossRef] [PubMed]
- Spaide, R.F.; Fujimoto, J.G.; Waheed, N.K.; Sadda, S.R.; Staurenghi, G. Optical coherence tomography angiography. Prog. Retin. Eye Res. 2018, 64, 1–55. [Google Scholar] [CrossRef]
- Ang, M.; Tan, A.C.S.; Cheung, C.M.G.; Keane, P.A.; Dolz-Marco, R.; Sng, C.C.A.; Schmetterer, L. Optical coherence tomography angiography: A review of current and future clinical applications. Graefe’s Arch. Clin. Exp. Ophthalmol. 2018, 256, 237–245. [Google Scholar] [CrossRef]
- Chua, J.; Sim, R.; Tan, B.; Wong, D.; Yao, X.; Liu, X.; Ting, D.S.W.; Schmidl, D.; Ang, M.; Garhöfer, G.; et al. Optical Coherence Tomography Angiography in Diabetes and Diabetic Retinopathy. J. Clin. Med. 2020, 9, 1723. [Google Scholar] [CrossRef]
- Chua, J.; Tan, B.; Ang, M.; Nongpiur, M.E.; Tan, A.C.; Najjar, R.P.; Milea, D.; Schmetterer, L. Future clinical applicability of optical coherence tomography angiography. Clin. Exp. Optom. 2019, 102, 260–269. [Google Scholar] [CrossRef] [PubMed]
- Laotaweerungsawat, S.; Psaras, C.; Haq, Z.; Liu, X.; Stewart, J.M. Racial and ethnic differences in foveal avascular zone in diabetic and nondiabetic eyes revealed by optical coherence tomography angiography. PLoS ONE 2021, 16, e0258848. [Google Scholar] [CrossRef] [PubMed]
- Chun, L.Y.; Silas, M.R.; Dimitroyannis, R.C.; Ho, K.; Skondra, D. Differences in macular capillary parameters between healthy black and white subjects with Optical Coherence Tomography Angiography (OCTA). PLoS ONE 2019, 14, e0223142. [Google Scholar] [CrossRef]
- Massamba, N.; Mackin, A.G.; Chun, L.Y.; Rodriguez, S.; Dimitroyannis, R.C.; Bodaghi, B.; Hariprasad, S.M.; Skondra, D. Evaluation of flow of chorioretinal capillaries in healthy black and white subjects using optical coherence tomography angiography. Sci. Rep. 2021, 11, 21886. [Google Scholar] [CrossRef] [PubMed]
- Moir, J.; Rodriguez, S.H.; Chun, L.Y.; Massamba, N.; Skondra, D. Racial differences in quantitative optical coherence tomography angiography findings between older non-diabetics with co-morbidities. PLoS ONE 2023, 18, e0285360. [Google Scholar] [CrossRef]
- Moghimi, S.; Zangwill, L.M.; Hou, H.; Wong, B.; Proudfoot, J.; Penteado, R.C.; Ekici, E.; Bowd, C.; Weinreb, R.N. Comparison of Peripapillary Capillary Density in Glaucoma Patients of African and European Descent. Ophthalmol. Glaucoma 2021, 4, 51–62. [Google Scholar] [CrossRef]
- Siesky, B.; Harris, A.; Vercellin, A.C.V.; Guidoboni, G.; Tsai, J.C. Ocular blood flow as it relates to race and disease on glaucoma. Adv. Ophthalmol. Optom. 2021, 6, 245–262. [Google Scholar] [CrossRef]
- Tan, B.; Sim, Y.C.; Chua, J.; Yusufi, D.; Wong, D.; Yow, A.P.; Chin, C.; Tan, A.C.S.; Sng, C.C.A.; Agrawal, R.; et al. Developing a normative database for retinal perfusion using optical coherence tomography angiography. Biomed. Opt. Express 2021, 12, 4032–4045. [Google Scholar] [CrossRef] [PubMed]
- Fernández-Vigo, J.I.; Kudsieh, B.; Shi, H.; Arriola-Villalobos, P.; Donate-López, J.; García-Feijóo, J.; Ruiz-Moreno, J.M.; Fernández-Vigo, J.Á. Normative database and determinants of macular vessel density measured by optical coherence tomography angiography. Clin. Exp. Ophthalmol. 2020, 48, 44–52. [Google Scholar] [CrossRef]
- Fernández-Vigo, J.I.; Kudsieh, B.; Shi, H.; De-Pablo-Gómez-de-Liaño, L.; Serrano-Garcia, I.; Ruiz-Moreno, J.M.; Martínez-de-la-Casa, J.M.; García-Feijóo, J.; Fernández-Vigo, J.Á. Normative Database of Peripapillary Vessel Density Measured by Optical Coherence Tomography Angiography and Correlation Study. Curr. Eye Res. 2020, 45, 1430–1437. [Google Scholar] [CrossRef]
- Coscas, F.; Sellam, A.; Glacet-Bernard, A.; Jung, C.; Goudot, M.; Miere, A.; Souied, E.H. Normative Data for Vascular Density in Superficial and Deep Capillary Plexuses of Healthy Adults Assessed by Optical Coherence Tomography Angiography. Invest. Ophthalmol. Vis. Sci. 2016, 57, OCT211-23. [Google Scholar] [CrossRef] [PubMed]
- Munsell, M.K.; Garg, I.; Duich, M.; Zeng, R.; Baldwin, G.; Wescott, H.E.; Koch, T.; Wang, K.L.; Patel, N.A.; Miller, J.B. A normative database of wide-field swept-source optical coherence tomography angiography quantitative metrics in a large cohort of healthy adults. Graefe’s Arch. Clin. Exp. Ophthalmol. 2023, 261, 1835–1859. [Google Scholar] [CrossRef] [PubMed]
- Ho, H.; Tham, Y.-C.; Chee, M.L.; Shi, Y.; Tan, N.Y.Q.; Wong, K.-H.; Majithia, S.; Cheung, C.Y.; Aung, T.; Wong, T.Y.; et al. Retinal Nerve Fiber Layer Thickness in a Multiethnic Normal Asian Population: The Singapore Epidemiology of Eye Diseases Study. Ophthalmology 2019, 126, 702–711. [Google Scholar] [CrossRef] [PubMed]
- Nousome, D.; Mckean-Cowdin, R.; Richter, G.M.; Burkemper, B.; Torres, M.; Varma, R.; Jiang, X. Retinal Nerve Fiber Layer Thickness in Healthy Eyes of Black, Chinese, and Latino Americans: A Population-Based Multiethnic Study. Ophthalmology 2021, 128, 1005–1015. [Google Scholar] [CrossRef] [PubMed]
- Perez, C.I.; Chansangpetch, S.; Mora, M.; Nguyen, A.; Zhao, J.; Han, Y.; Lin, S.C. Ethnicity-Specific Database Improves the Diagnostic Ability of Peripapillary Retinal Nerve Fiber Layer Thickness to Detect Glaucoma. Am. J. Ophthalmol. 2021, 221, 311–322. [Google Scholar] [CrossRef] [PubMed]
- Chua, J.; Schwarzhans, F.; Nguyen, D.Q.; Tham, Y.C.; Sia, J.T.; Lim, C.; Mathijia, S.; Cheung, C.; Tin, A.; Fischer, G.; et al. Compensation of retinal nerve fibre layer thickness as assessed using optical coherence tomography based on anatomical confounders. Br. J. Ophthalmol. 2020, 104, 282–290. [Google Scholar] [CrossRef] [PubMed]
- Chua, J.; Schwarzhans, F.; Wong, D.; Li, C.; Husain, R.; Crowston, J.G.; Perera, S.A.; Sng, C.C.A.; Nongpiur, M.E.; Majithia, S.; et al. Multivariate Normative Comparison, a Novel Method for Improved Use of Retinal Nerve Fiber Layer Thickness to Detect Early Glaucoma. Ophthalmol. Glaucoma 2022, 5, 359–368. [Google Scholar] [CrossRef] [PubMed]
- Wang, R.K.; An, L.; Francis, P.; Wilson, D.J. Depth-resolved imaging of capillary networks in retina and choroid using ultrahigh sensitive optical microangiography. Opt. Lett. 2010, 35, 1467. [Google Scholar] [CrossRef] [PubMed]
- Chua, J.; Chin, C.W.L.; Hong, J.; Chee, M.L.; Le, T.-T.; Ting, D.S.W.; Wong, T.Y.; Schmetterer, L. Impact of hypertension on retinal capillary microvasculature using optical coherence tomographic angiography. J. Hypertens. 2019, 37, 572–580. [Google Scholar] [CrossRef]
- Chua, J.; Chin, C.W.L.; Tan, B.; Wong, S.H.; Devarajan, K.; Le, T.-T.; Ang, M.; Wong, T.Y.; Schmetterer, L. Impact of systemic vascular risk factors on the choriocapillaris using optical coherence tomography angiography in patients with systemic hypertension. Sci. Rep. 2019, 9, 5819. [Google Scholar] [CrossRef]
- Rosenfeld, P.J.; Durbin, M.K.; Roisman, L.; Zheng, F.; Miller, A.; Robbins, G.; Schaal, K.B.; Gregori, G. ZEISS AngioplexTM Spectral Domain Optical Coherence Tomography Angiography: Technical Aspects. In OCT Angiography in Retinal and Macular Diseases; Karger: Basel, Switzerland, 2016; pp. 18–29. [Google Scholar]
- Chua, J.; Le, T.; Sim, Y.C.; Chye, H.Y.; Tan, B.; Yao, X.; Wong, D.; Ang, B.W.Y.; Toh, D.; Lim, H.; et al. Relationship of Quantitative Retinal Capillary Network and Myocardial Remodeling in Systemic Hypertension. J. Am. Heart Assoc. 2022, 11, e024226. [Google Scholar] [CrossRef] [PubMed]
- Chua, J.; Hu, Q.; Ke, M.; Tan, B.; Hong, J.; Yao, X.; Hilal, S.; Venketasubramanian, N.; Garhöfer, G.; Cheung, C.Y.; et al. Retinal microvasculature dysfunction is associated with Alzheimer’s disease and mild cognitive impairment. Alzheimer’s Res. Ther. 2020, 12, 161. [Google Scholar] [CrossRef] [PubMed]
- Tan, B.; Sim, R.; Chua, J.; Wong, D.W.K.; Yao, X.; Garhöfer, G.; Schmidl, D.; Werkmeister, R.M.; Schmetterer, L. Approaches to quantify optical coherence tomography angiography metrics. Ann. Transl. Med. 2020, 8, 1205. [Google Scholar] [CrossRef] [PubMed]
- Shahlaee, A.; Pefkianaki, M.; Hsu, J.; Ho, A.C. Measurement of Foveal Avascular Zone Dimensions and its Reliability in Healthy Eyes Using Optical Coherence Tomography Angiography. Am. J. Ophthalmol. 2016, 161, 50–55.e1. [Google Scholar] [CrossRef] [PubMed]
- Frangi, A.F.; Niessen, W.J.; Vincken, K.L.; Viergever, M.A. Multiscale vessel enhancement filtering. In Proceedings of the Medical Image Computing and Computer-Assisted Interventation—MICCAI’98, Cambridge, MA, USA, 11–13 October 1998; pp. 130–137. [Google Scholar]
- Tan, B.; Chua, J.; Lin, E.; Cheng, J.; Gan, A.; Yao, X.; Wong, D.W.K.; Sabanayagam, C.; Wong, D.; Chan, C.M.; et al. Quantitative Microvascular Analysis with Wide-Field Optical Coherence Tomography Angiography in Eyes with Diabetic Retinopathy. JAMA Netw. Open 2020, 3, e1919469. [Google Scholar] [CrossRef] [PubMed]
- Bennett, A.G.; Rudnicka, A.R.; Edgar, D.F. Improvements on Littmann’s method of determining the size of retinal features by fundus photography. Graefe’s Arch. Clin. Exp. Ophthalmol. 1994, 232, 361–367. [Google Scholar] [CrossRef]
- Gupta, R.; Misra, A. Epidemiology of microvascular complications of diabetes in South Asians and comparison with other ethnicities. J. Diabetes 2016, 8, 470–482. [Google Scholar] [CrossRef] [PubMed]
- Raymond, N.T.; Varadhan, L.; Reynold, D.R.; Bush, K.; Sankaranarayanan, S.; Bellary, S.; Barnett, A.H.; Kumar, S.; O’Hare, J.P. Higher Prevalence of Retinopathy in Diabetic Patients of South Asian Ethnicity Compared with White Europeans in the Community. Diabetes Care 2009, 32, 410–415. [Google Scholar] [CrossRef] [PubMed]
- Pardhan, S.; Gilchrist, J.; Mahomed, I. Impact of age and duration on sight–threatening retinopathy in South Asians and Caucasians attending a diabetic clinic. Eye 2004, 18, 233–240. [Google Scholar] [CrossRef]
- Johannesen, S.K.; Viken, J.N.; Vergmann, A.S.; Grauslund, J. Optical coherence tomography angiography and microvascular changes in diabetic retinopathy: A systematic review. Acta Ophthalmol. 2019, 97, 7–14. [Google Scholar] [CrossRef]
- Furino, C.; Montrone, G.; Cicinelli, M.V.; Balestra, S.; Grassi, M.O.; Reibaldi, M.; Boscia, F.; Alessio, G. Optical coherence tomography angiography in diabetic patients without diabetic retinopathy. Eur. J. Ophthalmol. 2020, 30, 1418–1423. [Google Scholar] [CrossRef] [PubMed]
- Zeng, Y.; Cao, D.; Yu, H.; Yang, D.; Zhuang, X.; Hu, Y.; Li, J.; Yang, J.; Wu, Q.; Liu, B.; et al. Early retinal neurovascular impairment in patients with diabetes without clinically detectable retinopathy. Br. J. Ophthalmol. 2019, 103, 1747–1752. [Google Scholar] [CrossRef]
- Rosen, R.B.; Andrade Romo, J.S.; Krawitz, B.D.; Mo, S.; Fawzi, A.A.; Linderman, R.E.; Carroll, J.; Pinhas, A.; Chui, T.Y.P. Earliest Evidence of Preclinical Diabetic Retinopathy Revealed Using Optical Coherence Tomography Angiography Perfused Capillary Density. Am. J. Ophthalmol. 2019, 203, 103–115. [Google Scholar] [CrossRef] [PubMed]
- Tan, B.; Lim, N.-A.; Tan, R.; Gan, A.T.L.; Chua, J.; Nusinovici, S.; Cheung, C.M.G.; Chakravarthy, U.; Wong, T.Y.; Schmetterer, L.; et al. Combining retinal and choroidal microvascular metrics improves discriminative power for diabetic retinopathy. Br. J. Ophthalmol. 2022, 107, 993–999. [Google Scholar] [CrossRef]
- Kaizu, Y.; Nakao, S.; Arima, M.; Wada, I.; Yamaguchi, M.; Sekiryu, H.; Hayami, T.; Ishikawa, K.; Ikeda, Y.; Sonoda, K. Capillary dropout is dominant in deep capillary plexus in early diabetic retinopathy in optical coherence tomography angiography. Acta Ophthalmol. 2019, 97, e811–e812. [Google Scholar] [CrossRef] [PubMed]
- Aitchison, R.T.; Kennedy, G.J.; Shu, X.; Mansfield, D.C.; Kir, R.; Hui, J.; Shahani, U. Measuring the foveal avascular zone in diabetes: A study using optical coherence tomography angiography. J. Diabetes Investig. 2022, 13, 668–676. [Google Scholar] [CrossRef]
- Oliverio, G.W.; Ceravolo, I.; Bhatti, A.; Trombetta, C.J. Foveal avascular zone analysis by optical coherence tomography angiography in patients with type 1 and 2 diabetes and without clinical signs of diabetic retinopathy. Int. Ophthalmol. 2021, 41, 649–658. [Google Scholar] [CrossRef]
- Onoe, H.; Kitagawa, Y.; Shimada, H.; Shinojima, A.; Aoki, M.; Urakami, T. Foveal avascular zone area analysis in juvenile-onset type 1 diabetes using optical coherence tomography angiography. Jpn. J. Ophthalmol. 2020, 64, 271–277. [Google Scholar] [CrossRef]
- Di, G.; Weihong, Y.; Xiao, Z.; Zhikun, Y.; Xuan, Z.; Yi, Q.; Fangtian, D. A morphological study of the foveal avascular zone in patients with diabetes mellitus using optical coherence tomography angiography. Graefe’s Arch. Clin. Exp. Ophthalmol. 2016, 254, 873–879. [Google Scholar] [CrossRef]

| Characteristics | Chinese (n = 92) | Caucasian (n = 99) | p Value * |
|---|---|---|---|
| Age | 44 ± 13 | 42 ± 14 | 0.311 |
| Gender, female | 63 (68%) | 63 (64%) | 0.480 |
| Diabetes, no | 92 (100%) | 97 (98%) | 0.171 |
| Hypertension, no | 75 (82%) | 88 (89%) | 0.150 |
| Axial length, mm | 24.7 ± 1.5 | 23.2 ± 0.9 | <0.001 |
| Spherical equivalent, diopters | −2.4 ± 3.3 | −0.1 ± 1.9 | <0.001 |
| Intraocular pressure, mmHg | 16.8 ± 3.3 | 15.1 ± 2.4 | <0.001 |
| Signal strength, out of 10 | 9.3 ± 0.9 | 9.4 ± 1.0 | 0.682 |
| OCTA Metrics | Chinese | Caucasian | |
|---|---|---|---|
| (n = 92) | (n = 99) | ||
| Mean ± SD | Mean ± SD | p Value * | |
| Perfusion density (%) | |||
| LVs | 6.7 ± 0.8 | 6.6 ± 0.8 | 0.729 |
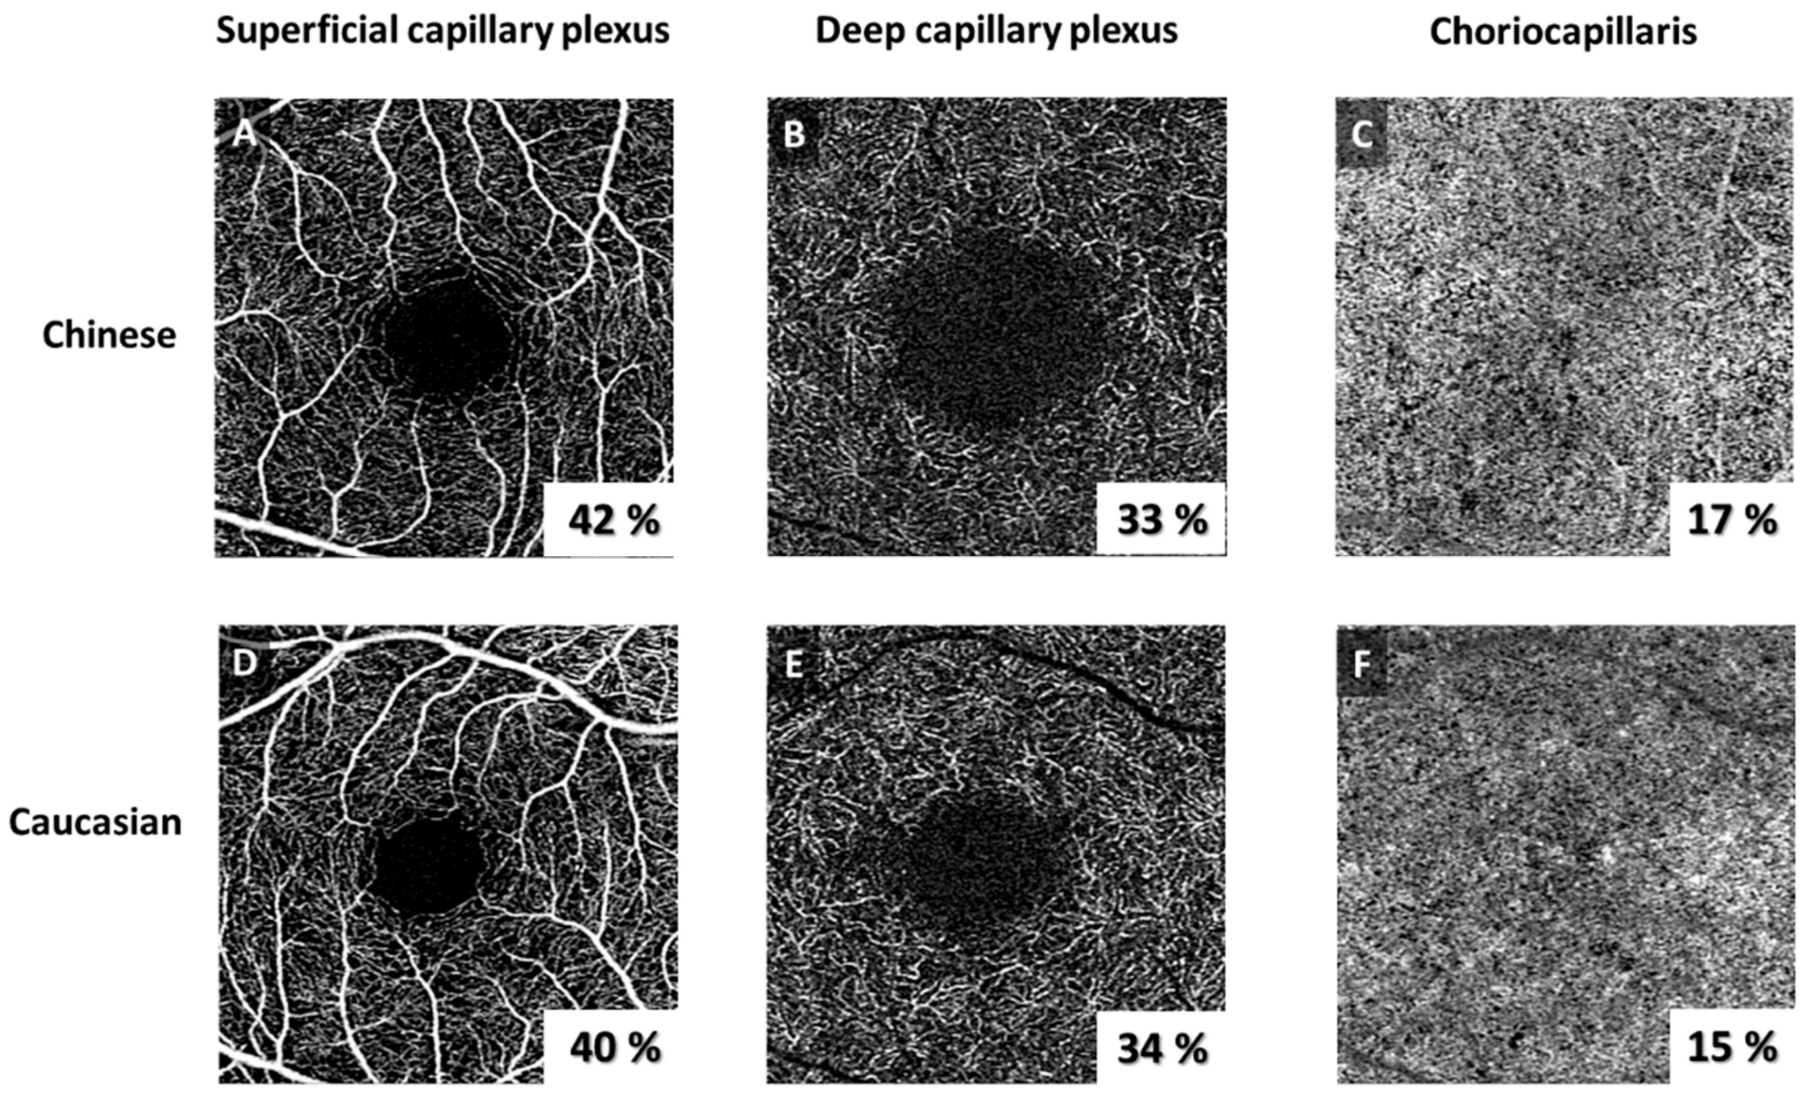
| SCP | 42.4 ± 2.6 | 40.9 ± 2.5 | <0.001 |
| SCP w/o LVs | 29.6 ± 2.6 | 28.6 ± 2.4 | 0.002 |
| DCP | 39.1 ± 3.6 | 40.1 ± 3.4 | 0.079 |
| Foveal avascular zone at superficial layer | |||
| Area (mm2) | 0.34 ± 0.1 | 0.28 ± 0.1 | 0.004 |
| Perimeter (mm) | 2.41 ± 0.6 | 2.14 ± 0.5 | 0.003 |
| Circularity | 1.19 ± 0.2 | 1.18 ± 0.1 | 0.599 |
| Foveal avascular zone at deep layer | |||
| Area (mm2) | 1.14 ± 0.3 | 1.11 ± 0.3 | 0.521 |
| Perimeter (mm) | 4.04 ± 0.6 | 4.12 ± 0.6 | 0.414 |
| Circularity | 1.08 ± 0.1 | 1.11 ± 0.1 | 0.001 |
| Flow deficit in choriocapillaris | |||
| FD density (%) | 17.2 ± 1.7 | 16.7 ± 1.6 | 0.040 |
| FD size (µm2) | 508 ± 96 | 496 ± 91 | 0.466 |
| FD number | 1379 ± 129 | 1407 ± 121 | 0.163 |
Disclaimer/Publisher’s Note: The statements, opinions and data contained in all publications are solely those of the individual author(s) and contributor(s) and not of MDPI and/or the editor(s). MDPI and/or the editor(s) disclaim responsibility for any injury to people or property resulting from any ideas, methods, instructions or products referred to in the content. |
© 2024 by the authors. Licensee MDPI, Basel, Switzerland. This article is an open access article distributed under the terms and conditions of the Creative Commons Attribution (CC BY) license (https://creativecommons.org/licenses/by/4.0/).
Share and Cite
Bujor, I.; Chua, J.; Tan, B.; Iancu, R.; Pirvulescu, R.; Geamanu, A.; Bostan, M.; Toma, E.; Ionescu, D.; Schmetterer, L.; et al. Comparing Optical Coherence Tomography Angiography Metrics in Healthy Chinese and Caucasian Adults. J. Pers. Med. 2024, 14, 834. https://doi.org/10.3390/jpm14080834
Bujor I, Chua J, Tan B, Iancu R, Pirvulescu R, Geamanu A, Bostan M, Toma E, Ionescu D, Schmetterer L, et al. Comparing Optical Coherence Tomography Angiography Metrics in Healthy Chinese and Caucasian Adults. Journal of Personalized Medicine. 2024; 14(8):834. https://doi.org/10.3390/jpm14080834
Chicago/Turabian StyleBujor, Inna, Jacqueline Chua, Bingyao Tan, Raluca Iancu, Ruxandra Pirvulescu, Aida Geamanu, Mihai Bostan, Eduard Toma, Diana Ionescu, Leopold Schmetterer, and et al. 2024. "Comparing Optical Coherence Tomography Angiography Metrics in Healthy Chinese and Caucasian Adults" Journal of Personalized Medicine 14, no. 8: 834. https://doi.org/10.3390/jpm14080834