Article

Retrospective Evaluation of the Impact of SLCO1B1 Variation on Statin Effectiveness

1
Department of Pharmacy, St. Elizabeth Healthcare, Edgewood, KY 41017, USA
2
Department of Precision Medicine and Genomic Health, St. Elizabeth Healthcare, Edgewood, KY 41017, USA
3
James L. Winkle College of Pharmacy, University of Cincinnati, Cincinnati, OH 45267, USA
4
College of Health Professions, Manchester University, Fort Wayne, IN 46845, USA
5
Ambulatory Care Pharmacy, St. Elizabeth Physicians, Erlanger, KY 41018, USA
*
Author to whom correspondence should be addressed.
J. Pers. Med. 2025, 15(11), 511; https://doi.org/10.3390/jpm15110511
Submission received: 16 August 2025 / Revised: 24 October 2025 / Accepted: 26 October 2025 / Published: 29 October 2025
(This article belongs to the Special Issue New Trends and Challenges in Pharmacogenomics Research)

Abstract

Background: Solute carrier organic anion transporter family member 1B1 (SLCO1B1) mediates statin uptake into hepatocytes, the primary sites of cholesterol production. While the impact of SLCO1B1 variation on statin-associated muscle symptoms (SAMS) is well-documented, its role in LDL-C reduction remains understudied. This single-center, retrospective cohort study evaluated whether SLCO1B1 variation affects statin effectiveness in 213 adults. Methods: The SLCO1B1 variant rs4149056 (NM_006446.5:c.521T>C) was tested to categorize patients by their SLCO1B1 function: normal, decreased, or poor. The primary endpoint was percent change in LDL-C from baseline to follow-up (≥6 weeks post-statin initiation), with secondary endpoints of SAMS occurrence and statin adherence. Results: Overall, the average LDL-C decreased by 32% across all groups. No significant difference in LDL-C reduction was observed between SLCO1B1 phenotypes (p = 0.24). Conclusions: SLCO1B1 variation did not significantly affect LDL-C reduction, SAMS occurrence, or statin adherence. However, the retrospective design and limited adherence data in this study represent important limitations warranting prospective validation studies.

1. Introduction

Hydroxymethylglutaryl-coenzyme A (HMG-CoA) reductase inhibitors, more commonly known as statins, are a cornerstone of therapy in the management of hyperlipidemia and cardiovascular risk reduction [1]. Statins treat dyslipidemia by inhibiting hepatic cholesterol synthesis, which in turn causes up-regulation of LDL-C receptors on the cell surface of hepatocytes, thus increasing removal of LDL-C from the bloodstream [2].
Solute carrier organic anion transporter family member 1B1 (SLCO1B1) is a transporter that facilitates the hepatic uptake of statins into the liver [3]. Decreased function of this transporter, inherited through genetic variability, or altered statin exposure due to drug interactions in individuals who phenotypically have decreased or poor SLCO1B1 function, results in increased systemic exposure to statins, thus increasing the risk of SAMS. SAMS frequently leads to statin discontinuation, leading to higher cholesterol levels and increased cardiovascular risk [1]. The association between SLCO1B1 variation and SAMS risk is well studied [4,5,6,7,8], and the 2022 Clinical Pharmacogenetics Implementation Consortium (CPIC) guideline for statins [2] provides therapeutic recommendations for statins based on SLCO1B1 function to minimize SAMS risk with the goal of improving the overall safety, adherence, and effectiveness of statin therapy.
Most studies focus on the association of SLCO1B1 phenotype with the risk of SAMS. There is a paucity of data on the effect of SLCO1B1 function on statin effectiveness. Given that most of the body’s cholesterol is produced in the liver [9], decreased function of the SLCO1B1 transporter is expected to decrease the amount of drug reaching the site of action, potentially decreasing its lipid-lowering effect. A small, prospective cohort study by Zakria et al. on hyperlipidemic patients prescribed rosuvastatin 10 mg/day who were followed for 24 weeks showed differential lipid-lowering responses and musculoskeletal symptoms based on SLCO1B1 common polymorphisms [10]. A study by Sivkov et al. on 180 hyperlipidemic patients treated with rosuvastatin, atorvastatin, or simvastatin found that LDL-C reductions were less pronounced in patients with SLCO1B1 c.521T>C CC genotype vs. TC or TT genotypes [11]. A meta-analysis of 21 studies by Nguyen et al. found a significant association between LDL-C lowering effectiveness and SLCO1B1 variants, particularly rs4149056 (c.521T>C), rs2306283 (c.388A>G) and rs11045819 (c.463C>A) polymorphisms [12]. However, these studies are limited by several factors, including a limited number of statins and doses evaluated, small sample size, and study heterogeneity arising from varied statin dosages and treatment durations in the studies included in the meta-analysis by Nguyen et al. [12], which may have confounded the observed associations between SLCO1B1 polymorphisms and statin effectiveness.
Elevated LDL-C levels are an important risk factor for the development of cardiovascular disease (CVD). The Cholesterol Treatment Trialists (CTT) Collaborators found that an LDL-C reduction of 1 mmol/L was associated with a 21% reduction in major vascular events [13]. Validating associations between SLCO1B1 function and degree of LDL-C lowering can help guide optimal prescribing of lipid-lowering medications. If SLCO1B1 function is found to serve as a marker of reduced statin effectiveness, it could be used clinically, by itself or with other patient factors, to triage patients to other lipid-lowering therapies such as proprotein convertase subtilisin/kexin type 9 inhibitors (PCSK9i), resulting in better patient outcomes and potentially better insurance coverage of both pharmacogenomic testing and PCSK9i therapy. The authors therefore sought to assess the effect of SLCO1B1 variation on statin effectiveness within their patient population, with the primary endpoint being the change in LDL-C and secondary endpoints including occurrence of SAMS and statin adherence.

2. Materials and Methods

This single-center cohort study evaluated adult patients treated at a large community health system from January 2018 to August 2024 based on a retrospective chart review. At this site, patients are tested using an external laboratory for a variety of conditions, most commonly mental health, pre-emptive DPYD screening, statin intolerance, and appropriate clopidogrel use. The pharmacogenomics program is pharmacist-led, with a weekly pharmacogenomics clinic offering both pre- and post-test consultations, with most testing ordered through physicians. Charts of patients who received SLCO1B1 testing as part of the 27-gene panel pharmacogenomic (PGx) testing for various indications and were on statin therapy were reviewed (n = 2015).
Patients were excluded if they were <18 years of age, not prescribed statin therapy, had PGx testing ordered specifically to guide statin selection (including those with a history of statin failure or who had statin therapy initiated after PGx results), were on other lipid-lowering agents during the study period (ezetimibe, PCSK9i, bempedoic acid, gemfibrozil, niacin, or fish oil), or had evidence of thyroid dysregulation (thyroid stimulating hormone level outside of the reference range of 0.4–4.0 mcIU/mL) or hepatic dysfunction (alanine transaminase level > 2× upper limit of normal, i.e., ALT > 58 U/L for males and ALT > 38 U/L for females) during the study period (Figure 1). The tested SLCO1B1 variant was rs4149056 (NM_006446.5:c.521T>C). The rs4149056 variant (c.521T>C) in the SLCO1B1 gene is designated as the *5 allele according to PharmVar [14] nomenclature. This variant affects SLCO1B1 transporter activity, with the C allele (*5) associated with reduced protein function compared to the wild-type T allele (*1). The genotype–phenotype relationships are as follows [3]:
  • TT genotype (*1/*1): Normal function phenotype
  • TC genotype (*1/*5): Decreased function phenotype
  • CC genotype (*5/*5): Poor function phenotype
The index date was defined as the date of the baseline LDL-C level obtained within 1 year prior to statin initiation, and the study period was defined as the timeframe between the index date and the date of the follow-up LDL-C level obtained at least 6 weeks after statin initiation. Chart review and data extraction were performed by five reviewers using clearly defined data collection criteria. Any discrepancies identified during the review process were discussed among all reviewers and resolved through group consensus. Additional variables recorded included age, race, sex, body mass index (BMI), smoking status, diabetes, chronic kidney disease (defined as estimated glomerular filtration rate (eGFR) < 60 or chronic kidney disease (CKD) in the problem list), concurrent use of strong or moderate CYP3A4 inducers and inhibitors (strong inducers included carbamazepine, enzalutamide, and/or rifampin; moderate inducers included dabrafenib, efavirenz, elagolix, eslicarbazepine, lorlatinib, oxcarbazepine, phenobarbital, phenytoin, and/or St. John’s wort; strong inhibitors included ceritinib, clarithromycin, delaviridine, idelalisib, indinavir, itraconazole, ketoconazole, mibefradil, nefazodone, nelfinavir, ribociclib, ritonavir, saquinavir, telaprevir, telithromycin, tucatinib, and/or voriconazole; moderate inhibitors included aprepitant, ciprofloxacin, crizotinib, diltiazem, erythromycin, fluconazole, imatinib, letermovir, netupitant, and/or verapamil) [15], statin medication and dose prescribed, and indication for statin therapy (i.e., primary atherosclerotic cardiovascular disease (ASCVD) prevention or secondary ASCVD prevention, with secondary ASCVD prevention defined as history of a prior ASCVD event, which includes stroke, transient ischemic attack, documented coronary artery disease with stable angina, acute coronary syndromes, coronary or other arterial revascularization, peripheral vascular disease, or aortic aneurysm). CYP3A4*1A = NM_017460.6:c.-392G>A (rs2740574), CYP3A4*22 = NM_017460.6:c.522-191C>T (rs35599367) and CYP3A5*3 = NM_000777.5:c.219-237A>G (rs776746), CYP3A5*6 = NM_000777.5:c.624G>A (rs10264272), CYP3A5*7 = NM_000777.5:c.1035_1036insT (rs41303343) genetic variants as defined by PharmVar nomenclature [14] were also assessed. Although CYP3A4 is not a CPIC gene, it is the primary metabolizing enzyme for atorvastatin and simvastatin [16], and was therefore assessed as an exploratory endpoint. The primary endpoint was the percent change in LDL-C from index to follow-up, with secondary endpoints of SAMS occurrence and statin adherence.
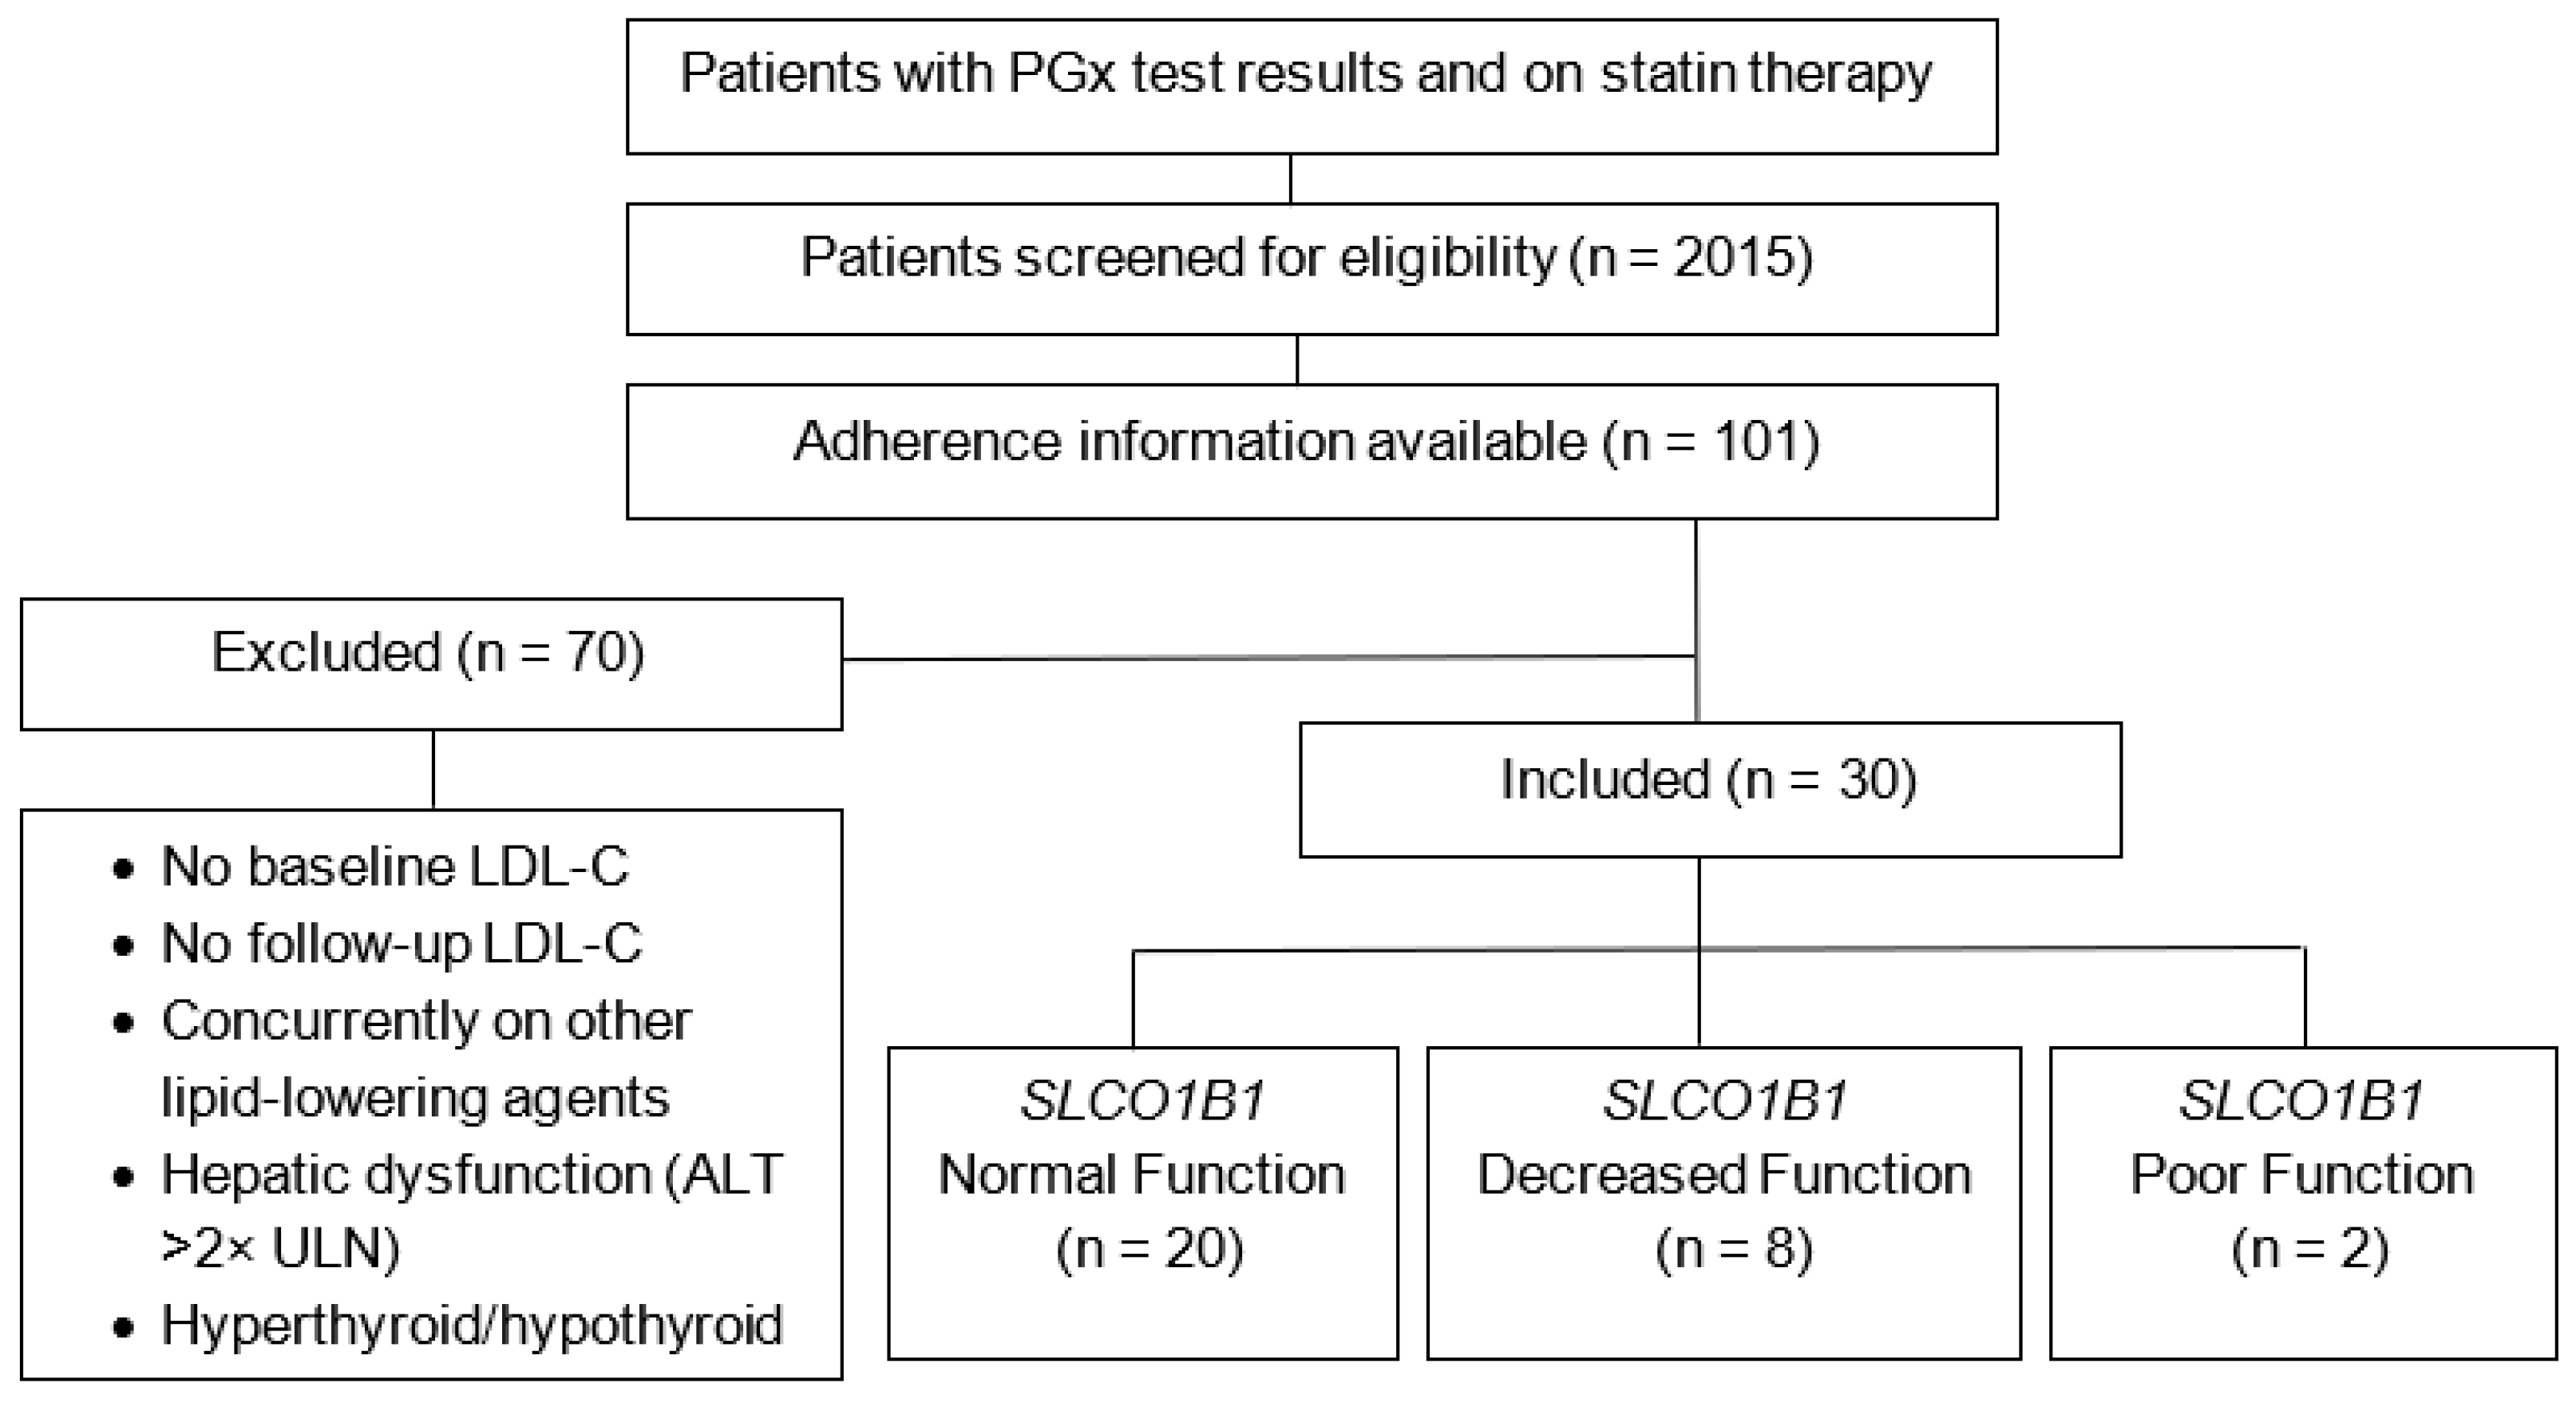
SAMS was defined as any myopathy during statin therapy and identified through a stepwise process: 1. Documentation of statin intolerance in the allergies section. 2. Chart documentation of “myopathy” and included only if it was documented to be statin-related. Statin adherence was defined as the proportion of days covered (PDC) of 80% or higher during the study period. For both SAMS and adherence endpoints, patients with missing data were excluded from the analysis of that specific outcome. Due to the small sample size with available adherence data, the exclusion criteria were modified for the adherence endpoint to include patients even if their PGx data were available prior to prescribing a statin (Figure 2). Data analysis was performed with Microsoft® Excel® Version 2503 (Microsoft Corporation, Redmond, WA, USA) and JMP® Pro 17.2.0 (Statistical Discovery LLC, Cary, NC, USA). Baseline characteristics were analyzed using descriptive statistics, except for mean baseline LDL-C by SLCO1B1 function, which was analyzed using one-way ANOVA. One-way ANOVA was used for the primary outcome and linear regression was used to adjust for confounders. Secondary outcomes of SAMS occurrence and statin adherence were analyzed using chi-square test of independence and Fisher’s exact test, respectively, with logistic regression used to adjust for confounders. Confounders included CYP3A4 and CYP3A5 variation, BMI, smoking status, diabetes, CKD, and race.

3. Results

A total of 2015 patients were identified as having pharmacogenomic test results who were also prescribed statin therapy during the study period. During the review, 1802 patients were excluded due to the following reasons: no baseline LDL-C, no follow-up LDL-C, PGx results were available to guide statin therapy, concurrent use of other lipid-lowering agents, hepatic dysfunction, and thyroid dysfunction, resulting in 213 patients being included (Figure 1).
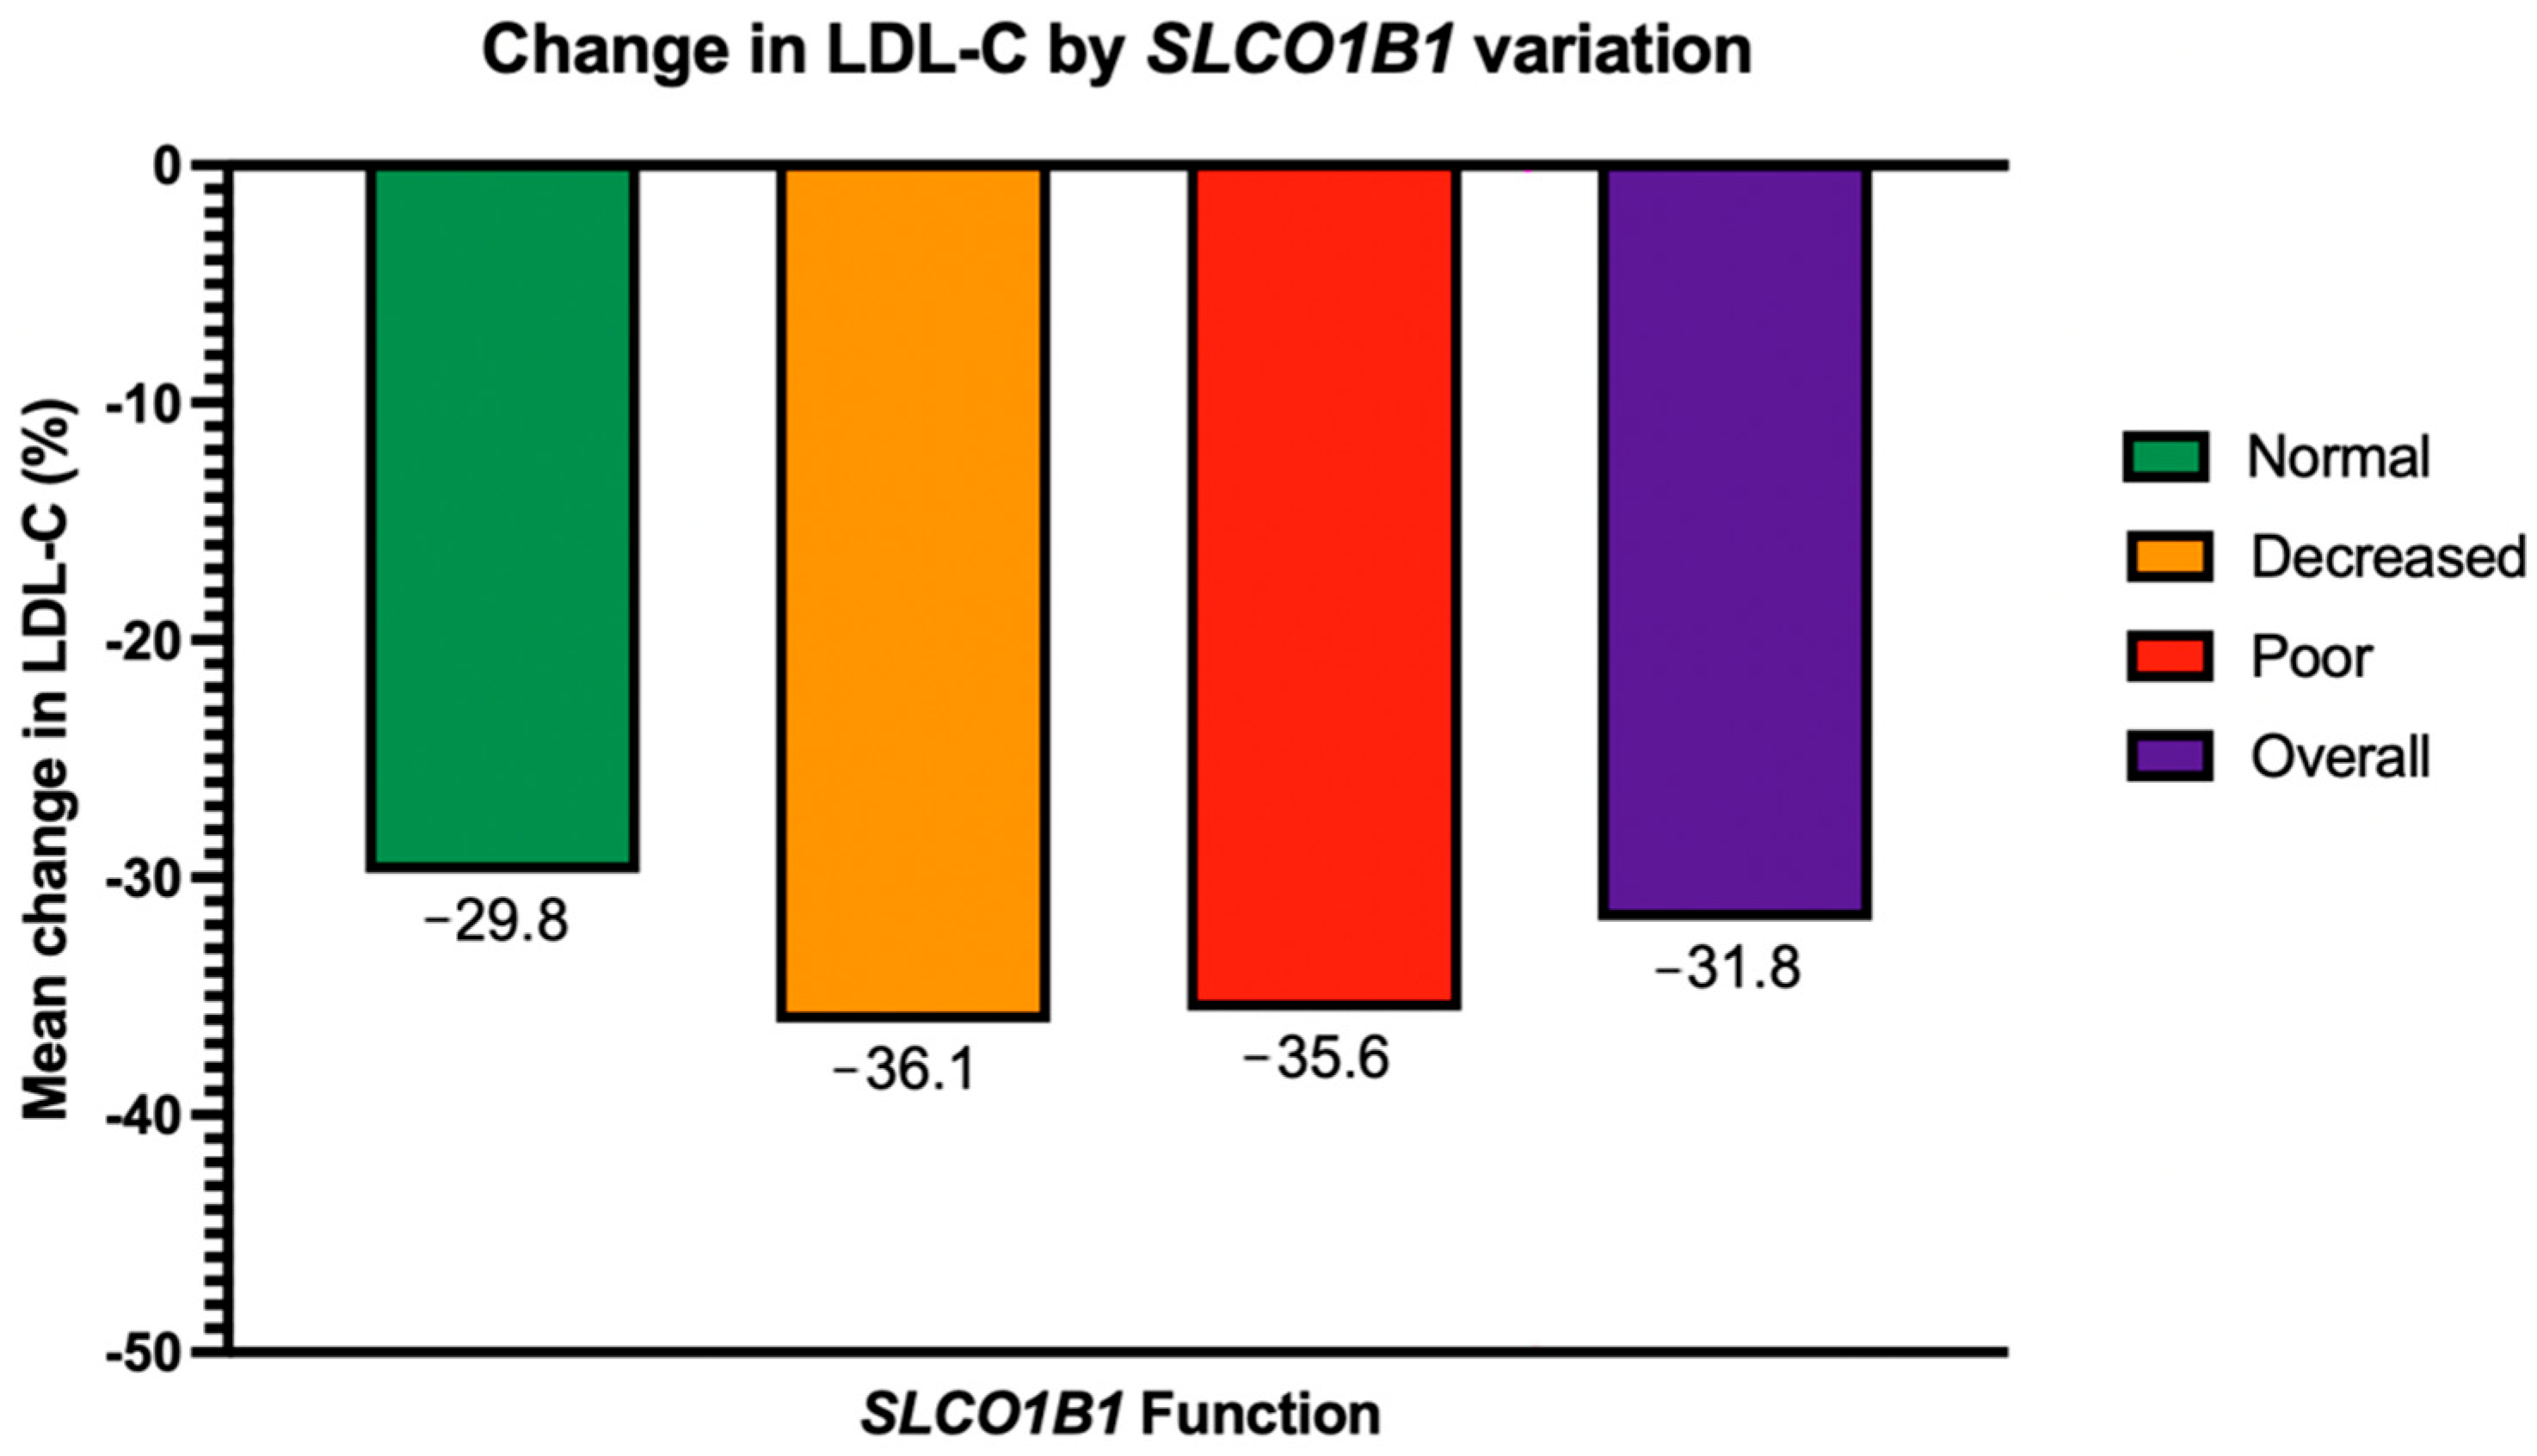
Baseline characteristics are summarized in Table 1. The average duration of statin therapy at the time of the first follow-up LDL-C level was 10 months. The mean overall baseline LDL-C was 142 mg/dL (±35.8 mg/dL). The mean baseline LDL-C was not significantly different between the 3 SLCO1B1 function groups (141 mg/dL, 141 mg/dL and 153 mg/dL for normal, decreased, and poor SLCO1B1 function, respectively, p = 0.65). Overall, 68% of the patients were predicted to have normal SLCO1B1 function, 28% decreased function, and 4% poor function. LDL-C decreased by an average of 31.8% across all 3 SLCO1B1 groups. LDL-C decreased on average by 29.8% (95% CI: −33.9, −25.7), 36.1% (95% CI: −42.5, −29.7), and 35.6% (95% CI: −53.0, −18.2) in the normal, decreased, and poor SLCO1B1 function groups, respectively (Figure 3), and this difference across the groups was not found to be statistically significant (p = 0.24, Table 2). Adjusting for CYP3A4 and CYP3A5 variation, BMI, smoking status, diabetes, CKD, and race did not significantly impact this finding. In a sub-group analysis, adjusting for statin intensity did not affect changes in LDL-C based on SLCO1B1 variation (Table 2).
Overall, SAMS occurred in 29 patients and SLCO1B1 variation did not significantly impact SAMS occurrence (p = 0.24, Table 3). Statin adherence data was available for 101 patients out of the total 2015 patients screened. Based on the modified exclusion criteria for this endpoint as described in Section 2, 30 patients were included for analysis of adherence to statin therapy. In this sample, 22 patients were adherent to statin therapy based on our adherence cutoff of 80% PDC or higher, and SLCO1B1 variation was not found to significantly impact statin adherence (p = 1.00, Table 4). A subgroup analysis exploring the effect of SAMS on changes in LDL-C and statin adherence found that the decrease in LDL-C was significantly greater in patients who did not have SAMS (0.04, Table 5); however, SAMS did not significantly affect adherence in this sample (p = 0.44, Table 6).

4. Discussion

This single-center retrospective cohort study examined the relationship between SLCO1B1 genetic variation and statin effectiveness, SAMS occurrence, and adherence in a real-world clinical setting. Contrary to the authors’ hypothesis and previous studies, the findings do not support a significant impact of SLCO1B1 phenotype on any of these clinical outcomes.
This study contributes to the limited body of literature evaluating the impact of SLCO1B1 variation on statin effectiveness. Unlike previous research that has predominantly focused on the well-established association between SLCO1B1 and SAMS risk [4,5,6,7,8], this investigation specifically evaluated lipid-lowering effectiveness across different SLCO1B1 phenotypes. The inclusion of all currently available statins at varying intensities (high, moderate, and low) provides a comprehensive assessment of statin response patterns that may be generalizable to diverse clinical scenarios. Additionally, the attempt to incorporate third party fill history as a surrogate for adherence represents a key methodological consideration that is often lacking in retrospective chart review studies, as adherence significantly impacts both effectiveness and safety outcomes.
The assessment of CYP3A4 and CYP3A5 metabolizer status and drug interactions with strong and moderate CYP3A4 inducers and inhibitors further strengthens the analysis by accounting for potential confounding effects of drug metabolism on statin exposure and response. As only 4 out of the 213 included patients were on an interacting CYP3A4 inducer/inhibitor, this confounder was excluded from the analysis.
Several non-genetic factors also play a role in statin pharmacokinetics and may influence therapeutic outcomes of these agents. To address this, this study also analyzed the impact of race, BMI, smoking, diabetes, CKD, and excluded confounders such as concurrent use of other lipid-lowering agents, hepatic dysfunction, and thyroid dysfunction.
The subgroup analysis finding that patients without SAMS had a significantly greater decrease in LDL-C (p = 0.04) suggests that SAMS may negatively impact statin effectiveness. This could be attributed to non-adherence to the statin regimen due to the adverse effects. However, this hypothesis was not supported by the adherence analysis, though this may be due to the adherence data availability being limited to only 30 patients in this study.
Several important limitations may have affected the ability to detect true associations. The retrospective chart review design inherently limits data, especially pertaining to medication adherence. Medication adherence is inconsistently documented in the electronic health record (EHR), necessitating reliance on prescription fill histories as surrogate measures. The authors’ institutional EHR medication fill history is sourced through a third-party platform with several limitations: (1) data availability extends only two years retrospectively, (2) fills paid out-of-pocket or through discount programs are not captured, (3) not all insurance plans report to the third-party platform, and (4) prescription fills do not necessarily correlate with medication pickup or actual consumption. Given these limitations, adherence information was available for only 30 of the included patients. The authors acknowledge that these constraints limit their ability to accurately assess true medication adherence, and they utilized all available data sources to provide the most comprehensive assessment possible within these limitations. This critical limitation likely contributed to insufficient statistical power to detect clinically meaningful differences, and adherence was thus analyzed in an exploratory manner. Type II error is a significant concern, and these negative findings should be interpreted cautiously in this context. The effect sizes for SLCO1B1 function on statin effectiveness may be smaller than those observed for SAMS risk, requiring substantially larger sample sizes to detect with adequate power. Furthermore, the study population was predominantly White, which limits the generalizability of the findings to more diverse populations and may not reflect the full spectrum of SLCO1B1 variant effects across different ethnic groups. Given the significant allele frequency differences of statin-related pharmacokinetic genes across major racial groups [17], the impact of SLCO1B1*5 on statin effectiveness underscores the importance of validating findings across diverse populations. Reports of statin-induced myopathy in certain racial groups suggest that population-level responses may be driven, at least in part, by population-specific variants [18]. In addition, differences in linkage disequilibrium patterns, co-inherited variants, and gene–environment interactions may further influence drug disposition and the risk of adverse events. These genetic factors can be compounded by socioeconomic and healthcare access disparities, which may affect adherence, prescribing patterns, and clinical outcomes. Therefore, cross-population studies are essential not only to confirm the clinical relevance of SLCO1B1 variants but also to identify additional genetic, biological, and contextual determinants of statin response and safety.
The broad baseline and follow-up windows employed in this study reflect real-world clinical practice patterns, where patients present for care and follow-up at varying intervals based on individual circumstances, provider availability, and clinical need. While narrower temporal windows provide greater precision, they would compromise the external validity and generalizability of the findings to routine clinical practice. The authors implemented clinically relevant constraints to balance precision with real-world applicability. Baseline LDL-C measurements were restricted to within one year prior to statin initiation, as clinical practice typically relies on LDL-C values obtained within this timeframe to guide statin prescribing decisions. For follow-up assessment, LDL-C levels were required to be obtained at least six weeks post-initiation, consistent with recommendations from the American Association of Clinical Endocrinologists (AACE) and American College of Endocrinology (ACE) Guidelines for Management of Dyslipidemia and Prevention of Cardiovascular Disease [19]. These guidelines recommend testing at six-week intervals until treatment goals are achieved, followed by 6- to 12-month monitoring intervals thereafter. Through comprehensive chart review, the authors excluded patients with documented statin discontinuation prior to follow-up laboratory assessment. The observed average duration of statin therapy at first follow-up LDL-C assessment was 10 months, which while not ideal, reflects typical clinical monitoring practices. The authors acknowledge that follow-up time was not incorporated as a covariate in the primary analysis, which represents a limitation as variable treatment durations could influence observed LDL-C responses. However, since maximum LDL-C lowering effectiveness is typically achieved within 12 weeks of statin initiation [1], this effect is expected to have been captured by the mean follow-up timing of 10 months.
The exclusion of patients who had pharmacogenomic testing specifically ordered to guide statin selection due to past intolerance may have introduced bias by selectively omitting patients most likely to be influenced by SLCO1B1 genotype, potentially diluting observable genotype–phenotype relationships. However, these patients would likely have had suboptimal adherence to their previous statin therapy due to adverse effects, which could confound the assessment of genetic effects on statin effectiveness. The exclusion of patients who initiated statin therapy after their pharmacogenomic results were available was necessary to minimize confounding, as knowledge of SLCO1B1 phenotype could have influenced both statin selection and dosing decisions, making it impossible to assess the natural relationship between genotype and treatment outcomes.
An important pharmacogenomic limitation involves the absence of ABCG2 genotyping from the commercial PGx panel most commonly utilized at the study institution. The ABCG2 transporter plays a role in rosuvastatin transport and absorption, and genetic variation in this gene could confound the relationship between SLCO1B1 and rosuvastatin response [2,20,21], which comprised a substantial portion of the study population. CYP2C9, which is the primary metabolizing enzyme of fluvastatin [22,23], was also not considered. However, this is not likely to significantly impact the results as only 1 out of the 213 included patients was prescribed fluvastatin.
It is worth noting that the impact of SLCO1B1 variation on statin exposure varies across statins. Simvastatin acid is exclusively dependent on SLCO1B1 for hepatic uptake [24]. In contrast, atorvastatin and other statins utilize additional hepatic uptake transporters including SLCO1B3 and SLCO2B1, providing alternative pathways that may partially compensate when SLCO1B1 function is impaired [24]. Consequently, the effect of the SLCO1B1 *5/*5 genotype, which confers poor transporter function, is most pronounced for simvastatin acid, leading to a marked increase in simvastatin exposure [24]. This pharmacokinetic distinction is pertinent to the present study cohort, where atorvastatin predominated (58.2%) versus simvastatin (15%), potentially explaining why lower than expected rates of statin ineffectiveness and intolerance among variant carriers were observed. These findings underscore the importance of considering specific statin type when evaluating the clinical utility of SLCO1B1 genotyping.
While the *5 allele was the focus of the study’s genotyping approach, there are additional variants in SLCO1B1 that are known to impair the transporter function, e.g., SLCO1B1*9: c.1463G>C (rs59502379) and *23: c. (rs373327528). These were not included in the commercial clinical assay that is commonly used by the study institution. However, this is unlikely to have a major impact on the results of this study since 97.2% of the study cohort was White, and the frequencies of these variants are very low (<0.1%) in those of European ancestry [25].
Future research should prioritize prospective cohort studies with larger, more diverse patient populations to provide adequate statistical power for detecting clinically meaningful effects. Improved adherence measurement methodologies would enhance the validity of effectiveness assessments. Multi-center studies spanning different health networks would improve generalizability and provide the sample sizes necessary for robust pharmacogenomic associations. A re-analysis of statin studies for which SLCO1B1 sequencing data are available may also provide valuable insight into this variant (or others) and statin effectiveness. Additionally, comprehensive pharmacogenomic panels that include ABCG2 and CYP2C9 should be incorporated to account for the polygenic nature of statin response.

5. Conclusions

This study does not support a significant impact of SLCO1B1 genetic variation on statin effectiveness, SAMS occurrence, or adherence. However, methodological limitations, particularly the small sample size and retrospective design, limit the definitive nature of these conclusions. While these findings do not demonstrate clinical utility of SLCO1B1 testing for predicting statin effectiveness, definitive conclusions regarding the absence of genetic effects cannot be drawn. This study may have been underpowered to detect clinically relevant associations, particularly considering the relatively small cohort and unequal representation across SLCO1B1 phenotype categories. The current evidence base remains insufficient to guide clinical decision-making using SLCO1B1 variation as a biomarker for statin effectiveness. Despite these findings, the established role of SLCO1B1 in SAMS risk prediction, as outlined in the 2022 CPIC guidelines [3], remains clinically relevant and should continue to inform prescribing decisions focused on safety optimization. Importantly, SLCO1B1 variation is not a contraindication to statin therapy, and statin therapy remains recommended for patients in whom a statin is indicated regardless of SLCO1B1 variation. Until larger prospective validation studies with enhanced adherence monitoring and comprehensive pharmacogenomic assessment definitively characterize the relationship between SLCO1B1 function and statin therapeutic outcomes, clinicians should continue to rely on established clinical parameters and the recognized association between SLCO1B1 and SAMS risk when making statin prescribing decisions.

Author Contributions

Conceptualization, M.A.F.; methodology, M.A.F.; software, M.A.F.; validation, K.B., M.S., G.N. and M.H.; formal analysis, M.A.F.; investigation, M.A.F., K.B., M.S., G.N. and M.H.; resources, J.D.A.; data curation, M.A.F., K.B., M.S., G.N. and M.H.; writing—original draft preparation, M.A.F.; writing—review and editing, M.A.F., K.B., M.S., G.N., M.H., E.G.S., A.L.H. and J.D.A.; visualization, M.A.F.; supervision, E.G.S., A.L.H. and J.D.A.; project administration, M.A.F. All authors have read and agreed to the published version of the manuscript.

Funding

This research received no external funding.

Institutional Review Board Statement

The study was conducted in accordance with the Declaration of Helsinki, and approved by the Institutional Review Board of ST ELIZABETH HEALTHCARE (protocol code: 24-036 and date of approval: 14 October 2024).

Informed Consent Statement

Patient consent was waived due to the retrospective chart review design of this study. The research involved no more than minimal risk, the waiver did not adversely affect patient rights or welfare, the study could not be practicably conducted without the waiver as it required analysis of existing medical records, and no additional information needed to be provided to subjects given the observational nature of using de-identified data.

Data Availability Statement

The raw data supporting the conclusions of this article will be made available by the authors on request.

Acknowledgments

We thank Nihal El Rouby for her valuable feedback on the study. During the preparation of this manuscript, the author(s) used Claude Sonnet 4 (Anthropic, San Francisco, CA, USA) for the purposes of improving clarity, grammar, and readability of the manuscript text. The authors have reviewed and edited the output and take full responsibility for the content of this publication.

Conflicts of Interest

The authors declare no conflicts of interest in the previous 12 months.

Abbreviations

The following abbreviations are used in this manuscript:
ALT Alanine transaminase
ANOVA Analysis of variance
ASCVD Atherosclerotic cardiovascular disease
BMI Body mass index
CI Confidence interval
CKD Chronic kidney disease
CPIC Clinical Pharmacogenetics Implementation Consortium
CTTCholesterol Treatment Trialists
CVD Cardiovascular disease
eGFR Estimated glomerular filtration rate
EHRElectronic Health Record
HMG-CoAHydroxymethylglutaryl-coenzyme A
LDL-C Low-density lipoprotein cholesterol
PCSK9i Proprotein convertase subtilisin/kexin type 9 inhibitors
PDCProportion of days covered
PGx Pharmacogenomic/pharmacogenomics
PharmVarPharmacogene Variation Consortium
SAMS Statin-associated muscle symptoms
SLCO1B1 Solute carrier organic anion transporter family member 1B1

References

  1. Grundy, S.M.; Stone, N.J.; Bailey, A.L.; Beam, C.; Birtcher, K.K.; Blumenthal, R.S.; Braun, L.T.; De Ferranti, S.; Faiella-Tommasino, J.; Forman, D.E.; et al. 2018 AHA/ACC/AACVPR/AAPA/ABC/ACPM/ADA/AGS/APhA/ASPC/NLA/PCNA Guideline on the Management of Blood Cholesterol: A Report of the American College of Cardiology/American Heart Association Task Force on Clinical Practice Guidelines. Circulation 2019, 139, e1082–e1143. [Google Scholar]
  2. Young, S.G.; Fong, L.G. Lowering Plasma Cholesterol by Raising LDL Receptors—Revisited. N. Engl. J. Med. 2012, 366, 1154–1155. [Google Scholar] [CrossRef]
  3. Cooper-DeHoff, R.M.; Niemi, M.; Ramsey, L.B.; Luzum, J.A.; Tarkiainen, E.K.; Straka, R.J.; Gong, L.; Tuteja, S.; Wilke, R.A.; Wadelius, M.; et al. The Clinical Pharmacogenetics Implementation Consortium Guideline for SLCO1B1, ABCG2, and CYP2C9 Genotypes and Statin-Associated Musculoskeletal Symptoms. Clin. Pharmacol. Ther. 2022, 111, 1007–1021. [Google Scholar] [CrossRef]
  4. The SEARCH Collaborative Group. SLCO1B1 Variants and Statin-Induced Myopathy—A Genomewide Study. N. Engl. J. Med. 2008, 359, 789–799. [Google Scholar] [CrossRef]
  5. Bakar, N.S.; Neely, D.; Avery, P.; Brown, C.; Daly, A.K.; Kamali, F. Genetic and Clinical Factors Are Associated with Statin-Related Myotoxicity of Moderate Severity: A Case–Control Study. Clin. Pharmacol. Ther. 2018, 104, 178–187. [Google Scholar] [CrossRef]
  6. Carr, D.F.; Francis, B.; Jorgensen, A.L.; Zhang, E.; Chinoy, H.; Heckbert, S.R.; Bis, J.C.; Brody, J.A.; Floyd, J.S.; Psaty, B.M.; et al. Genomewide Association Study of Statin-Induced Myopathy in Patients Recruited Using the UK Clinical Practice Research Datalink. Clin. Pharmacol. Ther. 2019, 106, 1353–1361. [Google Scholar] [CrossRef]
  7. Hou, Q.; Li, S.; Li, L.; Li, Y.; Sun, X.; Tian, H. Association between SLCO1B1 Gene T521C Polymorphism and Statin-Related Myopathy Risk: A Meta-Analysis of Case-Control Studies. Medicine 2015, 94, e1268. [Google Scholar] [CrossRef]
  8. Linskey, D.W.; English, J.D.; Perry, D.A.; Ochs-Balcom, H.M.; Ma, C.; Isackson, P.J.; Vladutiu, G.D.; Luzum, J.A. Association of SLCO1B1 c.521T>C (Rs4149056) with Discontinuation of Atorvastatin Due to Statin-Associated Muscle Symptoms. Pharmacogenet. Genom. 2020, 30, 208–211. [Google Scholar] [CrossRef] [PubMed]
  9. Huff, T.; Boyd, B.; Jialal, I. Physiology, Cholesterol; StatPearls Publishing LLC.: Treasure Island, FL, USA, 2022. [Google Scholar]
  10. Zakria, M.; Hussain, A.; Ahmad, N.; Ahmed, N.; Rauf, M.A.; Siraj, S. The Lipid-Lowering Efficacy of Rosuvastatin Is Associated with Variations in SLCO1B1: A 12-Month Prospective Cohort Study. Eur. Rev. Med. Pharmacol. Sci. 2023, 27, 4708–4717. [Google Scholar] [CrossRef] [PubMed]
  11. Sivkov, A.; Chernus, N.; Gorenkov, R.; Sivkov, S.; Sivkova, S.; Savina, T. Relationship between Genetic Polymorphism of Drug Transporters and the Efficacy of Rosuvastatin, Atorvastatin and Simvastatin in Patients with Hyperlipidemia. Lipids Health Dis. 2021, 20, 157. [Google Scholar] [CrossRef] [PubMed]
  12. Nguyen, H.H.; Nguyen, C.T.T.; Mai, T.N.P.; Huong, P.T. Associations between Four Polymorphisms of the SLCO1B1 and Effectiveness of the Statins: A Meta-Analysis. Pharmacogenet. Genom. 2023, 33, 65–78. [Google Scholar] [CrossRef]
  13. Baigent, C.; Keech, A.; Kearney, P.M.; Blackwell, L.; Buck, G.; Pollicino, C.; Kirby, A.; Sourjina, T.; Peto, R.; Collins, R.; et al. Efficacy and Safety of Cholesterol-Lowering Treatment: Prospective Meta-Analysis of Data from 90,056 Participants in 14 Randomised Trials of Statins. Lancet 2005, 366, 1267–1278, Erratum in Lancet 2005, 366, 1358. [Google Scholar] [PubMed]
  14. Ramsey, L.B.; Gong, L.; Lee, S.-B.; Wagner, J.B.; Zhou, X.; Sangkuhl, K.; Adams, S.M.; Straka, R.J.; Empey, P.E.; Boone, E.C.; et al. PharmVar GeneFocus: SLCO1B1. Clin. Pharmacol. Ther. 2023, 113, 782–793. [Google Scholar] [CrossRef]
  15. Flockhart, D.; Thacker, D.; McDonald, C.; Desta, Z.; Division of Clinical Pharmacology, Indiana University School of Medicine. The Flockhart Cytochrome P450 Drug-Drug Interaction Table. 2021. Available online: https://drug-interactions.medicine.iu.edu/main-table (accessed on 15 August 2025).
  16. Whirl-Carrillo, M.; Huddart, R.; Gong, L.; Sangkuhl, K.; Thorn, C.F.; Whaley, R.; Klein, T.E. An Evidence-Based Framework for Evaluating Pharmacogenomics Knowledge for Personalized Medicine. Clin. Pharmacol. Ther. 2021, 110, 563–572. [Google Scholar] [CrossRef]
  17. Alrajeh, K.; AlAzzeh, O.; Roman, Y. The Frequency of Major ABCG2, SLCO1B1 and CYP2C9 Variants in Asian, Native Hawaiian and Pacific Islander Women Subgroups: Implications for Personalized Statins Dosing. Pharmacogenomics 2023, 24, 381–398. [Google Scholar] [CrossRef]
  18. Alrajeh, K.; Roman, Y.M. The Frequency of Rs2231142 in ABCG2 among Asian Subgroups: Implications for Personalized Rosuvastatin Dosing. Pharmacogenomics 2023, 24, 15–26. [Google Scholar] [CrossRef] [PubMed]
  19. Jellinger, P.S.; Handelsman, Y.; Rosenblit, P.D.; Bloomgarden, Z.T.; Fonseca, V.A.; Garber, A.J.; Grunberger, G.; Guerin, C.K.; Bell, D.S.H.; Mechanick, J.I.; et al. American Association of Clinical Endocrinologists and American College of Endocrinology Guidelines for Management of Dyslipidemia and Prevention of Cardiovascular Disease. Endocr. Pract. 2017, 23, 1–87. [Google Scholar] [CrossRef] [PubMed]
  20. Keskitalo, J.E.; Zolk, O.; Fromm, M.F.; Kurkinen, K.J.; Neuvonen, P.J.; Niemi, M. ABCG2 Polymorphism Markedly Affects the Pharmacokinetics of Atorvastatin and Rosuvastatin. Clin. Pharmacol. Ther. 2009, 86, 197–203. [Google Scholar] [CrossRef]
  21. Chasman, D.I.; Giulianini, F.; MacFadyen, J.; Barratt, B.J.; Nyberg, F.; Ridker, P.M. Genetic Determinants of Statin-Induced Low-Density Lipoprotein Cholesterol Reduction: The Justification for the Use of Statins in Prevention: An Intervention Trial Evaluating Rosuvastatin (JUPITER) Trial. Circ. Cardiovasc. Genet. 2012, 5, 257–264. [Google Scholar] [CrossRef]
  22. Fischer, V.; Johanson, L.; Heitz, F.; Tullman, R.; Graham, E.; Baldeck, J.P.; Robinson, W.T. The 3-Hydroxy-3-Methylglutaryl Coenzyme a Reductase Inhibitor Fluvastatin: Effect on Human Cytochrome P-450 and Implications for Metabolic Drug Interactions. Drug Metab. Dispos. 1999, 27, 410–416. [Google Scholar] [CrossRef]
  23. Newman, C.B.; Preiss, D.; Tobert, J.A.; Jacobson, T.A.; Page, R.L.; Goldstein, L.B.; Chin, C.; Tannock, L.R.; Miller, M.; Raghuveer, G.; et al. Statin Safety and Associated Adverse Events A Scientific Statement from the American Heart Association. Arterioscler. Thromb. Vasc. Biol. 2019, 39, e38–e81. [Google Scholar] [CrossRef] [PubMed]
  24. Kiander, W.; Sinokki, A.; Neuvonen, M.; Kidron, H.; Niemi, M. Comparative Uptake of Statins by Hepatic Organic Anion Transporting Polypeptides. Eur. J. Pharm. Sci. 2025, 209, 107073. [Google Scholar] [CrossRef] [PubMed]
  25. Zhang, B.; Lauschke, V.M. Genetic Variability and Population Diversity of the Human SLCO (OATP) Transporter Family. Pharmacol. Res. 2019, 139, 550–559. [Google Scholar] [CrossRef] [PubMed]
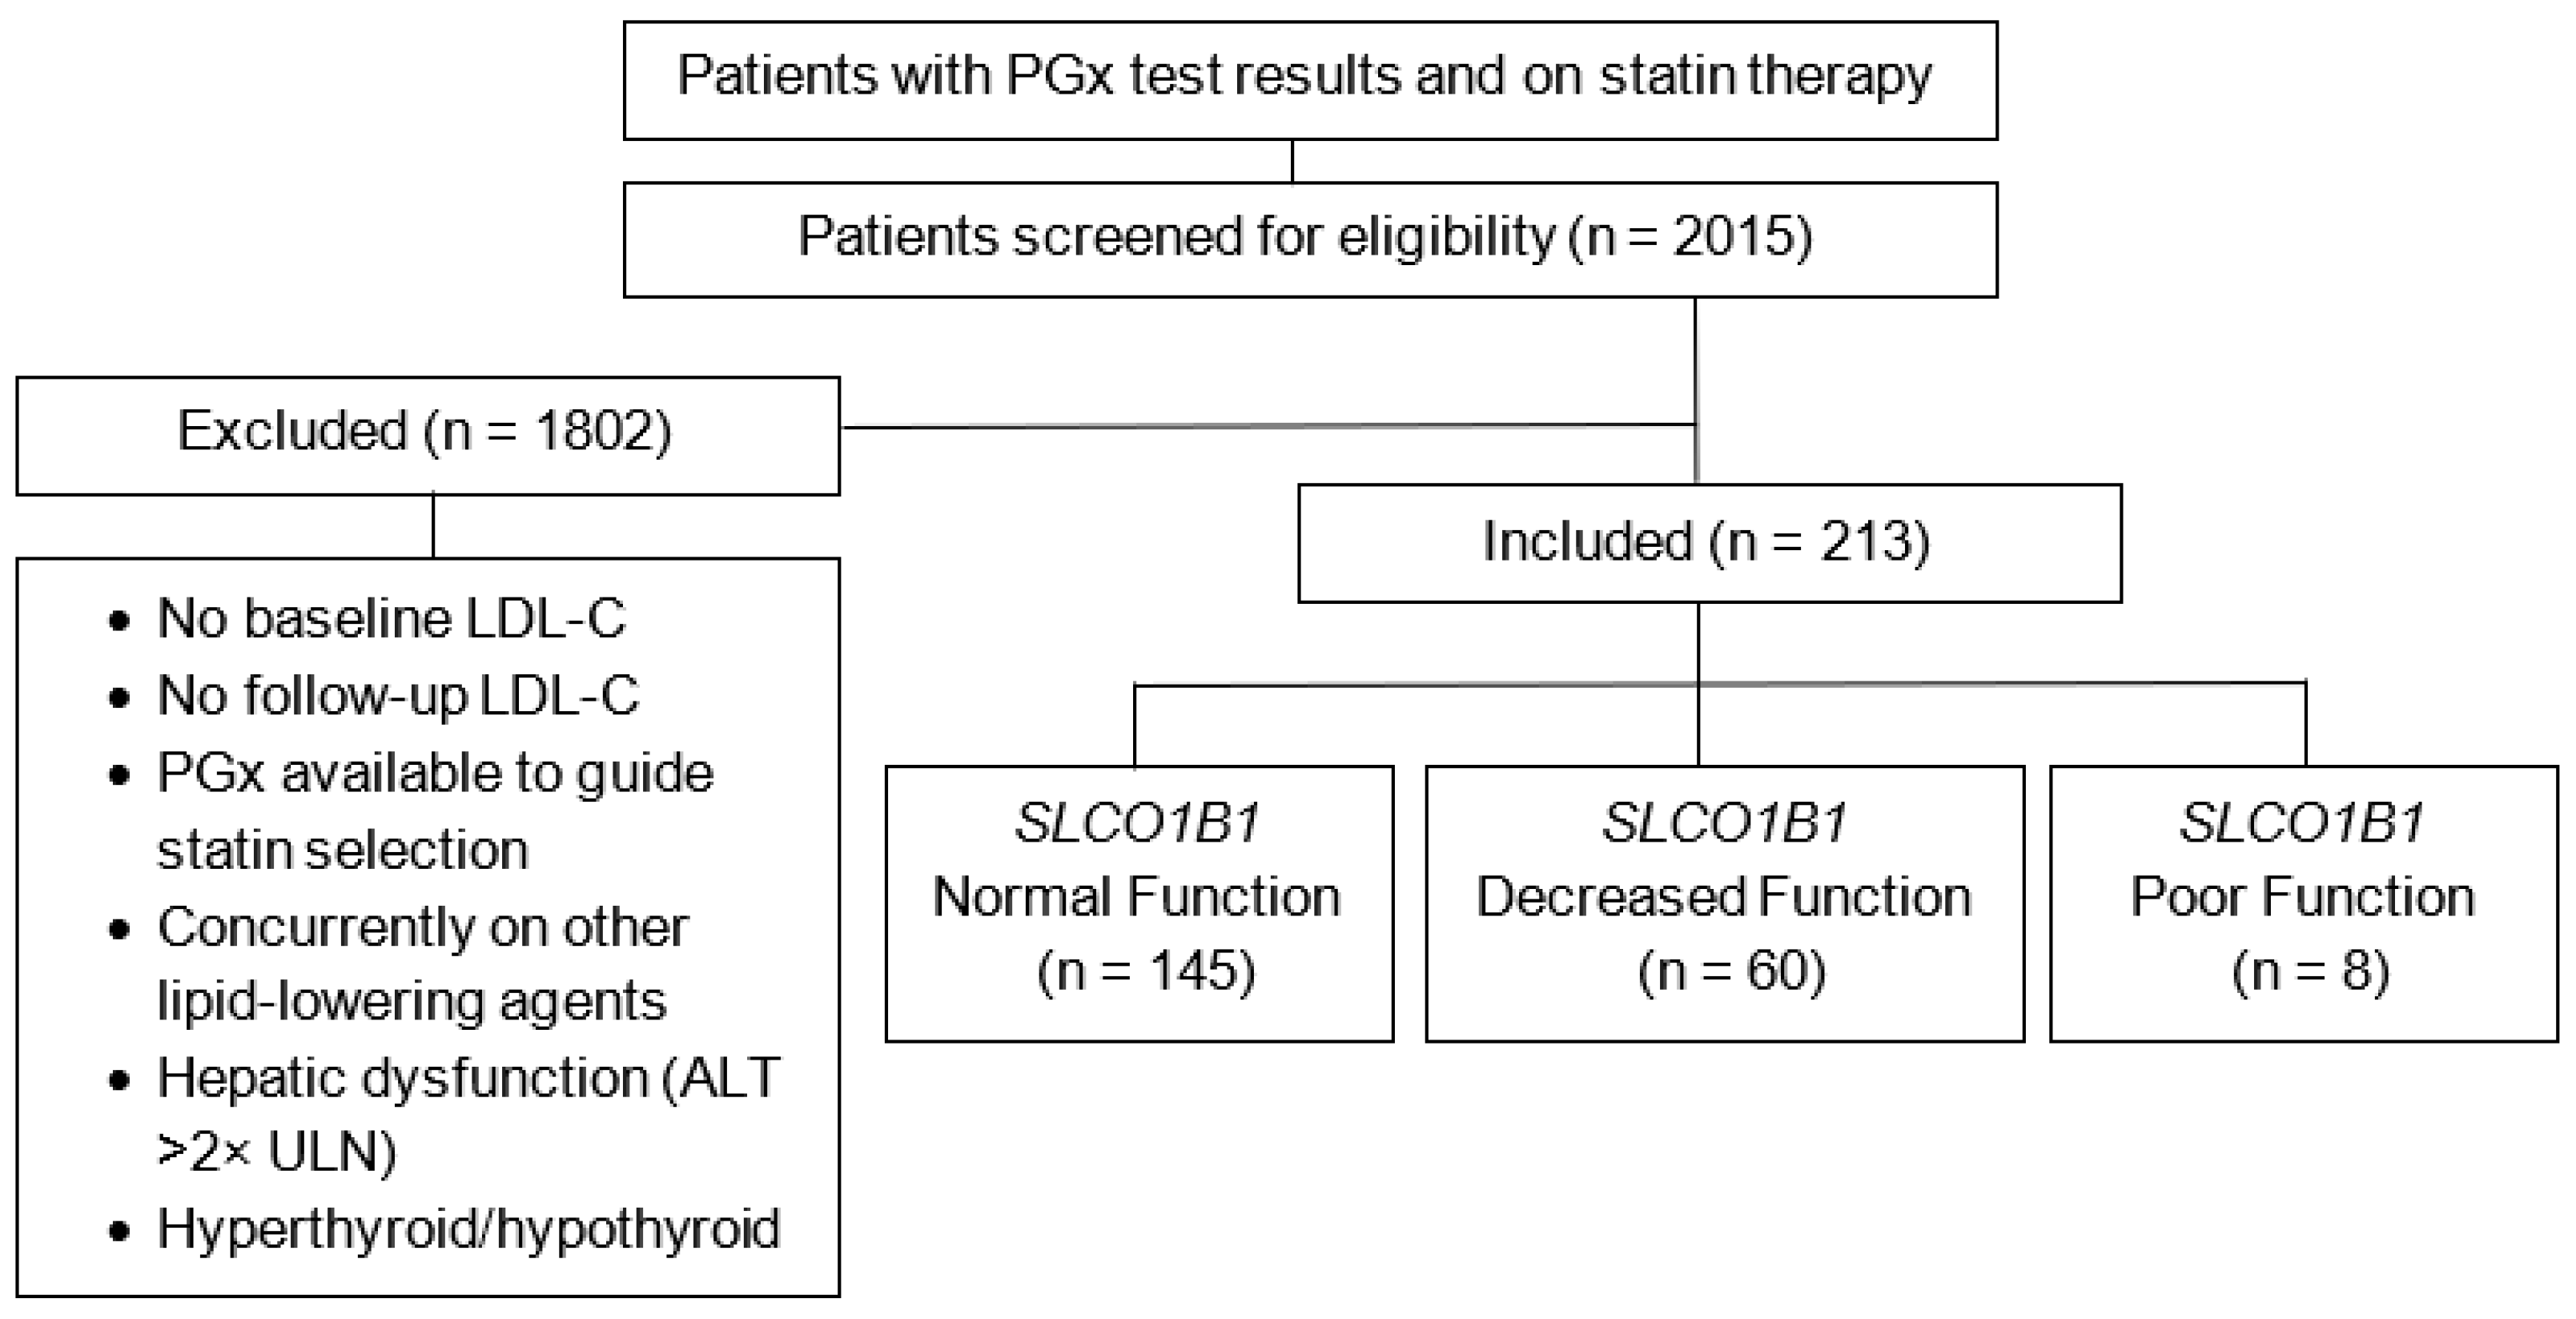
Figure 1. Flowchart of the patient screening and inclusion process. n = number of patients per group; LDL-C = low-density lipoprotein cholesterol; ALT = alanine transaminase level; ULN = upper limit of normal.
Jpm 15 00511 g001
Figure 2. Flowchart of the patient screening and modified inclusion process for adherence. n = number of patients per group; LDL-C = low-density lipoprotein cholesterol; ALT = alanine transaminase level; ULN = upper limit of normal.
Jpm 15 00511 g002
Figure 3. Primary outcome: change in LDL-C by SLCO1B1 variation. SLCO1B1 variation is defined as SLCO1B1 function: normal, decreased, or poor. LDL-C = low-density lipoprotein cholesterol.
Jpm 15 00511 g003
Table 1. Baseline characteristics.
Included patients, N213
SLCO1B1 Functional Status, n (%)
Normal Function (*1/*1)145 (68.1)
Decreased Function (*1/*5)60 (28.2)
Poor Function (*5/*5)8 (3.76)
CYP3A4 Phenotypes, n (%)
Normal Metabolizer (*1/*1, *1/*1A, *1A,*1A)191 (89.6)
Intermediate Metabolizer (*1/*22, *22/*22)21 (9.9)
Data Unavailable1 (0.5)
CYP3A5 Phenotypes, n (%)
Non-expressor (*3/*3, *3/*6, *3/*7, *6/*6,*6/*7, *7/*7)185 (86.9)
Expressor (*1/*1, *1/*3, *1/*6, *1/*7)27 (12.6)
Data Unavailable1 (0.5)
Sex, n (%)
Female124 (58.2)
Race, n (%)
White207 (97.2)
Age: Years, mean (±SD)58 ± 12.4
BMI: kg/m2, mean (±SD)34 ± 16.6
Current Smoker, n (%)51 (23.9)
Diabetes, n (%)50 (23.5)
eGFR < 60 mL/min/1.73m2, n (%)10 (4.7)
Overall Baseline LDL-C: mg/dL, mean (±SD)142 ± 35.8
Baseline LDL-C by SLCO1B1 function: mg/dL, mean (±SD)
Normal Function141 ± 37.1
Decreased Function141 ± 31.7
Poor Function153 ± 41.0
Statin Indication, n (%)
Primary Prevention187 (87.8)
Secondary Prevention26 (12.2)
Statin Medication, n (%)
Atorvastatin124 (58.2)
Simvastatin32 (15.0)
Rosuvastatin28 (13.1)
Pravastatin23 (10.8)
Lovastatin3 (1.4)
Pitavastatin2 (0.9)
Fluvastatin1 (0.5)
Statin Intensity, n (%)
High Intensity25 (11.7)
Moderate Intensity155 (72.8)
Low Intensity33 (15.5)
Concurrent Strong CYP3A4 Inducer, n (%)
Carbamazepine1 (0.5)
Concurrent Moderate CYP3A4 Inhibitor, n (%)
Diltiazem3 (1.4)
Verapamil1 (0.5)
N = number of patients in the study population; n = number of patients per group; SD = standard deviation; BMI = body mass index; eGFR = estimated glomerular filtration rate; LDL-C = low-density lipoprotein cholesterol.
Table 2. Effect of statin intensity on mean change in LDL-C by SLCO1B1 variation.
SLCO1B1
Function
Mean Change in LDL-C (%)
Overallp-ValueStatin
Intensity: High
Statin
Intensity: Moderate
Statin
Intensity: Low
Normal (n = 145)−29.80.24−40−31.1−15.5
Decreased (n = 60)−36.1−45.1−38.9−18.9
Poor (n = 8)−35.6−52.7−38.6−0.9
p-value0.80.130.86
Overall Mean Change in LDL-C (%) by Statin Intensity
Statin Intensity: High (n = 25)−42.1
Statin Intensity: Moderate (n = 155)−33.4
Statin Intensity: Low (n = 33)−16.2
SLCO1B1 variation is defined as SLCO1B1 function: normal, decreased, or poor. p-values calculated using one-way ANOVA. n = number of patients; LDL-C = low-density lipoprotein cholesterol.
Table 3. Occurrence of SAMS based on SLCO1B1 variation.
Overall SAMS Occurrence, n (%)
29 (13.6)
SLCO1B1 FunctionSAMS Occurrencep-Value
Yes, n (%)No, n (%)
Normal19 (8.9)126 (59.2)0.24
Decreased10 (4.7)50 (23.5)
Poor0 (0)8 (3.8)
SLCO1B1 variation is defined as SLCO1B1 function: normal, decreased, or poor. p-value calculated using chi-square test of independence. n = number of patients; SAMS = statin-associated muscle symptoms.
Table 4. Statin adherence by SLCO1B1 variation.
Overall Adherent, n (%)
22 (73.3)
SLCO1B1 FunctionAdherent, n (%)Not Adherent, n (%)p-Value
Normal15 (50)5 (16.7)1.00
Decreased5 (16.7)3 (10)
Poor2 (6.6)0 (0)
SLCO1B1 variation is defined as SLCO1B1 function: normal, decreased, or poor. p-value calculated using Fisher’s exact test. n = number of patients.
Table 5. Effect of SAMS on average change in LDL-C and adherence.
SAMSAverage Change in LDL-C (%)
Adherent (n = 22)Not Adherent (n = 5)
Yes (n = 2)−2.19−9.9
No (n = 28)−40.5−12
p-value0.040.95
p-values calculated using one-way ANOVA. n = number of patients; SAMS = statin-associated muscle symptoms.
Table 6. Effect of SAMS on adherence.
SAMSAdherent (n)Not Adherent (n)p-Value
Yes110.44
No217
p-value calculated using Fisher’s exact test. n = number of patients; SAMS = statin-associated muscle symptoms.
Disclaimer/Publisher’s Note: The statements, opinions and data contained in all publications are solely those of the individual author(s) and contributor(s) and not of MDPI and/or the editor(s). MDPI and/or the editor(s) disclaim responsibility for any injury to people or property resulting from any ideas, methods, instructions or products referred to in the content.