Article

The Relative Position of the Solar Magnetic Dipole Axis and Rotation Axis of the Sun

by
Alexandr Riehokainen
1,*,
Victoria Smirnova
2,
Alexander Solov’ev
3 and
Polina Strekalova
3
1
Department of Physics and Astronomy, University of Turku, FI-20014 Turku, Finland
2
Crimean Astrophysical Observatory, Russian Academy of Sciences, Nauchny, Bakhchisaray 298409, Russia
3
Central (Pulkovo) Astronomical Observatory, Russian Academy of Sciences, Pulkovskoe Shausse 65, Saint-Petersburg 196140, Russia
*
Author to whom correspondence should be addressed.
Galaxies 2025, 13(2), 24; https://doi.org/10.3390/galaxies13020024
Submission received: 28 October 2024 / Revised: 26 February 2025 / Accepted: 10 March 2025 / Published: 19 March 2025

Abstract

:
We estimated the relative location of the solar rotation axis and the magnetic axis of the solar dipole, which were defined as centers of polar coronal holes. We used observations of polar coronal hole data, which were originally obtained with Solar Dynamic Observatory (SDO) spacecraft. To calculate the tilt of the magnetic axis relative to the rotation axis of the Sun, an empirical method for the estimation of the coronal hole centers is proposed. As a result, it was found that these axes do not coincide. The average deviation of the magnetic dipole axis from the rotation axis is ∼5 degrees of latitude. Using the wavelet transform method, it was found that the magnetic axis rotates around the rotation axis with a main period of 15–16 days. This period is related to the sector structure of the global magnetic field in the polar zones of the Sun.

1. Introduction

The global magnetic field of the Sun plays an important role in the existence of various structures in the solar atmosphere, such as sunspots, faculae, coronal holes and many others. The study of these structures provides insight into the physical processes that control their formation, development, and decay, the heating of the corona, and the cyclicity of solar activity.
Based on studies of the global magnetic field of the Sun conducted in the middle of the last century, Babcock [1] and Leighton [2] proposed the theory of the solar dynamo. In dynamo theory, the rotation of the Sun acts as an engine generating a global magnetic field, but the solar magnetic and rotation axes are considered to coincide. On the other hand, Cowling proposed the antidynamo theorem, which states that an axisymmetric magnetic field cannot be maintained via dynamo action [3,4]. In other words, no motion can maintain an axisymmetric magnetic field [5]. This meant that the measured small deviations from magnetic field axisymmetry could no longer be neglected, and, in fact, played an important role in large-scale magnetic field generation. It is clear that this theorem prohibits a solar dynamo for an axially symmetric global magnetic field, and the tilt angle of the magnetic dipole should be analyzed in detail.
Despite a large amount of publications concerning the solar dynamo, the tilted solar dipole has not been actively investigated. The tilted solar dipole was studied by Norton et al. [6] and Norton and Raouafi [7]. The authors obtained the changes in the position of the solar magnetic axis in the interval of ∼2°–7°.
The problem of a tilted solar magnetic axis was considered in more detail by Pastor Yabar et al. [8]. The authors found the monthly oscillations of the averaged polar magnetic field at latitudes of 70°–80° observed daily over five years starting from 2010. It has been suggested that this kind of oscillation is only possible if a non-asymmetric distribution of magnetic fields exists around the solar rotation axis.
Moreover, based on measuring the Faraday rotation of extragalactic radio sources during the eclipse, Mancuso and Garzelli [9] estimated the three-dimensional topology of the magnetic field in the outer solar corona. These authors found an inclination angle of about 3.3 degrees of the solar magnetic axis relative to the solar rotation axis.
A numerical model of a dipole magnetic configuration with a tilt was proposed by Borovikov et al. [10] in the context of a study of solar wind near the solar minimum.
The limited number of studies in this significant field can be attributed, in part, to the inherent difficulties associated with direct measurement of the polar magnetic field. Despite recent advancements in solar observation through various satellites and instruments, daily measurements of the polar magnetic field simultaneously in two solar hemispheres are still not available. In this case, empirical methods that will allow us to estimate the angle between the magnetic and rotation axes would be useful to refine the dynamo theory.
Coronal holes are unipolar structures in the solar corona with lower density and temperature, appearing dark when observed in the EUV and X-ray bands. The magnetic field inside coronal holes has an open configuration, which allows them to be a source of solar wind (see, for example, Cranmer [11]).
Low-latitude (equatorial) coronal holes, which appear near the solar equatorial zone, are usually observed only during a period of a few solar rotations or less. For example, Heinemann et al. [12] analyzed the equatorial coronal holes with a lifetime of 5–18 solar rotations. Despite this, low-latitude coronal holes have been well studied due to their visibility and the availability of some physical parameters and geometry in situ. Equatorial coronal holes are of significant scientific interest, as they are a source of fast and slow solar wind (Abramenko et al. [13], Hofmeister et al. [14], Jain et al. [15], Ervin et al. [16], Tokumaru and Fujiki [17]).
During periods of low solar activity, when the dipole component of the solar magnetic field is pronounced, large coronal holes form, covering the north and south poles. Such objects are called polar coronal holes (PCHs). PCHs are observed for about seven years during the solar minimum and tend to disappear for three to four years around the solar maximum (see Harvey and Recely [18], Riehokainen et al. [19]). Direct observations of PCHs are evidently complicated; however, their characteristics related to solar wind are also being studied, e.g., by Horbury et al. [20] and Telloni et al. [21], as well as their fine structure, e.g., Huang et al. [22] and Morton and Cunningham [23], and evolution, e.g., Stepanian and Shtertser [24] and Shrestha et al. [25].
It can be assumed that the centers of PCHs can be considered as the global solar magnetic dipole, at least in the interval between the maxima of solar activity cycles. This agrees with some theoretical models of PCHs. For example, Korolkova and Solov’ev [26] have proposed an analytical estimation of plasma parameters (pressure, density, and temperature) for the equilibrium axisymmetric (dipole) magnetic configuration, which represents PCHs with thermodynamic parameters close to the observed values. In turn, variations in the location of polar coronal hole centers creates the possibility of specifying the tilt angle between the magnetic and rotation axes of the Sun. In this case, an important addition to the solar dynamo theory can be made concerning the assumption of these axes coinciding.
The aim of this work is to propose a method for determining the axis tilt angle using variations in the daily latitudes of the visible parts of the polar coronal holes.

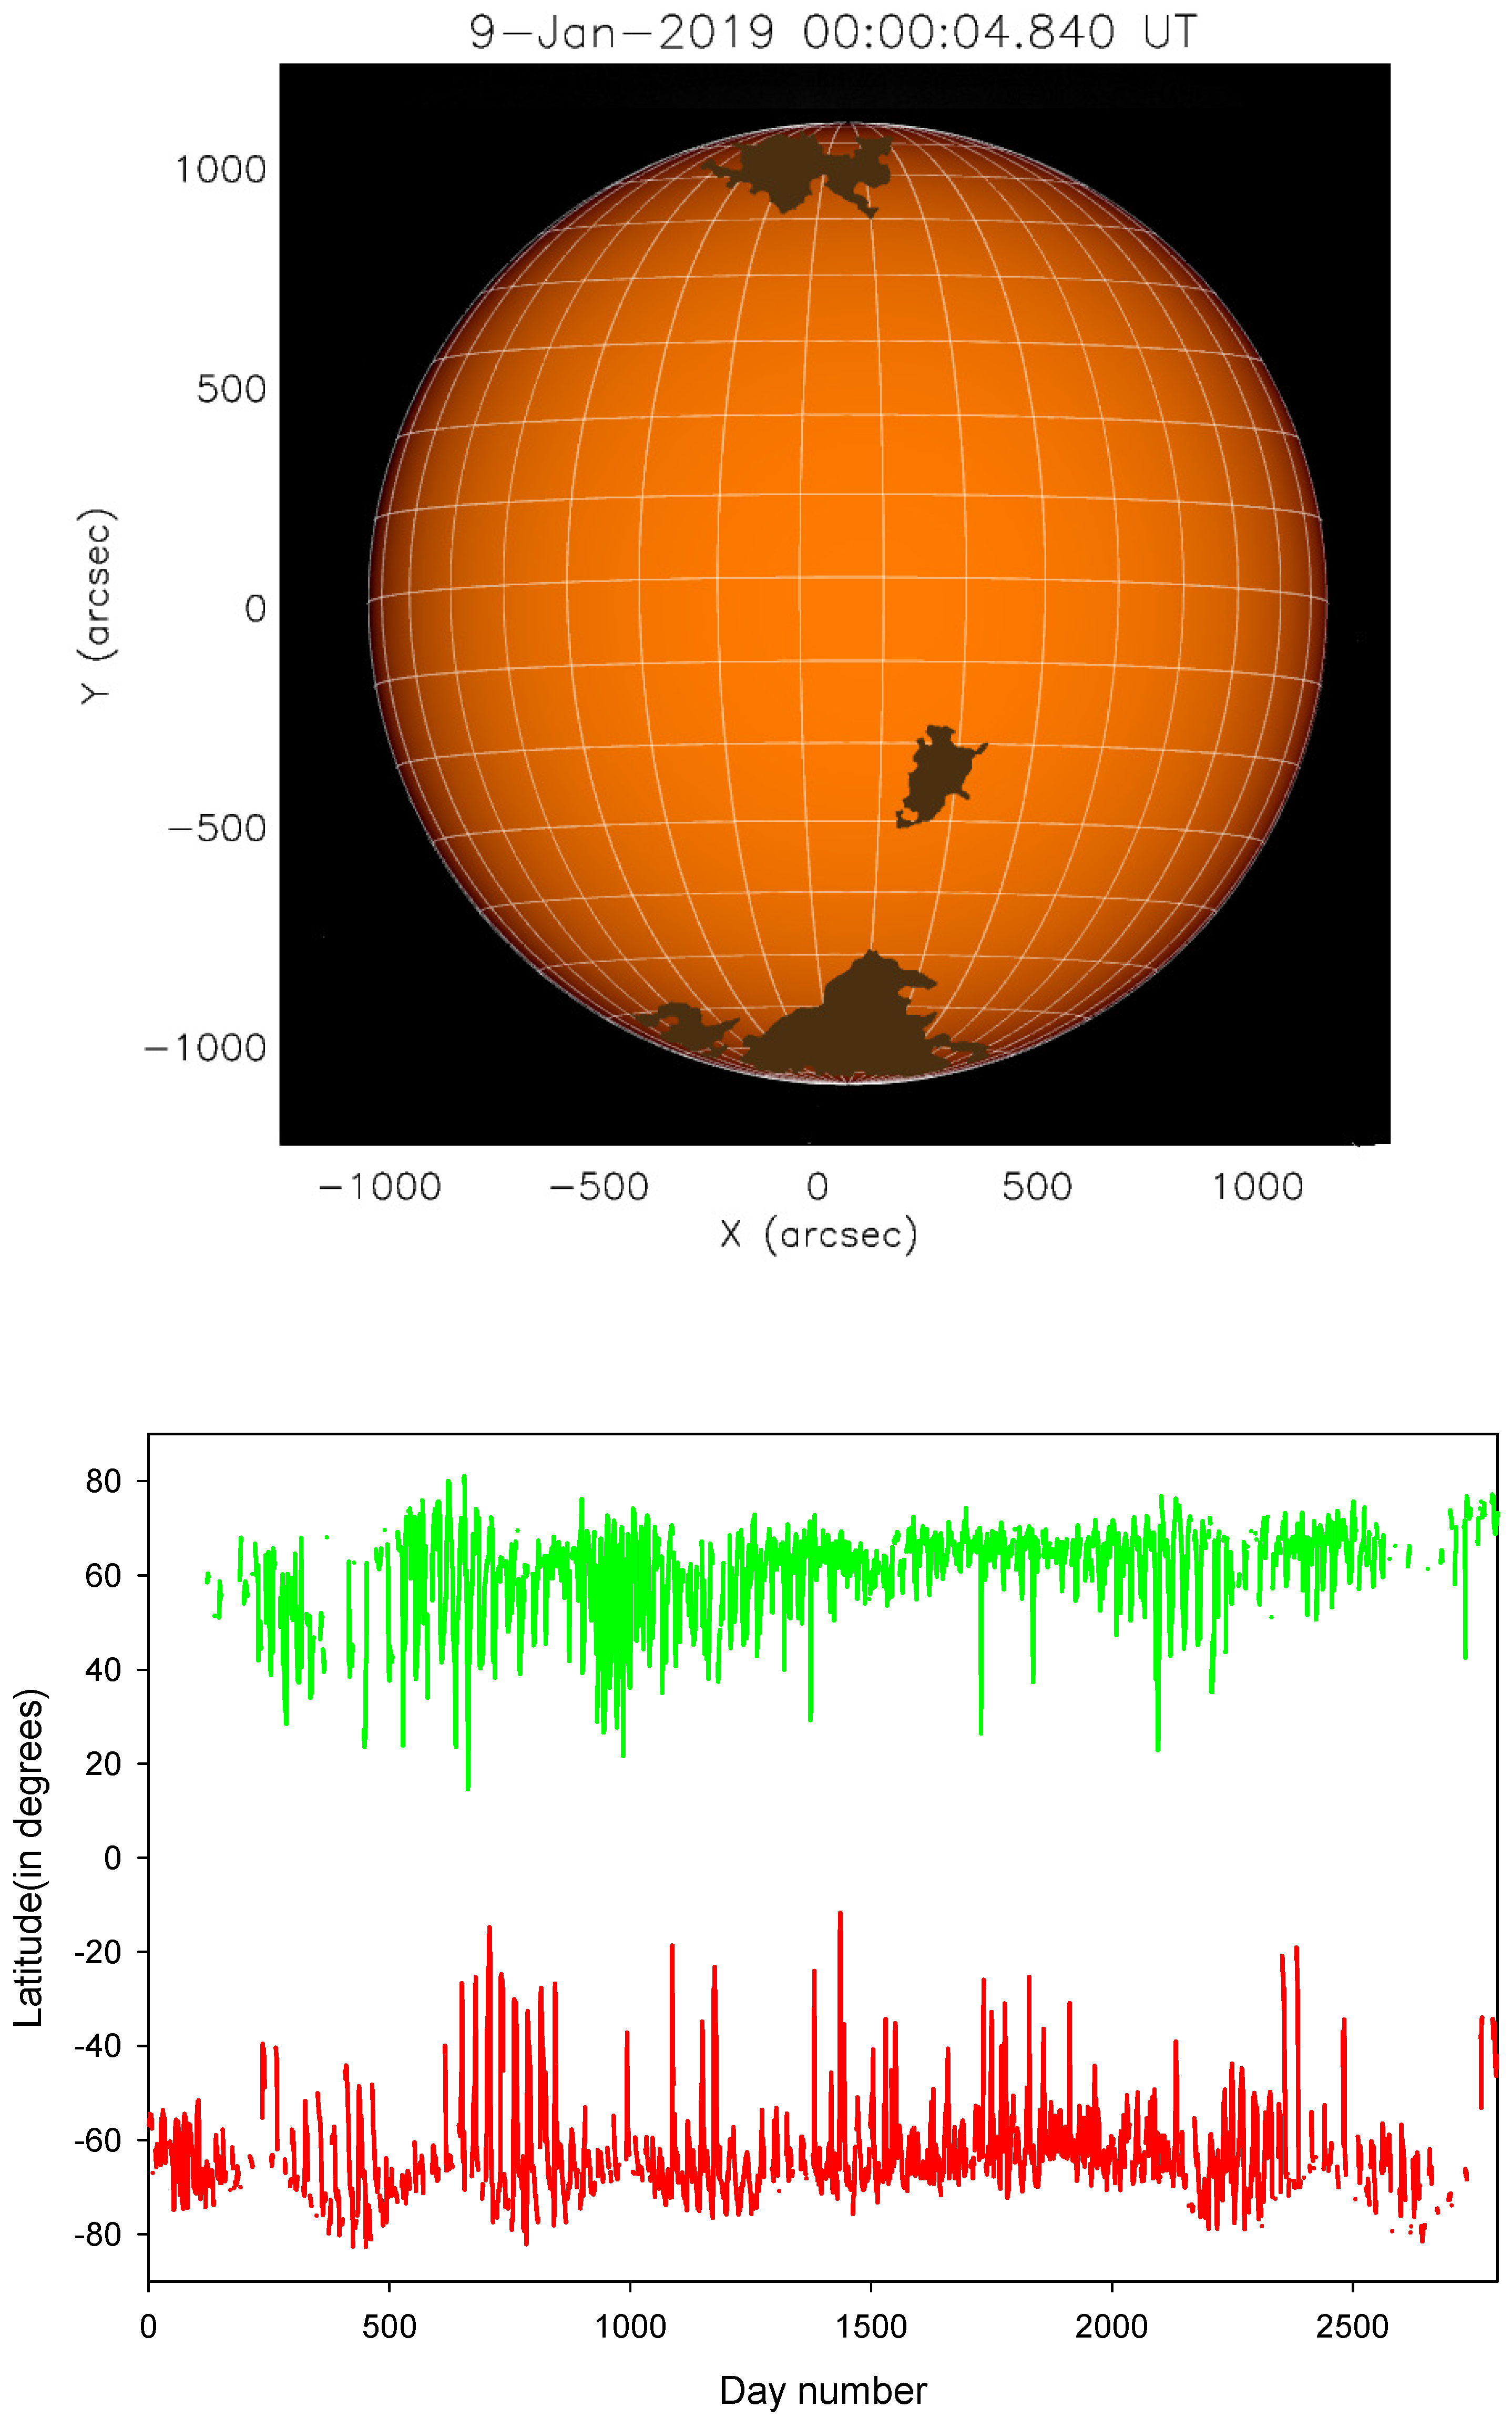
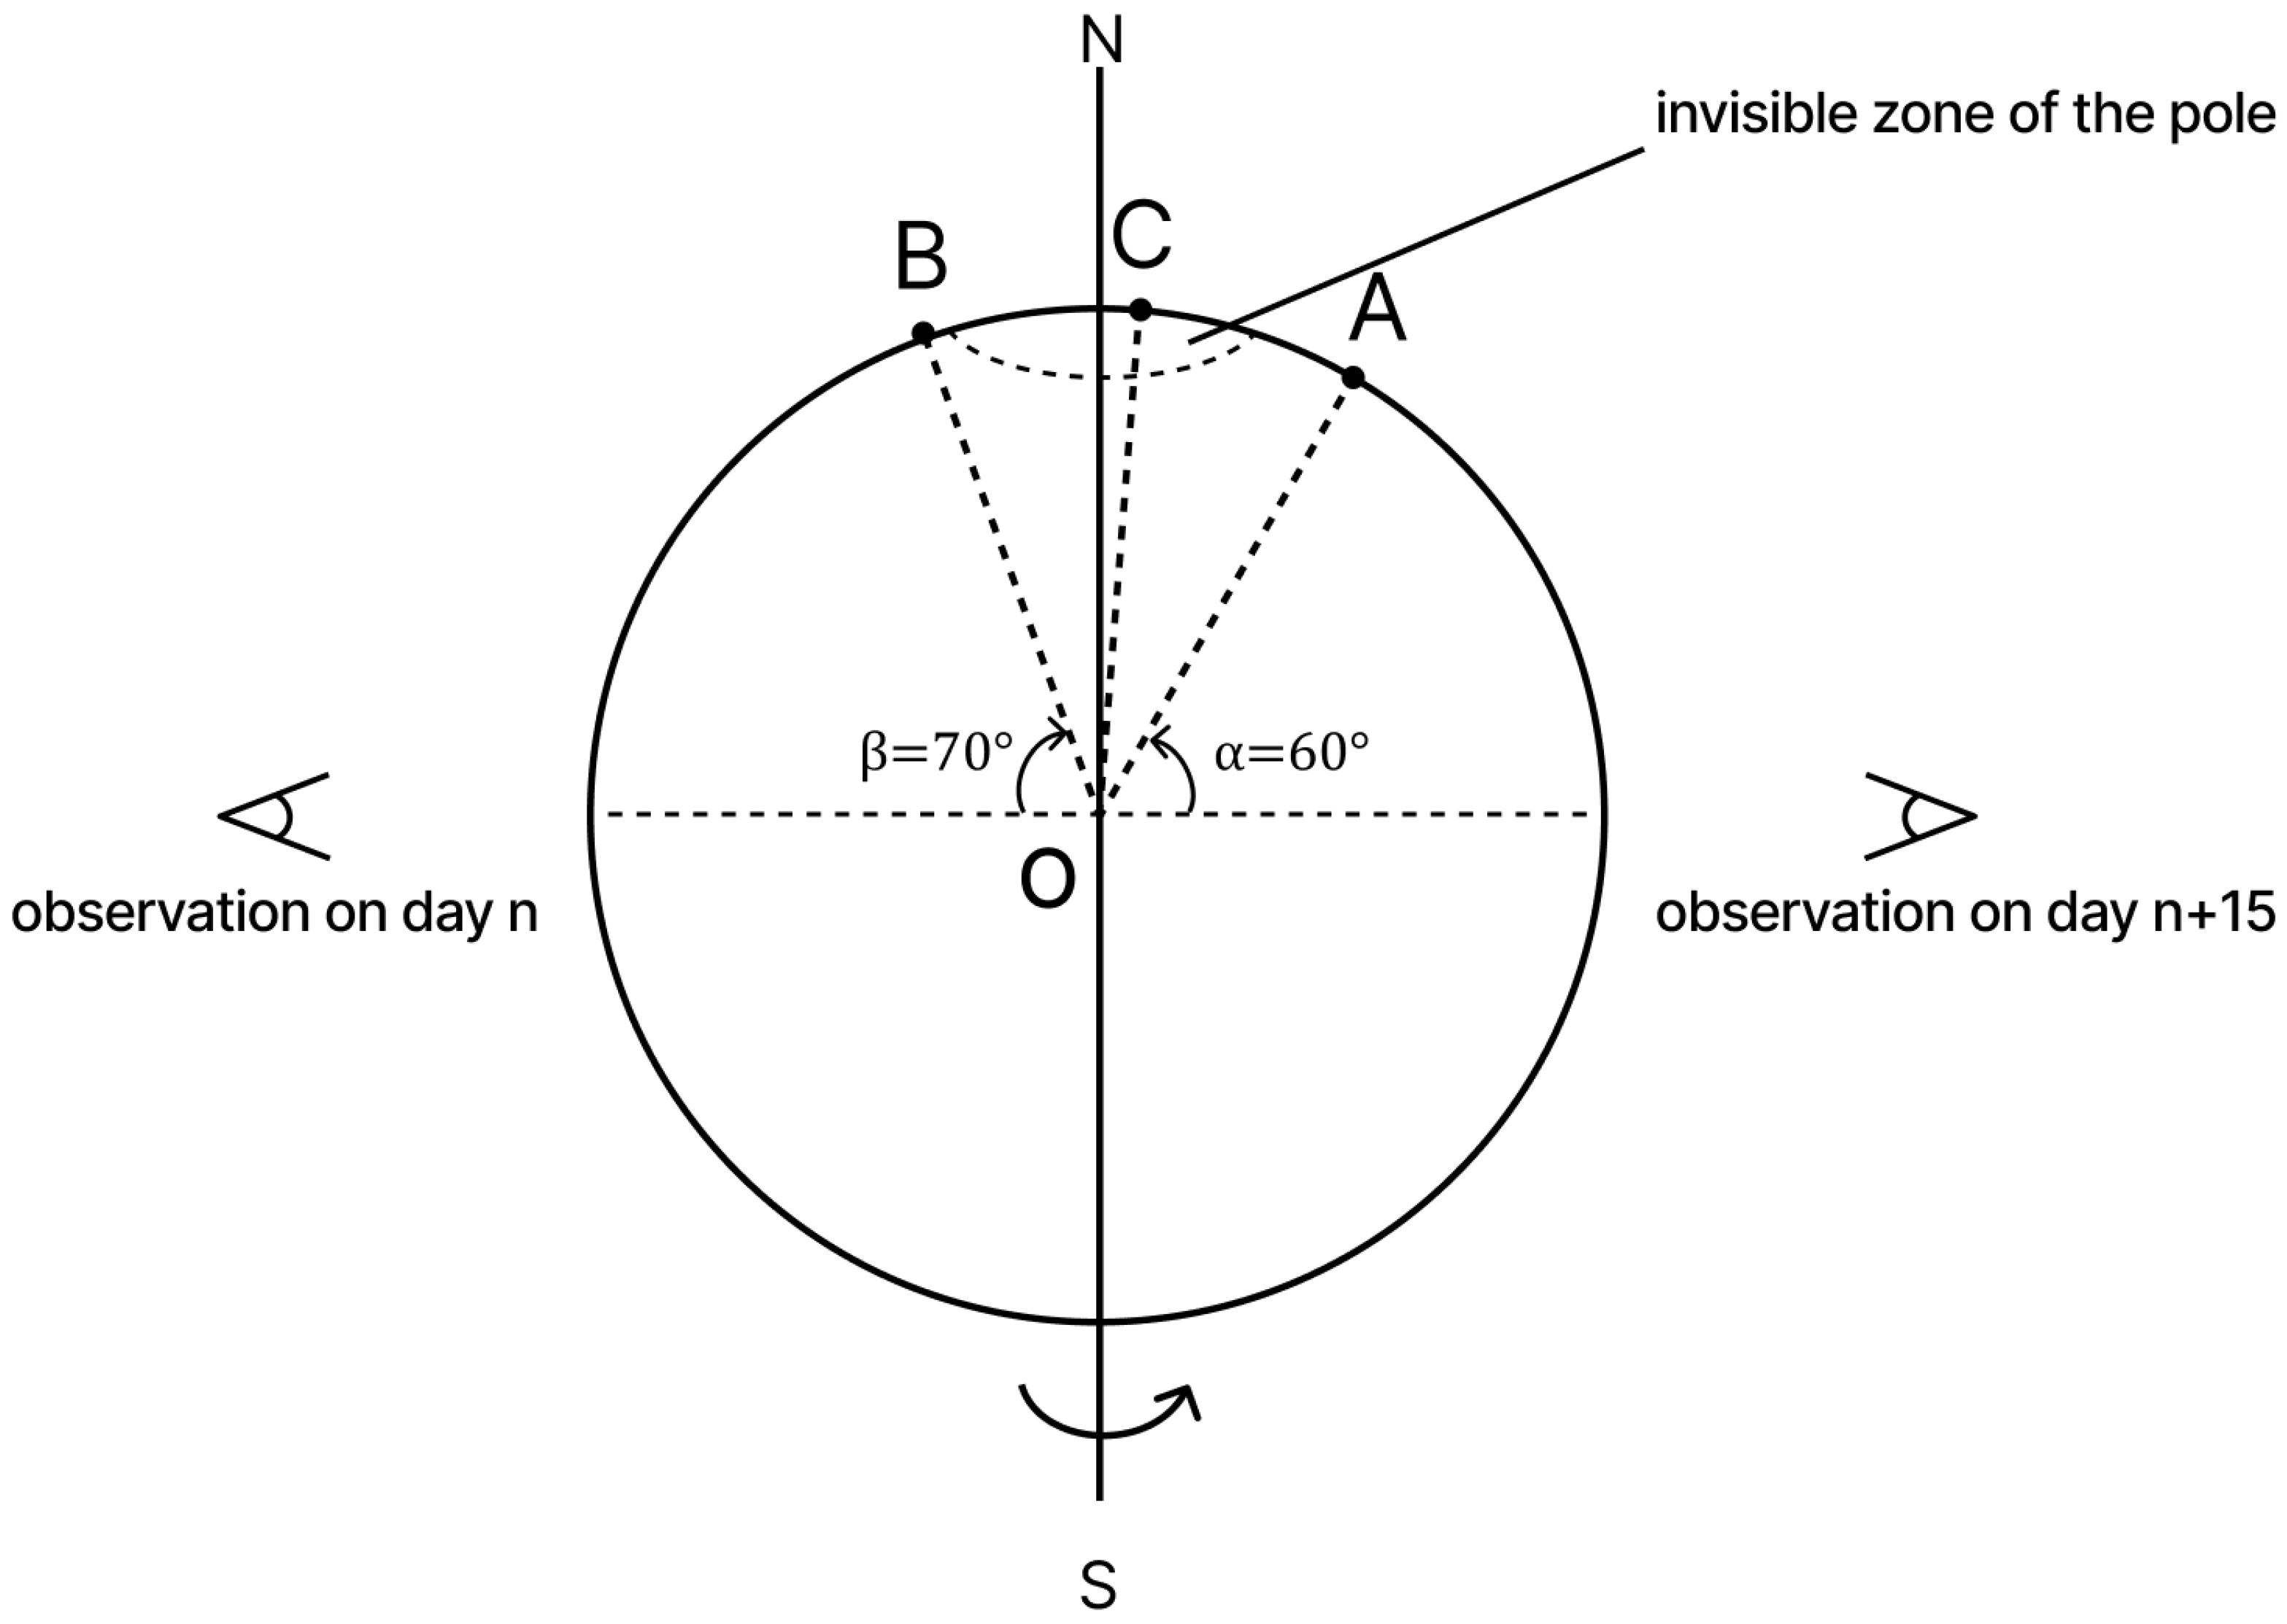
2. Methods and Observations

We used the average latitudes of PCHs to estimate their centers. Daily images of PCHs were obtained from the original observations produced by the Atmospheric Imaging Assembly instrument onboard the Solar Dynamics Observatory (AIA/SDO) at the 193 Å passband. The extraction of PCHs’ geometrical parameters (area, latitude, longitude, and size) was carried out with the region growth algorithm (RGA) proposed in [27]. The algorithm was improved in [28] for the identification of different solar structures. Data are available on the website www.observethesun.com, accessed on 1 January 2015. Figure 1 (top panel) shows one example of a solar image (taken from above mentioned website) with three coronal holes extracted by the RGA method—one equatorial and two polar.
It should be noted that, in our study, only visible parts of PCHs were considered, and only PCHs that are closely adjacent to polar zones were analyzed. Thus, the entire PCH represents a structure consisting of three different parts. The first part is the visible part of the PCH on some day (N). The second part is the visible part of the PCH, observed on day N + T / 2 . Here, T is the rotation period of the visible part of the PCH around the rotation axis. The third part is completely inaccessible for observations, and it is located in the invisible zone of the polar cap.
The averaged latitude of one PCH was calculated as follows: since we have the coordinates of each pixel inside the PCH’s visible area, the latitude of all pixels was obtained. Next, the latitude values of all pixels were added together, and the resulting value was divided by the number of pixels in the PCH. The accuracy of the obtained value depends mostly on the PCH extraction method, and it is ∼0.1 degrees. We applied this simple technique for PCHs observed over 2841 days, from 1 January 2015 to 10 November 2022. The specified time interval is between the maxima of the 24th and 25th solar cycles. As a result, two time series were produced, representing the averaged latitudes of north and south PCHs.
Figure 1 (bottom panel) shows variations in the daily average latitudes of the considered PCHs. The monthly changes in both hemispheres of the Sun are clearly seen. The figure also shows the changes in latitude that depend on the angle between the equatorial plane of the Sun and the ecliptic. However, these variations are of a well-known nature, and we did not analyze them in this study.
Figure 2 shows two wavelet power spectra of time series of average latitudes (see Figure 1, bottom panel), obtained using the method described in [29]. Here, one can see several periodic components with two well-pronounced intervals with periods of 15–16 and 30–32 days (left panel). The right panel shows global wavelet spectra (blue line) with these periods. The red dashed line shows a confidence level of 95%, calculated with the χ 2 method.
Figure 3 explains how the daily latitude of the center of the PCHs can be calculated using only the mean latitudes of the visible parts of the entire PCH. Here, point O is the center of the Sun, the line SON is the solar rotation axis, and B is the position of the average latitude of the visible part of the PCH on a certain observational day (n). Point A is the position of the average latitude of the visible part of the coronal hole exactly after half of the rotation period (or on day n + 15 ). Positions A and B correspond to the latitudes determined by the angle β = 70° and α = 60°. The average latitude of the entire PCH, denoted by the letter C, can be calculated by dividing by the angle BOA . Next, we provide simple formulas for calculating the average latitude of an entire polar coronal hole.
BOA = ( 90 ° β ) + ( 90 ° α ) = 20 ° + 30 ° = 50 °
BOC = COA = ( BOA ) / 2 = 50 ° / 2 = 25 °
The latitude of point C is determined as
β + 25 ° = 70 ° + 25 ° = 95 ° > 90 °
α + 25 ° = 60 ° + 25 ° = 85 ° < 90 °
Therefore, point C has a latitude value equal to 85°, since, in our case, the latitude should not have a value greater than 90°.
Thus, to calculate the average latitudes of PCHs for the observed period, we need to have two time series composed of the latitudes of the visible parts of the PCHs. The first time series is composed of daily values of the average latitudes. The second time series is composed of the elements of the first series but shifted by half of the rotation period (15 days) forward. Thus, these two time series are aligned. The first element of the first time series corresponds to the 15th element of the first time series. The Nth element of the first series corresponds to the ( N + 15 ) th element of the second time series. These time series are presented in Figure 4.
Figure 5 shows the results obtained for the periodicity of rotation of the latitude centers of polar coronal holes around the axis of rotation of the Sun. Here, one can see very clearly the main period of this rotation, which is ∼15–16 days. There is also a period of about 8 days, which is weak in comparison to the main period but still slightly above the 95% confidence level. In addition, we used two different scales in this figure. For the North Pole, the time scale is expressed through the ordinal number of days, and, for the south pole, it is expressed through the calendar date. Here, 17/09/27 means year/month/day.
Figure 6 shows the daily changes in the latitude of the calculated centers of PCHs as they make a complete revolution around the axis of solar rotation. This chart is designed as a radar plot. The numbers located on the outer circle of the graph indicate the ordinal numbers of days since the first day of observation, 1 January 2015, used in this study. The numbers located on the horizontal radius intersecting the concentric circles are the latitude values. In this figure, the southern polar coronal hole is marked by red and the northern is marked by green. As can be seen from Figure 6, the trajectory of latitude change during a full rotation is not smooth. This trajectory describes a certain sector structure. The sector structure has a spatial scale in one direction (solar longitude) compatible with the size of the entire Sun. It cannot be directly related to local magnetic structures. The sector structure is usually associated with active longitudes on the Sun and the sector structure of the interplanetary magnetic field. That is, they reflect the global structure of the solar magnetic field. This sector structure rotates around the axis of rotation of the Sun with a main period of 15–16 days. This figure also shows that the sector structure can be more complex and additional periods can appear in the spectrum, as shown in Figure 5.

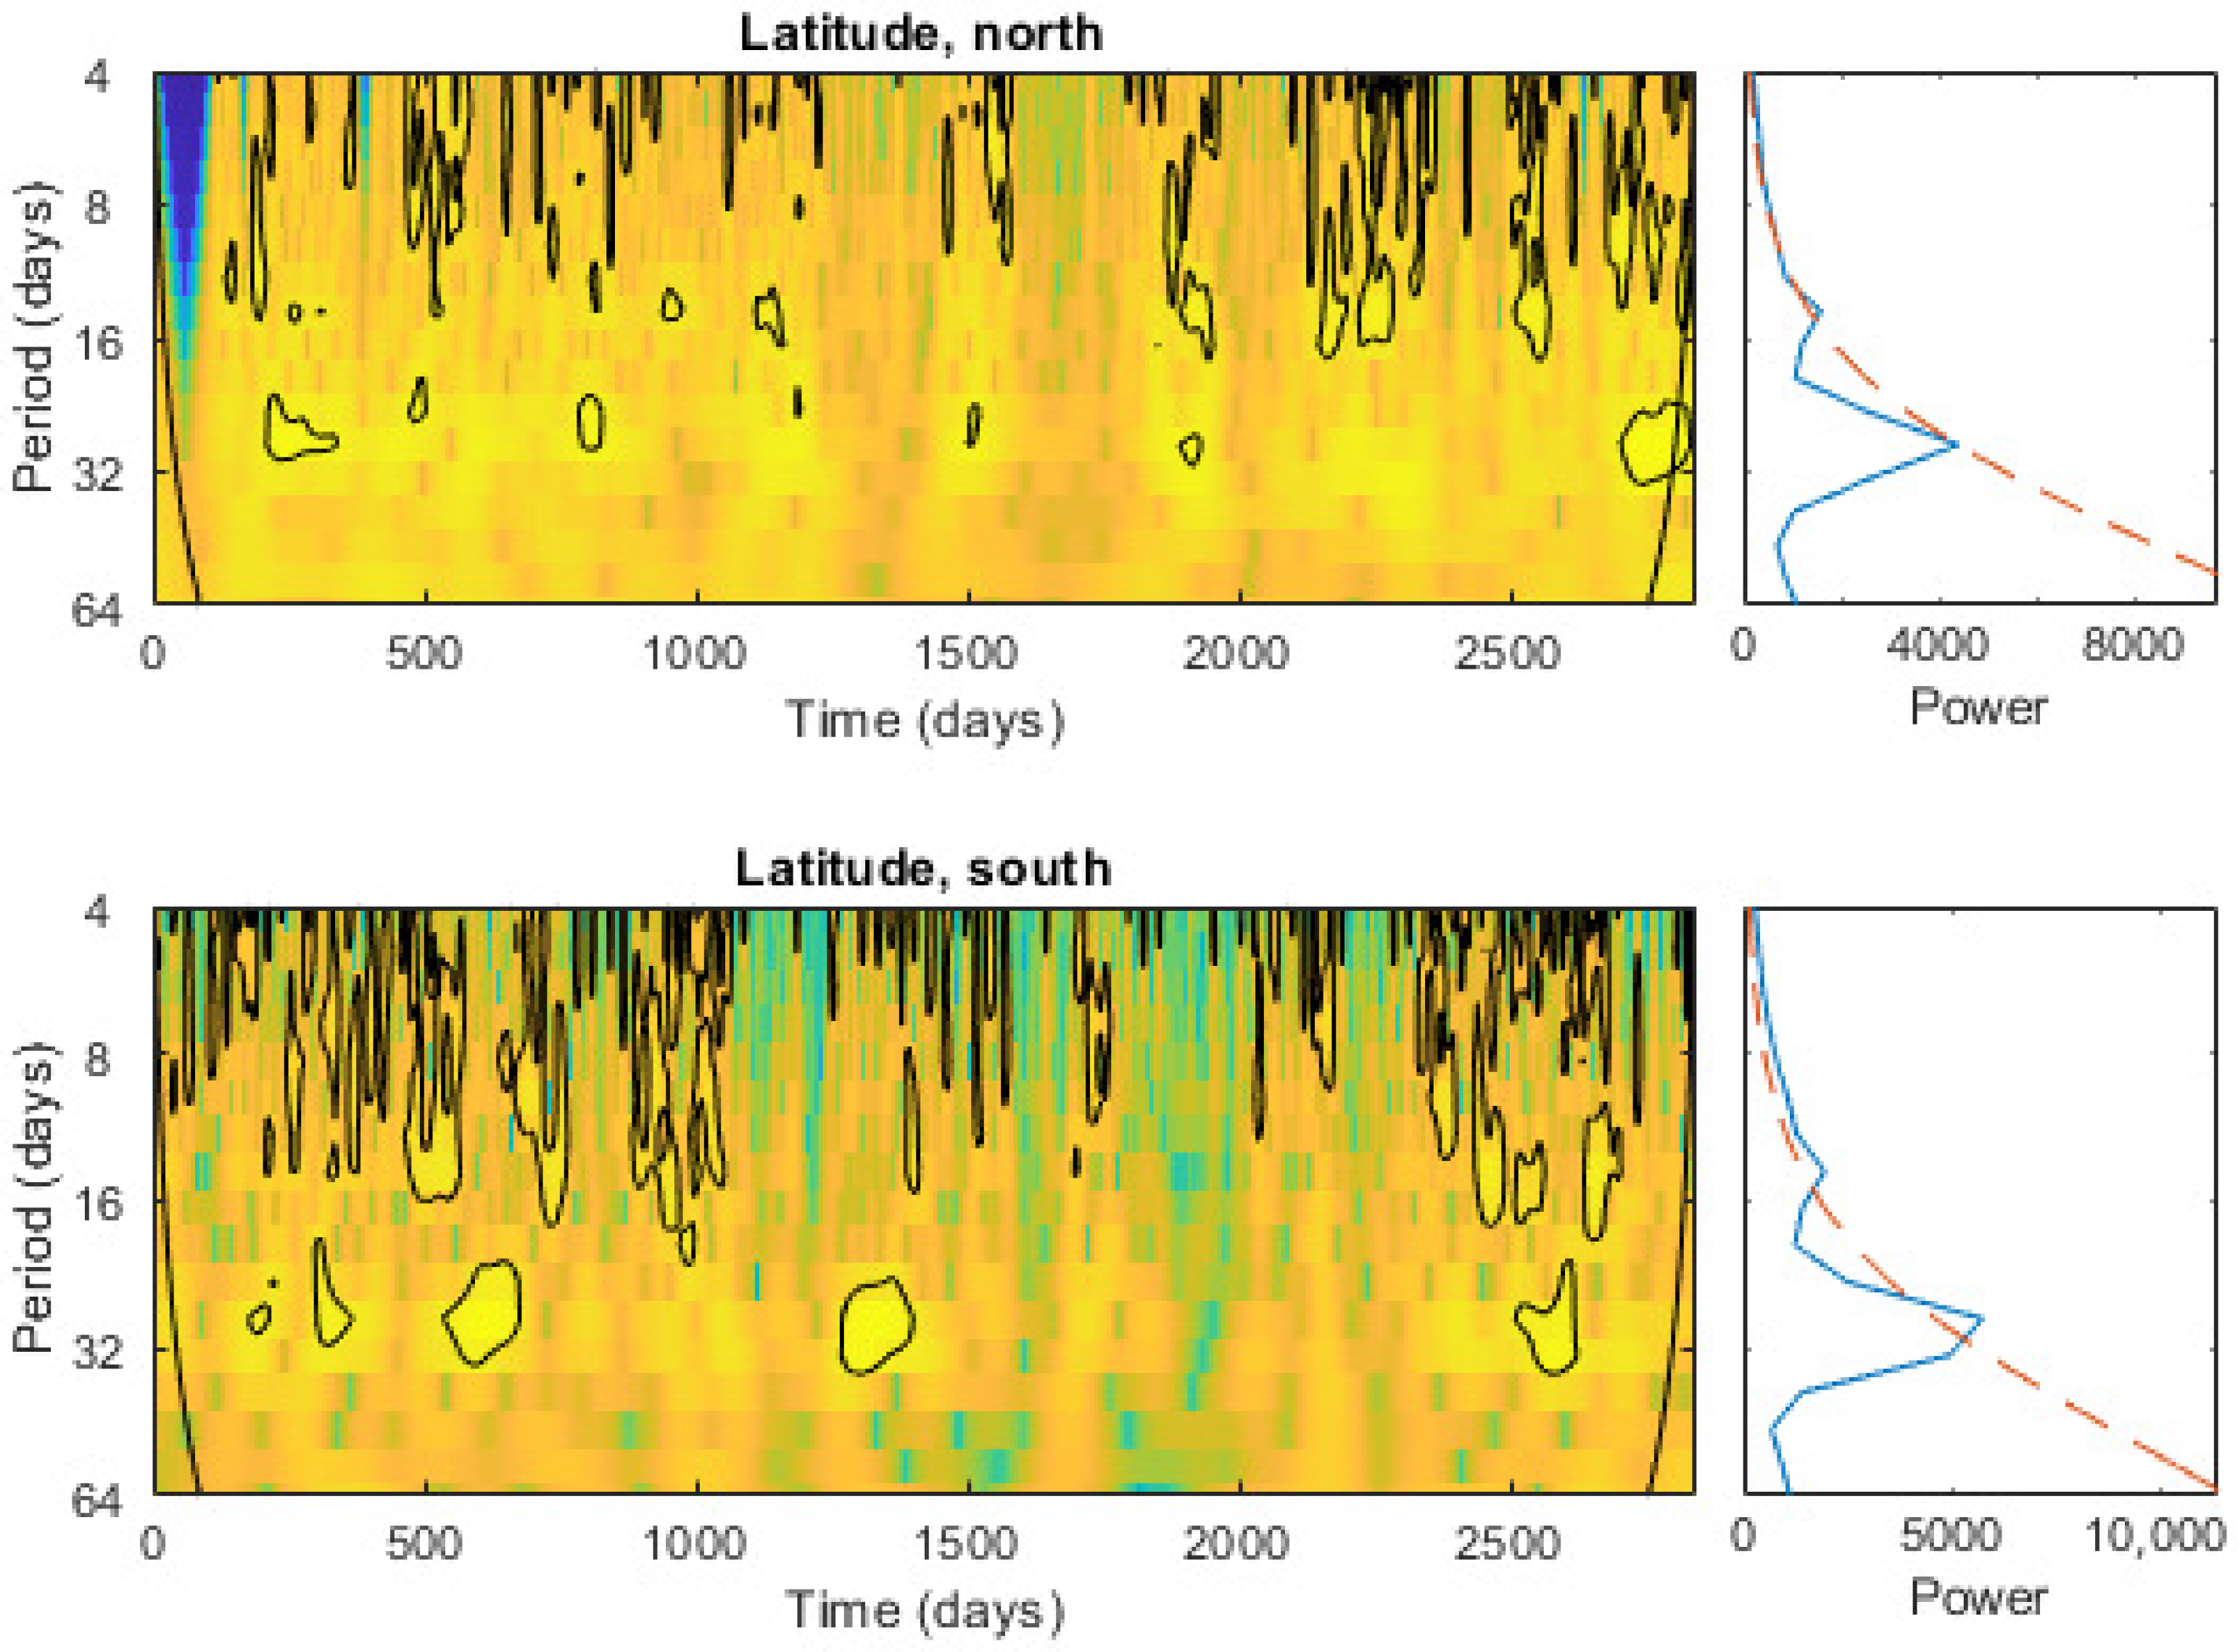
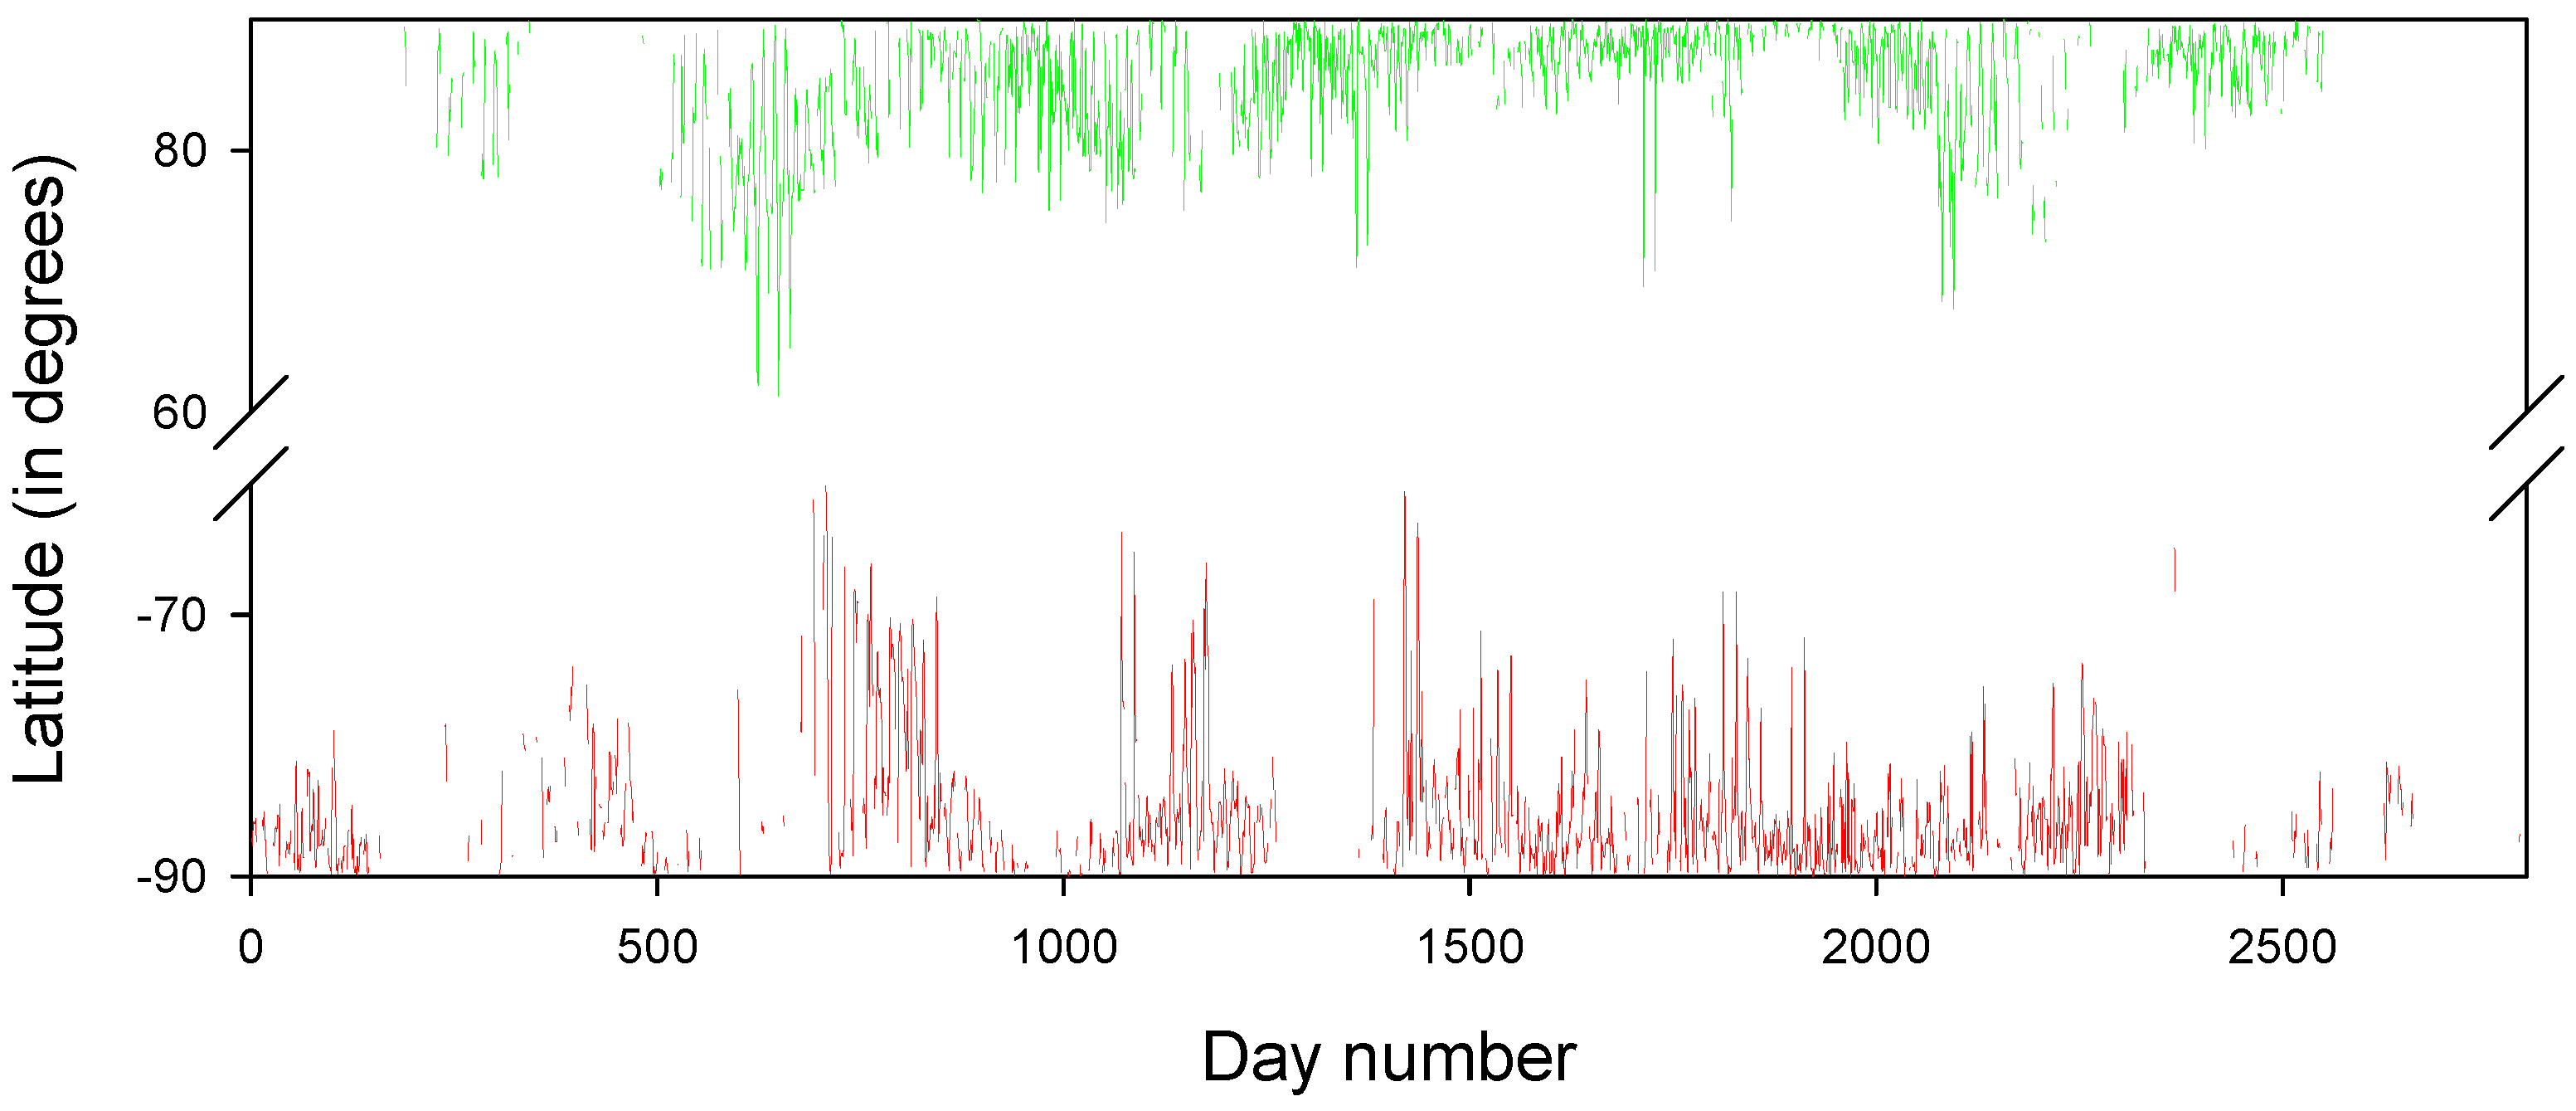
3. Results and Conclusions

Table 1 presents the main results obtained during this study.
The first row in the table contains the statistical results for the calculated latitude of the center of the south PCHs. The second row contains the results for the latitude of the north PCHs’ center. The mean and median latitude of the centers of the PCHs in both polar zones have values of about ±85 degrees. This means that the average deviation of the centers of the PCHs relative to the rotation axis is about 5 degrees.
PCHs are a product of the polar magnetic field. For this reason, they have some specific characteristics, such as a sector structure. The results presented in Figure 6 for both polar caps clearly show that the magnetic field axis does not coincide with the position of the solar rotation axis. Moreover, the trajectory of the calculated latitude of the PCH center around the solar rotation axis reflects the sector structure of the large-scale magnetic field, as described by Obridko and Shelting [30] and Vasil’Eva et al. [31]. A two-sector structure produces a rotation period of 1/2 of the solar rotation period, as well as a four-sector structure with −1/4. In Figure 6, we are dealing with a four-sector structure that is clearly visible in the southern polar zone.
Quasi-periodic variations in the sector structure of the interplanetary magnetic field (IMF) have been studied previously using power spectrum analysis by Du et al. [32]. The two-sector IMF structure dominates during the solar maximum, and the four-sector structure dominates during the solar minimum. To explain this phenomenon, the authors suggested that the IMF sector structure configuration depends on the inclination angle between the magnetic and rotation axes of the Sun.
Additionally, in work by Riehokainen et al. [19], the sector structure was used to explain variations obtained for the maximum areas and longitudinal widths of solar coronal holes.
The results presented in Figure 5 show that the main period of polar coronal hole rotation around the solar rotation axis is 15–16 days in both polar zones. We suggest that the 8-day period also indicates a sector structure of the polar magnetic field, but the amplitude of this period is smaller.
Note that the results obtained in our study for Carrington rotations 2158–2262 are in good agreement with the results obtained for Carrington rotations 1911–1919, which were published by Norton et al. [6]. In this study, the authors reported observed tilt angles for the solar dipole in the range of 1–10 degrees, with an average tilt of 4–6 degrees.
Taking into account the results obtained in our study, we concluded that the magnetic axis does not coincide with the axis of solar rotation. The magnetic axis rotates around the solar rotation axis with a main period of 15–16 days. The rotation is not circular but rather describes the sector structure of the solar global magnetic field at the poles. The small deviation of 5 ± 0.1 degrees between the axis of the solar magnetic dipole and the rotation axis eliminates the main problem in the solar dynamo associated with axisymmetricity (Cowling’s Theorem).

Author Contributions

Conceptualization, A.R. and A.S.; methodology, A.R., V.S. and A.S.; software, A.R., V.S. and P.S.; formal analysis, A.R., V.S. and P.S.; investigation, A.R.; writing—original draft preparation, A.R. and V.S. All authors have read and agreed to the published version of the manuscript.

Funding

This research received no external funding.

Data Availability Statement

No new data were created or analysed in our study.

Acknowledgments

This study was conducted using data provided by the NASA/SDO team. We also thank the team at www.observethesun.com (accessed on 27 October 2024) for pre-processing the coronal hole data.

Conflicts of Interest

The authors declare no conflicts of interest.

References

  1. Babcock, H.W. The Topology of the Sun’s Magnetic Field and the 22-Year Cycle. Astrophys. J. 1961, 133, 572. [Google Scholar] [CrossRef]
  2. Leighton, R.B. A Magneto-Kinematic Model of the Solar Cycle. Astrophys. J. 1969, 156, 1. [Google Scholar] [CrossRef]
  3. Cowling, T.G. The Magnetic Field of Sunspots. Mon. Not. R. Astron. Soc. 1933, 94, 39–48. [Google Scholar] [CrossRef]
  4. James, R.W.; Winch, D.E.; Roberts, P.H. The Cowling anti-dynamo theorem. Geophys. Astrophys. Fluid Dyn. 1980, 15, 149–160. [Google Scholar] [CrossRef]
  5. Jones, C.A. Course 2 Dynamo theory. In Dynamos; Cardin, P., Cugliandolo, L., Eds.; Elsevier: Amsterdam, The Netherlands, 2008; Volume 88, pp. 45–135. [Google Scholar] [CrossRef]
  6. Norton, A.A.; Raouafi, N.E.; Petrie, G.J.D. The Tilted Solar Dipole as Observed and Modeled during the 1996 Solar Minimum. Astrophys. J. 2008, 682, 1306–1314. [Google Scholar] [CrossRef]
  7. Norton, A.A.; Raouafi, N.E. The Tilted Solar Dipole: Coronal Streamer and Polar Cap Geometry Observed Near Solar Minimum. In Proceedings of the Subsurface and Atmospheric Influences on Solar Activity; Howe, R., Komm, R.W., Balasubramaniam, K.S., Petrie, G.J.D., Eds.; Astronomical Society of the Pacific Conference Series: San Francisco, CA, USA, 2008; Volume 383, p. 405. [Google Scholar]
  8. Pastor Yabar, A.; Martinez Gonzalez, M.J.; Collados, M. Where are the solar magnetic poles? Mon. Not. R. Astron. Soc. Lett. 2015, 453, L69–L72. [Google Scholar] [CrossRef]
  9. Mancuso, S.; Garzelli, M.V. Assessing the tilt of the solar magnetic field axis through Faraday rotation observations. Astron. Astrophys. 2007, 466, L5–L8. [Google Scholar] [CrossRef]
  10. Borovikov, S.N.; Pogorelov, N.V.; Ebert, R.W. Solar Rotation Effects on the Heliosheath Flow near Solar Minima. Astrophys. J. 2012, 750, 42. [Google Scholar] [CrossRef]
  11. Cranmer, S.R. Coronal Holes. Living Rev. Sol. Phys. 2009, 6, 3. [Google Scholar] [CrossRef]
  12. Heinemann, S.G.; Jerčić, V.; Temmer, M.; Hofmeister, S.J.; Dumbović, M.; Vennerstrom, S.; Verbanac, G.; Veronig, A.M. A statistical study of the long-term evolution of coronal hole properties as observed by SDO. Astron. Astrophys. 2020, 638, A68. [Google Scholar] [CrossRef]
  13. Abramenko, V.; Yurchyshyn, V.; Watanabe, H. Parameters of the Magnetic Flux inside Coronal Holes. Sol. Phys. 2009, 260, 43–57. [Google Scholar] [CrossRef]
  14. Hofmeister, S.J.; Veronig, A.M.; Poedts, S.; Samara, E.; Magdalenic, J. On the Dependency between the Peak Velocity of High-speed Solar Wind Streams near Earth and the Area of Their Solar Source Coronal Holes. Astrophys. J. 2020, 897, L17. [Google Scholar] [CrossRef]
  15. Jain, R.N.; Choudhary, R.K.; Ambili, K.M.; Roopa, M.V.; Dai, B.K. Impact of the high-speed solar wind stream over the low-latitude ionospheric system - a study combining Indian MOM and InSWIM observations. Mon. Not. R. Astron. Soc. Lett. 2024, 534, 117–127. [Google Scholar] [CrossRef]
  16. Ervin, T.; Jaffarove, K.; Badman, S.T.; Huang, J.; Rivera, Y.J.; Bale, S.D. Characteristics and Source Regions of Slow Alfvénic Solar Wind Observed by Parker Solar Probe. Astrophys. J. 2024, 975, 156. [Google Scholar] [CrossRef]
  17. Tokumaru, M.; Fujiki, K. Coronal Magnetic-Field Configuration Associated with Pseudostreamer and Slow Solar Wind. Sol. Phys. 2024, 299, 160. [Google Scholar] [CrossRef]
  18. Harvey, K.L.; Recely, F. Polar Coronal Holes During Cycles 22 and 23. Sol. Phys. 2002, 211, 31–52. [Google Scholar] [CrossRef]
  19. Riehokainen, A.; Smirnova, V.; Solov’ev, A.; Tlatov, A.; Zhivanovich, I.; Al-Hamadani, F.; Strekalova, P. Variations in Daily Maximum Areas and Longitudinal Widths of Solar Coronal Holes in 2017–2020. Universe 2022, 8, 158. [Google Scholar] [CrossRef]
  20. Horbury, T.S.; Laker, R.; Rodriguez, L.; Steinvall, K.; Maksimovic, M.; Livi, S.; Berghmans, D.; Auchere, F.; Zhukov, A.N.; Khotyaintsev, Y.V.; et al. Signatures of coronal hole substructure in the solar wind: Combined Solar Orbiter remote sensing and in situ measurements. arXiv 2021, arXiv:2104.14960. [Google Scholar] [CrossRef]
  21. Telloni, D.; Antonucci, E.; Adhikari, L.; Zank, G.P.; Giordano, S.; Vai, M.; Zhao, L.L.; Andretta, V.; Burtovoi, A.; Capuano, G.E.; et al. First polar observations of the fast solar wind with the Metis—Solar Orbiter coronagraph: Role of 2D turbulence energy dissipation in the wind acceleration. Astron. Astrophys. 2023, 670, L18. [Google Scholar] [CrossRef]
  22. Huang, Z.; Zhang, Q.; Xia, L.; Feng, L.; Fu, H.; Liu, W.; Sun, M.; Qi, Y.; Liu, D.; Zhang, Q.; et al. Population of Bright Plume Threads in Solar Polar Coronal Holes. Sol. Phys. 2021, 296, 22. [Google Scholar] [CrossRef]
  23. Morton, R.J.; Cunningham, R. The Fine-scale Structure of Polar Coronal Holes. Astrophys. J. 2023, 954, 90. [Google Scholar] [CrossRef]
  24. Stepanian, N.N.; Shtertser, N.I. Polar coronal holes in the solar activity cycle. Adv. Space Res. 2015, 55, 795–797. [Google Scholar] [CrossRef]
  25. Shrestha, B.L.; Zirnstein, E.J.; McComas, D.J. Tracking the Rapid Opening and Closing of Polar Coronal Holes through IBEX ENA Observations. Astrophys. J. 2023, 943, 34. [Google Scholar] [CrossRef]
  26. Korolkova, O.A.; Solov’ev, A.A. Large-Scale Magnetostatic Structures in the Solar Corona and a Model of the Polar Coronal Hole. Geomagn. Aeron. 2018, 58, 953–958. [Google Scholar] [CrossRef]
  27. Wang, Q.; Song, X.; Jiang, Z. An Improved Image Segmentation Method Using Three-dimensional Region Growing Algorithm. In Proceedings of the 2013 International Conference on Information Science and Computer Applications, Changsha, China, 8–9 November 2013; Atlantis Press: Dordrecht, The Netherlands, 2013; pp. 148–152. [Google Scholar] [CrossRef]
  28. Tlatov, A.G.; Vasil’eva, V.V.; Makarova, V.V.; Otkidychev, P.A. Applying an Automatic Image-Processing Method to Synoptic Observations. Sol. Phys. 2014, 289, 1403–1412. [Google Scholar] [CrossRef]
  29. Torrence, C.; Compo, G.P. A practical guide to wavelet analysis. Am. Meteorol. Soc. 1998, 79, 61–78. [Google Scholar] [CrossRef]
  30. Obridko, V.N.; Shelting, B.D. Structure of the Heliospheric Current Sheet derived for the interval 1915–1916. Sol. Phys. 1999, 184, 187–200. [Google Scholar] [CrossRef]
  31. Vasil’Eva, V.V.; Makarov, V.I.; Tlatov, A.G. Rotation Cycles of the Sector Structure of the Solar Magnetic Field and Its Activity. Astron. Lett. 2002, 28, 199–205. [Google Scholar] [CrossRef]
  32. Du, A.M.; Xu, W.Y.; Feng, X.S. Dependence of the IMF sector structure on the solar dipole tilt angle. J. Geophys. Res. Space Phys. 2008, 113. [Google Scholar] [CrossRef]
Figure 1. Top panel represents the example of the solar map with coronal holes observed on 9 January 2019. Polygons mark the result of the segmentation with the RGA method. Bottom panel: time series of the average latitudes for the visible parts of the polar coronal holes. North and south polar caps are marked by green and red lines, respectively.
Galaxies 13 00024 g001
Figure 2. Wavelet power spectra for the average latitudes of the visible part of the northern (upper panel) and southern (bottom panel) PCHs.
Galaxies 13 00024 g002
Figure 3. Schema represent the method of calculation of coronal hole centers.
Galaxies 13 00024 g003
Figure 4. Time series of calculated latitudes for the centers of entire polar coronal holes. The northern polar cap of the Sun is marked by green and the southern polar cap is marked by red.
Galaxies 13 00024 g004
Figure 5. Wavelet spectra for two time series contain latitudes of the polar coronal hole centers. Main periods are presented in the right panels. A confidence level of 95% is marked by the dashed red line.
Galaxies 13 00024 g005
Figure 6. Trajectories of the calculated latitudes of the centers of polar coronal holes around the axis of rotation of the Sun for one complete revolution.
Galaxies 13 00024 g006
Table 1. Statistical parameters of the determined PCH center.
MeanMedianStd.DevStd.Err95% Conf
−85.009−86.555.0750.13040.256
85.51386.954.2710.10740.211
Disclaimer/Publisher’s Note: The statements, opinions and data contained in all publications are solely those of the individual author(s) and contributor(s) and not of MDPI and/or the editor(s). MDPI and/or the editor(s) disclaim responsibility for any injury to people or property resulting from any ideas, methods, instructions or products referred to in the content.

