Article

IRAS 17449+2320: A Possible Binary System with the B[e] Phenomenon and a Strong Magnetic Field

1
Instituto de Astronomía, Universidad Nacional Autónoma de México, AP 106, Ensenada 22800, BC, Mexico
2
Department of Physics and Astronomy, University of North Carolina, Greensboro, NC 27402, USA
3
Fesenkov Astrophysical Institute, Observatory 23, Almaty 050023, Kazakhstan
4
Canada-France-Hawaii Telescope Corporation, 65-1238 Mamalahoa Hwy, Kamuela, HI 96743, USA
5
Indian Centre for Space Physics, 466 Barakhola, Netai Nagar, Kolkata 700099, West Bengal, India
6
Uttar Pradesh State Institute of Forensic Science (UPSIFS), Aurawan, P.O. Banthra, Lucknow 226401, Uttar Pradesh, India
7
NASA Ames Research Center, Moffett Field, CA 94035, USA
8
Daglen Observatory, Mayhill, NM 88339, USA
*
Author to whom correspondence should be addressed.
Galaxies 2025, 13(2), 32; https://doi.org/10.3390/galaxies13020032
Submission received: 26 February 2025 / Revised: 26 March 2025 / Accepted: 28 March 2025 / Published: 31 March 2025
(This article belongs to the Special Issue Circumstellar Matter in Hot Star Systems)

Abstract

:
We report the recent results of a long-term spectroscopic and photometric monitoring of IRAS 17449+2320, a member of the least studied group of objects with the B[e] phenomenon called FS CMa-type objects. The main hypothesis for explaining the strong emission-line spectra and infrared excesses of these objects assumes an ongoing or past mass transfer between the components in binary systems. The object is the only star with a gaseous and dusty envelope, where a strong and variable magnetic field (5.5–7.2 kG) was found through the splitting of some spectral lines. Additionally, we discovered the regular appearance of a red-shifted absorption component in spectral lines of neutral hydrogen, helium, and oxygen as well as one of ionized silicon with a period of 36.13 ± 0.20 days. We show that the magnetic field strength also followed this period. The process was accompanied by increasing emission component strengths for the hydrogen lines as well as the helium and metallic absorption lines. We refined the fundamental parameters of the optical counterpart of IRAS 17449+2320 ( T eff = 9800 ± 300 K, log L/ L = 1.86 ± 0.06 , v sin i = 9 ± 2 km s−1) and concluded that the star was slightly metal-deficient and viewed nearly pole-on. No signs of a secondary component were found. Possible interpretations of the observed phenomena are suggested, and some earlier findings about the object’s nature are revised.

1. Introduction

The object of this study, IRAS 17449+2320 (BD+23°3183, 2MASS J17470327+2319454, V 9.9 mag) was discovered as a H α emission star by Stephenson [1]. Downes and Keyes [2] classified it as a Be star. The detection of a strong IR excess and [O i] emission lines prompted the authors of [3] to classify it as an object with the B[e] phenomenon. Spectral lines of He i, Fe ii, Mg ii, and other metals appear in pure absorption and suggest a spectral type of B9/A0 [3,4]. In a statistical study of B-type emission-line stars, Boubert and Evans [5] found that the object might be a runaway star based on an excessive radial velocity (RV) for its Gaia DR1 distance and location in the galaxy (galactic latitude b = 24 ° ).
Mohorian et al. [6] included IRAS 17449+2320 in an initial list of possible post-RGB and post-AGB candidates, but it was dropped due to a high effective temperature ( T eff ). The distance to IRAS 17449+2320 calculated from a Gaia EDR3 [7] parallax is 730 ± 10 pc, and the interstellar extinction at this distance is E ( B V ) = 0 . 09 0.02 + 0.01 mag [8]. IRAS 17449+2320 shows small brightness variations of Δ V 0.05 mag, but a short-term drop in the visual brightness by ∼0.4 mag in May 2011 was detected by the KELT [9]. These authors also found hints of a regular variability with an amplitude of 9 mmag at a period of 25.6 days (see Figure 27 therein), but these variations occurred in the background of greater noise.
Korčáková et al. [10] reported the detection of a 6.2 ± 0.2 kG magnetic field through splitting of some spectral lines in the optical spectrum of IRAS 17449+2320, which made it the first magnetic object with the B[e] phenomenon. These authors also proposed that IRAS 17449+2320 might be a post-merger object, whose spectral characteristics can be described as a combination of a late B-type main sequence star (primary component with T eff 11,000 K) and a hot continuum source (probably a fast-rotating secondary component with T eff 50,000 K). The latter hypothesis was further explored by Moranchel-Basurto et al. [11,12] and Dvořáková et al. [13].
Nevertheless, the above-mentioned information does not allow for a definite conclusion on the nature of this complicated object. In this paper, we report the results of an extended study of IRAS 17449+2320 and a different interpretation of the system composition and evolutionary state.

2. Observations

Our analysis is mostly based on medium- and high-resolution (resolving powers from R = 12,000 to R = 65,000) spectroscopic data that were acquired at several observatories. A list of 78 of these spectra taken between 2005 and 2019 was presented in Korčáková et al. [10]. Additionally, we obtained 39 spectra with an échelle spectrograph from Eshel from Shelyak Instruments (https://www.shelyak.com, accessed on 20 March 2025) mounted on the 0.81 m telescope of the Three College Observatory in Graham, NC, USA (TCO, R 12,000, λ λ = 3800–7900 Å) in March–September of 2021 (see [14] for more details), 3 spectra with the ARCES spectrograph [15] of the 3.5 m telescope of the Apache Point Observatory (APO, R 31,500, λ λ = 3600–10,500 Å), and 4 spectra with a long-slit LHires iii spectrograph from a 0.35 m telescope in Mayhill, NM, USA (by J. Daglen, R 16,000, λ λ = 6500–6640 Å).
The spectroscopic data were complemented with photometric data collected from two long-term optical surveys: ASAS–3 (V–band, 2003–2009 [16]) and ASAS SN (V–band, 2014–2018, and g–band, 2017–present [17]). In order to obtain information about the color-indices, we obtained 60 observations in the B V R C bands with a 3056 × 3056 Apogee F9000 D9 CCD camera mounted on a 1 m telescope at the Tien-Shan Astronomical Observatory (TShAO, near Almaty, Kazakhstan) between May 2017 and December 2022.

3. Data Analysis

3.1. Brightness Variability

The object showed nearly constant brightness with the following average magnitudes: V = 9.99 ± 0.02 (ASAS–3), V = 9.93 ± 0.02 , g = 9.88 ± 0.03 (ASAS SN), and V = 9.95 ± 0.02 mag (TShAO). The difference in the average V-band magnitudes may be attributed to the object’s brightness near the saturation limit in the ASAS SN data and small differences in calibration. The average B V color index in the TShAO data was found to be equal to 0.07 ± 0.01 mag. Only one episode of the brightness decreasing by ∼0.25 mag, similar to the one found by the KELT telescope (see Section 1), was detected in the ASAS SN V-band data for May 2016, 04-29.

3.2. Fundamental Parameters

Inspection of our high-resolution (ESPaDoNs, R∼65, 000) spectra of IRAS 17449+2320 and comparisons with those of stars with solar metallicity and mild metal deficiencies in a T eff range between 9000 and 11,000 K, which were taken with similar spectral resolving powers, showed that the object’s T eff was close to 10,000 K. Figure 1 (left panel) shows a region around the Mg ii 4482 Å line in the spectrum of the object and two slightly metal-deficient narrow-lined stars Vega ( T eff = 9600 K, log g = 4.0) and α Dra ( T eff = 10,000 K, log g = 3.6, [18]). The spectral line EWs of IRAS 17449+2320 are enclosed between those of the comparison stars. Also, the object’s spectrum is similarly close to those of stars of a solar metallicity in nearly the same temperature range (e.g., ν Cap, T eff = 10,200 ± 220 K, log g = 3.9, [19]). Overall, we conclude that, when taking into account possible metallicity uncertainties, the object’s T eff = 9800 ± 300 K and log g ∼ 3.8.
The positions of the absorption lines measured in our spectra with the best signal-to-noise ratios varied within ∼1 km s−1. When applying Fourier analysis to a sample of 20 metallic line profiles at λ λ 4500–5320 Å in the averaged spectra of IRAS 17449+2320 taken with ESPaDoNs and ARCES spectrographs, we determined a projected rotational velocity of υ   sin i = 9 ± 2 km s−1. By taking the parameters derived above, a bolometric correction of BCV = 0.25 ± 0.07 mag, and the mentioned above Gaia distance, D = 730 ± 10 pc, one can find the following properties of the star: log L/ L = 1.86 ± 0.06 and R/ R = 3.0 ± 0.4 .

3.3. Magnetic Field

The highest-resolution spectra of IRAS 17449+2320 from our data set ( R 31 , 500 ) showed numerous narrow absorption lines of neutral and singly ionized metals, some of which (e.g., Fe ii 4923, 5018, and 5169 Å; Mg i 5172, 5183, and 8806 Å; N i 8629, 8683, 8703, 8711, and 8718 Å; and C i 9061, 9078, 9088, 9094, and 9111 Å) were split into two or three components (see Figure 1, right panel). This line-splitting can be explained by the Zeeman effect due to the presence of a global magnetic field [10,20]. Thus far, only small amounts of circumstellar gas (but never a gaseous and dusty envelope or disk) have been found around stars with similar or stronger magnetic fields. This class of stars is called magnetic and peculiar Bp and Ap stars (e.g., [20,21]).

3.4. Spectral Energy Distribution

In addition to the optical photometry mentioned in Section 2, we collected available photometric and spectroscopic data from the UV and IR spectral regions. They included two broadband UV fluxes from the Galex survey (at λ = 0.153 μ m and 0.231 μ m [22]), J H K photometry from 2MASS [23], four-band photometry from the WISE survey (3.6–22.1 μ m [24]), two-band photometry from the AKARI survey (9 and 18 μ m [25]), three-band IRAS photometry (12, 25, and 60 μ m [26]), and a spectrum taken at the Spitzer Space Observatory in a range of λ λ 5.2–22 μ m [27]. These data were corrected for an interstellar extinction of A V = 0.28 mag.
The resulting SED is shown in Figure 2, along with a theoretical fit for the UV and optical part and the SED of a weak-lined Be star 2 Cet (HR 9098), whose use here is justified below. Taking into account possible uncertainty of the UV extinction, the best theoretical fit was when the errors matched the spectroscopic determination of the object’s T eff . No UV excess was obvious in the covered wavelength range.

3.5. The 36-Day Cycle

Another phenomenon discovered in the spectra of IRAS 17449+2320 was the periodic appearance of a broad absorption component on the long wavelength side of several spectral lines (“red broad absorption” (RBA) hereafter). These features were observed in the hydrogen H α through H9, O i 7772–7775 Å triplet, O i 8446 Å, He i 5876 Å, and Si ii 6347 and 6371 Å lines (see Figure 2 in [10]).
Similar effects were observed in the magnetic cataclysmic variable polars [28,29], which were attributed to an eclipse of the emission region by an accretion curtain formed by the magnetic field. In the case of IRAS 17449+2320, where the magnetic field is significantly weaker than in the polars, the effect could be caused by frozen plasma, which had a lower velocity at the magnetic pole compared with that in other regions, where most radiation in the emission lines originated from.
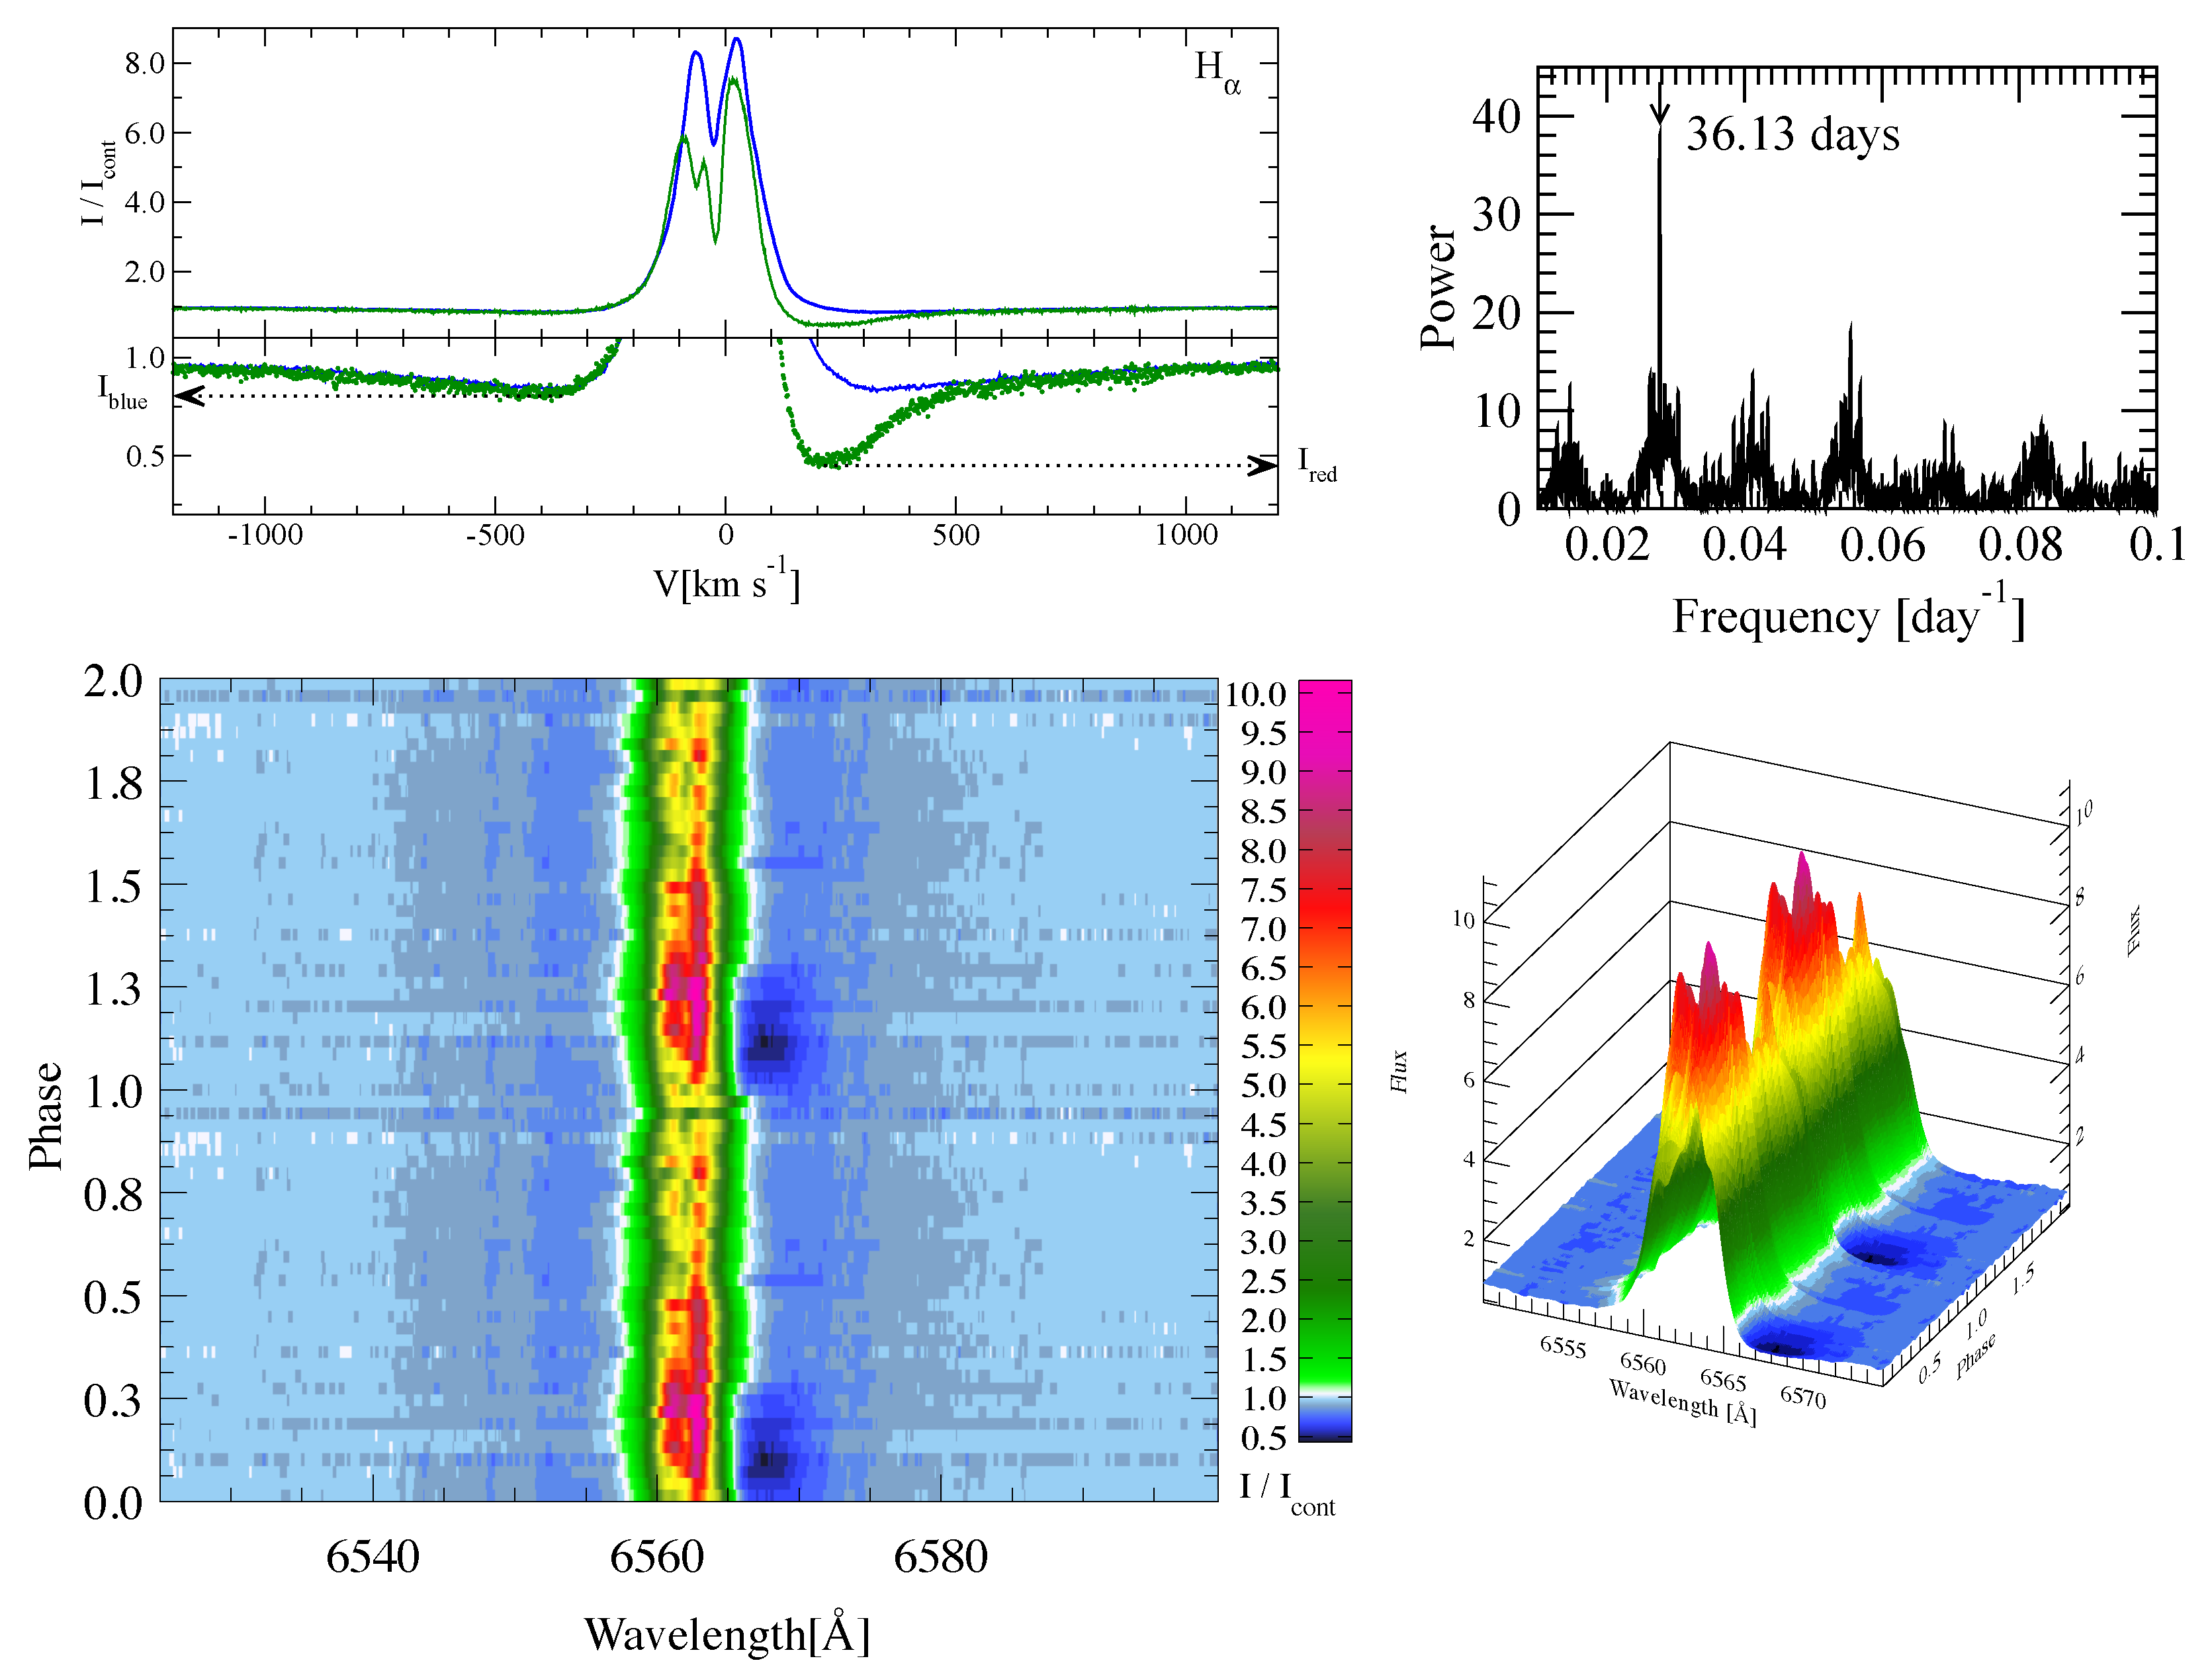
To quantify this effect, we measured the intensity ratios at the blue and red junctions of the emission and absorption components of the H α line I r e d / I b l u e , as shown in the top-left panel of Figure 3. These data were used to perform a periodogram analysis with the Lomb–Scargle method through the publicly available tool PGRAM (https://exoplanetarchive.ipac.caltech.edu/cgi-bin/Pgram/nph-pgram, accessed on 20 March 2025) accessed up to date of the publication. The power spectrum showed a strong peak at a period P = 36.13 ± 0.20 days (Figure 3, top-right panel). The period uncertainty corresponded to the full width at half maximum of the main peak in the Fourier power spectrum.
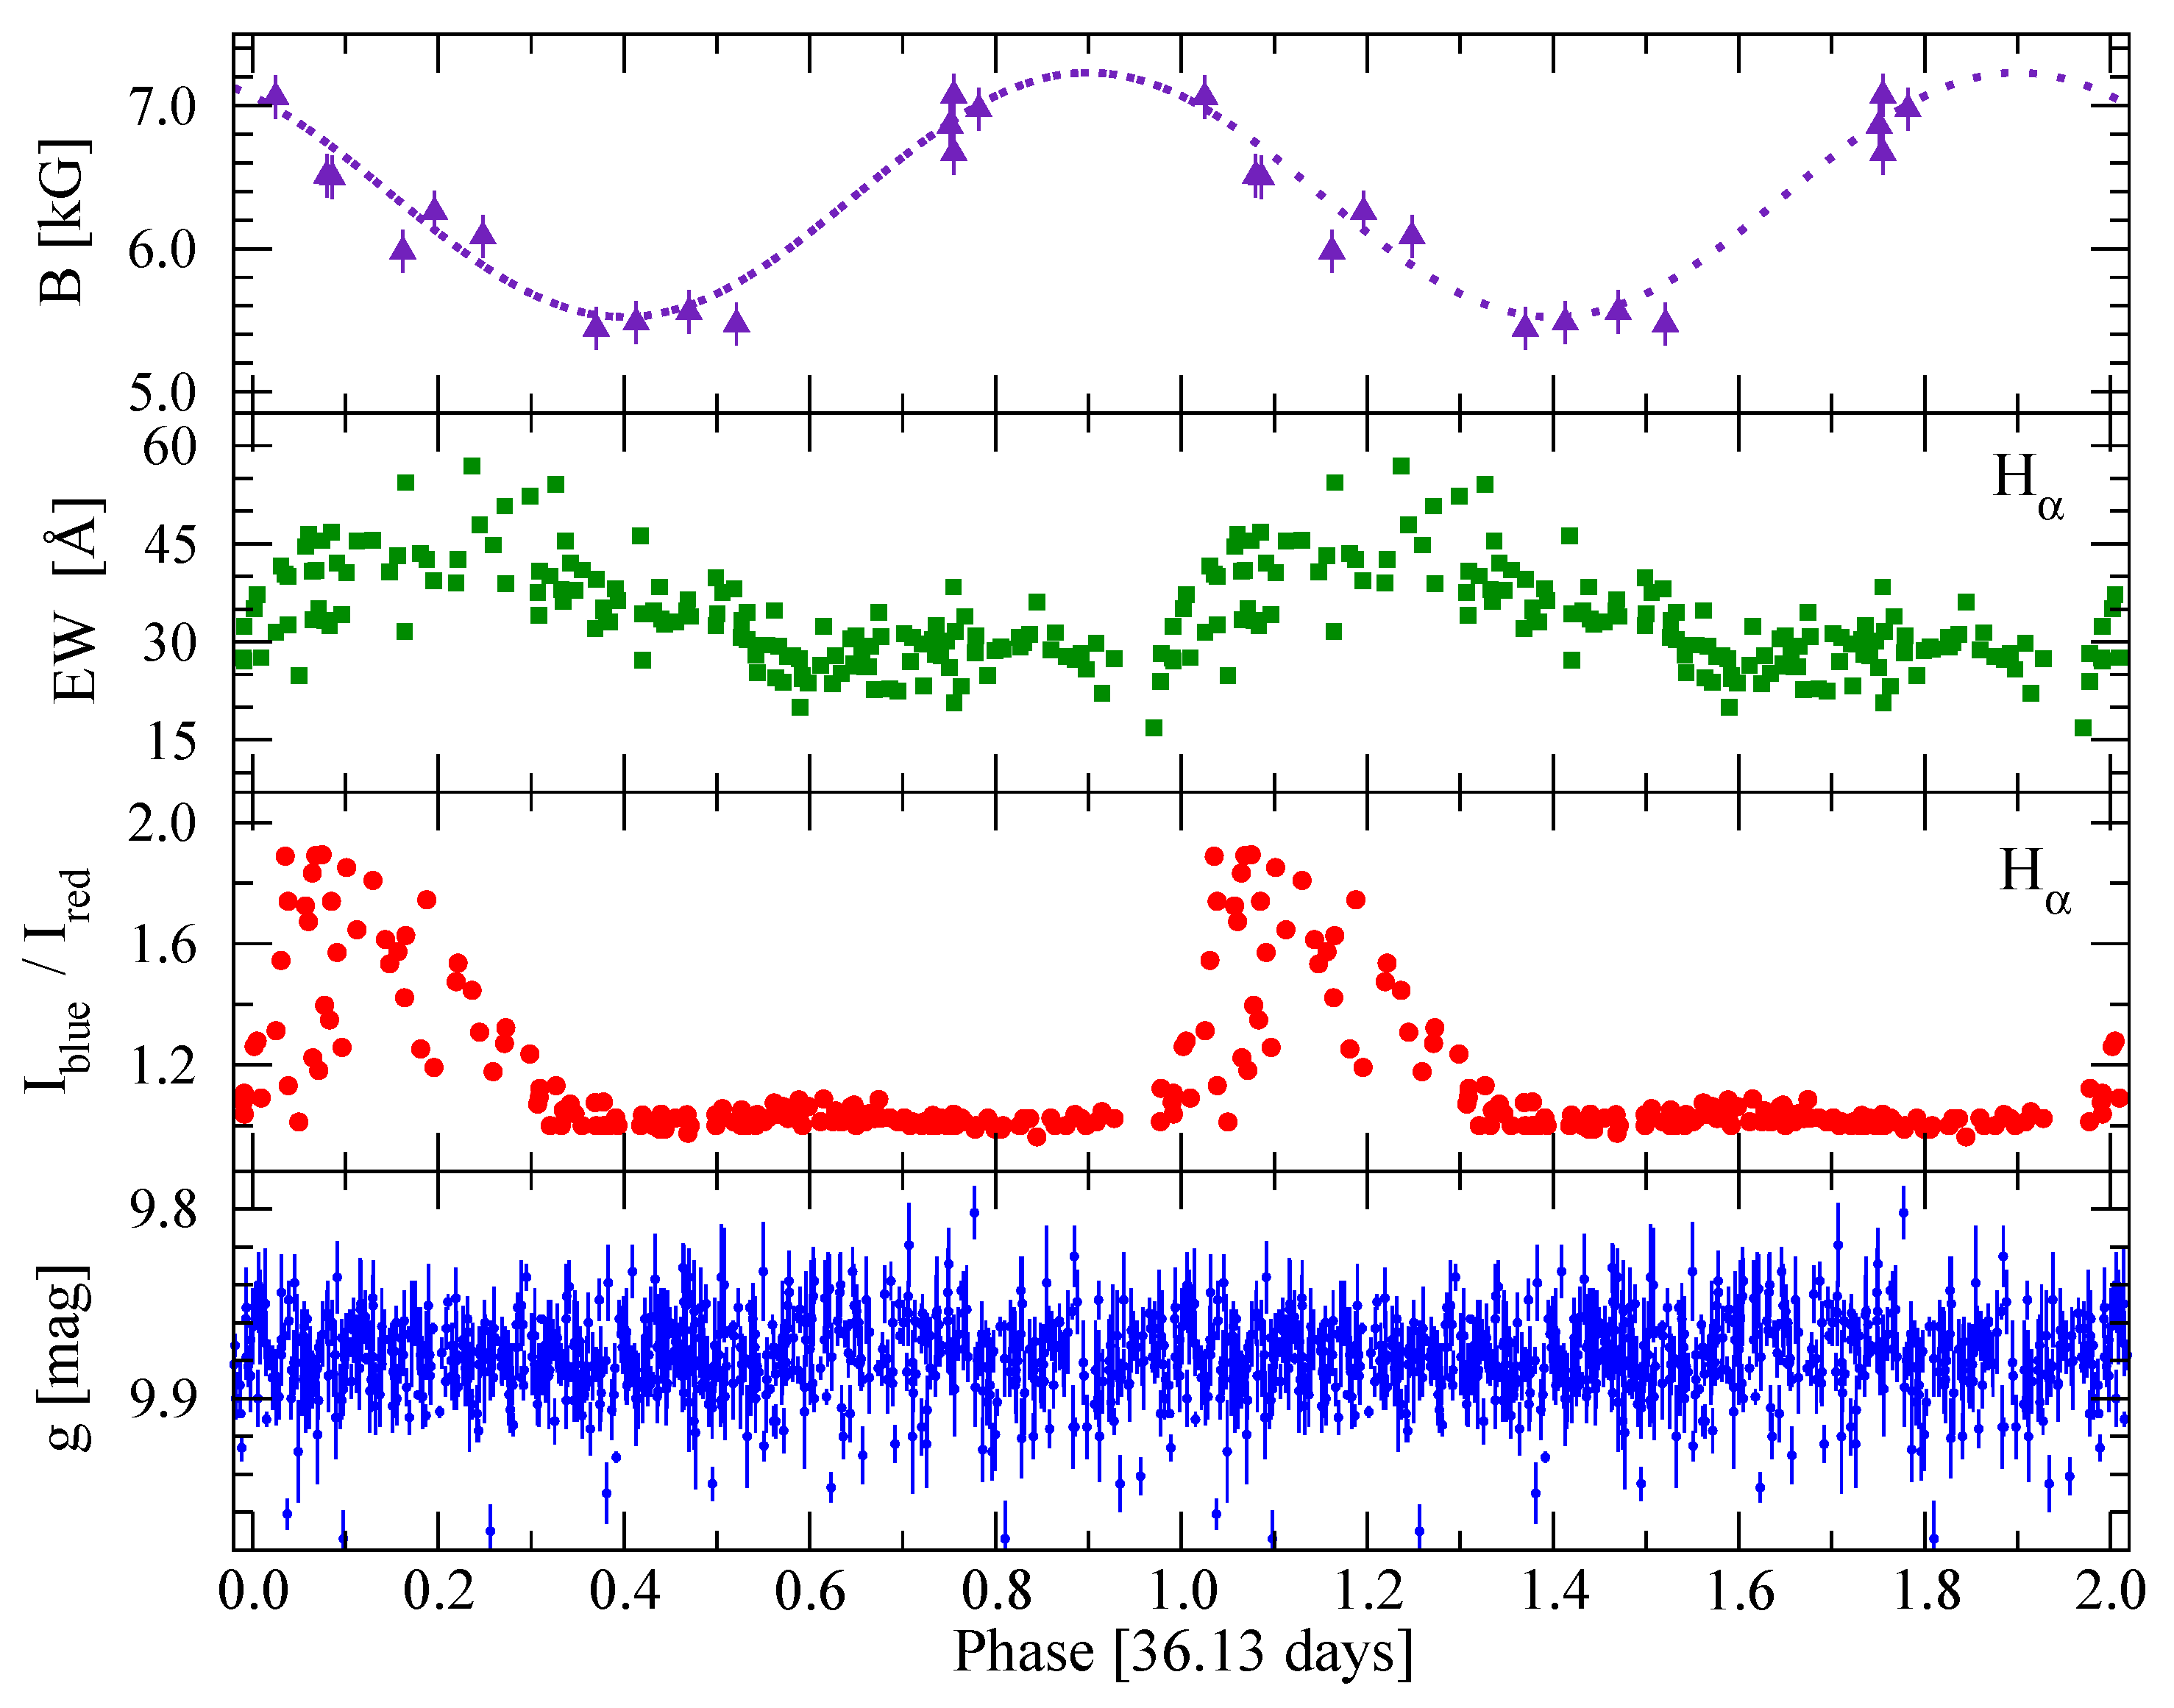
The phase-resolved spectra of the H α line are shown in Figure 3, while the I r e d / I b l u e variations folded with the period are shown in the panel second from the bottom in Figure 4. The zero phase was selected arbitrarily and corresponded to the moment of the first detection of the RBA feature. This is clearly identified by the dark blue color in the bottom panels of Figure 3. The deepness of the RBA increased quickly during only ∼ 0.1 P and then faded away during ∼ 0.3 P . There is a hint of a weak RBA noticeable near the phase of ∼ 0.6 .
This periodicity was also found in the variations in the H α line equivalent width (EW), whose increase by a factor of two was observed shortly after the onset of the RBA. The latter was present during ∼ 0.25 P , while the H α line showed an elevated strength for ∼ 0.5 P with a maximum shifted by ∼ 0.1 P after the RBA minimum (Figure 4). The peak intensity ratio of the double-peaked H α line profile exhibited the same periodicity but with a larger scatter of values. This cycle was also accompanied by doubling the EW of the absorption He i 5876 Å near the maxima times of the described above quantities.
A similar effect was observed in the behavior of the magnetic field strength. The corresponding curve of the surface magnetic field B measured using 14 high-resolution spectra and folding with the period is also shown in the top panel of Figure 4. Notably, the shapes of the curves are quite different. While the intensity ratio I r e d / I b l u e showed a rapid increase during only ∼0.1P and fell back to the initial level after that, the E W H α also quickly increased by about a factor of two and began decreasing to the lower level during about halfway through the period. In contrast, the magnetic field strength was sine-like during the cycle. At the same time, the optical light curve did not show any variations related to the mentioned period.

4. Discussion

Only a few estimates of the object’s fundamental parameters are in the literature. Condori et al. [30] calculated its luminosity L = 1.75 ± 0.11 L based on the visual brightness and the Gaia distance. Their estimate was T eff = 9350 ± 400 K (see Table 9 therein). Korčáková et al. [10] derived T eff = 12,580 K, log g = 4.2 , and υ r o t = 11 km s−1 from a fit of the object’s spectrum with a single star of the solar composition. However, they noted that adding the flux from a hypothetical hot source would only provide an upper limit to the visible star’s T eff of <11,040 K.
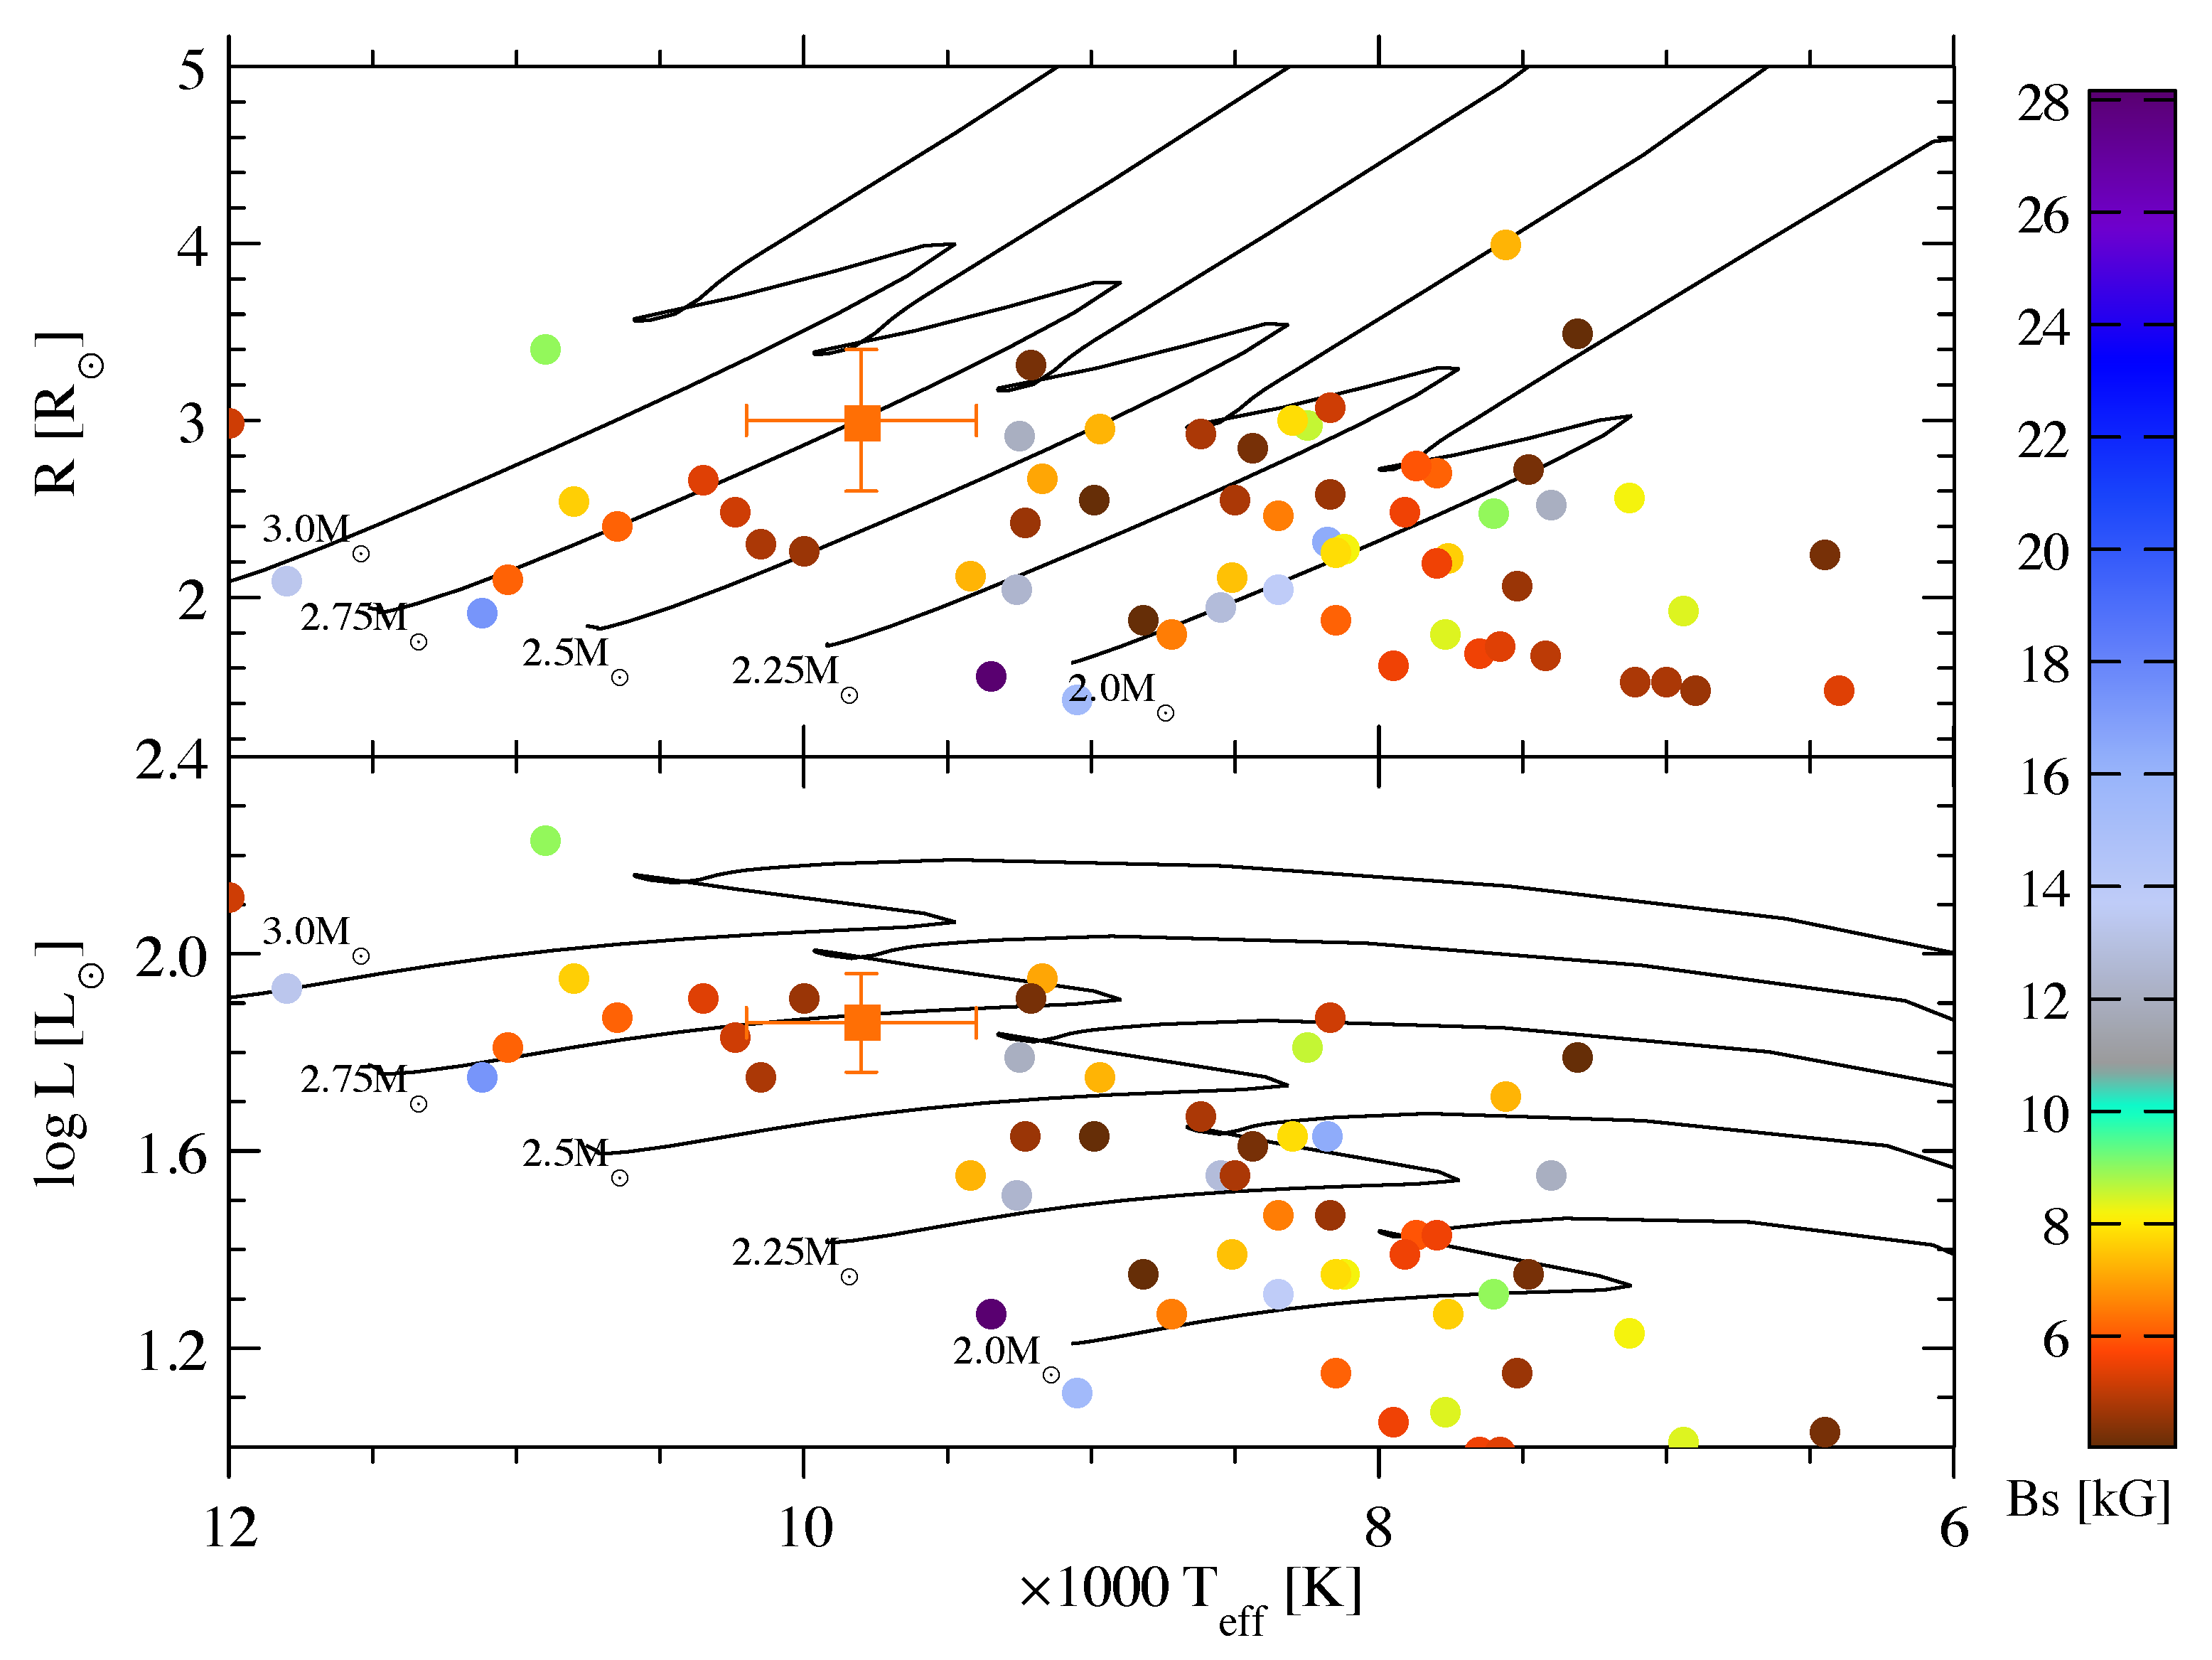
Our estimate yielded T eff = 9800 ± 300 K and a luminosity log L / L = 1.86 ± 0.06 (see Section 3.2). Using MESA [31,32,33,34,35] calculations, the latter corresponded to a position on the evolutionary track of a ∼2.75 M/3.0 R star ( Figure 5) near the end of the main sequence.
Assuming that P = 36.13 days is the star’s rotational period, one obtains υ sini = 4.2 km s−1 which is comparable to our spectroscopic result (9 ± 2 km s−1; see Section 3.2). The latter suggests that IRAS 17449+2320 is either viewed pole-on or rotates extremely slowly. We note that IRAS 17449+2320 is not unique in its magnetic and υ sin i characteristics. Other magnetic stars with low projected rotational velocities, such as the 0.3 kG B9 Si star BD+0°1659 with υ sin i = 7 ± 1 km s−1, have been reported in the literature [36].
Figure 5. A Hertzsprung–Russell diagram (low panel) and a radius T eff plot (top panel). The evolution tracks were calculated using the MESA code for single stars with the solar chemical abundance. The corresponding stellar masses are marked. The colored points show the positions of magnetic Bp and Ap stars from [37]. The colors correspond to the surface magnetic field strength, as shown by the color bar on the right. The position of IRAS 17449+2320 in both panels is shown by the colored square with error bars.
Galaxies 13 00032 g005
A tilted, oblique, slow rotator model of ApBp stars [38] can easily explain the non-sine-like shapes of the I b l u e / I r e d and E W H α phase curves (Figure 4), in contrast to the case of an object viewed nearly pole-on, where only one hemisphere was always visible. At such a star orientation, any surface structure (such as a spot) would gradually travel around the star’s axis and exhibit smoothly changing observed characteristics over the rotation period.
When comparing the SED of IRAS 17449+2320 in the UV optical range with that of the Be star 2 Cet, which has a quite similar T eff and was used by Korčáková et al. [10] to suggest the presence of a UV excess as well as an additional UV source or a secondary component in IRAS 17449+2320, we found no confirmation of the latter suggestions. Neither the UV photometry (see Figure 2) nor the IUE spectra of 2 Cet demonstrated even a weak UV excess.
Nevertheless, we note that a single star with a low mass and T eff is generally incapable of ionizing enough circumstellar material to produce the observed line emission, except at the pre-main sequence stage. IRAS 17449+2320 does not belong to any recognized star-forming region, and a fast decrease in the IR flux toward longer wavelengths makes its pre-main sequence status unlikely (see [39]). About 20 Be stars are known to have sdO and sdB companions confirmed by far-UV observations (see [40] and the references therein). They typically provide a minimal contribution to the brightness in the optical (∼2%) and FUV (∼15%) ranges (see, for example, φ Per [41]). At the same time, such weak, hot, undetected companions at a distant orbit may be responsible for the ionization of the circumstellar matter.
The question of the origin of the magnetic field of the visible companion in IRAS 17449+2320 remains open. A number of ApBp stars with similar masses and T eff values also have magnetic fields comparable to that of the object (Figure 5) [37]. Tutukov and Fedorova [42] proposed that the main path for the formation of ApBp stars is the coalescence of close binary systems with masses of at least one component in the range 0.7–1.5 M . However, in contrast to IRAS 17449+2320, no ApBp star with a substantial IR excess has been reported.
Summarizing the above discussion, IRAS 17449+2320 is currently a unique object which, on the one hand, has a gaseous and dusty envelope producing a strong IR excess and an emission-line spectrum and, on the other hand, shows a strong and variable magnetic field (5.5–7.2 KGauss), which was found through the splitting of some spectral lines. Additionally, RBA components regularly appear in spectral lines of neutral hydrogen, helium, and oxygen, as well as in singly ionized silicon, with a period of 36.13 days. The latter process is accompanied by increasing strength of the emission components of the hydrogen lines as well as the helium and metallic absorption lines.
Based on the described observational facts and the above discussion, we speculate that IRAS 17449+2320 was formed from a triple system through a merger [43,44]. The magnetic Ap star is a result of a recent merging event in the inner binary [45]. The latter was probably accompanied by the formation of an sdO- or sdB-type object from the third companion, and a fraction of the material was ejected from the system, which currently manifests itself as a circumstellar disk that has not dissipated yet.
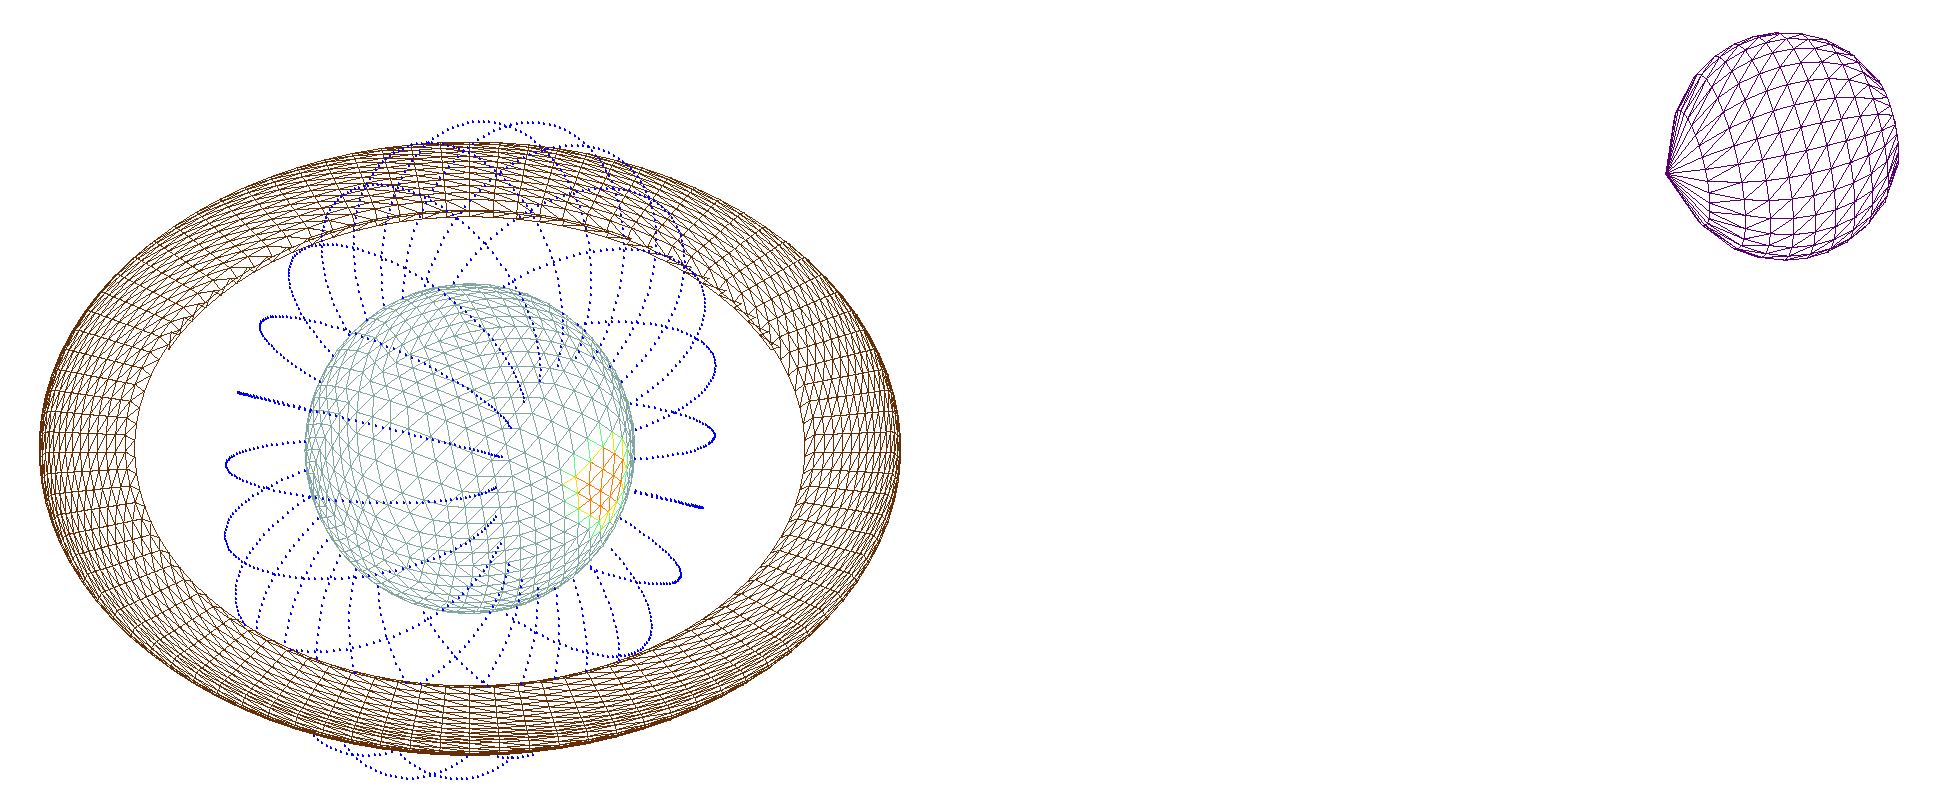
Overall, IRAS 17449+2320 represents a rare example of an evolutionary state of a binary, which at the moment consists of a magnetic Ap star, a faint sdO and sdB companion at a distant orbit, and a circumstellar disk, whose inner regions are partly ionized and responsible for the emission lines, while the outer parts contain dusty particles that produce an IR excess. An artistic interpretation of the current state of IRAS 17449+2320 is shown in Figure 6. The circumprimary and circumbinary disks (the latter of which is not shown in Figure 6) are located in the orbital plane of the system. The rotational axis of the Ap star is perpendicular to the orbital plane, and its magnetic axis is significantly tilted from the rotational axis.

5. Conclusions

Using a large collection of optical photometric and spectroscopic data, we refined the fundamental parameters of the visible counterpart of IRAS 17449+2320 ( T eff = 9800 ± 300 K, log L/ L = 1.86 ± 0.06 , v sin i = 9 ± 2 km s−1). We also investigated the RBA phenomenon as well as the variations in the H α emission line strength and that of the magnetic field. We found that all of these phenomena had the same period, which was most likely the rotation period of the visible star.
No signs of a secondary component or UV excess radiation were found. We speculate that the object is probably the result of a recent merger in a contact binary or the exotic state of an ex-triple system, in which close components merged, while the third component evolved into an sdO or sdB star. The presence of a strong magnetic field in an object with the B[e] phenomenon opens a wider variety of initial conditions and evolutionary paths of the FS CMa group objects than expected earlier and a new direction in studies on magnetic stars.

Author Contributions

Observations, S.Z., A.M., I.R., R.K., C.O., N.M., A.R., S.D., A.A., S.D.C. and J.D.; data reduction, S.Z. and A.M. data analysis, S.Z. and A.M.; writing—original draft preparation, S.Z. and A.M.; writing—review and editing, S.Z., A.M. and S.D. All authors have read and agreed to the published version of the manuscript.

Funding

The work was carried out within the framework of Project No. BR24992759, “Development of the concept for the first Kazakhstani orbital cislunar telescope—Phase I”, financed by the Ministry of Science and Higher Education of the Republic of Kazakhstan). S.Z. and A.M. acknowledge PAPIIT grant IN119323.

Data Availability Statement

The spectra and photometry are available on request via email at a_mirosh@uncg.edu.

Acknowledgments

The results were partially based on observations obtained at the Canada-France-Hawaii Telescope (CFHT), which is operated by the National Research Council of Canada, the Institut National des Sciences de l’Univers of the Centre National de la Recherche Scientifique de France, and the University of Hawaii. The observations at the CFHT were performed with care and respect from the summit of Maunakea, which is a significant cultural and historical site. This paper also used data taken using the 2 m Perek telescope of the Ondřejov Observatory (Prague, Czech Republic), 2.1 m telescope of the Observatorio Astronómico Nacional San Pedro Martir (Ensenada, México), 2 m Himalayan Chandra Telescope (Hanle, India), 3.5 m telescope of the Apache Point Observatory (Sunspot, NM, USA), 1 m telescope of the Tien-Shan Astronomical Observatory (Almaty, Kazakhstan), 2.7 m Harlan J. Smith telescope of the McDonald Observatory (Austin, TX, USA), and 0.81 m telescope of the Three College Observatory (Graham, NC, USA).

Conflicts of Interest

The authors declare no conflicts of interest.

Abbreviations

The following abbreviations are used in this manuscript: FUV - far-ultraviolet, UV = ultraviolet, IR = infrared, RV = radial velocity, EW = equivalent width, TCO = Three College Observatory, APO = Apache Point Observatory, ASAS–3 = All Sky Automated Survey, ASAS SN = All-Sky Automated Survey for Supernovae, TShAO = Tien-Shan Astronomical Observatory, SED = spectral energy distribution, RGB = red giant branch, AGB = asymptotic giant branch, ESPaDoNs = Echelle SpectroPolarimetric Device for the Observation of Stars, ARCES = ARC Echelle Spectrograph, 2MASS = Two Micron All Sky Survey, WISE = Wide-field Infrared Survey Explorer, Galex = Galaxy Evolution Explorer, TD-1 = TD1 Stellar Ultraviolet Flux Survey, KELT = The Kilodegree Extremely Little Telescope.

References

  1. Stephenson, C.B. New H alpha Emission Stars Found above 10 degrees Galactic Latitude. APJ 1986, 300, 779. [Google Scholar] [CrossRef]
  2. Downes, R.A.; Keyes, C.D. Spectroscopic observations of H-alpha emission stars from the Stephenson and Stephenson-Sanduleak lists. Astron. J. 1988, 96, 777–790. [Google Scholar] [CrossRef]
  3. Miroshnichenko, A.S.; Manset, N.; Kusakin, A.V.; Chentsov, E.L.; Klochkova, V.G.; Zharikov, S.V.; Gray, R.O.; Grankin, K.N.; Gandet, T.L.; Bjorkman, K.S.; et al. Toward Understanding the B[e] Phenomenon. II. New Galactic FS CMa Stars. APJ 2007, 671, 828–841. [Google Scholar] [CrossRef]
  4. Aret, A.; Kraus, M.; Šlechta, M. Spectroscopic survey of emission-line stars—I. B[e] stars. Mon. Not. R. Astron. Soc. 2016, 456, 1424–1437. [Google Scholar] [CrossRef]
  5. Boubert, D.; Evans, N.W. On the kinematics of a runaway Be star population. Mon. Not. R. Astron. Soc. 2018, 477, 5261–5278. [Google Scholar] [CrossRef]
  6. Mohorian, M.; Kamath, D.; Menon, M.; Ventura, P.; Van Winckel, H.; García-Hernández, D.A.; Masseron, T. The first measurements of carbon isotopic ratios in post-RGB stars: SZ Mon and DF Cyg. Mon. Not. R. Astron. Soc. 2024, 530, 761–782. [Google Scholar] [CrossRef]
  7. Gaia Collaboration; Brown, A.G.A.; Vallenari, A.; Prusti, T.; de Bruijne, J.H.J.; Babusiaux, C.; Biermann, M.; Creevey, O.L.; Evans, D.W.; Eyer, L.; et al. Gaia Early Data Release 3. Summary of the contents and survey properties. Astron. Astrophys. 2021, 649, A1. [Google Scholar] [CrossRef]
  8. Green, G.M.; Schlafly, E.; Zucker, C.; Speagle, J.S.; Finkbeiner, D. A 3D Dust Map Based on Gaia, Pan-STARRS 1, and 2MASS. APJ 2019, 887, 93. [Google Scholar] [CrossRef]
  9. Labadie-Bartz, J.; Pepper, J.; McSwain, M.V.; Bjorkman, J.E.; Bjorkman, K.S.; Lund, M.B.; Rodriguez, J.E.; Stassun, K.G.; Stevens, D.J.; James, D.J.; et al. Photometric Variability of the Be Star Population. Astron. J. 2017, 153, 252. [Google Scholar] [CrossRef]
  10. Korčáková, D.; Sestito, F.; Manset, N.; Kroupa, P.; Votruba, V.; Šlechta, M.; Danford, S.; Dvořáková, N.; Raj, A.; Chojnowski, S.D.; et al. First detection of a magnetic field in low-luminosity B[e] stars. New scenarios for the nature and evolutionary stages of FS CMa stars. Astron. Astrophys. 2022, 659, A35. [Google Scholar] [CrossRef]
  11. Moranchel-Basurto, A.; Korčáková, D.; Chametla, R.O. 2.5D magnetohydrodynamic models of circumstellar discs around FS CMa post-mergers—I. Non-stationary accretion stage. Mon. Not. R. Astron. Soc. 2023, 523, 5554–5564. [Google Scholar] [CrossRef]
  12. Moranchel-Basurto, A.; Korčáková, D.; Chametla, R.O. 2.5-MHD models of circumstellar discs around FS CMa post-mergers: II. Stationary accretion stage. Mon. Not. R. Astron. Soc. 2024, 528, 7310–7319. [Google Scholar] [CrossRef]
  13. Dvořáková, N.; Korčáková, D.; Dinnbier, F.; Kroupa, P. The mass distribution of stellar mergers: A new scenario for several FS CMa stars. Astron. Astrophys. 2024, 689, A234. [Google Scholar] [CrossRef]
  14. Miroshnichenko, A.S.; Danford, S.; Andronov, I.L.; Aarnio, A.N.; Lauer, D.; Buroughs, H. Refining Orbits of Bright Binary Systems. Galaxies 2023, 11, 8. [Google Scholar] [CrossRef]
  15. Wang, S.i.; Hildebrand, R.H.; Hobbs, L.M.; Heimsath, S.J.; Kelderhouse, G.; Loewenstein, R.F.; Lucero, S.; Rockosi, C.M.; Sandford, D.; Sundwall, J.L.; et al. ARCES: An echelle spectrograph for the Astrophysical Research Consortium (ARC) 3.5m telescope. In Instrument Design and Performance for Optical/Infrared Ground-Based Telescopes; Iye, M., Moorwood, A.F.M., Eds.; Society of Photo-Optical Instrumentation Engineers (SPIE) Conference Series; SPIE: Bellingham, WA, USA, 2003; Volume 4841, pp. 1145–1156. [Google Scholar] [CrossRef]
  16. Pojmanski, G. The All Sky Automated Survey. Acta Astron. 1997, 47, 467–481. [Google Scholar] [CrossRef]
  17. Kochanek, C.S.; Shappee, B.J.; Stanek, K.Z.; Holoien, T.W.S.; Thompson, T.A.; Prieto, J.L.; Dong, S.; Shields, J.V.; Will, D.; Britt, C.; et al. The All-Sky Automated Survey for Supernovae (ASAS-SN) Light Curve Server v1.0. Publ. Astron. Soc. Pac. 2017, 129, 104502. [Google Scholar] [CrossRef]
  18. Adelman, S.J.; Caliskan, H.; Kocer, D.; Kablan, H.; Yüce, K.; Engin, S. Elemental abundance analyses with DAO spectrograms. XXV. The superficially normal B and A stars alpha Draconis, tau Herculis, gamma Lyrae, and HR 7926. Astron. Astrophys. 2001, 371, 1078–1083. [Google Scholar] [CrossRef]
  19. Romanovskaya, A.M.; Ryabchikova, T.A.; Pakhomov, Y.V.; Korotin, S.A.; Sitnova, T.M. Non-LTE abundance analysis of A-B stars with low rotational velocities—II. Do A-B stars with normal abundances exist? Mon. Not. R. Astron. Soc. 2023, 526, 3386–3399. [Google Scholar] [CrossRef]
  20. Mathys, G. Ap stars with resolved magnetically split lines: Magnetic field determinations from Stokes I and V spectra★. Astron. Astrophys. 2017, 601, A14. [Google Scholar] [CrossRef]
  21. Shultz, M.E.; Wade, G.A.; Rivinius, T.; Alecian, E.; Neiner, C.; Petit, V.; Owocki, S.; ud-Doula, A.; Kochukhov, O.; Bohlender, D.; et al. The magnetic early B-type stars—III. A main-sequence magnetic, rotational, and magnetospheric biography. Mon. Not. R. Astron. Soc. 2019, 490, 274–295. [Google Scholar] [CrossRef]
  22. Bianchi, L.; Shiao, B.; Thilker, D. Revised Catalog of GALEX Ultraviolet Sources. I. The All-Sky Survey: GUVcat_AIS. APJ Suppl. Ser. 2017, 230, 24. [Google Scholar] [CrossRef]
  23. Cutri, R.M.; Skrutskie, M.F.; van Dyk, S.; Beichman, C.A.; Carpenter, J.M.; Chester, T.; Cambresy, L.; Evans, T.; Fowler, J.; Gizis, J.; et al. VizieR On-line Data Catalog: II/246. In 2MASS All Sky Catalog of Point Sources; University of Massachusetts and Infrared Processing and Analysis Center, IPAC/California Institute of Technology: Pasadena, CA, USA, 2003. [Google Scholar]
  24. Cutri, R.M.; Wright, E.L.; Conrow, T.; Fowler, J.W.; Eisenhardt, P.R.M.; Grillmair, C.; Kirkpatrick, J.D.; Masci, F.; McCallon, H.L.; Wheelock, S.L.; et al. Explanatory Supplement to the AllWISE Data Release Products. 2013. Available online: https://wise2.ipac.caltech.edu/docs/release/allwise/expsup/index.html (accessed on 20 March 2025).
  25. Ishihara, D.; Onaka, T.; Kataza, H.; Salama, A.; Alfageme, C.; Cassatella, A.; Cox, N.; García-Lario, P.; Stephenson, C.; Cohen, M.; et al. The AKARI/IRC mid-infrared all-sky survey. Astron. Astrophys. 2010, 514, A1. [Google Scholar] [CrossRef]
  26. Helou, G.; Walker, D.W. (Eds.) Infrared Astronomical Satellite (IRAS) Catalogs and Atlases: The Small Scale Structure Catalog; NASA_NTRS_Archive_19890004828; NASA: Washington, DC, USA, 1988; Volume 7. Available online: https://archive.org/details/NASA_NTRS_Archive_19890004828 (accessed on 20 March 2025).
  27. Miroshnichenko, A.S.; Gray, R.O.; Bjorkman, K.S.; Rudy, R.J.; Lynch, D.K.; Carciofi, A.C. Properties of the circumstellar dust in galactic FS CMa objects. In Active OB Stars: Structure, Evolution, Mass Loss, and Critical Limits; Neiner, C., Wade, G., Meynet, G., Peters, G., Eds.; IAU Symposium; Proceedings of the International Astronomical Union; Cambridge University Press: Cambridge, UK, 2010; Volume 272, pp. 412–413. [Google Scholar] [CrossRef]
  28. Schmidt, G.D.; Szkody, P.; Homer, L.; Smith, P.S.; Chen, B.; Henden, A.; Solheim, J.E.; Wolfe, M.A.; Greimel, R. Unraveling the Puzzle of the Eclipsing Polar SDSS J015543.40+002807.2 with XMM and Optical Photometry/Spectropolarimetry. APJ 2005, 620, 422–431. [Google Scholar] [CrossRef]
  29. Littlefield, C.; Garnavich, P.; Hoyt, T.J.; Kennedy, M. MASTER OT J132104.04+560957.8: A Polar with Absorption-Emission Line Reversals. Astron. J. 2018, 155, 18. [Google Scholar] [CrossRef]
  30. Condori, C.A.H.; Borges Fernandes, M.; Kraus, M.; Panoglou, D.; Guerrero, C.A. The study of unclassified B[e] stars and candidates in the Galaxy and Magellanic Clouds†. Mon. Not. R. Astron. Soc. 2019, 488, 1090–1110. [Google Scholar] [CrossRef]
  31. Paxton, B.; Cantiello, M.; Arras, P.; Bildsten, L.; Brown, E.F.; Dotter, A.; Mankovich, C.; Montgomery, M.H.; Stello, D.; Timmes, F.X.; et al. Modules for Experiments in Stellar Astrophysics (MESA): Planets, Oscillations, Rotation, and Massive Stars. APJ Suppl. Ser. 2013, 208, 4. [Google Scholar] [CrossRef]
  32. Paxton, B.; Marchant, P.; Schwab, J.; Bauer, E.B.; Bildsten, L.; Cantiello, M.; Dessart, L.; Farmer, R.; Hu, H.; Langer, N.; et al. Modules for Experiments in Stellar Astrophysics (MESA): Binaries, Pulsations, and Explosions. APJ Suppl. Ser. 2015, 220, 15. [Google Scholar] [CrossRef]
  33. Paxton, B.; Schwab, J.; Bauer, E.B.; Bildsten, L.; Blinnikov, S.; Duffell, P.; Farmer, R.; Goldberg, J.A.; Marchant, P.; Sorokina, E.; et al. Modules for Experiments in Stellar Astrophysics (MESA): Convective Boundaries, Element Diffusion, and Massive Star Explosions. APJ Suppl. Ser. 2018, 234, 34. [Google Scholar] [CrossRef]
  34. Paxton, B.; Smolec, R.; Schwab, J.; Gautschy, A.; Bildsten, L.; Cantiello, M.; Dotter, A.; Farmer, R.; Goldberg, J.A.; Jermyn, A.S.; et al. Modules for Experiments in Stellar Astrophysics (MESA): Pulsating Variable Stars, Rotation, Convective Boundaries, and Energy Conservation. APJ Suppl. Ser. 2019, 243, 10. [Google Scholar] [CrossRef]
  35. Jermyn, A.S.; Bauer, E.B.; Schwab, J.; Farmer, R.; Ball, W.H.; Bellinger, E.P.; Dotter, A.; Joyce, M.; Marchant, P.; Mombarg, J.S.G.; et al. Modules for Experiments in Stellar Astrophysics (MESA): Time-dependent Convection, Energy Conservation, Automatic Differentiation, and Infrastructure. APJ Suppl. Ser. 2023, 265, 15. [Google Scholar] [CrossRef]
  36. Romanovskaya, A.; Ryabchikova, T.; Pakhomov, Y.; Potravnov, I.; Sitnova, T. Slowly Rotating Peculiar Star BD00°1659 as a Benchmark for Stratification Studies in Ap/Bp Stars. Galaxies 2024, 12, 55. [Google Scholar] [CrossRef]
  37. Glagolevskij, Y.V. On Properties of Main Sequence Magnetic Stars. Astrophys. Bull. 2019, 74, 66–79. [Google Scholar] [CrossRef]
  38. Stift, M.J. A non-axisymmetric rigid rotator model for magnetic stars. Mon. Not. R. Astron. Soc. 1975, 172, 133–139. [Google Scholar] [CrossRef]
  39. Miroshnichenko, A.S. Toward Understanding the B[e] Phenomenon. I. Definition of the Galactic FS CMa Stars. APJ 2007, 667, 497–504. [Google Scholar] [CrossRef]
  40. Klement, R.; Baade, D.; Rivinius, T.; Gies, D.R.; Wang, L.; Labadie-Bartz, J.; Ticiani dos Santos, P.; Monnier, J.D.; Carciofi, A.C.; Mérand, A.; et al. Dynamical Masses of the Primary Be Star and Secondary sdB Star in the Single-lined Binary κ Dra (B6 IIIe). APJ 2022, 940, 86. [Google Scholar] [CrossRef]
  41. Mourard, D.; Monnier, J.D.; Meilland, A.; Gies, D.; Millour, F.; Benisty, M.; Che, X.; Grundstrom, E.D.; Ligi, R.; Schaefer, G.; et al. Spectral and spatial imaging of the Be+sdO binary ϕ Persei. Astron. Astrophys. 2015, 577, A51. [Google Scholar] [CrossRef]
  42. Tutukov, A.V.; Fedorova, A.V. Possible scenarios for the formation of Ap/Bp stars. Astron. Rep. 2010, 54, 156–162. [Google Scholar] [CrossRef]
  43. Naoz, S.; Fabrycky, D.C. Mergers and Obliquities in Stellar Triples. APJ 2014, 793, 137. [Google Scholar] [CrossRef]
  44. Shariat, C.; Naoz, S.; El-Badry, K.; Rodriguez, A.C.; Hansen, B.M.S.; Angelo, I.; Stephan, A.P. Once a Triple, Not Always a Triple: The Evolution of Hierarchical Triples That Yield Merged Inner Binaries. APJ 2025, 978, 47. [Google Scholar] [CrossRef]
  45. Bogomazov, A.I.; Tutukov, A.V. Merging of components in close binaries: Type Ia supernovae, massive white dwarfs, and Ap stars. Astron. Rep. 2009, 53, 214–222. [Google Scholar] [CrossRef]
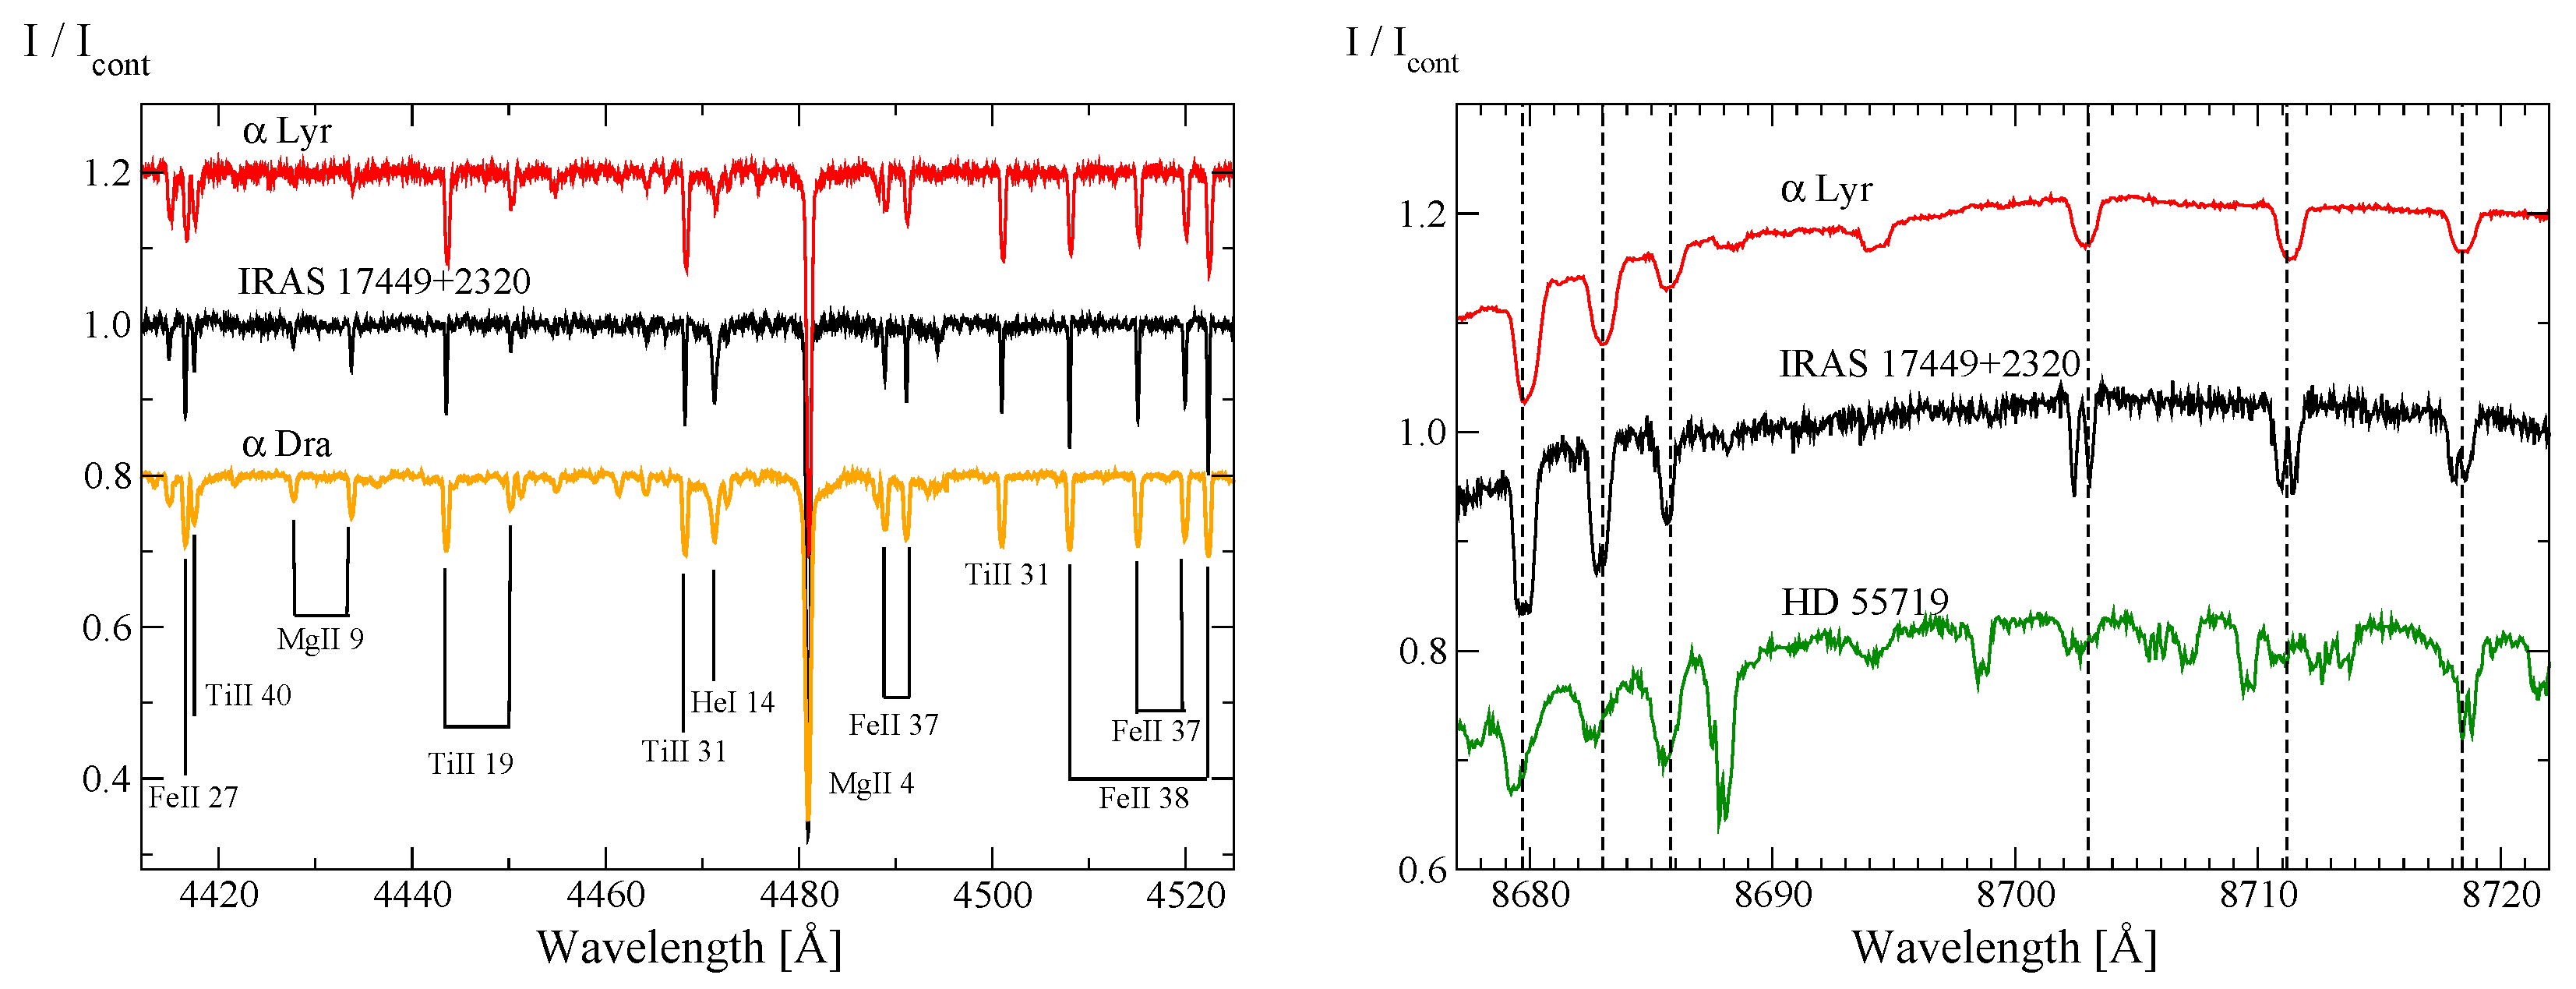
Figure 1. Left panel: Comparison of the ESPaDoNs ( R 65,000) spectra of IRAS 17449+2320, Vega ( α Lyr), and α Dra. Most of the clearly visible spectral lines are marked with the ionization state of the element and the multiplet number. Right panel: Comparison of the ESPaDoNs spectra of the non-magnetic star Vega, a magnetic Ap star HD 55719, and IRAS 17449+2320. Vertical dashed lines show the positions of N i lines.
Galaxies 13 00032 g001
Figure 2. Comparison of the dereddened SED of IRAS 17449+2320 (black symbols) and the Be star 2 Cet (blue symbols). The black line shows the Spitzer Space Observatory spectrum of IRAS 17449+2320. The red line shows the theoretical SED for T eff = 10,000 K and log g = 4.0 and provides a rather good fit for the photometric data of 2 Cet. The UV data were taken from the Galex and TD−1 (for 2 Cet only) missions.
Galaxies 13 00032 g002
Figure 3. (top left) Parts of the CFHT spectra of IRAS 17449+2320 taken on 2007/07/02 (blue line) and 2012/02/13 (green line). The edges of the emission component, where the I b l u e and I r e d were measured, are shown by the arrowhead dashed lines. (top right) The power spectrum of the intensity ratio I b l u e / I r e d variations. (bottom) Phase-resolved spectra near the H α line folded over the 36.13-day period. The phase zero point was constrained by the onset of the absorption feature.
Galaxies 13 00032 g003
Figure 4. Temporal behavior of the intensity ratio at the boundaries of the emission component shown in Figure 3 (second panel from the bottom), the H α EW (third panel from the bottom), and the magnetic field strength (top panel) folding with the 36.13-day period. The lower panel shows the g-band data of IRAS 17449+2320 from the ASAS SN survey folded with this period. The measurement uncertainties of both the intensity ratios and EWs did not exceed the symbol size. The magnetic field strengths were calculated from the wavelength difference of the split components of the N i 8703 Å line and converted into the field modulus using the effective Landé factor from Table 3 of [10].
Galaxies 13 00032 g004
Figure 6. An artistic interpretation of IRAS 17449+2320 in its current state. An Ap star with a tilted, oblique magnetic field forms a spot at the magnetic pole. The star is surrounded by a circumstellar disk. An sdO or sdB companion is located at a distant orbit. Spatial scales are arbitrary, and a circumbinary disk that contains dust emitting in the IR region is not shown.
Galaxies 13 00032 g006
Disclaimer/Publisher’s Note: The statements, opinions and data contained in all publications are solely those of the individual author(s) and contributor(s) and not of MDPI and/or the editor(s). MDPI and/or the editor(s) disclaim responsibility for any injury to people or property resulting from any ideas, methods, instructions or products referred to in the content.