Article

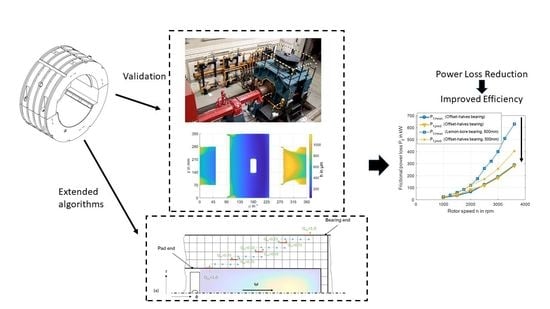
A Design for High-Speed Journal Bearings with Reduced Pad Size and Improved Efficiency

1
Institute of Tribology and Energy Conversion Machinery, Clausthal University of Technology, 38678 Clausthal-Zellerfeld, Germany
2
Product Development, Ruhr-University Bochum, 44801 Bochum, Germany
3
Gleitlagertechnik Weißbacher GmbH, 46519 Alpen, Germany
*
Author to whom correspondence should be addressed.
Lubricants 2022, 10(11), 313; https://doi.org/10.3390/lubricants10110313
Submission received: 30 September 2022 / Revised: 10 November 2022 / Accepted: 12 November 2022 / Published: 17 November 2022
(This article belongs to the Special Issue Friction and Lubrication of Sliding Bearings, Volume II)

Abstract

:
Improving efficiency is a general task in the design process of high-speed journal bearings. A specific fixed-pad bearing geometry featuring reduced pad length and additional design measures with the intention of reducing frictional power loss is investigated, experimentally and theoretically, for a journal diameter of 500 mm up to surface speeds of 94 m/s and unit loads of 5.0 MPa. To model fluid flow in the bearing outside the lubricant gap, an extension to Elrod’s cavitation algorithm based on assuming the inertia of fluid flow is proposed. Validation of the extended thermo-elasto-hydrodynamic lubrication (TEHL) model shows good agreement between measurement and prediction in wide operating ranges, however, with systematic tendencies of the remaining deviations. Furthermore, measured local pressure and film thickness distributions indicate a complex formation of cavitation with an influence of axial flow that is not covered by pure Couette-flow in the cavitation region. Measured as well as predicted data prove increased bearing efficiency for high rotor speeds. To provide understanding on the impact of the applied design measures improving efficiency, their combination is separated into the individual ones. Reduced axial and peripheral pad length both contribute almost equally to the reduction in power loss and improve its value by 37% compared to the standard design. Finally, further steps to deeper identify the behavior of the bearing are comprehensively discussed.

Graphical Abstract

1. Introduction

Maximizing the efficiency during operation is a general aim of the design procedure for high-speed journal bearings, especially when the bearings operate under similar conditions for a long period of time, such as in power generation applications. For this case, efficiency is generally defined based on the oil flow rate and the frictional power loss, as these two parameters are crucial for the size of the lube oil pumps and coolers that are required as auxiliary elements to ensure a safe and robust bearing operation. Oil flow rate and frictional power loss represent strongly coupled parameters according to the subsequent explanations. In the hydrodynamic regime, a reduction in the oil flow rate of an otherwise unmodified bearing design incorporates a decrease in the frictional power loss, as shown by different authors for journal and thrust bearings, e.g., [1,2,3,4,5]. If the state of lubrication does not change, this effect occurs primarily due to the rising temperature level in the bearing, accompanied by lower fluid viscosities. On the other hand, a transition of the lubrication conditions from flooded to starved, caused by reduced flow rates, increases the portion of partially filled gap regions with increasing homogenous gas phases and lower power loss [5].
For tilting-pad bearings, the prevention of friction at free rotating surfaces based on an evacuated bearing housing significantly reduces frictional power loss. In their experimental investigations, San Andres and Alcantar [1] detect a power loss reduction of about 40%, by changing lubrication conditions from flooded ones to the evacuated housing for a 101.8 mm four-pad bearing operating at 12,000 rpm. Stottrop et al. [6] observe the same magnitude of power loss decrease in their experimental investigation on a five-pad 500 mm bearing operating at 3000 rpm. Concordantly, both studies show no significant impact of the lubrication condition on measured maximum pad metal temperature. Aside from the type of lubrication, the distribution of the single tilting-pads and their length is a common design measure that aims for efficient operation, especially for large tilting-pad bearings applied in power generation [7,8,9]. The authors of [7,8,9] investigate large two- and three-pad tilting-pad journal bearings featuring space between the pads regions, with an angular span of up to approximately 60° in the case of the three-pad design [8,9] and more than 180° [7] for the two-pad design. These designs are applicable as the bearings operate in machines with high gravity loads due to heavy rotor weights. Consequently, reverse load directions can be neglected, and dynamic loads are low compared to the static ones. Fresh oil is supplied directly at the pad’s leading edge, and the non-flooded spaces between the pad regions do not significantly contribute to dissipation in the lubricant film. Additionally, the unloaded pads in [8,9] feature a reduced axial length compared to the lower two highly loaded pads. Specific strategies on the modeling of the pads with reduced axial length in TEHL analyses are not provided. Additionally, the reduction in power loss compared to standard bearing designs for this application is not quantified. Unlike the positive aspects of reduced power loss and improved efficiency, non-flooded designs can show undesirable subsynchronous shaft vibrations (SSV) [10]. These vibrations are known as “SSV hash”; they occur at low flow rates and show a broadband spectrum far below the synchronous frequency without significant peak amplitudes or critical amplitude level. San Andres et al. [1,11] observed SSV hash in their measurements for a flooded and an evacuated bearing at reduced flow rates. Moreover, they detected a significant reduction in direct damping coefficients for the evacuated bearing at low flow rates, which is also reported by Zemella et al. [12]. While the bearings show robust operating behavior for reduced flow rates in the above-mentioned studies, this quite rapidly occurring phenomenon defines a potential operating limit similar to the ones described by Leopard [13], because damping might become too low to ensure stable rotor operation.
While numerous investigations on high-speed tilting-pad journal bearings exist, less are available for fixed-pad bearings. Khatri and Childs [14] experimentally identify the impact of static load orientation on the operating behavior of a three-lobe bearing. The upper limit of the load and speed range is 2.3 MPa unit load and 70 m/s peripheral speed. With increasing load and speed, the influence of load orientation on maximum temperature decreases. Furthermore, load orientation influences the magnitude of stiffness and the level of orthotropy. Zhang et al. [15] study the operating behavior of a modified pocket bearing with a diameter of 160 mm up to surface speeds of 90 m/s and specific bearing loads of 4.0 MPa. Despite the potential of arising turbulent flow underlined by the authors, they do not observe a temperature reduction with increasing speed like that reported in Ref. [16]. Hopf and Schüler [16] investigate similar conditions, however, for a larger journal diameter of 500 mm accompanying a higher Reynolds numbers in the lubricant gap. Ref. [17] includes more detailed information and additional experimental results on the test bearings studied in [16].
This paper investigates the stationary operating behavior of a special fixed-pad bearing up to surface speeds of 94 m/s and unit loads of 5.0 MPa. The bearing features several design aspects commonly applied to tilting-pad bearings. These design properties aim to minimize frictional power loss, predominantly by reduced pad lengths that accompany the limited filled contact regions of the rotating shaft in the bearing domain. Novel theoretical model extensions are introduced to analyze the bearing operating behavior based on a TEHL-bearing code, in order to enable analyses of these bearing types. The impacts of the single design features are analyzed theoretically and experimentally. Measurements are conducted on a special test rig that enables the identification of detailed gap thickness and film pressure measurements in the entire lubricant film. Moreover, 124 thermocouples are applied to the bearing to investigate bearing temperature. The detailed comparison between simulation and measurements indicates several achievements, as well as further challenges in understanding the appropriate modeling of this special bearing design in a TEHL code. Additionally, the experimental results provide novel insights into the formation of cavitation in the lubricant gap.

2. Materials and Methods

2.1. Test Rig and Investigated Bearing

2.1.1. Test Bearing and Instrumentation

In this investigation, the test bearing is a two-lobe fixed-pad bearing with offset-halves bore (OHB) geometry and a nominal diameter of 500 mm. The bearing is typically applied under high mechanical loads and simultaneously high surface speeds, as they, for example, exist in low-pressure steam turbines or turbo gearboxes. Compared to the standard lube oil pocket position of an offset-halves bearing in Figure 1a, the inlets are shifted in the circumferential direction by about 40°, as depicted in Figure 1b. Consequently, the leading-edge film thickness of the sliding surface decreases, and the oil flow required to fill the lubricant gap is reduced. According to the results of Fuchs [18], the test bearing is mounted with a rotation angle of −35° to maximize the static load carrying capacity in the experimental investigation, as shown in Figure 1c. The overall view on the test bearing in Figure 2a shows the reduced axial length of the upper unloaded pad of the bearing, which is also depicted on the right side of Figure 2b. The upper pad length is 60% of the nominal bearing length. Additionally, the pad circumferential span is reduced by 34°. All non-lubricant film regions feature a distance of about 20 mm from the rotating journal, in order to ensure that the journal has a low fill factor and to prevent frictional power loss. The bearing features a jacking oil pocket in the load direction, which is visible on the right side of Figure 2b. During the experiments, a check valve locks this pocket. Table 1 includes the bearing geometry details and the characteristic boundary conditions of the investigation. Ref. [19] includes further details on the bearing design.
In summary, 124 type K thermocouples are applied in five layers to the test bearing. The left part of Figure 2b shows the layers denoted as A to E. The layers A and E are outside the top pad, and therefore, feature thermocouples only in the highly loaded pad. The middle part of Figure 2b exhibits the thermocouple locations in layers B and D that are same as in C, with the exception of the missing thermocouples at the pocket positions. All thermocouples applied outside of the pocket region feature a radial distance of 10 mm to the sliding surface of the 5 mm Babbitt layer.

2.1.2. Test Rig and Instrumentation

The measurements for this investigation are conducted on a test rig for large turbine bearings at Ruhr-University Bochum. The test rig was built in the 1980s to examine original sized bearings under operating conditions close to application. The shaft with a nominal diameter of 500 mm is driven by a 1.2 MW DC drive and can run up to 4000 rpm, depending on the frictional power loss in the entire drivetrain. The oil supply system allows a supply rate of 40 L/s of turbine oil ISO VG 32 for the test bearing with a maximum bearing length of 500 mm. Figure 3 shows the top view and the technical drawing of the test rig. The design of the test rig follows the floating bearing concept developed by Glienicke [20] with the test bearing (1) arranged symmetrically between two support bearings (3) on one test shaft (2). The support bearings are connected to the lower part of the test rig frame (4) and the test bearing is attached to a rigid octagonal frame (9). A pneumatic bellow (6) mounted on the upper part of the test rig frame (5) imposes static loads via a traverse (7) and two drawbars (8) by shifting the test bearing relative to the support bearings. Pressurizing the pneumatic bellow enables maximum vertical loads of 1.0 MN.
The hollow test shaft features an inner diameter of 150 mm. It is equipped with two capacitive distance sensors and two piezo-electric pressure sensors embedded in the shaft surface. The sensors are arranged in the mid plane of the shaft; they are shifted by 90° towards each other with the same type of sensors being 180° apart in the four bores in Figure 4a. The sensors are integrated to a mounting device that is fixed in these bores, as shown in Figure 4b. Finally, the surface of the mounting device is ground to smooth to the circular sliding surface profile of the shaft without steps at the interfaces. Wires transmit the sensor signals through the central bore, depicted in Figure 4a, to a slip-ring transmitter at the front end of the journal that connects the rotating system to the stator side. The redundant sensor system enables an accurate measurement of film thickness and film pressure. However, the capacitive proximity probes require knowledge of the dielectric constant of the intermedium. Therefore, the film thickness can only be measured reliably in areas where the gap is completely filled with oil. This is because the dielectricity of the gas phase significantly differs from the one of the oil and the local mass or volume ratio between oil and gas is unknown. By means of a shifting device, the rotating shaft, and thus, the sensor plane can be shifted axially over the entire bearing width during measurement. Both the fluid film thickness and pressure distribution are identified in a high-resolution two-dimensional (2D) data field with up to 4000 data values detected in the axial direction, depending on the rotor speed. A rotary decoder provides 240 data values in the circumferential direction independently of rotating frequency.

2.2. Theoretical Bearing Model

2.2.1. Basic Bearing Model and Numerical Implementation

The authors describe the applied thermo-hydrodynamic lubrication (THL) bearing model, its governing equations, and the validation for a large two-lobe bearing comprehensively in Refs. [21,22]. The descriptions in Refs. [21,22] include details on the numerical implementation and flow charts of the algorithms. Here, an overview of the key features is subsequently given to provide a general insight into the model basis. An extended and generalized Reynolds equation accounting for three-dimensional variable viscosity, turbulent flow, and cavitation describes the fluid flow in the lubricant gap.
x ( F 2 K x p x ) + z ( F 2 K z p z ) = U x [ Θ ( h F 1 F 2 ) ]
All subsequent investigations refer to steady-state operating conditions in the hydrodynamic regime. Therefore, the squeeze term and the impact of surface roughness are neglected in Equation (1). Numerical implementation is based on Elrod’s cavitation algorithm [23]. The parameter Θ represents the relation between the local density of the lubricant and the nominal lubricant density. Its variability is only applied for the cavitation region, assuming an incompressible fluid flow in the completely filled gap. As the density of the gas phase in the cavitation region is negligibly low compared to that of the lube oil, this value also represents the portion of the gap that is filled with oil. Subsequently, this parameter will be named as the fill factor of the gap. The solution of Equation (1) is determined in an iterative loop that is repeated until an equilibrium of the flow field is present for the given set of boundary conditions. During the iterative procedure, the parameters implicitly depending on the solution variables of Equation (1) are updated.
The fluid velocities derived from Reynolds Equation (1) are input parameters for the thermal bearing model. Bearing, journal, and lubricant film temperatures are evaluated using a three-dimensional coupled system of equations, assuming a constant temperature for the journal in the circumferential direction due to sufficiently high peripheral speeds. A steady, incompressible and laminar energy equation describes the local lubricant temperature T in the film, considering the impact of arising turbulent flow by eddy conductivity and eddy viscosity.
c ρ ( u T x + v T y + w T z ) = x ( λ T x ) + y ( λ T y ) + z ( λ T z ) + η [ ( u y ) 2 + ( w y ) 2 ]
Conjugate heat transfer boundary conditions are applied at the interfaces between the fluid and solid domain, imposing a temperature continuity between the lubricant film and the structure.
Viscosity η modification due to variable temperature is determined using the dynamic viscosity η 0 at reference temperature T 0 by the equation of Falz [24].
η ( T ) = η ( T 0 ) · ( T T 0 ) l
The exponent l is specific to the applied lubricant. The impact of pressure and shear rate on viscosity is neglected due to the investigated operating conditions with sufficiently low maximum film pressures and the non-additivated mineral oil that is used as a lubricant.
In extension of the model description in Ref. [21], three-dimensional thermally and mechanically induced structure deformation of the bearing is considered by a three-dimensional FE-code that is integrated into the THL-code, enabling a thermo-elasto-hydrodynamic lubrication (TEHL) analysis. The shaft deformation is simplified to the thermal and centrifugal expansion due to the limited pressure level and the comparably high structure stiffness. Internally, the TEHL-code performs a co-simulation between hydrodynamic and structure analysis. For this purpose, the hydrodynamic analysis provides fluid film pressure and the fluid-structure interface temperature as input parameters for the structure analysis. The film thickness used in the following hydrodynamic calculation includes the numerically damped structure deformation and provides new pressure and temperature distributions. This iterative procedure runs until the deviation of the exchanged parameters of two iterative steps drops below predefined limits.
The THD analysis applies a conservative cell-centered finite volume method. Assuming symmetry to the axial middle plane of the bearing, the lubricant gap is discretized with 2380 cells for the 2D Reynold equation. A mesh with 46,144 cells approximates the lubricant gap and the structure in the 3D thermal bearing model. The FE-structure model of the bearing features 18,460 elements. Table 2 includes the main structure properties and boundary conditions for the analysis.

2.2.2. Fluid Flow in the Bearing outside the Lubricant Gap

The extended and generalized Reynolds Equation (1) is valid to describe fluid flow in the entire sliding surface region of conventional fixed-pad bearings, with the exception of the lube oil pockets. These lube oil pockets exhibit a more complex flow that is generally simplified to a boundary condition in the solution of the Reynolds equation. In contrast to conventional bearing designs, the investigated offset-halves bearing cannot be described by a simple rectangular solution domain of the Reynolds equation. Figure 5 shows the test bearing, including its transformation to a two-dimensional plane. The numerical grid marked in red covers the entire bearing domain. Based on the assumptions in its derivation from Navier–Stokes equations, the Reynolds equation is valid on the two separated pads. Generally, fluid flow outside the pad region is complex, three-dimensional and two-phase. To model this flow in a numerically efficient manner in a T(E)HL-bearing code, the following assumptions are made to simplify numerical complexity:
  • The near-journal lubricant interacts with a large homogenous gas phase substituting the bearing’s sliding surface. Therefore, the radial gradient of fluid flow becomes small, and dissipation in this region can be neglected.
  • Due to inertia effects, the 2D fluid velocities in the peripheral and axial directions remain constant in magnitude and direction for oil leaving the pad. The interaction of the single streamlines outside the gap is not considered, even if they intersect.
  • Radial fluid flow due to centrifugal forces is neglected, as sufficiently high viscous forces remain present and provoke a journal near the oil flow. Consequently, a carry-over of oil leaving one of the pads only depends on the relation between the axial and peripheral fluid velocities calculated by the Reynolds equation.
The partial contradiction between assumption 2 and 3 is accepted, since there is insufficient knowledge about the detachment of the lubricant from the journal.
Elrod’s algorithm proposes a split of Equation (1), depending on the local assignment to the cavitation or full-film region.
Full-film   region :   x ( F 2 K x p x ) + z ( F 2 K z p z ) = U x ( h F 1 F 2 )
  Cavitation   region :   0 = U x [ Θ ( h F 1 F 2 ) ]
Consequently, exclusive Couette-flow exists in the cavitation region, according to Equation (5). However, number 2 of the above-defined assumption generally requires the modeling of an axial fluid velocity component in the unloaded regions adjacent to the lightly loaded pad and in the space between the pads regions.
According to assumption number 1, a partially filled gap is generated by assuming a film thickness outside the lubricant gap that is significantly higher than the one on the pads, but which is small enough to prevent numerical instabilities of the Reynolds equation. In order to keep the numerically efficient model of Elrod, the flow field evaluated based on Equation (5) has to be modified. For this purpose, the fluid velocity vectors of the lubricant side flow consisting of a peripheral component usf and axial component vsf are calculated at the reduced pad axial boundaries marked in red in Figure 6. These vectors define the streamlines, and therefore, additional fluid flow in Equation (5). Based on the fluid velocities, one can calculate the number of cells crossed by the lubricant in the circumferential direction until one element is crossed in the axial direction. The time t to cross the axial element length of Δz is defined by Equation (6).
t = Δ z v s f
At the same time, n cells of the length Δx are crossed in the peripheral direction.
n = u s f · t Δ x
This additional fluid flow can be distributed to the numerical grid defining sinks and sources in the solution domain of Equation (5), at the finite volume cells that are located at the interfaces where the streamline crosses the axial gridline. Figure 6 explains the basic idea of the algorithm and the distribution of oil flow to the numerical grid outside the lubricant gap by a simple example for a streamline with a nondimensional flow rate of Qax = 1.0 with n = 3.25, according to Equation (7). Green arrows signal axial flow rates and blue arrows represent peripheral ones. The interfaces marked in red where the flow crosses the axial boundaries of the cells shift by n cells in the direction of rotation from one to another lane in the axial direction. The green numbers in Figure 6a show the distribution of the axial flow rate to the respective cells. Figure 6b contains the same information for the peripheral flow rates. All unlabeled blue arrows represent peripheral flow rates of Qpe = 1.0. In the example, the lubricant side flow of the cell crosses the bearing end and becomes the direct side flow of the bearing. In the case of n = 3.75, the interface marked in red would be shifted by two additional cells, as shown in Figure 7a. A value of n > 3.75 leads at least to a partial carry-over of the pad side flow of this particular cell to the downstream pad. Starting with n = 4.0 in Figure 7b, a complete carry-over of lubricant side flow occurs for this particular case. Equation (8) provides the general criterion for a complete carry-over.
n x n z n
Here, nx is the number of cells in the peripheral direction and nz is the number of cells in the axial direction that are located outside the pad region and potentially pass by the fluid.
Figure 8 explains a further benefit of the algorithm. Figure 8a,b show predicted pressure and fill factor distributions assuming exclusive Couette-flow in the cavitation region. Figure 8c,d depict the same results by applying the above-described algorithm. Here, it must be noted that the absolute value of the fill factor in this region depends on the assumed film thickness used in the Reynolds equation. However, the main objective is to model oil flow correctly, and the specific amount of the additional gas phase is of no interest. The fill factor in Figure 8b shows that all pad side flow remains in the cells in the first axial plane outside the pad, provoking a focused carry-over of oil to the downstream pad and a physically inconsistent pressure distribution at its leading edge at ϕ = 90° in Figure 8a. On the contrary, the application of the new algorithm provides a distribution of the side flow outside the lubricant gap, according to the assumed streamlines in Figure 8d, accompanied by an inconspicuous and consistent leading-edge pressure distribution at the same location in Figure 8c.

3. Results

3.1. Validation

3.1.1. Characteristic Parameters of Operation

The previously described basic bearing model is comprehensively validated for conventional large two-lobe bearing by the authors in Ref. [21], using the experimental results of Hopf and Schüler [16,17]. The experimental data of the test bearing introduced in Figure 2 and Table 1 validate the extended TEHL model. For this purpose, a comparison of the characteristic parameters of the bearing operation is conducted for the entire hydrodynamic operating range of the bearing. A comparison of the measured data with the results of the non-enhanced model is omitted, since the evaluated parameters would mask model deficits caused by the previously described physical inconsistencies.
The measured and predicted minimum film thickness in Figure 9a show good agreement, especially with increasing bearing unit loads. While good correspondence for lower mechanical loads is achieved in the medium speed range for rotor speeds of 1000 rpm and 2000 rpm, deviations exist for 3000 rpm and 3600 rpm. According to Figure 9b, these discrepancies decrease with rising mechanical loads. While Δhmin = 13 µm (Δhmin,rel = 17%) exists at a unit load of 3.0 MPa at 3600 rpm, only Δhmin = 1.8 µm (Δhmin,rel = 5.1%) remains present if the load increases to 5.0 MPa. Concordantly, measurement and prediction show higher film thickness with increasing speed at a constant unit load. The predicted minimum film thickness is higher than the measured one in the entire operating range, and consistently, measured maximum film pressures in Figure 9c,d are slightly higher than the predicted ones. The maximum sensor temperature in Figure 10a is overpredicted with slightly changing levels. However, the general characteristics match well. In the case of the maximum rotor speed of 3600 rpm, the change of the characteristic between unit loads of 2.0 and 2.5 MPa concordantly exists in measurement and prediction. This phenomenon can be explained by the transition from turbulent to laminar flow in the region of maximum temperature, due to increasing mechanical load and decreasing film thickness [16]. Good agreement also exists for the comparison of the characteristics of frictional power loss in Figure 10b. The experimental results represent the calorimetrically determined power loss that is evaluated based on the lubricant flow rate Q and the temperature rise of the mean side flow temperature Tsf related to the lubricant supply temperature Tsup, according to Equation (9). Ref. [6] includes further details about this procedure.
P f = c · ρ · Q · ( T s f T s u p )
Due to the constant flow rate, the uncertainty of the measured power loss rises with decreasing rotor speeds, as the difference between supply and side flow temperature diminishes.
While the relative deviation of measured and predicted characteristic parameters partly exceeds 20% for lower unit loads at a certain rotor speed, it decreases with increasing load and is significantly lower than 10% in wide ranges of higher loads.

3.1.2. Local Distributions

The measured and predicted film pressure distributions for the maximum rotor speed of 3600 rpm and the unit load of 5.0 MPa in Figure 11a,b correspond well. The impact of the locked jacking oil pocket on the pressure characteristic is clearly visible as the area of nearly constant pressure in the center of the bearing at ϕ = 180°. Behind the jacking oil pocket, the measurement shows a higher gradient in the axial direction in Figure 11a, while a nearly constant pressure level is predicted for a length of approximately 100 mm in the region of maximum pressure in Figure 11b. For the quantitative comparison of local pressures, Figure 11c depicts experimentally and theoretically determined pressures in the axial center plane of the bearing. Generally, both pressure distributions match well, especially on the unloaded pad, starting with a constant ambient pressure level behind the lube oil pocket at 280°. A pressure build-up is observable between 0° and 50°. On the lower, highly loaded pad, deviations occur in the locked jacking oil pocket and in the region of maximum pressure. The latter difference consistently appears with the above-described differences of the pressure characteristic in the axial direction. Nearly the same tendencies of correspondence and discrepancies exist for the reduced load case with 2000 rpm at a unit load of 1.5 MPa in Figure 11d. The deviations in the maximum pressure region have the same origin explained for the maximum load case in Figure 11c. The pressure distribution in the axial direction located at the angular coordinate of the maximum film pressure in Figure 12 proves these descriptions.
The experimentally identified film thickness distribution in Figure 13a exhibits high gradients at the pads’ leading edge, and in the case of the upper pad in the axial direction throughout the entire angular pad span at the lateral ends of the sliding surface. These increases in film thickness are not related to a presence of an increasing lubricant gap but are induced by a disturbance of the oil film by cavitation. The gas phase changes the dielectricity of the lubricant, and therefore, modifies the signal of the capacitive proximity probes applied in the test rig that are calibrated for a homogenous liquid oil phase as dielectric substance. The high gradients at the lateral pad ends of the lower highly loaded pad only occur directly at the bearing end, predominantly due to the transition from the sliding surface to the chamfer located there. Generally, the predicted film thickness in Figure 13b shows a similar global characteristic as the measured data but does not show the above-described disturbances. The comparison of experimental and theoretical results for the axial center plane in Figure 13c and the reduced load in Figure 13d provides excellent agreement on the highly loaded pad. Deviations on the upper pad partly exist due to cavitation but can also originate in different deformation behavior.
The higher values of predicted maximum temperature compared to the corresponding experimental data in Figure 10 are again visible in the local temperatures in the axial center plane in Figure 14. While the overall characteristics of measured and predicted temperatures at the sensor positions match well, the following two major differences are present. First, the highest deviations of experiment and simulation exist for the two sensors at the trailing edge (TE) of the highly loaded pad, where ΔTsen,TE = 17 K are observed for the high load case (a) and ΔTsen,TE = 10 K are present for the lower case (b). Second, the predicted leading edge (LE) temperatures of both pads are higher than the experimental ones. For case (a), a difference of ΔTsen,LE = 6 K exists at the leading edge of the highly loaded pad. This value reduces to ΔTsen,LE = 3 K in case (b). The oil inlet model assumes a complete carry-over of hot oil from the trailing edge of the upstream pad to the leading edge of the downstream pad, where it enters the sliding surface as a mixture with the fresh oil supplied in the lube oil pocket. However, the investigated bearing features large space between the pads regions that might influence the carry-over procedure. Moreover, the specific geometric properties and complexity of the bearing modify heat flow in the shell, and these influences are partly not included in the heat conduction equation of the TEHL model.

3.2. Examination of Measured Local Distributions with Respect to Cavitation

Aside from the identification of film pressure and thickness, the data measured by the piezoelectric pressure and the capacitive proximity probes can be evaluated to identify possible cavitation regions. For this purpose, the comparison to predicted results is also used. Starting behind the lube oil pocket at the leading edge, the film pressure remains nearly equal to the ambient one on the upper pad for the high load case in Figure 15a, and it starts to increase at approximately ϕ = 0°. However, ambient pressure acts at the pad’s lateral end regions and not only on its axial edges. Additionally, isobaric lines in the pad region do not show the classical elliptical shape that is well known for hydrodynamic pressure distributions. In this concrete case, lines of equal film pressure tend to exhibit a trapezoidal shape. For the medium load case in Figure 15b, only a short angular span of nearly ambient pressure exists behind the lube oil pocket of the lightly loaded pad. The high-pressure region of the lower, highly loaded pad is not depicted with its concrete value levels in Figure 15, but the transition to the ambient pressure region can clearly be observed. Potential cavitation regions exist behind the lube oil pocket at the leading edge, and at the trailing edge of the pad with a higher share in terms of area in the case of the high-speed load case.
As already described for Figure 13a, Figure 16a shows high film thickness gradients in the axial direction and values above the chosen limit of 1200 µm at the leading edge region behind the lube oil pocket. In contrast to the medium load case in Figure 16b, these gradients remain present nearly until the trailing edge of the pad at ϕ = 45°. Low thermal and mechanical loads on the upper pad avoid attributing this phenomenon to deformations but point to cavitation as the cause of this behavior. On the highly loaded pad, both load cases show a significant increase in film thickness directly behind the lube oil pocket at the lateral bearing ends. This behavior can be attributed to a gas phase in this region, as deformation in this magnitude can be excluded here. At the trailing edge, film thickness values increase significantly too. This is more clearly observable in Figure 13c,d by a comparison to predicted film thickness values that exhibit much lower values for the lubricant gap. The predicted fill factors in Figure 17 support the analysis of measured pressure and film thickness distribution and its evidence on cavitation; however, the potential cavitation regions identified shortly behind the lube oil pockets near the axial bearing ends are not predicted by Elrod’s algorithm. The measurement data provide indications of cavitation areas with a larger local extent. However, they do not give a clear insight into the particular formation and morphology of cavitation in these areas. Streamlets with gas cavities, as measured by Heshmat [25] for journal bearings or Bulut et al. [26] in seals, cannot be proven.

3.3. Evaluation of Measures to Improve Efficiency

According to the description of the test bearing, its design intends to reduce frictional power loss at high-speed operation. To rate the success of the design measures and their impact on dissipation in the fluid film, a comparison to the measured and predicted results for modified bore geometries is conducted. Figure 18 shows a two-lobe lemon-bore bearing, experimentally investigated by Hopf and Schüler in Ref. [16]. Bearing geometry and operating boundary conditions are included in Table 3. The bearing was investigated on the same test rig with the same type of lube oil as the OHB test bearing in this study. The authors validated predictions for this type of bearing with the same code used in this study in Ref. [21].
At the maximum investigated rotor speed of 3600 rpm in Figure 19a, the two-lobe lemon-bore bearing exhibits a frictional power loss that is approximately 2.3 the one of the OHB test bearing. As the lemon-bore bearing features a length of 500 mm, an additional prediction for a linearly scaled geometry and oil flow rate of the OHB test bearing to a length of 500 mm and a flow rate of 650 L/min was performed. According to Figure 19a, the improvement of frictional power loss considering the modified bearing length reduces to a factor of 1.6, but it is still significant, as the absolute power loss reduction is about 225 kW. To understand the impact of the single design measures in more detail, Figure 19b includes variations of the bore geometry. The predicted power loss values show the results for the nominal test bearing geometry described by Table 1 as a lower limit, and bearing geometry without the reduced length and the spaces between pads as the upper limit. Here, the positions of the lube oil pockets remain unchanged. Only the axial length of the pocket in the upper pad is adjusted to the one of the lower pad for the case of unreduced pad length. For maximum speed, power loss increases by 37.2% if the reduction in the pad surface area is completely neglected. A separation of the two measures provides a comparable impact on power loss. While the simulation with reduced axial pad length and without the spaces between pads increases power loss by 18.8%, the one without reduced pad length and with spaces between the pads shows a 16.4% higher value. Note, both measures interact with each other, and therefore, the sum of both values is not equal to the 37.2% that is achieved if both measures are present simultaneously. This level of relative deviation starts at 2500 rpm and is significantly lower for rotor speeds below 2000 rpm. Consequently, the applied modifications of the conventional offset-halves geometry are suitable for high-speed applications, but their benefit for lower surface speeds is less significant. The presented measures to reduce power loss are not accompanied by higher maximum temperatures. On the contrary, the optimized bearing shows lower predicted maximum sensor temperatures than the variants without the spaces between pads or reduced axial pad length, as Figure 20 depicts for the comparison with the variant that neglects both design measures.

4. Discussion and Conclusions

This paper presents a comprehensive analysis of the operating behavior of a two-lobe offset-halves bearing. The bearing specific design mainly focusses on a reduction in frictional power loss that improves the bearing efficiency. For this purpose, a significant part of the bearing sliding surface is substituted by free areas that intend to provide negligible friction in its boundary layers, as the lubricant gap thickness expands by a factor in the range of 100 at its interfaces to the so-called free areas. Measured and predicted frictional power loss show very good agreement and prove the assumption by the proposed model extensions that frictional power loss in these free regions is insignificant. The high relation between lubricant film thickness and the partially filled distance between rotor and stator in the free regions obviously lead to negligible power loss in the engineering judgement, because a thin boundary layer of oil at the journal surface is carried over a large gas phase. However, a theoretical description of the transition between the described state and a boundary layer or thin-film flow that incorporates considerable internal fluid film friction is complex and requires further detailed experimental and theoretical investigations. Here, optical measurements that provide information about the general characteristics of the fluid flow represent a suitable approach. The general design approach of reduced pad area proves meaningful in comparison of measured and predicted data for the power loss of different bearing designs. For the test bearing, a 37.2% improvement of frictional power loss is theoretically determined.
Moreover, the validation of the applied theoretical bearing model shows higher measured maximum temperatures in the entire speed range, even if higher minimum film thickness and lower maximum pressures are predicted. Here, the assumption of a complete carry-over of the lube oil in the space between the pads regions appears doubtful. The lubricant transported in the boundary layer experiences a centrifugal force in this interruption of the sliding surface, which causes a radial flow depending on the relation to the viscous forces. The application of the transition criterion for the isoviscous boundary layer flow according to Ref. [27] provides turbulent flow, and therefore, radial flow components in the entire space between the pads regions. However, fluid flow in the space between the pads regions is a rather complex two-phase one that also needs to be comprehensively studied before substantial statements on its character can be derived and considered in bearing calculations. Again, optical measurements can be a way to identify the formation of the near-journal flow in the space between the pads regions.
In addition to the described two-phase flow outside of the bearing’s sliding surface, cavitation regions occur in the lubricant film. Here, the signal of the capacitive proximity probes shows increases in the film thickness that can be more likely attributed to a change of the dielectricity of the fluid between the two sliding surfaces than to an increase in the measured distance between journal and bearing. A part of these potential cavitation regions emerges in agreement with the prediction. However, additional regions can be observed at the lateral bearing ends shortly behind the lube oil pockets located at the leading edge of the pads. A more distinct evaluation of the cavitation regions in the thin-film region could be achieved by the relation of the capacitive sensor signal to a gap measurement that is not influenced by the fluid dielectricity. An additional application of eddy current proximity probes represents such a possibility.
The bearing design is an optimization to improve stationary bearing operating performance under high static loads, with a predefined direction such as gravity loads. Due to the asymmetric design of the pads, the machine should exclude reverse load cases with high mechanical forces. Moreover, the dynamic behavior of the proposed design needs to be investigated if the bearing has to provide damping in critical rotor dynamic applications.

Author Contributions

Conceptualization, methodology, T.H., D.V., S.W., M.S. and A.E.; software, T.H. and D.V.; experiments, M.S. and A.E.; investigation, writing, and visualization, T.H., D.V., S.W., M.S., A.E. and C.W.; supervision and funding acquisition, C.W., B.B. and H.S. All authors have read and agreed to the published version of the manuscript.

Funding

This research was funded by the German Federal Ministry of Economic Affairs and Climate Action. The financial support was assigned by the Industrial Research Association (AiF e. V.) in project number IGF 21389 N.

Data Availability Statement

Not applicable.

Conflicts of Interest

The authors declare no conflict of interest.

Nomenclature

Bbearing length
clubricant specific heat
CRradial clearance
Dbearing inner diameter
F0, F1, F2viscosity factors
Fscstatic bearing force
hfilm thickness
Kx, Kzturbulence factors
nrotor speed
ppressure
pqunit load p q = F s c / ( B · D )
Pffrictional power loss
Qlubricant flow rate
Ttemperature
T0reference temperature
Tsfmean temperature of the lubricant side flow rate
Tsuplubricant supply temperature
Usurface speed
u, v, wflow velocities
usf, wsfvelocities of the lubricant side flow
x, y, zCartesian coordinates
Δx, Δzcell length
Θlubricant density ratio, gap fill factor
ηlubricant dynamic viscosity
η0lubricant dynamic viscosity at reference temperature T0
λlubricant conductivity
ρlubricant density
ϕperipheral/angular coordinate

References

  1. San Andres, L.; Alcantar, A. Effect of reduced oil flow rate on the static and dynamic performance of a tilting pad journal bearing running in both the flooded and evacuated conditions. In Proceedings of the ASME Turbo Expo 2022: Turbomachinery Technical Conference and Exposition, Rotterdam, The Netherlands, 13–17 June 2022. [Google Scholar] [CrossRef]
  2. Hagemann, T.; Zemella, P.; Pfau, B.; Schwarze, H. Experimental and theoretical investigations on transition of lubrication conditions for a five-pad tilting-pad journal bearing with eccentric pivot up to highest surface speeds. Tribol. Int. 2020, 142, 106008. [Google Scholar] [CrossRef]
  3. Gardner, W.W. Performance tests on six-inch tilting pad thrust bearings. J. Lubr. Technol. 1975, 97, 430–436. [Google Scholar] [CrossRef]
  4. Mitsui, J.; Hori, Y.; Tanaka, M. Thermohydrodynamic analysis of cooling effect of supply oil in circular journal bearing. J. Lubr. Technol. 1983, 105, 414–420. [Google Scholar] [CrossRef]
  5. Heshmat, H.; Pinkus, O. Performance of starved journal bearings with oil ring lubrication. J. Tribol. 1985, 107, 23–31. [Google Scholar] [CrossRef]
  6. Stottrop, M.; Buchhorn, N.; Bender, B. Experimental Investigation of a Large Tilting-Pad Journal Bearing-Comparison of a Flooded and Non-Flooded Design. Lubricants 2022, 10, 83. [Google Scholar] [CrossRef]
  7. Sano, T.; Magoshi, R.; Shinohara, T.; Yoshimine, C.; Nishioka, T.; Tochitani, N.; Sumi, Y. Confirmation of performance and reliability of direct lubricated tilting two pads bearing. Proc. Inst. Mech. Eng. Part J J. Eng. Tribol. 2015, 229, 1011–1021. [Google Scholar] [CrossRef]
  8. Zhang, F.; Ouyang, W.; Hong, H.; Guan, Y.; Yuan, X.; Dong, G. Experimental study on pad temperature and film thickness of tilting-pad journal bearings with an elastic-pivot pad. Tribol. Int. 2015, 88, 228–235. [Google Scholar] [CrossRef]
  9. Mermertas, Ü.; Hagemann, T.; Brichart, C. Optimization of a 900 mm tilting-pad journal bearing in large steam turbines by advanced modeling and validation. J. Eng. Gas Turbines Power 2019, 141, 021033. [Google Scholar] [CrossRef]
  10. DeCamillo, S.; He, M.; Cloud, C.H.; Byrne, J. Journal Bearing Vibration and SSV Hash. In Proceedings of the 37th Turbomachinery Symposium, The Turbomachinery Laboratory, Texas A&M University, Houston, TX, USA, 7–11 September 2008. [Google Scholar] [CrossRef]
  11. San Andrés, L.; Toner, J.; Alcantar, A. Measurements to Quantify the Effect of a Reduced Flow Rate on the Performance of a Tilting Pad Journal Bearing With Flooded Ends. J. Eng. Gas Turbines Power 2021, 143, 111012. [Google Scholar] [CrossRef]
  12. Zemella, P.; Hagemann, T.; Pfau, B.; Schwarze, H. Identification of dynamic coefficients of a five-pad tilting-pad journal bearing up to highest surface speeds. J. Eng. Gas Turbines Power 2021, 143, 081013. [Google Scholar] [CrossRef]
  13. Leopard, A.J. Tilting Pad Bearings-Limits of Operation. In Proceedings of the ASLE 30th Annual Meeting, Atlanta, GA, USA, 5–8 May 1975. [Google Scholar]
  14. Khatri, R.; Childs, D.W. An experimental study of the load-orientation sensitivity of three-lobe bearings. J. Eng. Gas Turbines Power 2015, 137, 042503. [Google Scholar] [CrossRef]
  15. Zhang, C.; Yi, Z.; Zhang, Z. THD Analysis of High Speed Heavily Loaded Journal Bearings Including Thermal Deformation, Mass Conserving Cavitation, and Turbulent Effects. J. Tribol. 2000, 122, 597–602. [Google Scholar] [CrossRef]
  16. Hopf, G.; Schüler, D. Investigations on large turbine bearings working under transitional conditions between laminar and turbulent flow. J. Tribol. 1989, 111, 628–634. [Google Scholar] [CrossRef]
  17. Hopf, G. Experimental Investigation of Large Turbine Bearings. Ph.D. Thesis, Ruhr University Bochum, Bochum, Germany, 1989. (In German). [Google Scholar]
  18. Fuchs, A. Non-Stationary Operation of High-Speed Journal Bearings. Ph.D. Thesis, TU Braunschweig, Braunschweig, Germany, 2002. (In German). [Google Scholar]
  19. Weißbacher, G. Hydrodynamic Plain Bearing and Method of Lubricating and Cooling the Bearing. U.S. Patent US2003/0081867A1, 1 May 2003. [Google Scholar]
  20. Glienicke, J. Experimental Investigation of the Stiffness and Damping Coefficients of Turbine Bearings and their Application to Instability Prediction. Proc. Inst. Mech. Eng. 1966, 181, 116–129. [Google Scholar] [CrossRef]
  21. Hagemann, T.; Kukla, S.; Schwarze, H. Measurement and prediction of the static operating conditions of a large turbine tilting-pad bearing under high circumferential speeds and heavy loads. In Proceedings of the ASME Turbo Expo, San Antonio, TX, USA, 3–7 June 2013. [Google Scholar] [CrossRef]
  22. Hagemann, T.; Schwarze, H. A model for oil flow and fluid temperature inlet mixing in hydrodynamic journal bearings. J. Tribol. 2019, 141, 021701. [Google Scholar] [CrossRef]
  23. Elrod, H.G. A Cavitation Algorithm. J. Lubr. Technol. 1981, 103, 350–354. [Google Scholar] [CrossRef]
  24. Falz, E. Grundzüge der Schmierungstechnik; Springer: Berlin/Heidelberg, Germany, 1931. [Google Scholar]
  25. Heshmat, H. The mechanism of cavitation in hydrodynamic lubrication. Tribol. Trans. 1991, 34, 177–186. [Google Scholar] [CrossRef]
  26. Bulut, D.; Bader, N.; Poll, G. Cavitation and film formation in hydrodynamically lubricated parallel sliders. Tribol. Int. 2021, 162, 107113. [Google Scholar] [CrossRef]
  27. Schlichting, H.; Gersten, E. Boundary Layer Theory, 10th ed.; Springer: Berlin/Heidelberg, Germany, 2006. [Google Scholar]
Figure 1. (a) offset-halves bearing, (b) test bearing, (c) test bearing including mounting angle.
Lubricants 10 00313 g001
Figure 2. Test bearing: (a) overall view, (b) temperature probe positions.
Lubricants 10 00313 g002
Figure 3. Test rig: (a) top view, (b) technical drawing; test rig parts: test bearing (1), shaft (2), support bearings (3), lower part of the test rig frame (4), upper part of the test rig frame (5), pneumatic bellow (6), traverse (7), drawbars (8), rigid frame (9), vibration generators (10) [6].
Lubricants 10 00313 g003
Figure 4. (a) Test shaft and (b) principle of sensor arrangement.
Lubricants 10 00313 g004
Figure 5. Correlation between test bearing and numerical grid.
Lubricants 10 00313 g005
Figure 6. Example for (a) axial and (b) circumferential flow rate distribution (n = 3.25).
Lubricants 10 00313 g006
Figure 7. Flow rate distributions for (a) n = 3.75 and (b) n = 4.0.
Lubricants 10 00313 g007
Figure 8. (a,c) Pressure and (b,d) fill factor distribution without (a,b) and with (c,d) the extended model (n = 3000 rpm, pq = 0.5 MPa).
Lubricants 10 00313 g008
Figure 9. Measured and predicted (a,b) minimum film thickness and (c,d) maximum film pressure.
Lubricants 10 00313 g009
Figure 10. Measured and predicted (a) maximum sensor temperature (b) frictional power loss.
Lubricants 10 00313 g010
Figure 11. (a) Measured and (b) predicted pressure distribution and (c) comparison of the results in the axial middle plane (n = 3600 rpm, pq = 5.0 MPa), and (d) comparison for reduced load (n = 2000 rpm, pq = 1.5 MPa).
Lubricants 10 00313 g011
Figure 12. Measured and predicted pressure distribution in axial direction at maximum film pressure position ((a), n = 3600 rpm, pq = 5.0 MPa; (b) n = 2000 rpm, pq = 1.5 MPa).
Lubricants 10 00313 g012
Figure 13. (a) Measured and (b) predicted film thickness distribution and (c) comparison of the results in the axial middle plane (n = 3600 rpm, pq = 5.0 MPa), and (d) comparison for reduced load (n = 2000 rpm, pq = 1.5 MPa).
Lubricants 10 00313 g013
Figure 14. Measured and predicted pad metal temperatures in the axial middle plane ((a) n = 3600 rpm, pq = 5.0 MPa; (b) n = 2000 rpm, pq = 1.5 MPa).
Lubricants 10 00313 g014
Figure 15. Measured low-level pressure distributions ((a) n = 3600 rpm, pq = 5.0 MPa; (b) n = 2000 rpm, pq = 1.5 MPa).
Lubricants 10 00313 g015
Figure 16. Measured film thickness ((a) n = 3600 rpm, pq = 5.0 MPa; (b) n = 2000 rpm, pq = 1.5 MPa).
Lubricants 10 00313 g016
Figure 17. Predicted fill factor distributions ((a) n = 3600 rpm, pq = 5.0 MPa; (b) n = 2000 rpm, pq = 1.5 MPa).
Lubricants 10 00313 g017
Figure 18. Two-lobe fixed-pad bearing (TLB), according to [16].
Lubricants 10 00313 g018
Figure 19. (a) Measured and predicted frictional power loss (OHB-350, pq = 1.0 MPa, Tsup = 50 °C; OHB-500 and TLB-500, pq = 0.0 MPa, Tsup = 45 °C); (b) predicted frictional power loss for different geometries (OHB-350, pq = 1.0 MPa, Tsup = 50 °C).
Lubricants 10 00313 g019
Figure 20. Predicted maximum sensor temperatures (OHB-350, Tsup = 50 °C).
Lubricants 10 00313 g020
Table 1. OHB-350 test bearing parameters.
ParameterValue
Geometrical properties
Nominal diameter, mm500
Outer bearing diameter, mm800
Bearing width (upper/lower pad), mm210/350
Lube oil pocket width (upper/lower pad), mm220/334
Angular pad span (starting at pocket trailing edge), °136.6
Angular pocket span, °6.9
Radial clearance, µm300
Preload0.43
Thickness of the Babbitt layer, mm5
Static analysis parameters
Specific bearing load, MPa0–5.0
Rotational speed, rpm500–3600
Lubricant supply temperature, °C50
Lubricant properties
Lubricant ISO VG 32
Lubricant density kg/m³865 @ 40 °C
Lubricant specific heat capacity, kJ/(kg∙K)2.0 @ 20 °C
Lubricant thermal conductivity, W/(m∙K)0.13
Falz exponent2.083
Table 2. Parameters of the structure model.
ParameterValue
Material properties
Young’s modulus of Babbitt coating, MPa57,000
Linear expansion coefficient of Babbitt coating, 10−6/K21
Young’s modulus bearing and journal material, MPa210,000
Linear expansion coefficient of bearing and journal material, 10−6/K11
Thermal conductivity of Babbitt, shell, and journal material, W/(m∙K)50
Heat transfer boundary conditions
Heat convection coefficients of the bearing free surfaces, W/(m2∙K)50
Ambient temperature, °C60
Table 3. Two-lobe lemon-bore bearing parameters [16,17].
ParameterValue
Geometrical properties
Nominal diameter, mm500
Outer bearing diameter, mm800
Bearing width, mm500
Lube oil pocket width, mm470
Angular pad span, °150
Angular pocket span, °30
Radial clearance, µm300
Preload0.8
Static analysis parameters
Specific bearing load, MPa0
Rotational speed, rpm500–3600
Lubricant supply temperature, °C45
Publisher’s Note: MDPI stays neutral with regard to jurisdictional claims in published maps and institutional affiliations.

