Article

Deformation Behavior of Crystalline Cr–Ni Multilayer Coatings by Using Molecular Dynamics Simulation

Department of Mechanical Engineering, Yonsei University, Seoul 03722, Republic of Korea
*
Author to whom correspondence should be addressed.
Lubricants 2022, 10(12), 357; https://doi.org/10.3390/lubricants10120357
Submission received: 28 November 2022 / Accepted: 7 December 2022 / Published: 9 December 2022
(This article belongs to the Special Issue Friction and Wear of Coatings/Films)

Abstract

:
This work shows the atomic scale deformation behavior of crystalline multilayer coating comprising up to five Cr and Ni layers. A molecular dynamics simulation was conducted to visualize the atomic scale behavior of the multilayer during indentation/unloading and scratch. Normal and shear directional forces were recorded to compare repulsion and friction forces between the multilayer models during the indentation/unloading and scratch simulations. Dislocation lines within the layers were quantified to understand the deformation behavior of each model. Atomic scale deformation and dislocation lines after the indentation and scratch were visualized. Generation and movement of a single dislocation line during the indentation simulation were also visualized within a few picoseconds. The repulsion and friction forces of the five-layer model showed the lowest values among the models. The unloading stiffness of the five-layer model was calculated to be the lowest among the models. The amount of plastic deformation and the wear volume of the one-layer model after the indentation and scratch was calculated to be the highest among the models. The number of dislocation lines of the five-layer model showed an increasing trend during the indentation and scratch. The highest dislocation density of the five-layer model might aid in an enhancement of resistance to the plastic deformation to reduce the wear volume when scratched.

1. Introduction

All mechanical components involving contact and sliding motion experience wear phenomena that determine the system’s reliability and lifetime. It is beneficial to reduce the wear to extend the lifetime and maintain the designated performance of mechanical systems [1,2]. Recently, coating technology is proceeding to utilize two or more materials to overcome the limitation on the properties of a single material and to obtain additional functionalities such as transparency, flexibility, and corrosion resistivity [3,4]. The coatings consisting of multiple materials are mainly in the form of multilayer, composite, and those containing nanomaterials. Among those coatings, multilayer coatings have been developed to have nanoscale layer thickness to improve mechanical and tribological properties [3,5,6,7,8,9]. It has been reported that the ratio of hardness to elastic modulus is one of the important values that determine the wear resistance of the coating, and multilayer coatings are found to be beneficial in achieving a higher ratio of hardness to elastic modulus than those comprising a single material [3,6,7,10]. For example, the multilayer coatings adopting high hardness materials such as diamond-like carbon, TiN, and WC as layers have been reported to have a reduced elastic modulus and excellent hardness [3,8,10].
Multilayer coatings exhibit additional advantages due to their layer structure [3,11,12]. Specifically, it is known that defects such as cracks and dislocations cannot propagate or move across the layer interface or grain boundary. This is because each layer or grain consists of different lattices or crystallographic directions. In addition, though the thickness of the individual layer is in the range of a few to a few tens of nanometers, the structure partially crystallizes to form grains, rather than remaining as a perfect amorphous structure [13,14]. Thus, it would be important to analyze the generation and movement of dislocations within the layers when plastic deformation occurs. Nevertheless, the phenomenon is hard to observe experimentally because the thickness of a layer is generally under a few tens of nanometers, and it is challenging to investigate deformation behavior during tribological tests simultaneously.
A few attempts to observe the nanoscale deformation behavior of multilayer coatings, whose thicknesses are in the range of a few nanometers, have been reported. Bhattacharyya et al. reported the nanoscale deformation behaviors of Al-TiN, Cu-Nb, and Cu-Ni multilayers by using transmission electron microscopy (TEM) to directly observe bending of layers, change in layer thickness, change in crystallographic orientation of grains, and shear bands when indented. They claimed that a part of the multilayer coatings showed shear bands with layer offset, and significant changes in layer thickness were found in the subsurface region. In addition, they reported that the crystallographic changes occurred near the surface based on selected area diffraction pattern (SADP) results [15,16]. However, experimental limitations still exist, because the SADP does not show a clear difference between the patterns before and after the indentation, and the defects inside of the multilayer coatings are not able to be quantified by the TEM or SADP images.
Another methodology to characterize the generation, movement, and piling up of dislocations is a dislocation dynamics (DD) simulation. The motion and interactions between the dislocations can be simulated by DD to obtain an insight into the variation in mechanical properties of the material during plastic deformation [17]. In this simulation, forces and velocities of each degree of freedom are time-integrated for every timestep to update the position of dislocation lines and plastic strain. To calculate a unit force exerted on a dislocation, the Peach–Koehler equation is generally used [18]. Using DD simulation, Akasheh et al. reported representative dislocation behaviors at layer interfaces. The authors contributed to the investigation of the hardening effect induced by the interactions between the line defects at the interfaces inside of the Cu–Ni metallic multilayer structure. They reported that the strength of the system was increased about 1.5-fold over that of free threading because a perpendicularly bent dislocation remained after the bypassing process [19]. The other reported works regarding DD simulation of multilayers also include various cases of dislocations near interfaces within the multilayer structures, and their behaviors in each case [20,21,22,23]. These studies mostly concentrated on the phenomena that occur at the interface rather than quantifications of defects inside of each layer. In this regard, though it is able to obtain an insight into deformation behaviors and hardening effects of the multilayer with respect to the advancement of dislocations, it does not seem straightforward to estimate defect information inside of an entire layer when a plastic deformation is promoted by external forces in normal and shear directions.
A report by Yang et al. regarding molecular dynamics (MD) models of AlCoCrFe alloyed coating and pristine Al showed mechanical and tribological characteristics by indentation and scratch simulations. The authors reported the enhanced Young’s modulus and hardness of the alloyed coating and its resultant scratch resistance compared to those of Al by referring to reduced atomic strain and total length of dislocations at the same simulation conditions [24]. However, dislocations inside the coating were analyzed only at the end of the scratch. On the other hand, several studies have been reported regarding the MD simulations of the nanoindentation on laminated structures. Wu et al. conducted an MD simulation of nanolaminate composites and reported that the nucleation and extinction of dislocations in the crystalline structure underneath the amorphous layer were observed near the indented regions. They claimed that the change in the dislocation lines was associated with the activation of the shear transformation zone, which occurred by the indentation [25]. Another report by Fang et al. showed a detailed description of the deformation behavior of a multilayered film by using MD simulation. The authors demonstrated a plastic deformation of the Al–Ni multilayer structure by visualizing the slip phenomenon during the indentation [26]. Though these studies showed detailed descriptions of the plastic deformation of multilayer structures, there were limitations because the studies had no variation in the number of layers. Moreover, the other studies regarding the nanoindentation on multilayer structures mostly concentrated on the effect of layer interfaces on the deformation mechanism [27,28,29,30]. Though the studies reported by Fu et al. and Zhao et al. showed the layer effects on the deformation behaviors of crystalline multilayer structures during the nanoindentation, the results did not include the deformation under a shear motion of the counter surface [31,32]. Therefore, there still lacks a detailed analysis of dislocation changes under the circumstances of loading and scratching to study layer effects on the resistance of the plastic deformation of multilayer coatings.
In this work, Cr and Ni were selected as the coating components because Cr–Ni multilayer coating and the alloys including them have been reported to exhibit great tribological properties at elevated temperatures and corrosion resistance, being utilized as materials for aerospace and dental applications [33,34,35]. In particular, the multilayer form was reported to have superior anti-corrosive characteristics owing to the reduced defects inside of the metallic material [36,37]. Thus, the mechanism of deformation should be further studied to fully utilize the metallic multilayer coatings for the mechanical components driven in harsh environments. To understand the deformation behavior and generation of dislocations of multilayer coatings according to the number of layers, MD simulations were conducted on the multilayer coatings comprising crystalline Cr and Ni. The dislocation line is evidence that the atomic lattice structure is being deformed, and it is one of the most important factors in the wear phenomenon of the coating because its movement is the slip mechanism in which permanent deformation occurs most easily. Thus, tracking the generation and movement of dislocation lines with respect to the number of layers is needed to understand the fundamental wear mechanism of multilayer coatings. To generate the line defects inside of the coatings, indentation and scratch simulations were conducted on each model. The models contained approximately one million atoms in the system, which were close to the experimental scale with atomic force microscopy. During the indentation, unloading, and scratch simulations, dislocation lines were quantified with respect to the indentation depth or scratch distance. Force–displacement (F–D) curves were obtained to compare normal and shear directional forces between the models. Cross-sections of each model after the indentation and scratch were visualized to understand the layer deformation. The results of this work are expected to exhibit the advantages of layered structures on the amount of deformation when indented or scratched by analyzing the dislocation lines quantitatively. Further, an understanding of the deformation mechanism of a multilayer coating would extend the usage of Cr–Ni multilayers for various conditions.

2. Simulation Details

2.1. Modeling and Computation

Multilayer coatings with different numbers of layers were modeled to compare the layer effect on the generation, development, and movement of defects inside the crystalline layers. A large-scale atomic/molecular massively parallel simulator (LAMMPS) was utilized to conduct indentation and scratch simulations for each model [38]. The multilayer coatings were modeled with the overall size of approximately 40 × 20 × 13 nm3, as shown in Figure 1. The total thickness of ~13 nm was uniformly divided to each layer for three- and five-layer models, as shown in Figure 1b,c. The radius of the rigid hemispheric tip was set as 5 nm. The radius was chosen to imitate the radius of curvature of typical AFM tips, while the shape was modeled as a simple hemisphere in order to exclude unnecessary factors that may affect the deformation behavior significantly. By referring to the design strategy of multilayer coating, the soft Ni layer was arranged between the Cr layers to enhance the flexibility, and the surface was covered by the Cr layer to protect the entire coating from severe abrasive wear [3,5]. Cr layers were modeled as a body-centered cubic (BCC) structure with a lattice constant of 0.291 nm, while Ni layers were modeled as a face-centered cubic (FCC) structure with a lattice constant of 0.352 nm [39]. The planes at the interfaces were BCC (001) and FCC (001) for Cr and Ni layers, respectively. Among the atoms in the Cr layer at the bottom, the lowermost atoms with a thickness of two-unit cells were set as rigid, as shown by the red atoms in Figure 1. Boundaries in directions other than the thickness direction were set as periodic for all models (X and Y directions in Figure 1d). Due to the periodic boundaries, the model lengths in the X and Y directions were determined to be a common multiple of the lattice constants of Cr and Ni structures. Angular-dependent potential, which describes the angular dependence of directional d-bonding of Cr BCC structure with more accuracy, was used for the interactions between Cr–Cr, Ni–Ni, and Cr–Ni [39]. Interactions between the atoms in the Si indenter tip and the atoms in the layers (Si–Cr or Si–Ni) were described by 12-6 Lennard-Jones (L-J) potential calculated by the Lorentz–Berthelot mixing rule because the pairs were not bonded [40,41,42,43]. The cutoff distance for the L-J potential was set as 1.0 nm. Though several studies have been reported on atomic simulations, including the atmospheric circumstance or liquid/solvent [44,45], the models were simulated in a vacuum because the Cr–Ni multilayer coating is reported to have corrosion resistance [33].
On the basis of a Nosé–Hoover thermostat, a canonical ensemble was used during relaxation, indentation, and scratch simulation for all models [46]. After allocating the initial speed of each atom with Gaussian distribution, the temperature of the entire system was maintained at 300 K except for the atoms set as rigid. Since the simulation includes indentation and scratch, the extra energy was input into the system. However, the system temperature was controlled to be approximately 300 K by extracting the energy from individual atoms. The force data during the indentation and scratch were calculated by summing the forces experienced by all the atoms comprising the indenter tip. During the simulations, force data in X and Z directions and dump files were recorded periodically. Since the number of atoms of the model was approximately one million, a parallel computation system was required. In this work, a total of 512 cores were utilized for each simulation to accelerate computation speed.

2.2. Simulation Procedure

The geometry of multilayer models was optimized by adjusting the interlayer distance between the Cr and the Ni layers. Since the interlayer distance considerably affects the total potential energy of the entire model, it was needed to analyze the total energy with respect to the distance. Based on the interlayer distance value that exhibits the minimum energy, the geometries of the multilayer models were revised. Then, the simulations of all three models were conducted in the following procedures: relaxation, indentation, unloading, and scratch. All models were relaxed before indentation simulations for 100 ps at 300 K with the canonical ensemble. After the relaxation, the models were indented up to 50% of their total thicknesses for the −Z direction in Figure 1d. At the moment of every 10% indentation depth, all data of each model were recorded to restart the unloading and scratch simulations from those timesteps. Scratch simulations were conducted from the indentation depth of 10% and 20% of the total thickness with a distance of 20 nm for the +X direction in Figure 1d. Unloading simulations were started from each 10% indentation depth from 10% to 50% of the total thickness. The movement of the rigid indenter was maintained at the constant speed of 0.05 Å/ps (5 m/s) for the indentation, scratch, and unloading. The moment when the interatomic distance between the Cr and Si atoms became the minimum L-J potential was regarded as the indentation depth of zero. To visualize and analyze all simulation procedures and results, including dislocation lines, The Open Visualization Tool was utilized [47,48,49].

3. Results and Discussion

3.1. Deformation Behavior during Indentation and Scratch

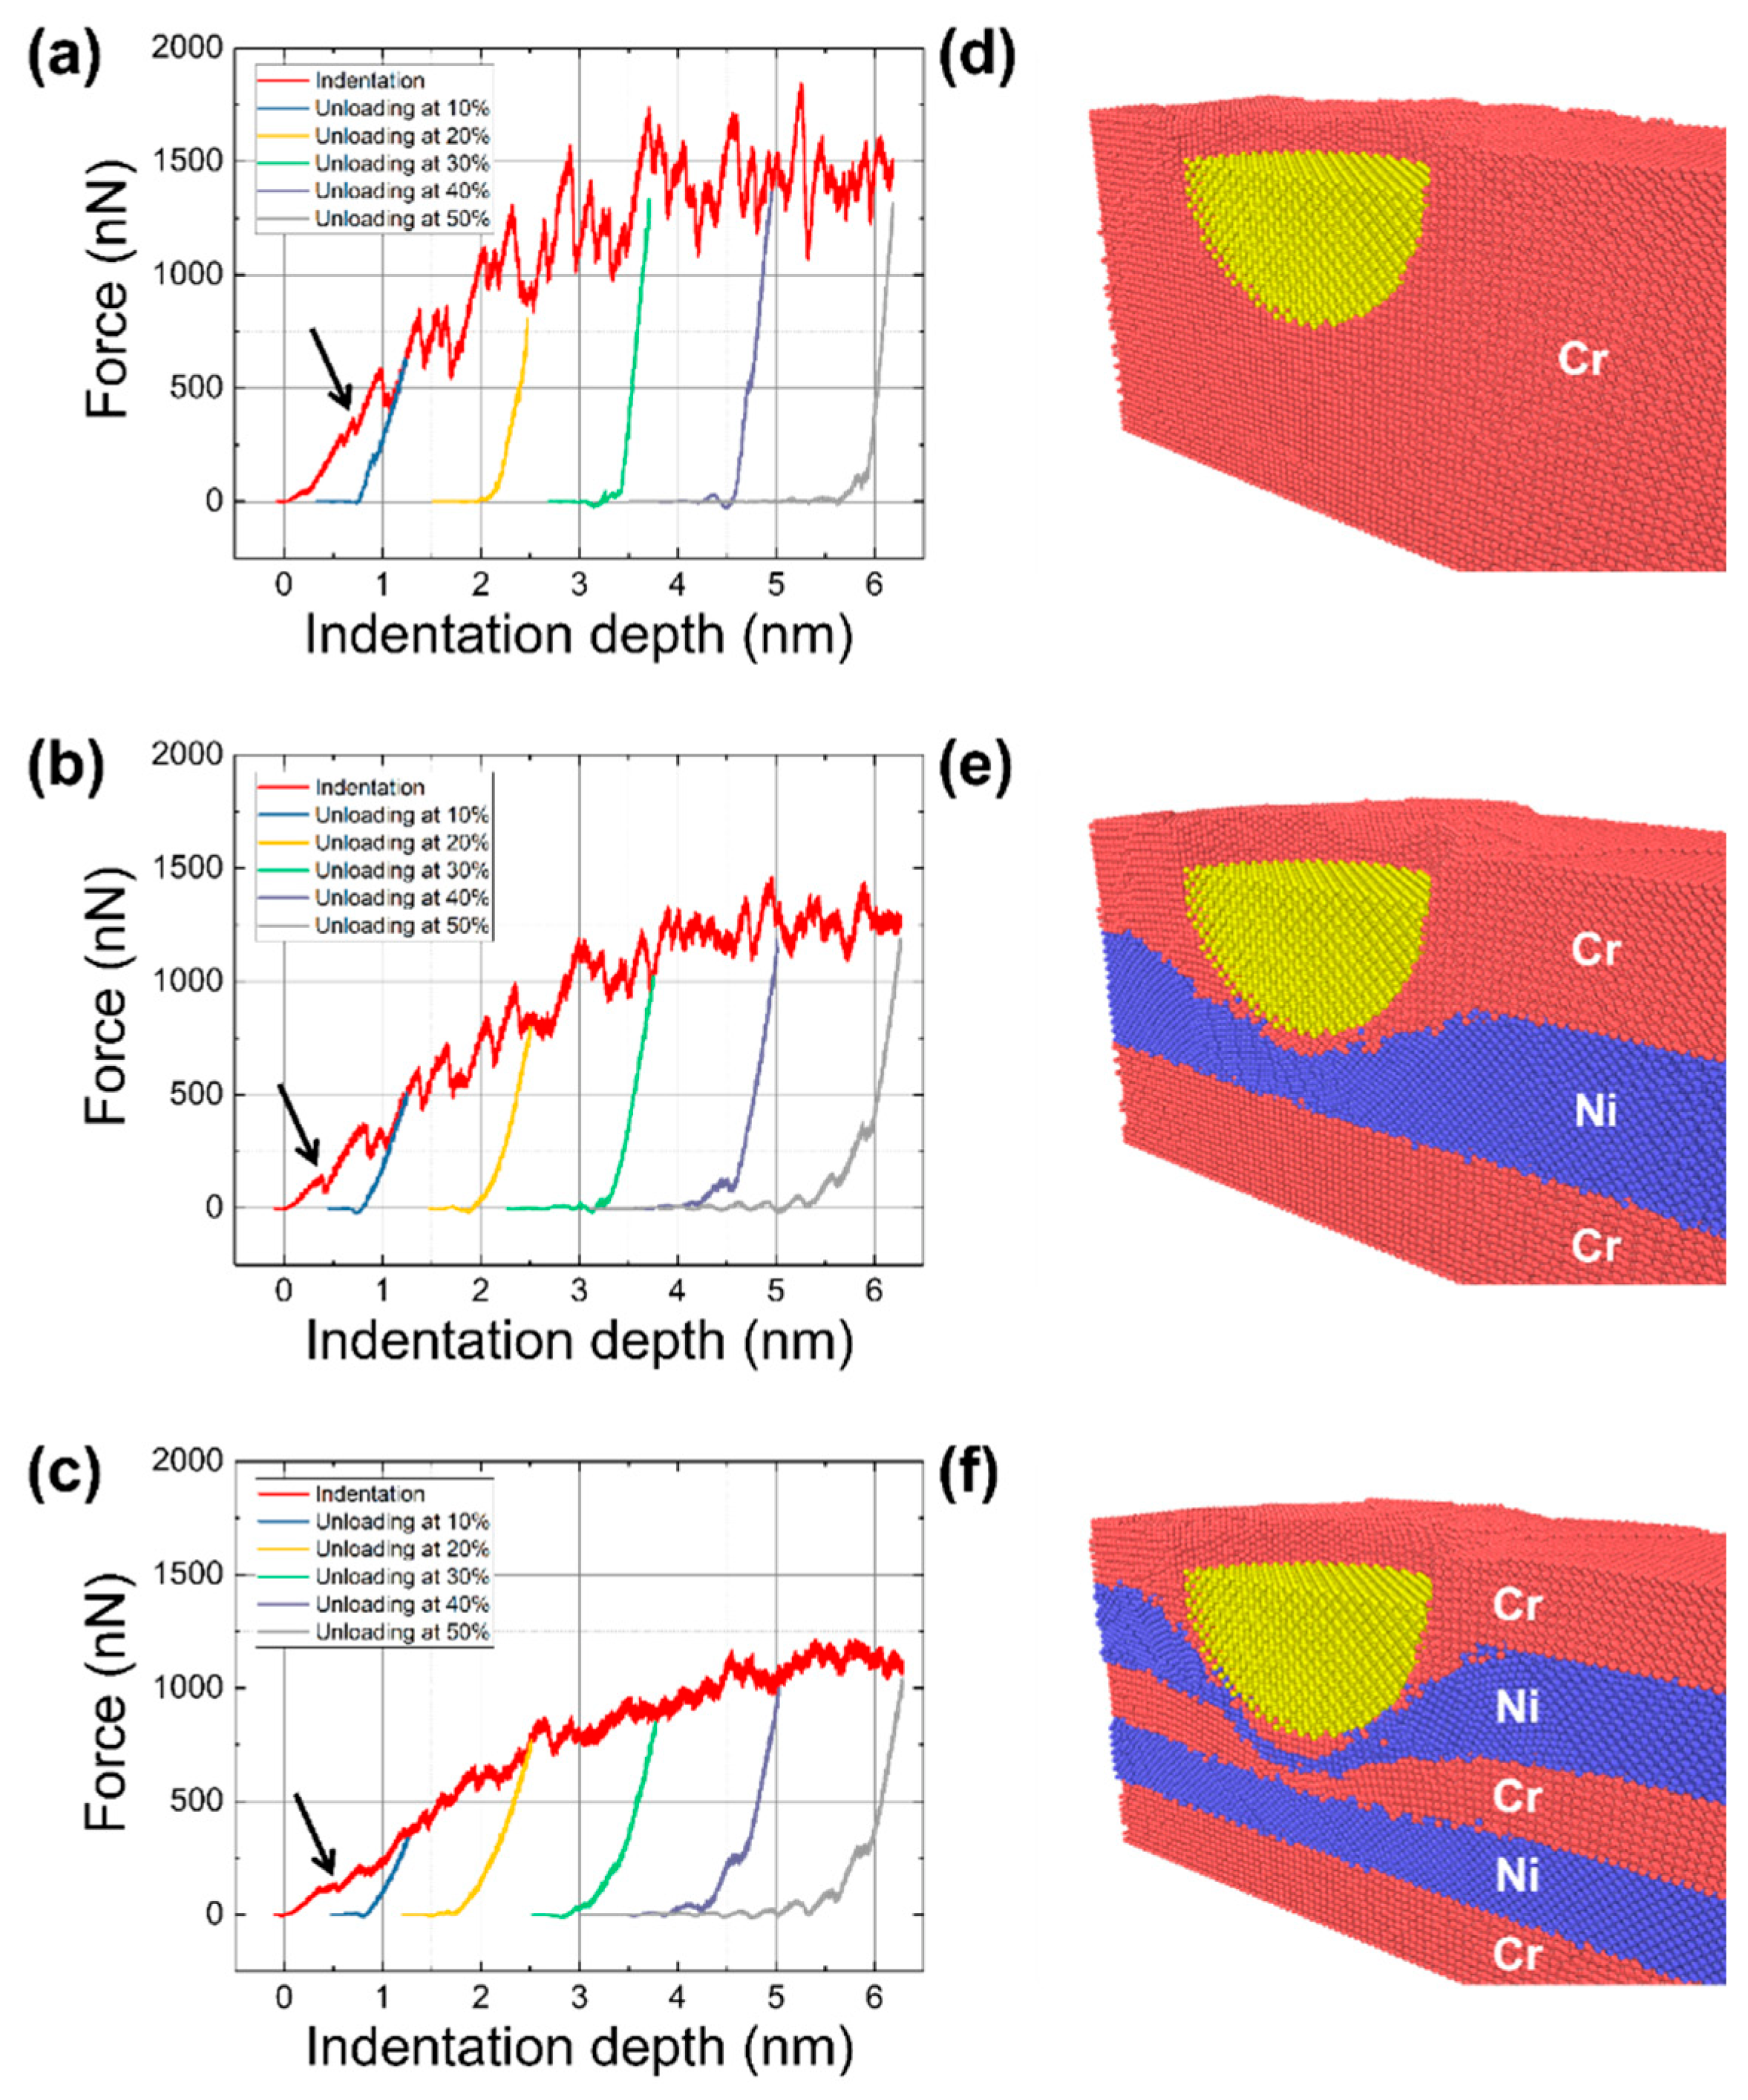
F–D curves were obtained during indentation and scratch simulations by recording the repulsion force that the rigid indenter tip experienced. In the case of scratch simulation, force in the horizontal direction was obtained as well as the coefficient of friction (COF). Figure 2a–c show F–D curves during the indentation and unloading from the depth of 10~50% of total thickness for each model. Figure 2d–f shows the cross-sectional images of each model when indented up to 50% of the total thickness. The indentation force was higher and showed rougher peaks at the same indentation depth as the number of layers decreased. The repulsion force experienced by the tip at the indentation depth of 50% for the five-layer model was ~12% and ~39% lower than those of the three-layer and one-layer models, respectively. All models showed numerous peaks when indented compared to their unloading curves. The force peaks were attributed to repeated stress accumulation and relief caused by the plastic deformation. In particular, the arrow in each F–D curve (Figure 2a–c) shows the first occurrence of dislocation for each model when indented. In other words, the decrease in the reaction force to the indentation was attributed to the slip, which occurred after the accumulation of stress or defects in the layer [25]. Moreover, it was found that the first dislocation was created earlier for the multilayer models than the monolayer model. On the contrary, the force decreases smoothly and rapidly when unloaded for all cases. In the case of unloading curves from about 30 to 50% of three- and five models (Figure 2b,c), there were fluctuations because of the frictional behavior between the tip and the sidewall created by the indentation. Based on the unloading curve data, the unloading stiffness could be calculated to compare the mechanical behavior of each model [50]. The unloading stiffness was calculated using the initial linear part of unloading curves from about 20 to 50% of the total thickness for each model. As a result, the unloading stiffnesses were 5430 ± 20 nN/nm, 3083 ± 17 nN/nm, and 2349 ± 15 nN/nm for one-, three-, and five-layer models, respectively. The reason why the indentation force at the same indentation depth and the unloading stiffness are higher for the one-layer model is that the mechanical properties such as hardness and elastic modulus of the Cr material are reported to be higher than those of Ni, and the one-layer model had the highest Cr atomic ratio among all models [51,52].
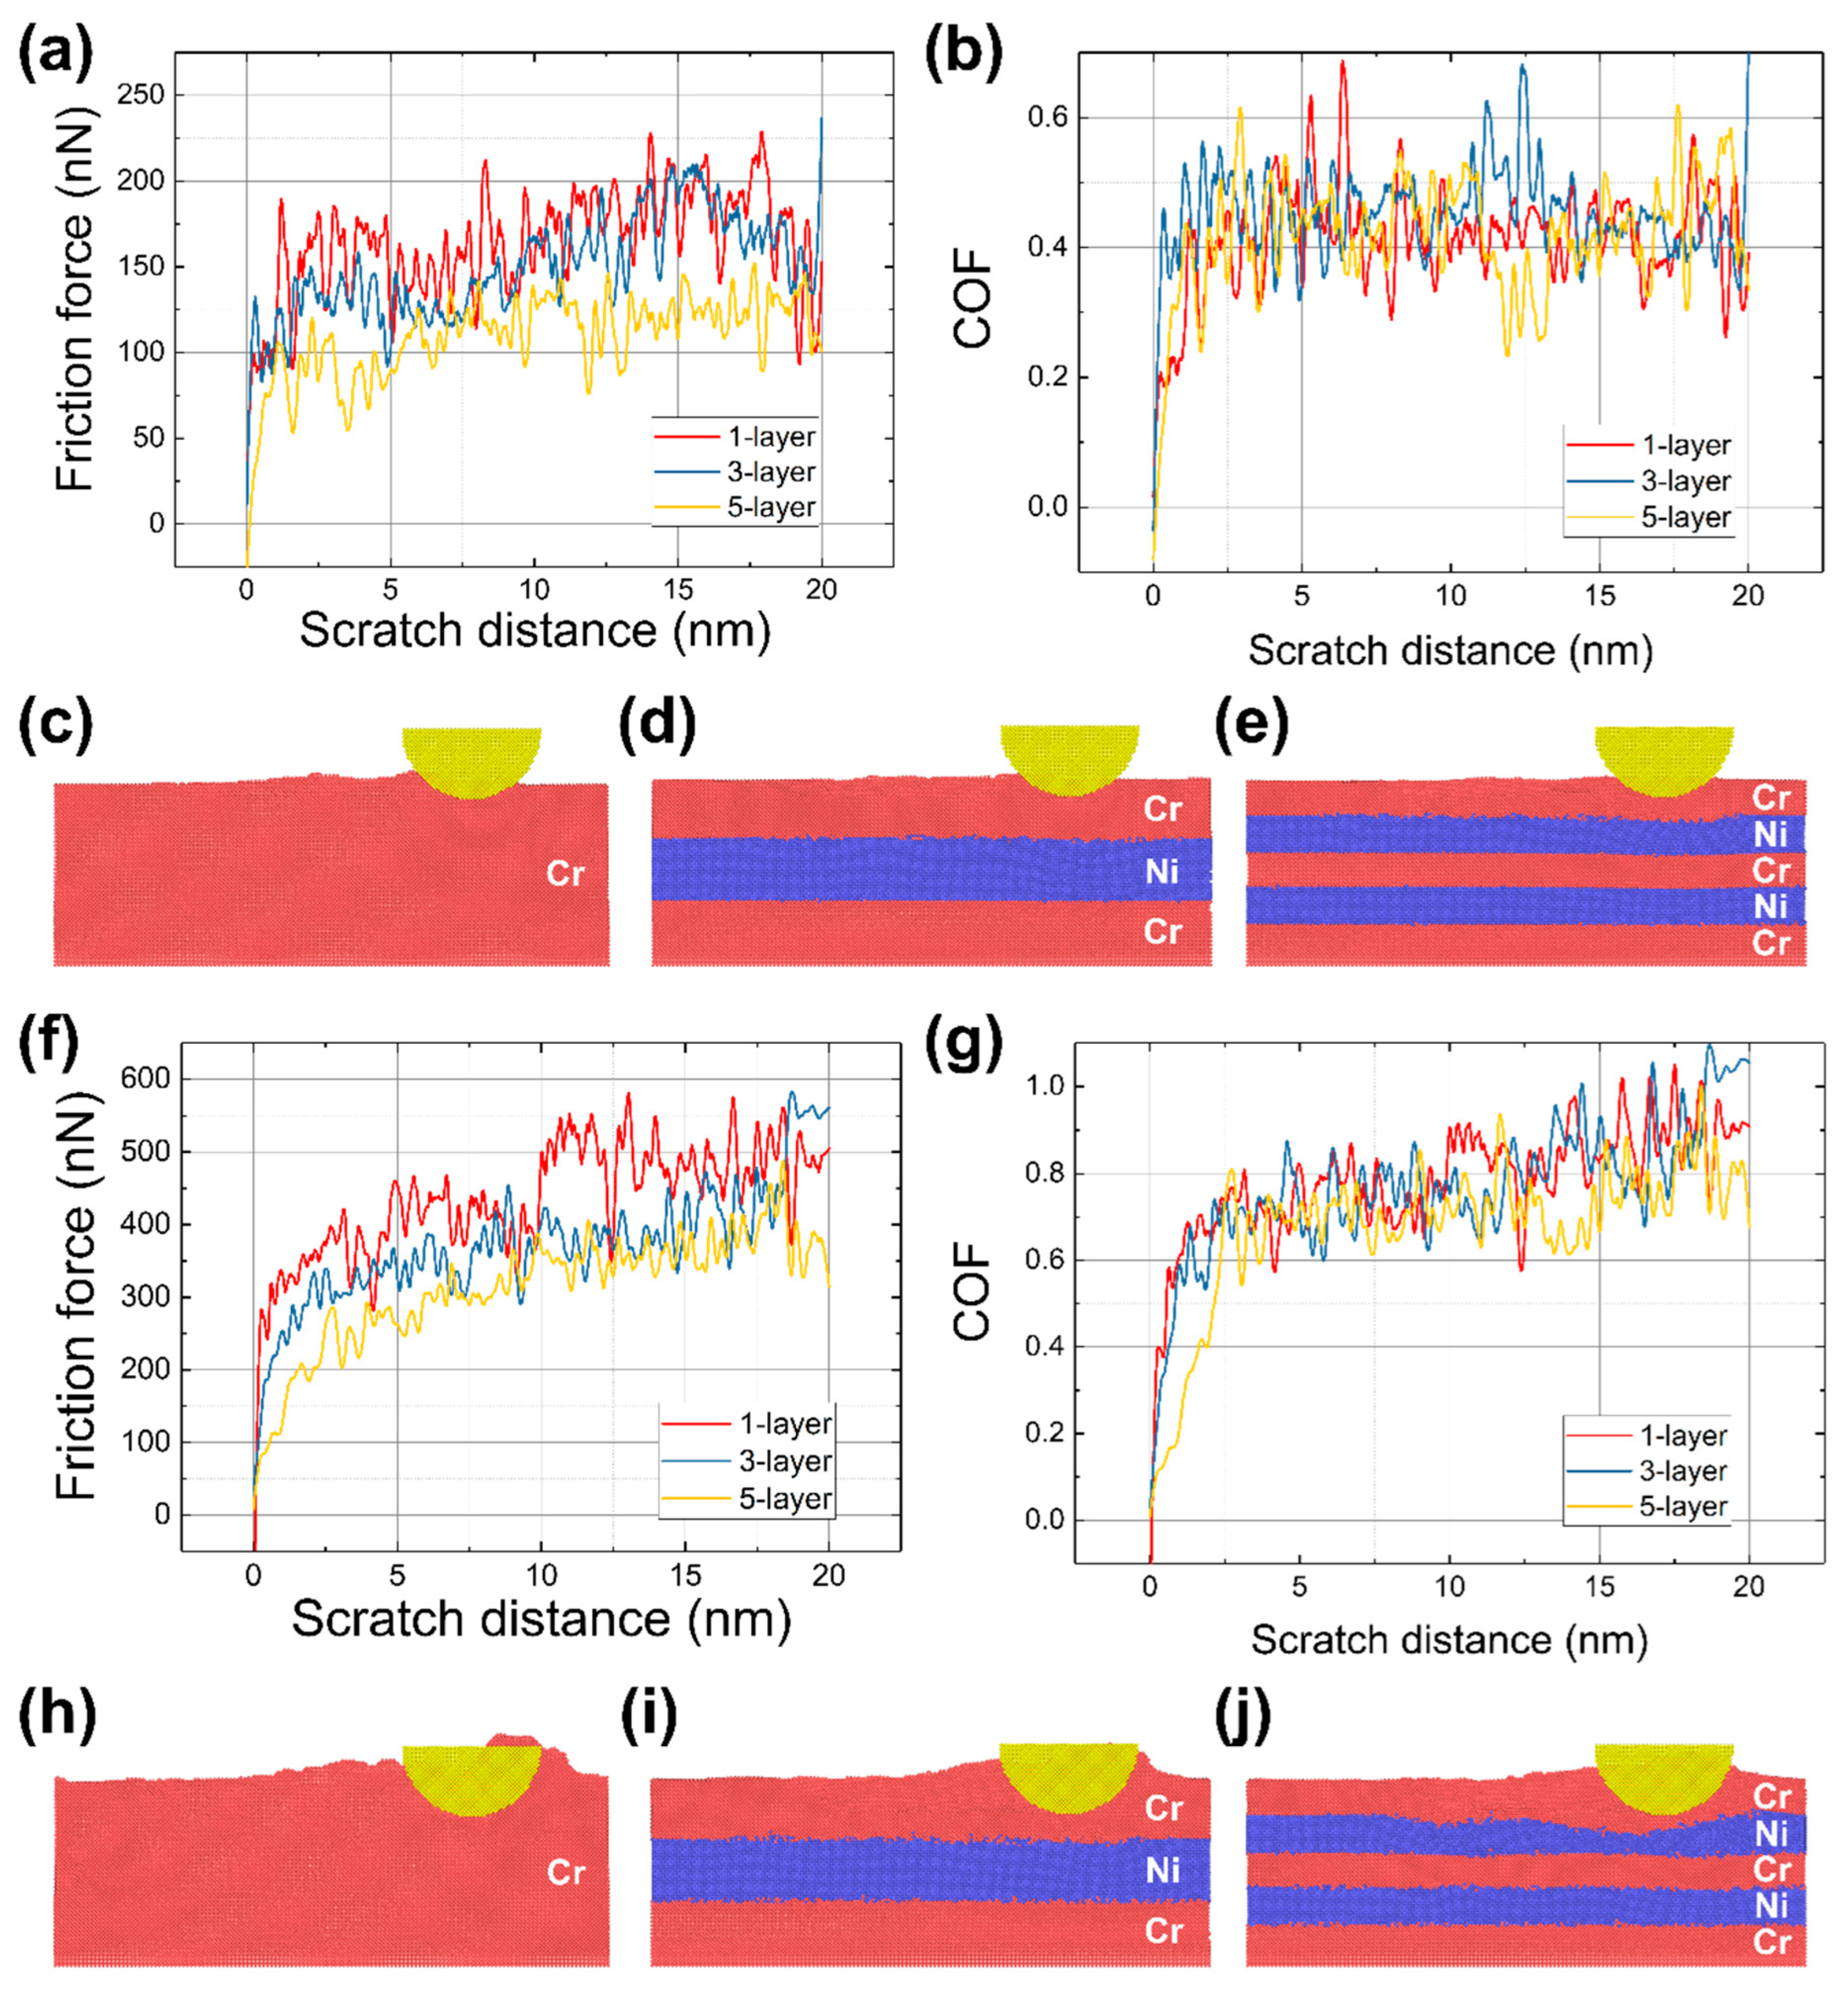
Friction force and COF were obtained according to the scratch distance for all models. Figure 3a,b,f,g shows friction force and COF with respect to the scratch distance for each model, with the indentation depth of 10% and 20% of the total thickness, respectively. For both indentation depths, the friction force generally increases as the tip scratches because of the burr creation, as shown in Figure 3c–e,h–j. Furthermore, friction force was generally lower for the Cr–Ni multilayer models than the Cr monolayer model for both 10% and 20% indentation depth conditions. However, the difference in COF of each model was smaller because the normal repulsion forces of multilayer models (Figure 2b,c) were also smaller than that of the monolayer model (Figure 2a). Specifically, for the scratch simulations at 10% indentation depth, the COF of the one-, three-, and five-layer models were 0.412 ± 0.082, 0.451 ± 0.067, and 0.417 ± 0.093, respectively. For the simulations at 20% indentation depth, the COF of the one-, three-, and five-layer models were 0.782 ± 0.134, 0.767 ± 0.158, and 0.678 ± 0.168, respectively. The COF results for the simulations at 20% indentation depth were higher than those at 10% indentation depth because there was a higher number of atoms in contact between the indenter tip and the coating at the deeper indentation depth. In addition, the friction forces for the simulations at 20% indentation depth increased more rapidly than at 10% indentation depth as the scratch proceeded. The COF results at 20% indentation depth showed increasing trends as scratched, contrary to the results at 10% indentation depth. This is because the burr created in front of the tip motion was significant, and it interrupted the scratching motion of the tip more than the scratch models with lower indentation depth. Particularly, the burr height of the monolayer model was the largest among the models, and it covered the rigid Si tip at the end of the scratch, as shown in Figure 3h. The interruption by this burr was reflected as the highest friction force among the models, as shown in the red line in Figure 3f.
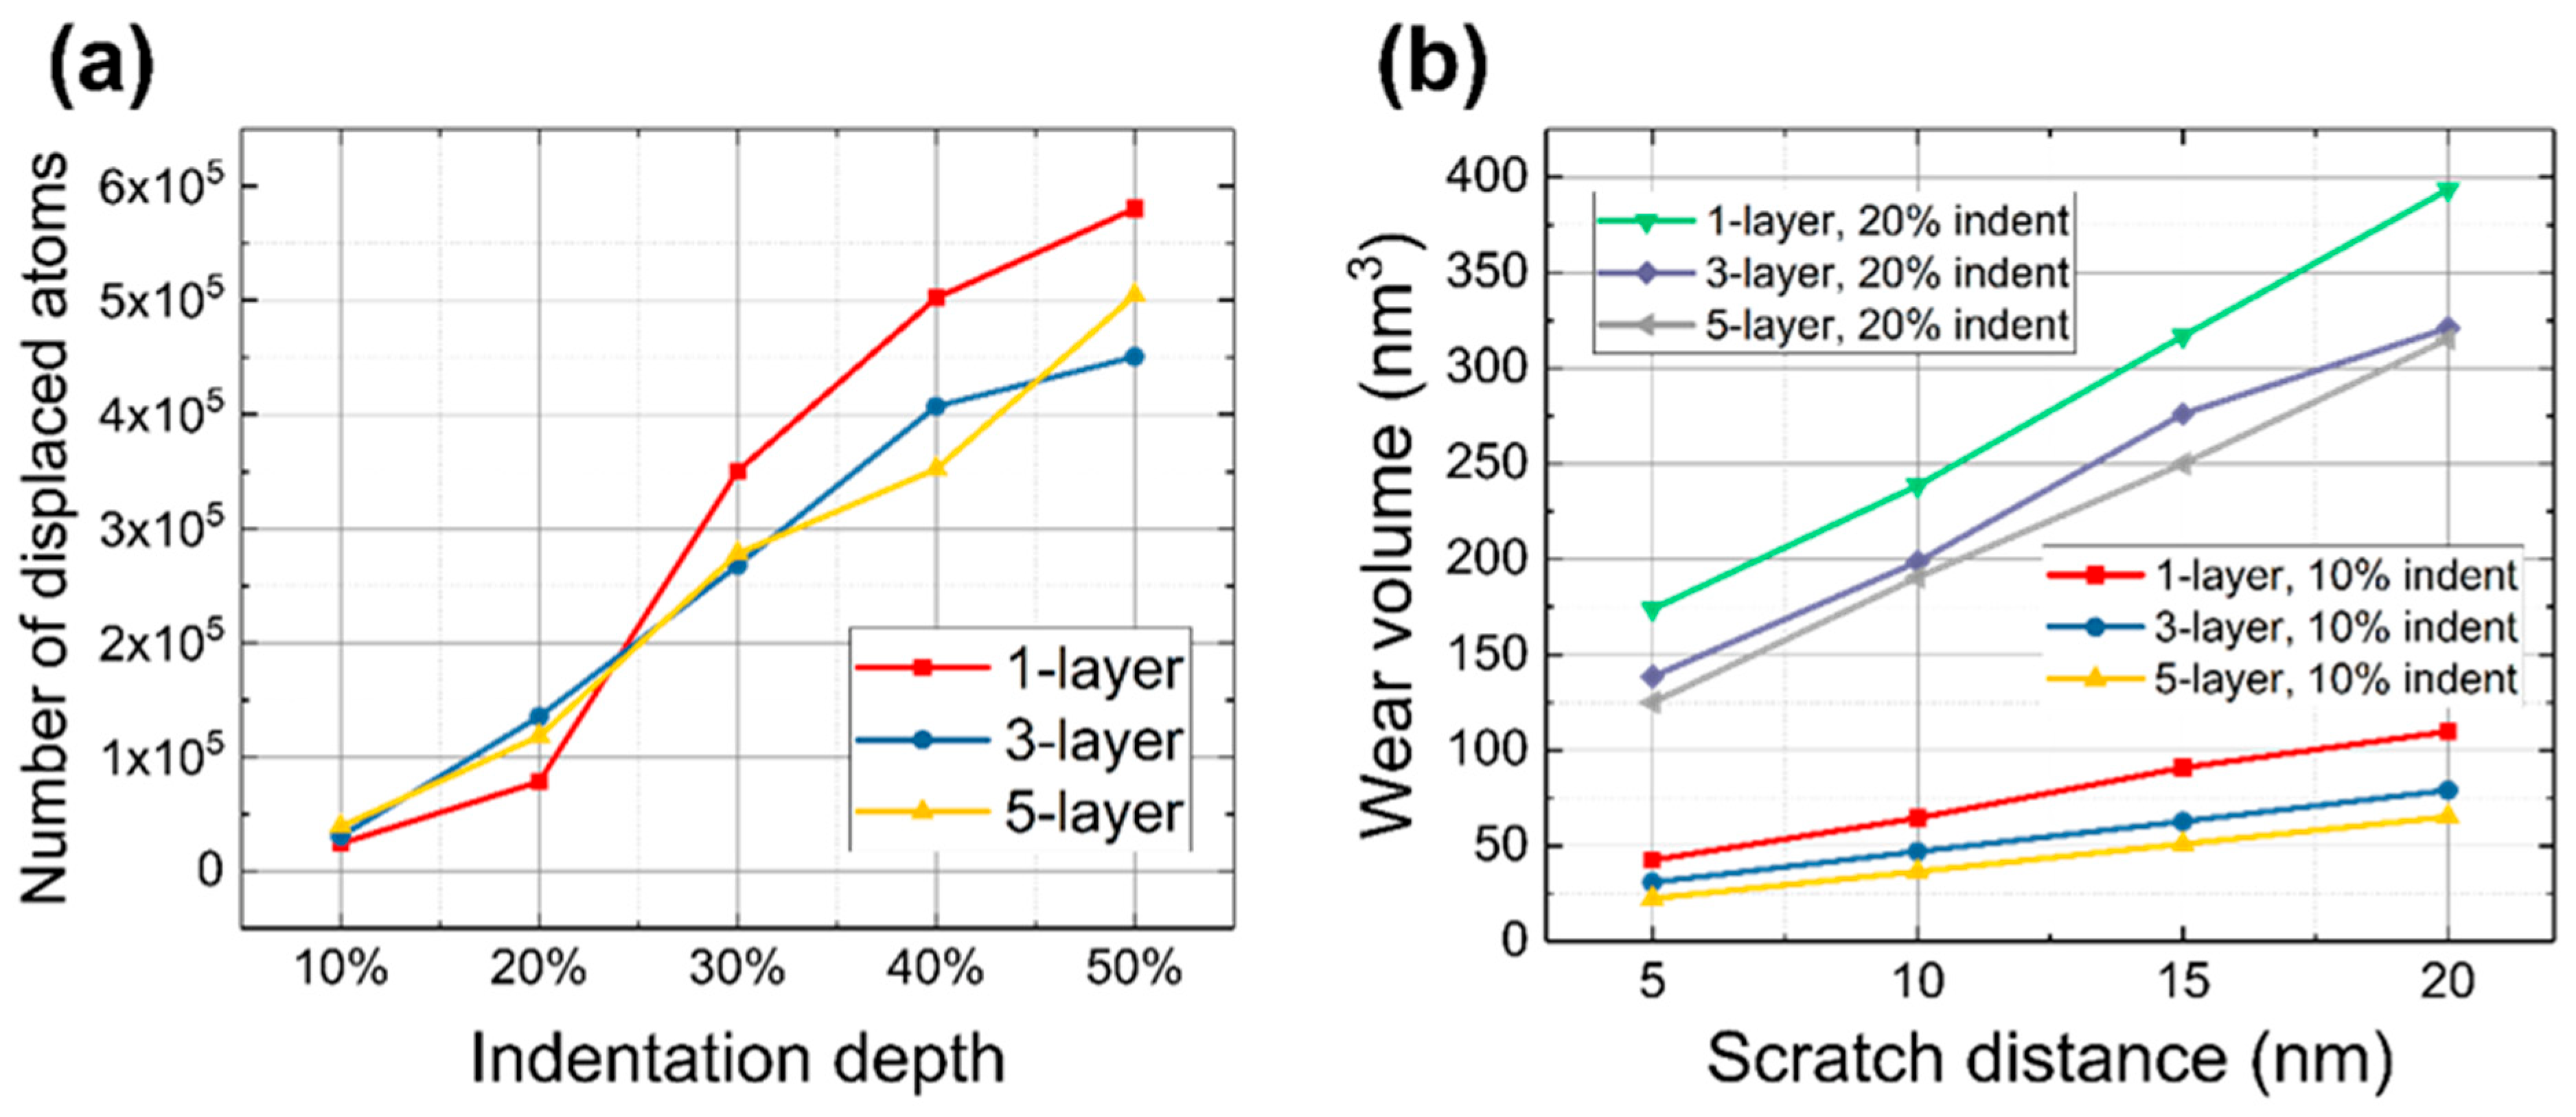
The deformation of each model according to the indentation simulation was quantified by tracking the displacement of each atom compared to their original position in the pristine model. Figure 4a shows the number of atoms that show the displacement of greater than 2 Å, with respect to the indentation depth. To determine the criterion of permanent displacement, the unnecessary movement, such as the vibration by temperature and the fluctuation of the entire coating by the indentation, was monitored at the region that is not indented. As a result, the movement by the temperature and the fluctuation of the coating was less than 2 Å, and the criterion of permanent displacement was determined to be 2 Å. Since the indentation was controlled by the constant speed rather than a constant force, the volume of the region swept by the indenter tip was the same for all models. Thus, it was presumed to be reasonable to compare the number of displaced atoms by the indentation to quantify permanent deformation of the entire coating, including burr or protrusion. The number of displaced atoms in the monolayer model was smaller than those of multilayer models at the indentation depth of 20% of the total thickness (approximately 2.6 nm), then overtaken by the multilayer models as the increasing indentation depth. As a result, at the indentation depth of 50% (approximately 6.5 nm), the number of displaced atoms in the monolayer model was 28.8% and 15.0% larger than those of the three-layer and five-layer models, respectively. The number of displaced atoms in the monolayer model increased significantly in the range from the indentation depth of 20% to 30% because the slip occurred for the entire coating to elevate the Cr atoms near the indentation mark, whereas the multilayer models seemed to have less plastic deformation due to the Ni layers that blocked the slip or dislocation movement across the layers.
In the case of scratch simulation, the deformation was quantified by calculating the volume of the concave region, which corresponds to the actual wear track. Since the tip was hemisphere, the volume of the wear track was calculated by summing the volume of the spherical segment and horizontal cylindrical segment. The volumes of the spherical and horizontal cylindrical segments could be calculated by the following formulas:
V s p h e r i c a l = 1 3 π h 2 ( 3 R h )
V c y l i n d r i c a l = L ( R 2 cos 1 ( R h R ) ( R h ) 2 R h h 2 )
where R, h, and L are the radius of sphere or cylinder, segment height, and segment length, respectively. The values of R, h, and L were determined by measuring the distance between the corresponding atoms at more than three locations. As shown in Figure 4b, the overall tendency of wear according to the scratch showed linearly increasing trends for all models. Additionally, in both indentation depth conditions of 10% and 20%, the wear volume was lower as the number of layers increased. Specifically, the wear volume of the five-layer model was 68.4% and 24.9% smaller than that of the one-layer model at the indentation depth of 10% and 20%, respectively.

3.2. Dislocation Analysis during Indentation and Scratch

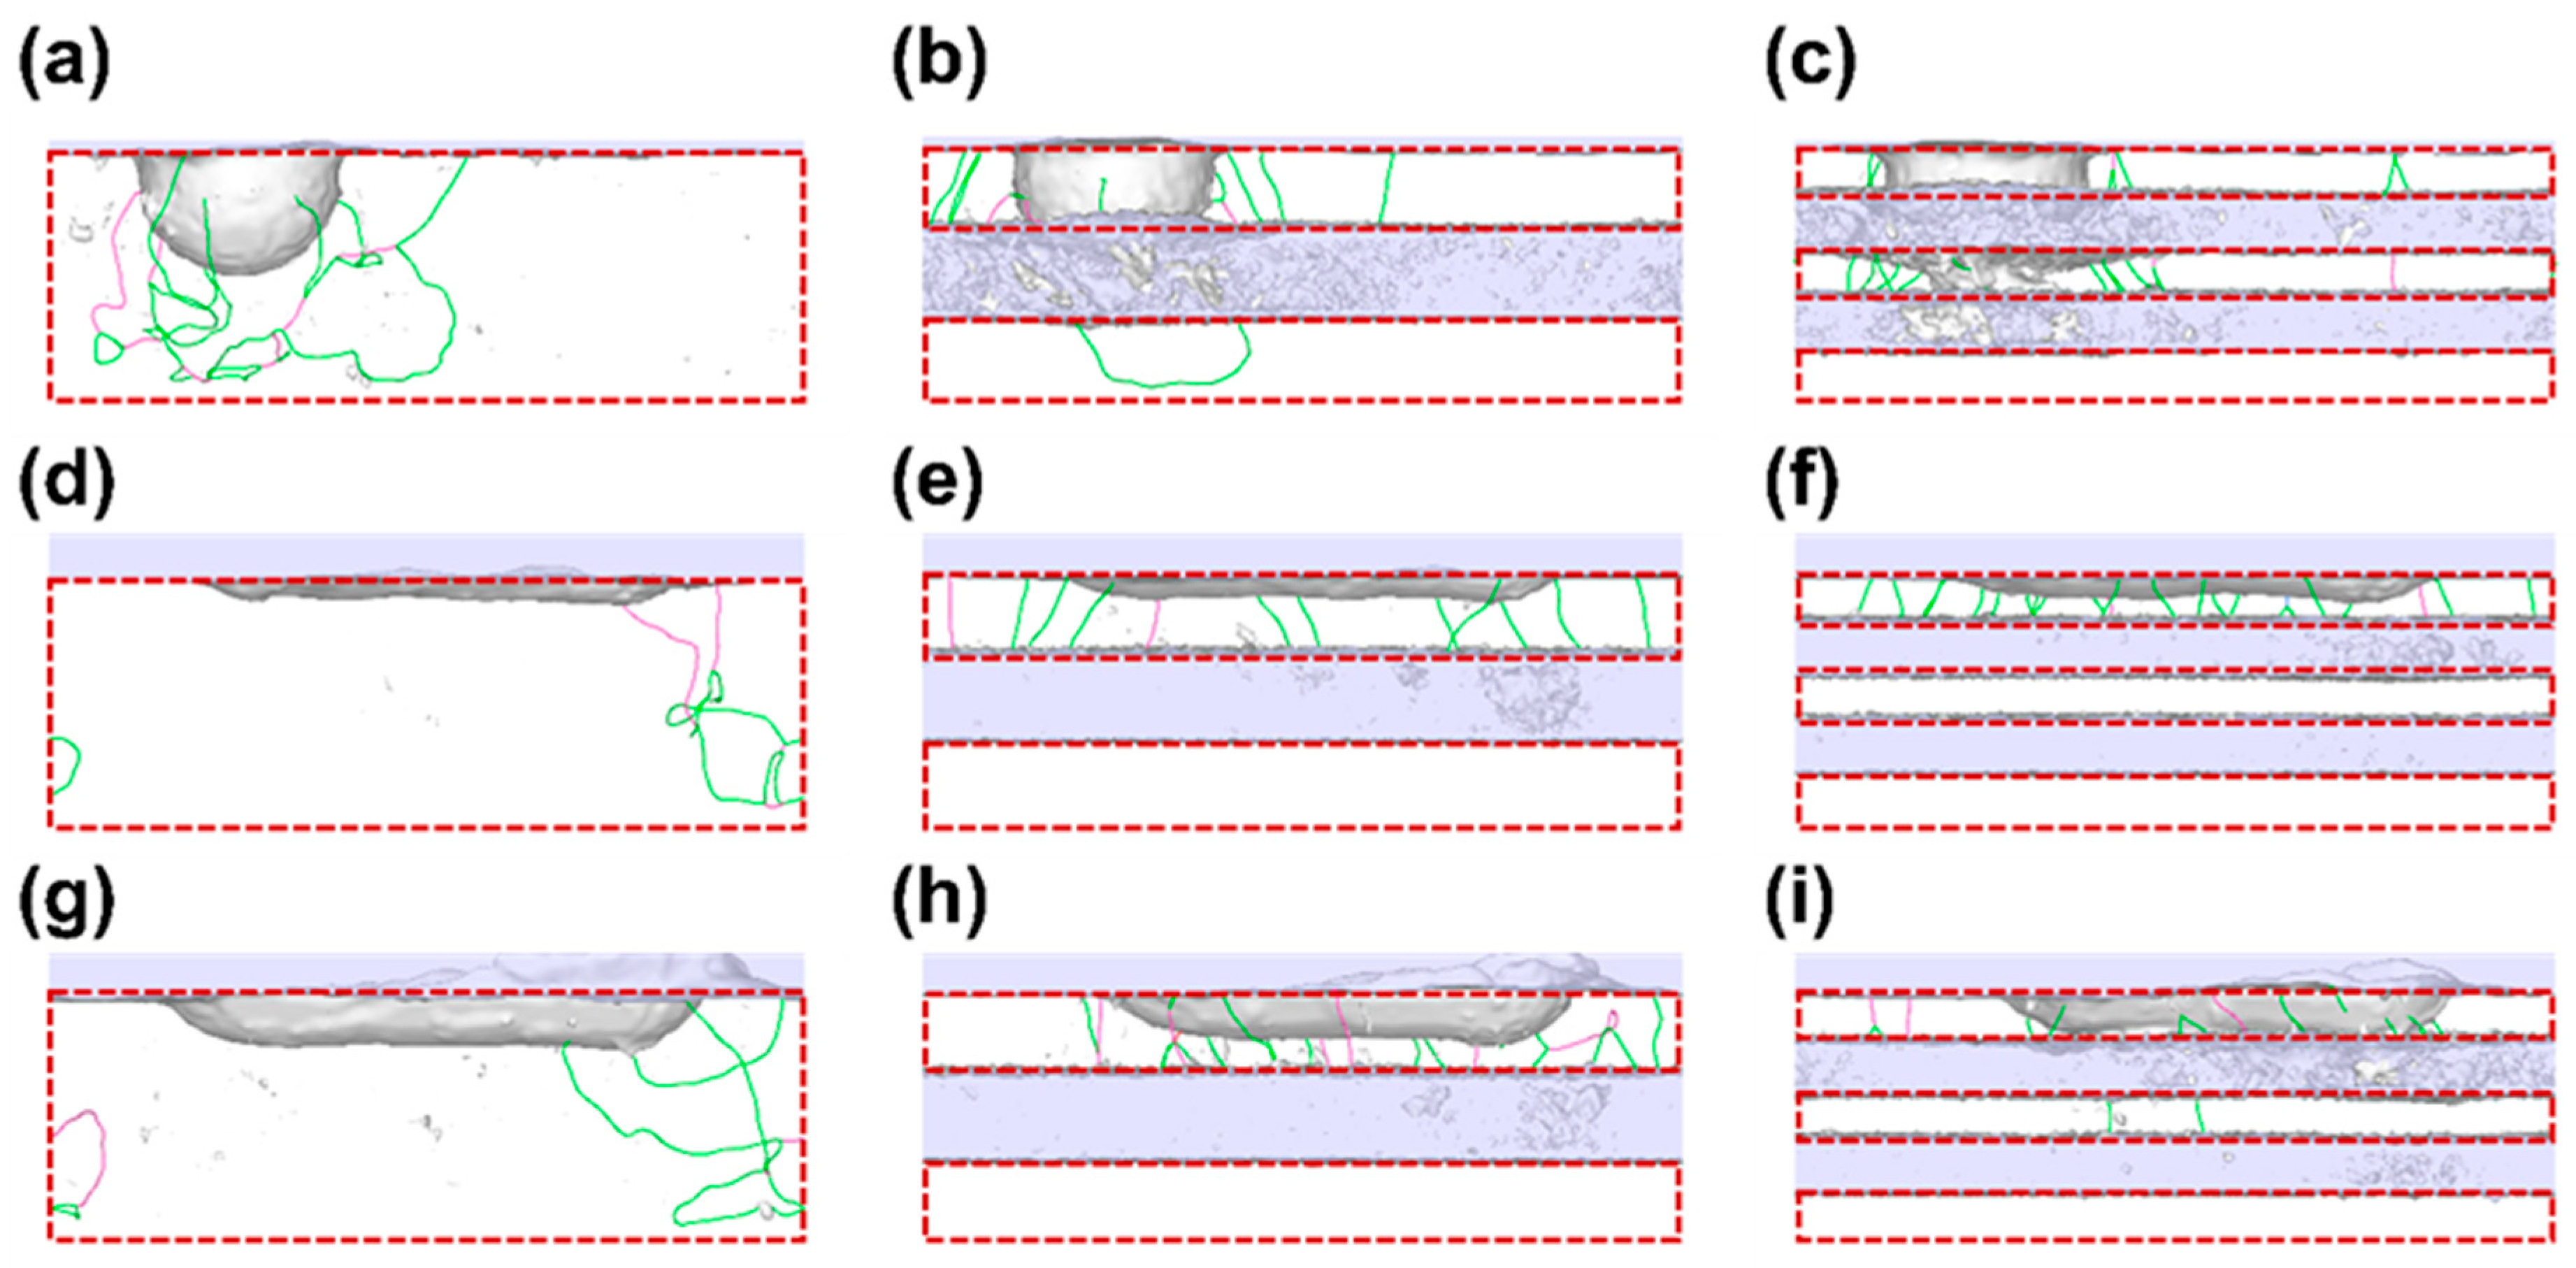
The dislocation was analyzed during the indentation and scratch to further understand the deformation behavior of each model. To maintain consistency, dislocations inside the Cr BCC structure were analyzed because the monolayer model did not include the Ni FCC layer. Figure 5a–c shows the dislocation lines visualized at the end of indentation simulations (depth of 50% of total thickness) for each model. Figure 5d–i shows the dislocation lines visualized at the end of scratch simulations for each model at the indentation depth of 10% and 20%, respectively. The main difference between the monolayer and the multilayer models was the shape of dislocation lines. The dislocation lines inside the Cr layer of the monolayer model generally formed a loop shape, which starts and ends at the surface of the indentation or scratch mark. In addition, there were a few intersections between the dislocation lines (kink or jog). The phenomenon seemed to be attributed to the thickness of the layer, because the three-layer model, which consisted of thinner layers than the one-layer model, also showed the loop shape and the intersections partially, as shown in Figure 5b,h. On the other hand, the dislocation lines in the five-layer model did not seem to have enough space to form a loop shape; the dislocation lines that cross the layer were dominant.
To quantify the dislocation during the indentation and scratch, the number of dislocation lines was tracked, as shown in Figure 6. In both indentation and scratch simulations, the number of dislocation lines was generally higher as increasing the number of layers. During the indentation simulation, the number of dislocation lines showed an increasing trend for all models because of the significant penetration by the tip. However, when scratched, the number of dislocation lines of the monolayer model decreased to less than 10, while those of the multilayer models showed an increasing trend for both scratch simulations at the indentation depth of 10% and 20%. Specifically, the five-layer model maintained the highest number of dislocation lines during the scratch process among all models. Considering that the total volume of the Cr BCC layer of the five-layer model is 12.3% and 41.9% smaller than those of the three-layer and one-layer models, the number of dislocation lines is much higher than those of the other models if the volumes are the same. In the case of scratch simulations at the indentation depth of 10%, the number of dislocation lines of the five-layer model is 2.16- and 2.60-fold higher at the end of the scratch than the three-layer and one-layer models, respectively. For those at the indentation depth of 20%, the number of dislocation lines of the five-layer model is 1.20- and 3.33-fold higher at the end of the scratch than the three-layer and one-layer models, respectively. Thus, as the dislocation lines piled up, the overall mobility of dislocation lines decreased, resulting in an enhancement of slip resistance. Consequently, the amount of plastic deformation of the five-layer model was the smallest among all models, as shown in Figure 4.
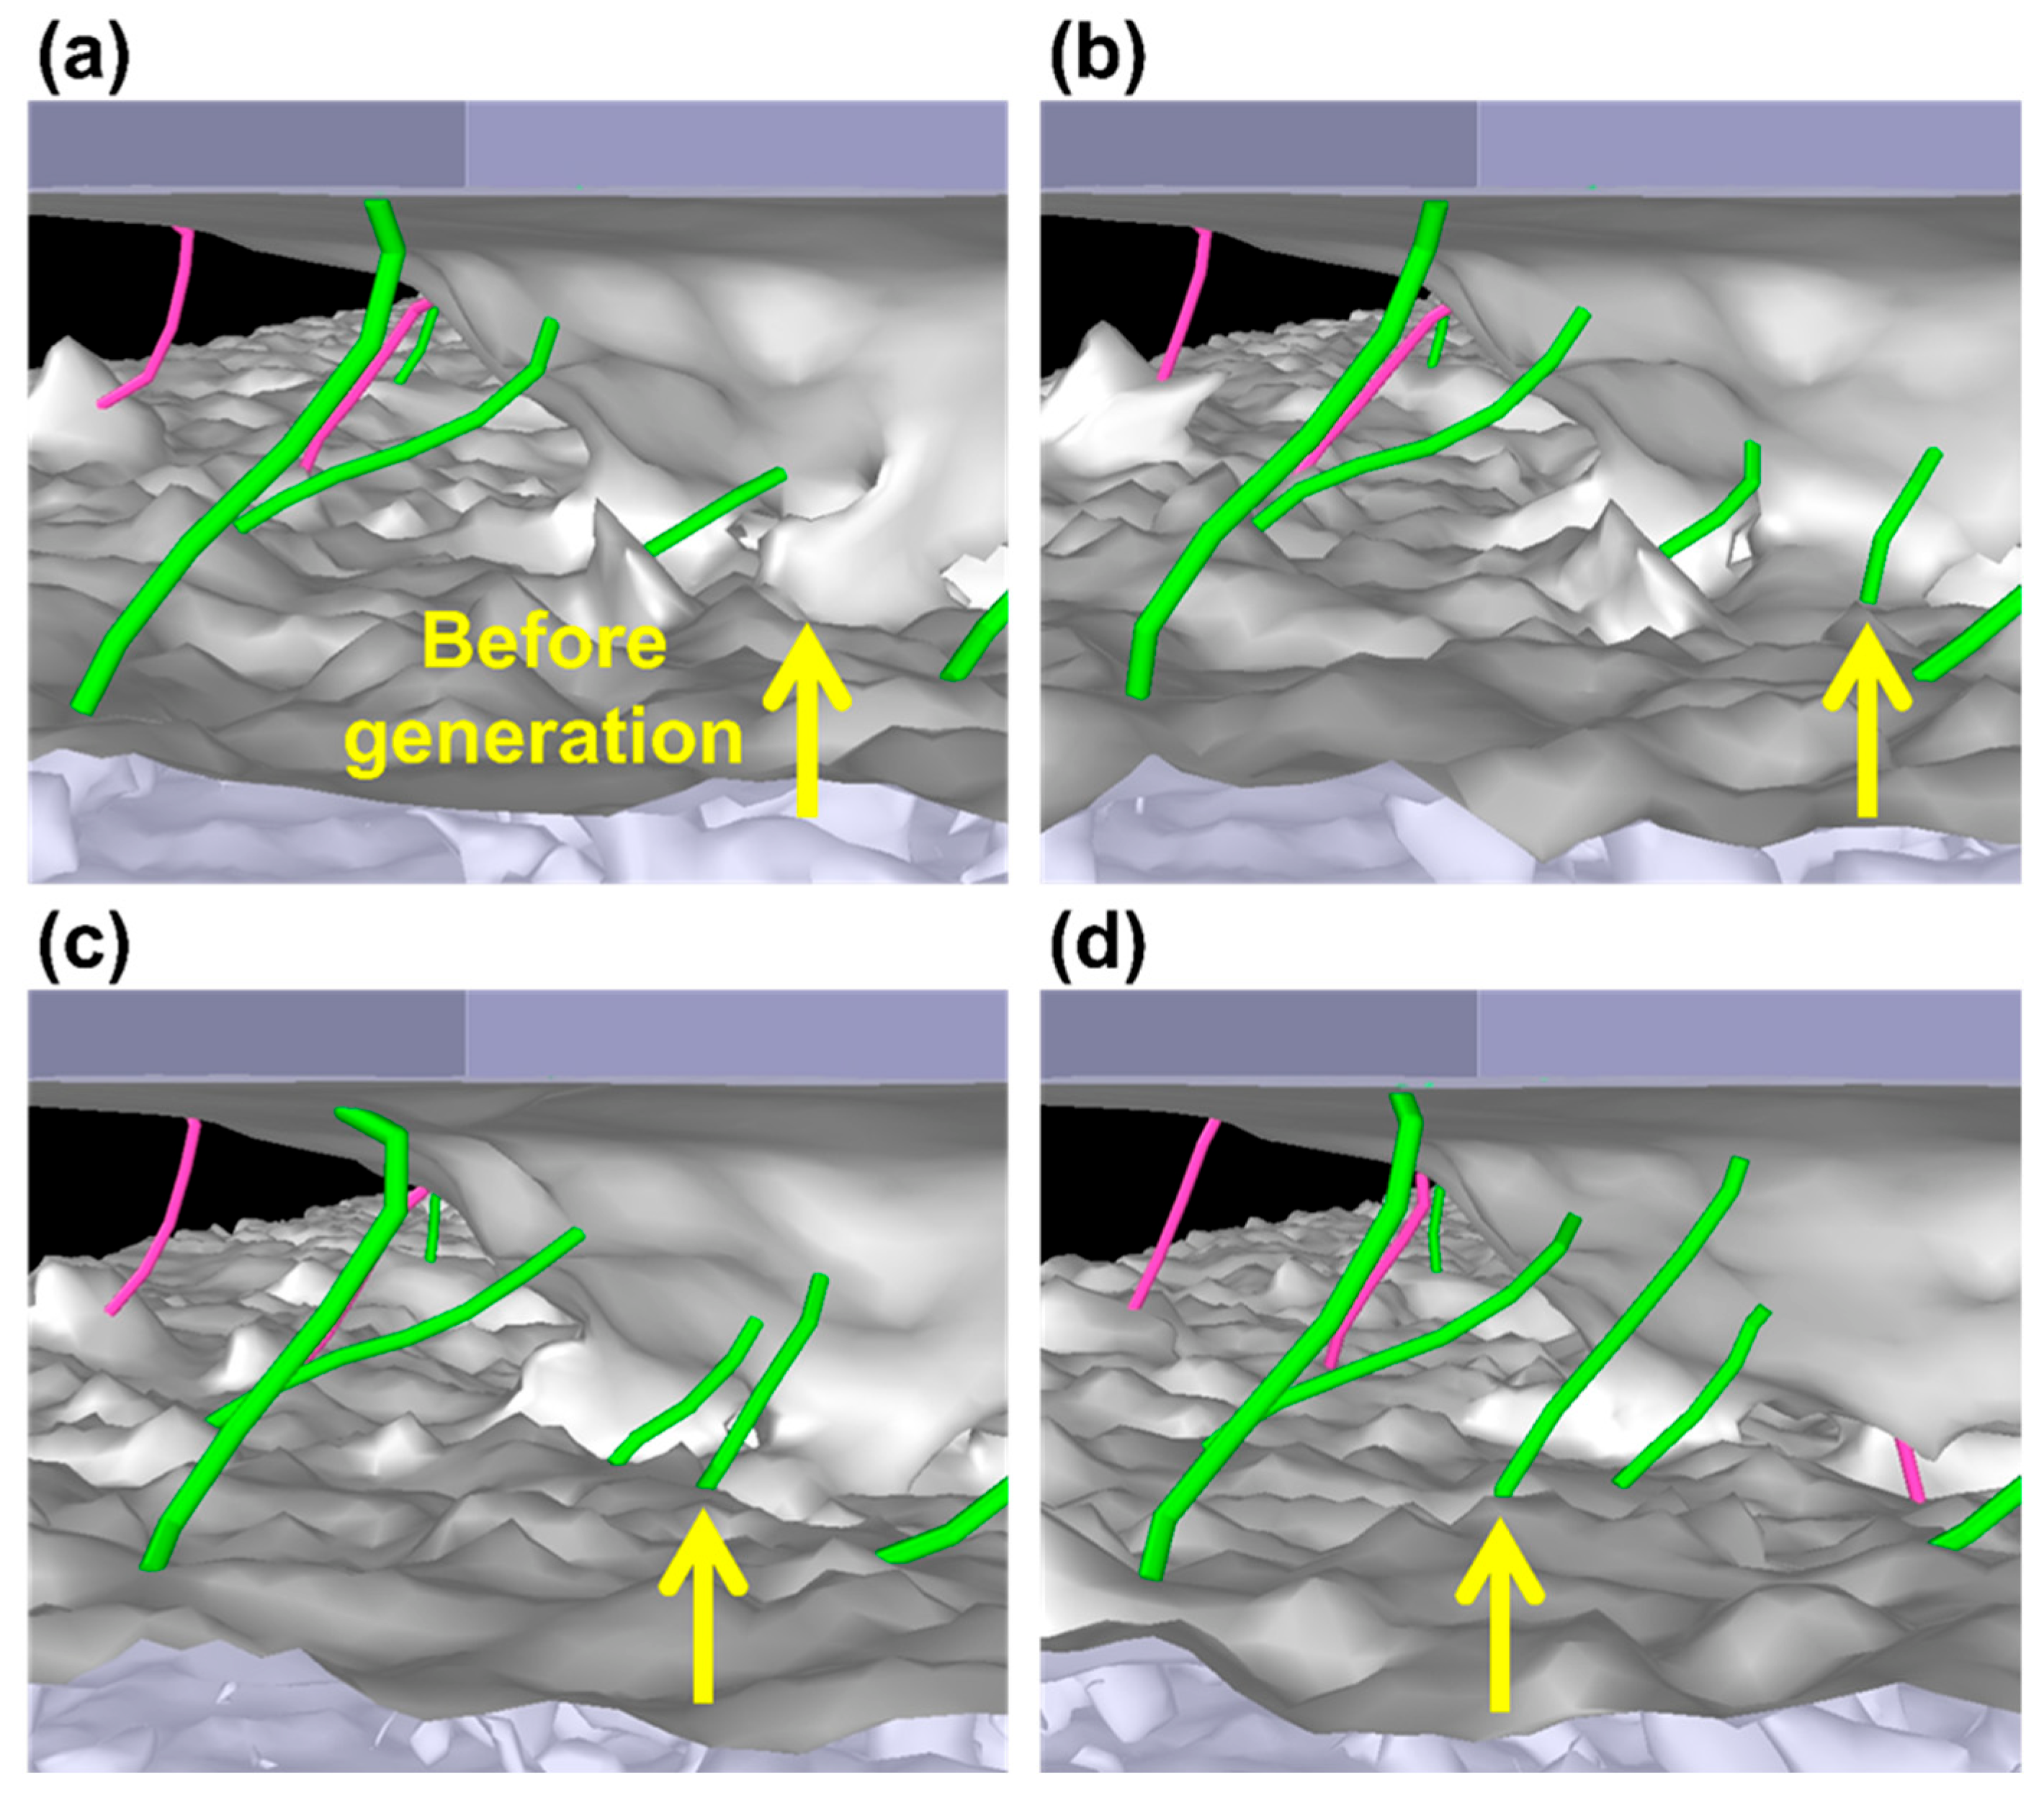
In addition to the analysis of the number of dislocation lines, the generation and movement of a dislocation line could be visualized by increasing the dumping rate from 0.1 ps−1 to 1000 ps−1. Figure 7a,b shows the moment of dislocation line generation, while Figure 7c,d shows the movement of a dislocation line near the indenter tip. During the movement, the dislocation line traveled ~3.5 nm in 1.9 ps. Moreover, the length of the dislocation line was increased from ~1.8 nm to ~4.9 nm to adapt the gap between the surfaces at the top and bottom.

4. Conclusions

Molecular dynamics simulations were conducted to analyze the deformation behaviors of crystalline Cr–Ni multilayer coatings. The coatings comprising 1-, 3-, and five-layers were modeled to simulate indentation, unloading, and scratch processes. During the series of simulations, forces in normal and shear directions were recorded to calculate normal repulsion force and friction force. Based on the coordinates of the atoms, deformation behavior and dislocation lines were visualized. In addition, the amount of plastic deformation and the number of dislocation lines were quantified. Based on the results obtained in this work, the following conclusions were deduced:
  • Based on the F–D curves obtained in the indentation process, the five-layer model showed ~39% and ~12% smaller repulsion force than those of the one-layer and three-layer models, respectively. Unloading stiffnesses were calculated to be 5436, 3078, and 2342 nN/nm for one-, three-, and five-layer models, respectively. The results are attributed to the fact that Cr has been reported to have higher mechanical properties than Ni and that the one-layer model consisted of Cr atoms only.
  • The friction force of the five-layer model during scratch simulations showed the lowest values among the models for both indentation depth of 10% and 20%. However, because the repulsion force of the five-layer model was also smaller than the other models, the COF of each model was not significantly different.
  • At the indentation depth of 50% of the total thickness, the amount of plastic deformation of the one-layer model was 28.8% and 15.0% higher than those of the three-layer and five-layer models, respectively. The wear volume of the five-layer model when scratched was at most 68.4% lower than that of the one-layer model at the indentation depth of 10%.
  • The number of dislocation lines in the five-layer model showed a consistently increasing trend when indented and scratched. The five-layer model showed 1.20~3.33-fold higher numbers of dislocation lines than those of the other models when scratched. Based on the increase in dislocation density, the mobility of dislocation lines was decreased, resulting in higher resistance to plastic deformation.
  • This work is expected to provide a basic understanding of the excellent wear-resistance of multilayer coatings containing partially crystallized structures.

Author Contributions

Conceptualization, K.-J.S.; methodology, K.-J.S.; software, K.-J.S.; validation, K.-J.S. and D.-E.K.; formal analysis, K.-J.S.; investigation, K.-J.S.; resources, D.-E.K.; data curation, K.-J.S.; writing—original draft preparation, K.-J.S.; writing—review and editing, D.-E.K.; visualization, K.-J.S.; supervision, D.-E.K.; project administration, D.-E.K.; funding acquisition, D.-E.K. All authors have read and agreed to the published version of the manuscript.

Funding

This work was supported by the National Research Foundation of Korea (NRF) grant funded by the Korean government (MIST) (No. 2020R1A2C2004714). This work was also supported by the National Supercomputing Center with supercomputing resources including technical support (KSC-2021-CRE-0024).

Data Availability Statement

The data presented in this study are available on request from the corresponding author. The data are not publicly available due to privacy or ethical restrictions.

Conflicts of Interest

There are no conflict to declare.

References

  1. Holmberg, K.; Erdemir, A. Influence of tribology on global energy consumption, costs and emissions. Friction 2017, 5, 263–284. [Google Scholar] [CrossRef] [Green Version]
  2. Kim, H.J.; Yoo, S.S.; Kim, D.E. Nano-scale Wear: A Review. Int. J. Precis. Eng. Man. 2012, 13, 1709–1718. [Google Scholar] [CrossRef]
  3. Khadem, M.; Penkov, O.; Yang, H.-K.; Kim, D.-E. Tribology of multilayer coatings for wear reduction: A review. Friction 2017, 5, 248–262. [Google Scholar] [CrossRef] [Green Version]
  4. Al-Asadi, M.M.; Al-Tameemi, H.A. A review of tribological properties and deposition methods for selected hard protective coatings. Tribol. Int. 2022, 176, 107919. [Google Scholar] [CrossRef]
  5. Penkov, O.V.; Khadem, M.; Kim, D.-E. Hard, Flexible, and Transparent Nanolayered SiNx/BN Periodical Coatings. ACS Appl. Mater. Interfaces 2019, 11, 9685–9690. [Google Scholar] [CrossRef]
  6. Chen, Z.; Lou, M.; Geng, D.; Xu, Y.X.; Wang, Q.; Zheng, J.; Zhu, R.; Chen, Y.; Kim, K.H. Effect of the modulation geometry on mechanical and tribological properties of TiSiN/TiAlN nano-multilayer coatings. Surf. Coat. Technol. 2021, 423, 127586. [Google Scholar] [CrossRef]
  7. Liu, Z.R.; Xu, Y.X.; Peng, B.; Wei, W.; Chen, L.; Wang, Q. Structure and property optimization of Ni-containing AlCrSiN coatings by nano-multilayer construction. J. Alloys Compd. 2019, 808, 151630. [Google Scholar] [CrossRef]
  8. Nemati, N.; Bozorg, M.; Penkov, O.V.; Shin, D.G.; Sadighzadeh, A.; Kim, D.E. Functional Multi-Nanolayer Coatings of Amorphous Carbon/Tungsten Carbide with Exceptional Mechanical Durability and Corrosion Resistance. ACS Appl. Mater. Interfaces 2017, 9, 30149–30160. [Google Scholar] [CrossRef]
  9. Fox-Rabinovich, G.S.; Gershman, I.S.; Yamamoto, K.; Aguirre, M.H.; Covelli, D.; Arif, T.; Aramesh, M.; Shalaby, M.A.; Veldhuis, S. Surface/interface phenomena in nano-multilayer coating under severing tribological conditions. Surf. Interface Anal. 2017, 49, 584–593. [Google Scholar] [CrossRef]
  10. Khadem, M.; Penkov, O.V.; Jais, J.; Bae, S.M.; Dhandapani, V.S.; Kang, B.; Kim, D.E. Formation of discrete periodic nanolayered coatings through tailoring of nanointerfaces-Toward zero macroscale wear. Sci. Adv. 2021, 7, eabk1224. [Google Scholar] [CrossRef]
  11. Penkov, O.V.; Devizenko, A.Y.; Khadem, M.; Zubarev, E.N.; Kondratenko, V.V.; Kim, D.E. Toward Zero Micro/Macro-Scale Wear Using Periodic Nano-Layered Coatings. ACS Appl. Mater. Interfaces 2015, 7, 18136–18144. [Google Scholar] [CrossRef] [PubMed]
  12. Pogrebnjak, A.D.; Kravchenko, Y.O.; Bondar, O.V.; Zhollybekov, B.; Kupchishin, A.I. Structural Features and Tribological Properties of Multilayer Coatings Based on Refractory Metals. Prot. Met. Phys. Chem. Surf. 2018, 54, 240–258. [Google Scholar] [CrossRef]
  13. Thompson, C.V.; Carel, R. Stress and grain growth in thin films. J. Mech. Phys. Solids 1996, 44, 657–673. [Google Scholar] [CrossRef]
  14. Khachatryan, H.; Lee, S.-N.; Kim, K.-B.; Kim, M. Deposition of Al Thin Film on Steel Substrate: The Role of Thickness on Crystallization and Grain Growth. Metals 2018, 9, 12. [Google Scholar] [CrossRef] [Green Version]
  15. Bhattacharyya, D.; Mara, N.A.; Dickerson, P.; Hoagland, R.G.; Misra, A. Transmission electron microscopy study of the deformation behavior of Cu/Nb and Cu/Ni nanoscale multilayers during nanoindentation. J. Mater. Res. 2009, 24, 1291–1302. [Google Scholar] [CrossRef]
  16. Bhattacharyya, D.; Mara, N.A.; Dickerson, P.; Hoagland, R.G.; Misra, A. A transmission electron microscopy study of the deformation behavior underneath nanoindents in nanoscale Al–TiN multilayered composites. Philos. Mag. 2010, 90, 1711–1724. [Google Scholar] [CrossRef]
  17. Mohamadnejad, S.; Basti, A.; Ansari, R. Analyses of Dislocation Effects on Plastic Deformation. Multiscale Sci. Eng. 2020, 2, 69–89. [Google Scholar] [CrossRef]
  18. Lubarda, V.A. Dislocation Burgers vector and the Peach–Koehler force: A review. J. Mater. Res. Technol. 2019, 8, 1550–1565. [Google Scholar] [CrossRef]
  19. Akasheh, F.; Zbib, H.M.; Hirth, J.P.; Hoagland, R.G.; Misra, A. Dislocation dynamics analysis of dislocation intersections in nanoscale metallic multilayered composites. J. Appl. Phys. 2007, 101, 084314. [Google Scholar] [CrossRef]
  20. Chang, H.-J.; Cordero, N.M.; Déprés, C.; Fivel, M.; Forest, S. Micromorphic crystal plasticity versus discrete dislocation dynamics analysis of multilayer pile-up hardening in a narrow channel. Arch. Appl. Mech. 2016, 86, 21–38. [Google Scholar] [CrossRef]
  21. Ghoniem, N.M.; Han, X. Dislocation motion in anisotropic multilayer materials. Philos. Mag. 2005, 85, 2809–2830. [Google Scholar] [CrossRef]
  22. Kaneko, Y.; Hirota, S.; Hashimoto, S. Discrete Dislocation Dynamics Simulation on Strengths of Dislocation Network Stacks in Multilayered Structures. Key Eng. Mater. 2007, 353–358, 1086–1089. [Google Scholar] [CrossRef]
  23. Chakraborty, A.; Hunter, A.; Capolungo, L. Effect of microstructure, layer thickness, and interface behavior on the plasticity of accumulative roll bonded nanometallic laminates using dislocation dynamics simulations. J. Mater. Res. 2021, 36, 2715–2728. [Google Scholar] [CrossRef]
  24. Yang, X.; Zhang, J.; Sagar, S.; Dube, T.; Kim, B.-G.; Jung, Y.-G.; Koo, D.D.; Jones, A.; Zhang, J. Molecular dynamics modeling of mechanical and tribological properties of additively manufactured AlCoCrFe high entropy alloy coating on aluminum substrate. Mater. Chem. Phys. 2021, 263, 124341. [Google Scholar] [CrossRef]
  25. Wu, W.-P.; Şopu, D.; Eckert, J. Molecular Dynamics Study of the Nanoindentation Behavior of Cu64Zr36/Cu Amorphous/Crystalline Nanolaminate Composites. Materials 2021, 14, 2756. [Google Scholar] [CrossRef]
  26. Fang, T.-H.; Wu, J.-H. Molecular dynamics simulations on nanoindentation mechanisms of multilayered films. Comp. Mater. Sci. 2008, 43, 785–790. [Google Scholar] [CrossRef]
  27. Wang, J.; Hoagland, R.G.; Liu, X.Y.; Misra, A. The influence of interface shear strength on the glide dislocation–interface interactions. Acta Mater. 2011, 59, 3164–3173. [Google Scholar] [CrossRef]
  28. Wang, J.; Misra, A. An overview of interface-dominated deformation mechanisms in metallic multilayers. Curr. Opin. Solid State Mater. Sci. 2011, 15, 20–28. [Google Scholar] [CrossRef]
  29. Shao, S.; Medyanik, S.N. Dislocation–interface interaction in nanoscale fcc metallic bilayers. Mech. Res. Commun. 2010, 37, 315–319. [Google Scholar] [CrossRef]
  30. Fu, T.; Peng, X.; Weng, S.; Zhao, Y.; Gao, F.; Deng, L.; Wang, Z. Molecular dynamics simulation of effects of twin interfaces on Cu/Ni multilayers. Mater. Sci. Eng. A 2016, 658, 1–7. [Google Scholar] [CrossRef]
  31. Fu, T.; Peng, X.; Chen, X.; Weng, S.; Hu, N.; Li, Q.; Wang, Z. Molecular dynamics simulation of nanoindentation on Cu/Ni nanotwinned multilayer films using a spherical indenter. Sci. Rep. 2016, 6, 35665. [Google Scholar] [CrossRef] [Green Version]
  32. Zhao, Y.; Peng, X.; Fu, T.; Sun, R.; Feng, C.; Wang, Z. MD simulation of nanoindentation on (001) and (111) surfaces of Ag–Ni multilayers. Phys. E Low-Dimens. Syst. Nanostruct. 2015, 74, 481–488. [Google Scholar] [CrossRef]
  33. Etminanfar, M.R.; Sohi, M.H. Corrosion resistance of multilayer coatings of nanolayered Cr/Ni electrodeposited from Cr(III)–Ni(II) bath. Thin Solid Film. 2012, 520, 5322–5327. [Google Scholar] [CrossRef]
  34. Mansoor, N.S.; Fattah-Alhosseini, A.; Shishehian, A.; Elmkahah, H. Tribological properties of different types of coating materials deposited by cathodic arc-evaporation method on Ni-Cr dental alloy. Mater. Res. Express 2019, 6, 056421. [Google Scholar] [CrossRef]
  35. Stott, F.H.; Lin, D.S.; Wood, G.C.; Stevenson, C.W. The tribological behaviour of nickel and nickel-chromium alloys at temperatures from 20° to 800 °C. Wear 1976, 36, 147–174. [Google Scholar] [CrossRef]
  36. Flores, M.; Muhl, S.; Andrade, E. The relation between the plasma characteristic and the corrosion properties of TiN/Ti multilayers deposited by unbalanced magnetron sputtering. Thin Solid Film. 2003, 433, 217–223. [Google Scholar] [CrossRef]
  37. Hovsepian, P.E.; Lewis, D.B.; Münz, W.D. Recent progress in large scale manufacturing of multilayer/superlattice hard coatings. Surf. Coat. Technol. 2000, 133–134, 166–175. [Google Scholar] [CrossRef]
  38. Thompson, A.P.; Aktulga, H.M.; Berger, R.; Bolintineanu, D.S.; Brown, W.M.; Crozier, P.S.; in’t Veld, P.J.; Kohlmeyer, A.; Moore, S.G.; Nguyen, T.D.; et al. LAMMPS—A flexible simulation tool for particle-based materials modeling at the atomic, meso, and continuum scales. Comput. Phys. Commun. 2022, 271, 108171. [Google Scholar] [CrossRef]
  39. Howells, C.A.; Mishin, Y. Angular-dependent interatomic potential for the binary Ni-Cr system. Model. Simul. Mater. Sci. Eng. 2018, 26, 085008. [Google Scholar] [CrossRef] [Green Version]
  40. Jones, J.E. On the determination of molecular fields—II. From the equation of state of a gas; Series A, Containing Papers of a Mathematical and Physical Character. Proc. R. Soc. Lond. 1924, 106, 463–477. [Google Scholar]
  41. Lorentz, H. Ueber die Anwendung des Satzes vom Virial in der kinetischen Theorie der Gase. Ann. Der Phys. 1881, 248, 127–136. [Google Scholar] [CrossRef]
  42. Berthelot, D. Sur le mélange des gaz. Compt. Rendus 1898, 126, 1703–1706. [Google Scholar]
  43. Maghfiroh, C.; Arkundato, A.; Maulina, W. Parameters (σ, ε) of Lennard-Jones for Fe, Ni, Pb for Potential and Cr based on Melting Point Values Using the Molecular Dynamics Method of the Lammps Program. J. Phys. Conf. Ser. 2020, 1491, 012022. [Google Scholar] [CrossRef]
  44. Meng, S.; Liu, Z.; Zhao, X.; Fan, B.; Liu, H.; Guo, M.; Hao, H. Efficient corrosion inhibition by sugarcane purple rind extract for carbon steel in HCl solution: Mechanism analyses by experimental and in silico insights. RSC Adv. 2021, 11, 31693–31711. [Google Scholar] [CrossRef]
  45. Ma, Y.; Fan, B.; Wang, M.; Yang, B.; Hao, H.; Sun, H.; Zhang, H. Two-step preparation of trazodone and its corrosion inhibition mechanism for carbon steel. Chem. J. Chin. Univ. 2019, 40, 1706–1716. [Google Scholar]
  46. Nosé, S. A molecular dynamics method for simulations in the canonical ensemble. Mol. Phys. 1984, 52, 255–268. [Google Scholar] [CrossRef]
  47. Stukowski, A. Visualization and analysis of atomistic simulation data with OVITO–the Open Visualization Tool. Model. Simul. Mater. Sci. Eng. 2009, 18, 015012. [Google Scholar] [CrossRef]
  48. Stukowski, A.; Albe, K. Extracting dislocations and non-dislocation crystal defects from atomistic simulation data. Model. Simul. Mater. Sci. Eng. 2010, 18, 085001. [Google Scholar] [CrossRef]
  49. Stukowski, A.; Bulatov, V.V.; Arsenlis, A. Automated identification and indexing of dislocations in crystal interfaces. Model. Simul. Mater. Sci. Eng. 2012, 20, 085007. [Google Scholar] [CrossRef]
  50. Abadi, P.P.; Maschmann, M.R.; Baur, J.W.; Graham, S.; Cola, B.A. Deformation response of conformally coated carbon nanotube forest. Nanotechnology 2013, 24, 475707. [Google Scholar] [CrossRef]
  51. Giallonardo, J.D.; Erb, U.; Aust, K.T.; Palumbo, G. The influence of grain size and texture on the Young’s modulus of nanocrystalline nickel and nickel–iron alloys. Philos. Mag. 2011, 91, 4594–4605. [Google Scholar] [CrossRef]
  52. Petersen, K.E.; Guarnieri, C. Young’s modulus measurements of thin films using micromechanics. J. Appl. Phys. 1979, 50, 6761–6766. [Google Scholar] [CrossRef]
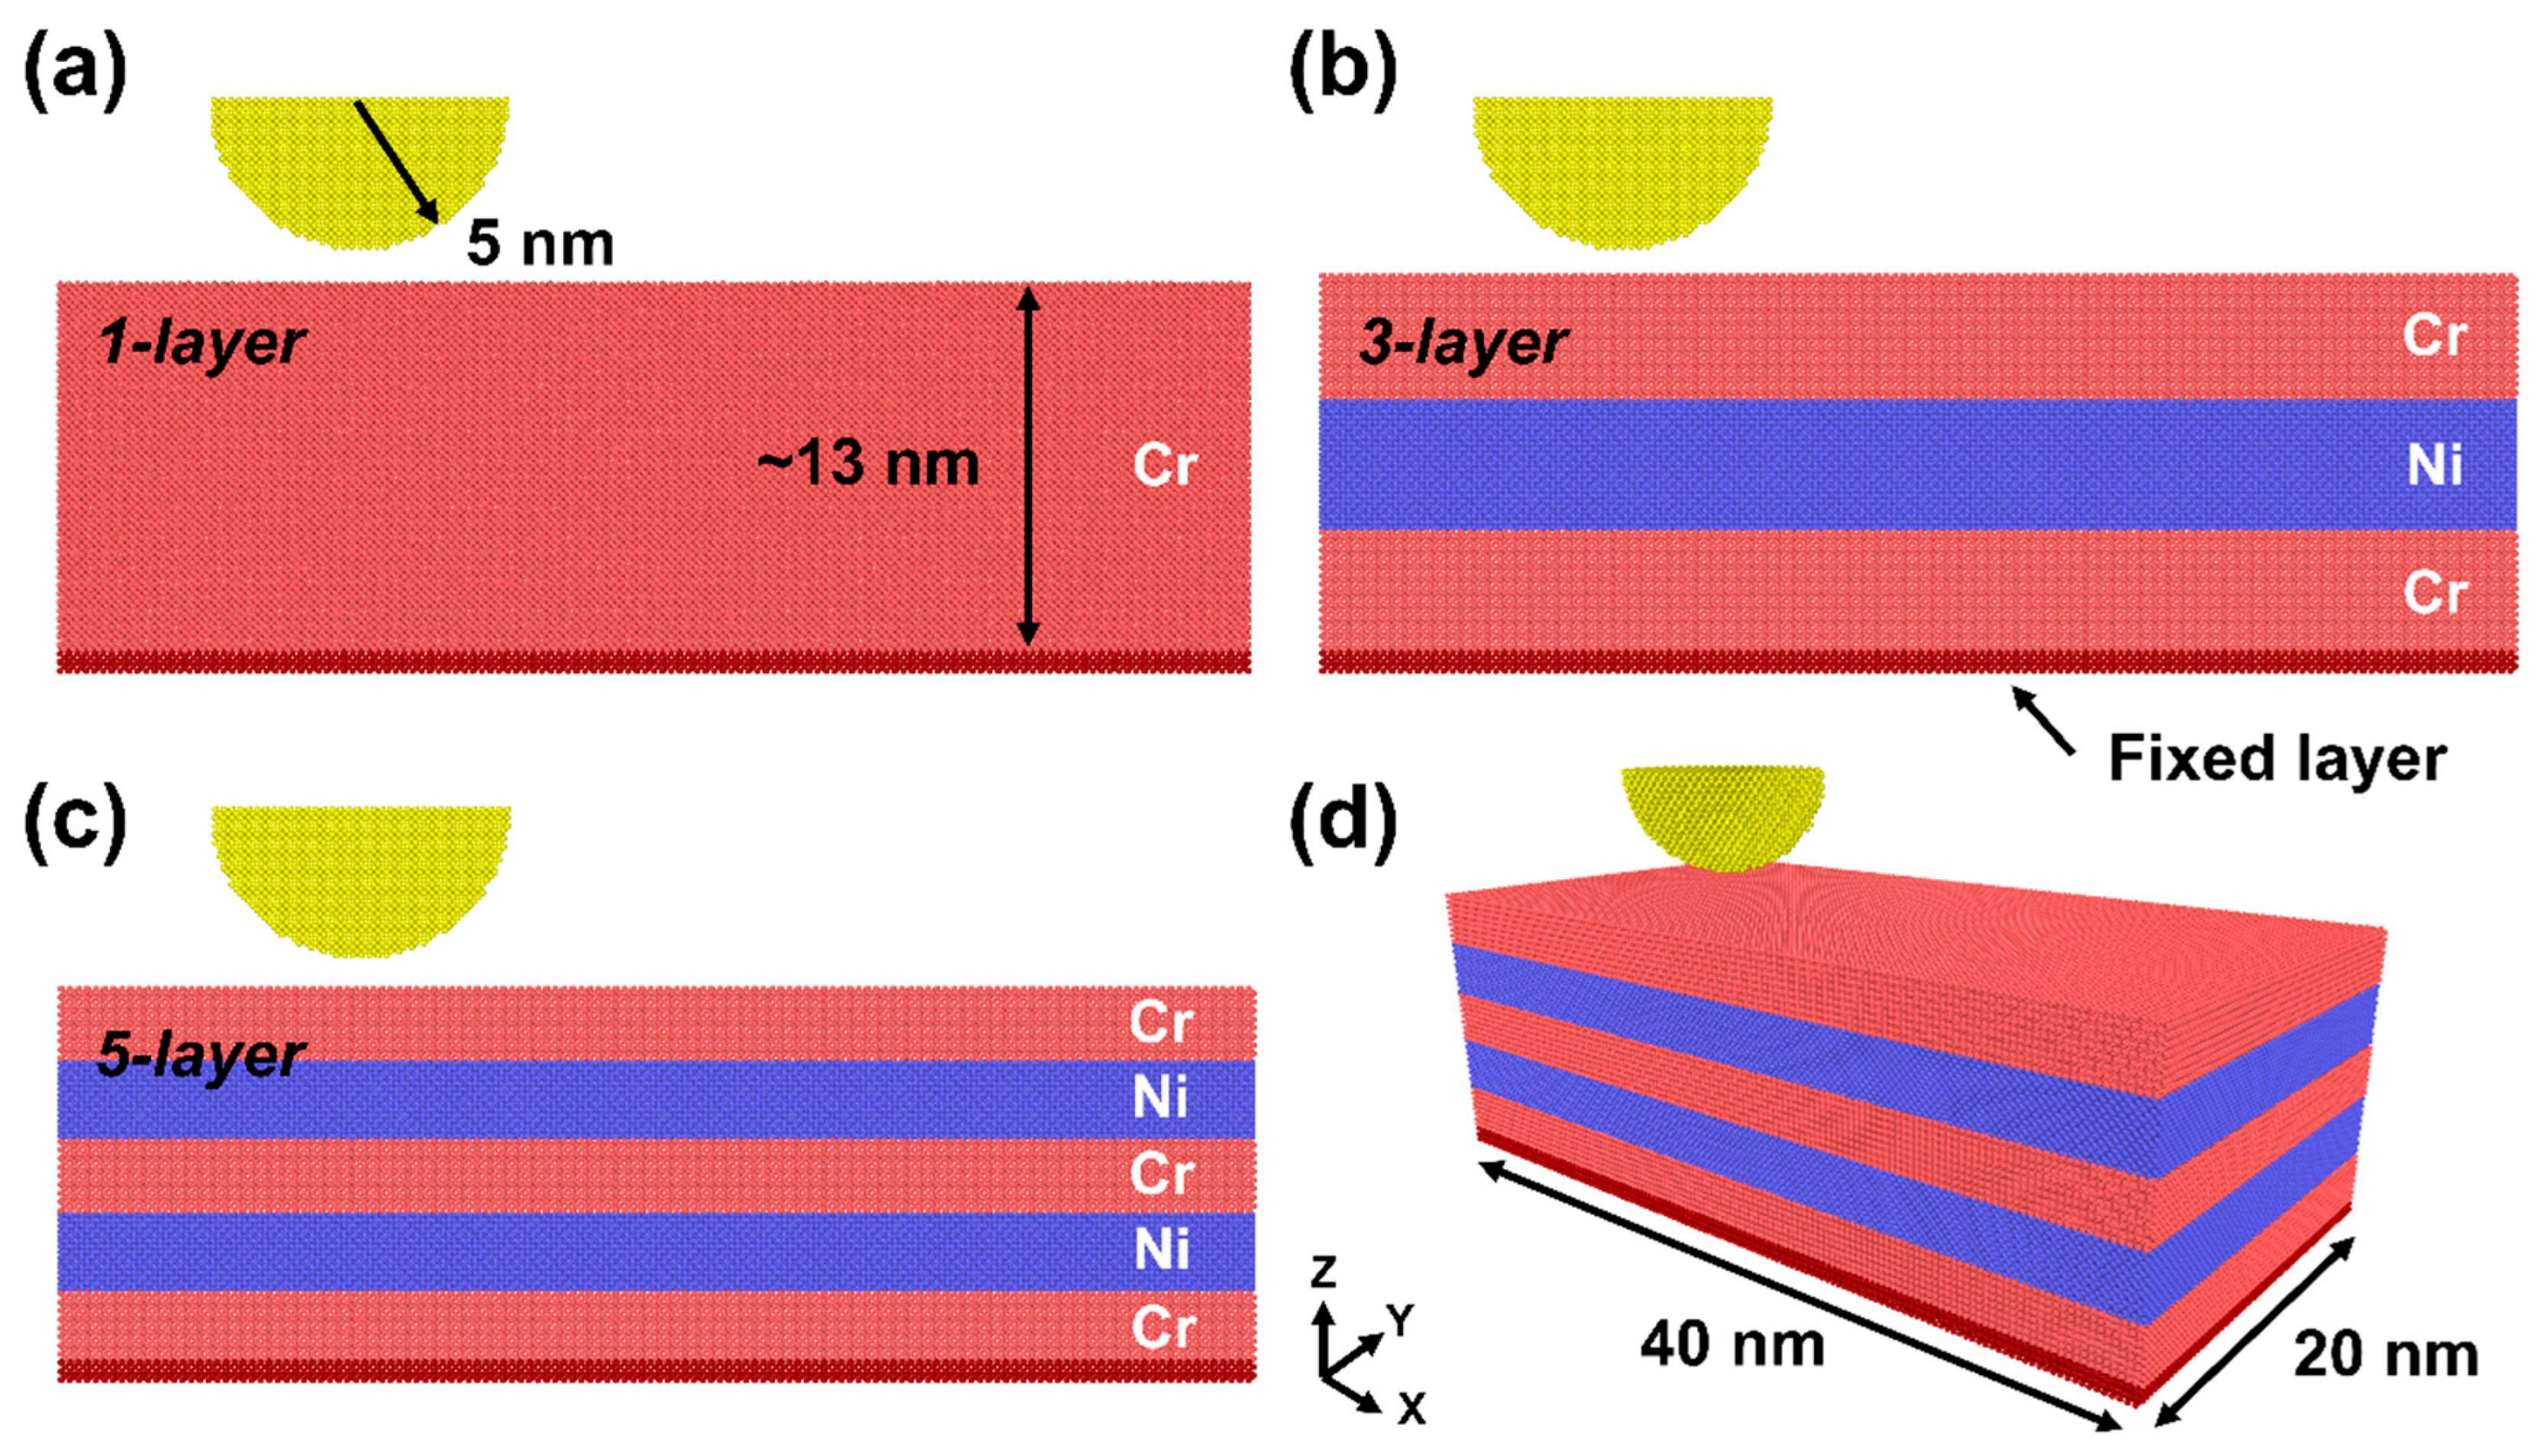
Figure 1. Side view and geometry of (a) one-layer model, (b) three-layer model, and (c) five-layer model. (d) Perspective view of five-layer model. Red atoms underneath each model are set as fixed.
Lubricants 10 00357 g001
Figure 2. F–D curves when indented up to the indentation depth of 50% of total thickness for (a) one-layer, (b) three-layer, and (c) five-layer models. F–D curves obtained during unloading simulations, starting from the indentation depth of 10~50%, are included in each model. The arrow on each F–D curve indicates the first creation of dislocation for each model. Cross-sectional images after the indentation of 50% of total thickness for (d) one-layer, (e) three-layer, and (f) five-layer models.
Lubricants 10 00357 g002
Figure 3. (a) Friction force and (b) corresponding COF with respect to the scratch distance at the indentation depth of 10% for all models. Cross-sectional images after the scratch simulation at the same indentation depth for (c) one-layer, (d) three-layer, and (e) five-layer models. (f) Friction force and (g) corresponding COF with respect to the scratch distance at the indentation depth of 20% for all models. Cross-sectional images after the scratch simulation at the same indentation depth for (h) one-layer, (i) three-layer, and (j) five-layer models.
Lubricants 10 00357 g003
Figure 4. (a) The number of displaced atoms greater than 2 Å with respect to the indentation depth. (b) Wear volume calculated after the scratch simulations with respect to the scratch distance.
Lubricants 10 00357 g004
Figure 5. Visualization of dislocation lines after indentation simulations for (a) one-layer, (b) three-layer, and (c) five-layer models. Visualization of dislocation lines after the scratch simulations started from the indentation depth of 10% for (d) one-layer, (e) three-layers, and (f) five-layers. Visualization of dislocation lines after the scratch simulations started from the indentation depth of 20% for (g) one-layer, (h) three-layers, and (i) five-layers. The red dotted boxes in the images indicate the positions of the Cr BCC layers in each model.
Lubricants 10 00357 g005
Figure 6. The number of dislocation lines with respect to the (a) indentation depth, (b) scratch distance at the indentation depth of 10%, and (c) scratch distance at the indentation depth of 20%.
Lubricants 10 00357 g006
Figure 7. Visualization of the generation and movement of a dislocation line indicated with yellow arrows in the images. (a) An image captured 0.001 ps before the generation of the dislocation line. (b) An image captured at the moment of dislocation line generation. (c) An image captured 0.54 ps after the image (b). (d) An image captured 1.38 ps after the image (c). During the 1.92 ps, the dislocation line glided approximately 3.5 nm. The color of the lines indicates the dislocation type: green lines represent 1/2<111>, while pink lines represent <100>.
Lubricants 10 00357 g007
Publisher’s Note: MDPI stays neutral with regard to jurisdictional claims in published maps and institutional affiliations.