Abstract
The pursuit of environmentally friendly cutting fluids is ongoing as the problems of traditional cutting fluids become more apparent. The bulk of vegetable oils used in studies are consumable and, if marketed, may conflict with human utilization, making cutting fluids more costly. However, few investigations on the use of lesser-known vegetable oils as cutting fluids have been conducted. As a result, the goal of this research is to examine how effective some lesser-known vegetable oils will be if used as a cutting fluid. Based on some physicochemical properties such as acid value and viscosity, the developed vegetable oil-based cutting fluids (watermelon and jatropha) were statistically analyzed using 24 full factorial techniques. This paper aimed at determining the interaction of the physicochemical properties on the developed cutting fluids. Emulsifiers, antifoam agents, biocide, and anti-corrosive agents were considered as natural variables. The effect of the natural variables on the acidity index and viscosity of cutting fluids were fully analyzed with ANOVA, contour, and surface plots. From the responses obtained from the experiment as explained by the independent variables (emulsifying agent, anti-corrosion agent, biocide, and antifoam agent), the watermelon seed oil-based cutting fluid was 89% accurate, while the jatropha oil-based cutting fluid was 75% accurate.
1. Introduction
As oilseeds are predominantly produced for their oil and meal, there has been an increase in the global production of oilseeds over the last 30 years [1]. This would tend to be linked to an increased demand for oilseed products and by-products. The negative impacts of conventional cutting fluid on the environment and the health of the machinist are a major barrier to sustainable machining. Cutting fluids are primarily used in a machining operation to satisfy the cutting functions and non-cutting functions. The cutting functions are to reduce the heat generated during machining by cooling the machining interface; serve as a lubricant and protective film layer to the tool-workpiece interface to avoid the gumming of the cutting tool, and thereby enhance the tool life; and to enhance the surface quality of the machined product. The non-cutting functions take care of the environmental impacts and the health of the operator. According to various research reports, vegetable oil has the potential for fulfilling the cutting functions and non-cutting functions of cutting fluids because of its lubricity properties. Therefore, vegetable oil will not only serve as an essential part of man’s diet, but will also improve sustainable practices in machining operations. Vegetable oils have attracted growing interest due to growing environmental advantages and the fact that they are based on renewable resources [2].
Cutting fluid production can use a range of different oil sources. For the manufacturing of cutting fluid, non-edible vegetable oils, also known as second-generation fuel sources, can be regarded as potential substitutes for conventional edible food sources. Because of the high need for edible oils as a food source for humans, the utilization of non-edible plant oils is particularly important. Furthermore, the feedstock prices of culinary oils are simply too high to be employed as a cutting fluid. As a result, making cutting fluid from non-edible oils is an excellent technique to avoid all of the complications that come with using edible oils. The potential for transforming non-edible oil into cutting fluid, on the other hand, must be thoroughly investigated. This is because the physical and chemical qualities of cutting fluid formed from any feedstock must meet the limits of the cutting fluid standard of specifications [3]. The knowledge of the classification of vegetable oil as edible or non-edible is possible because of the physicochemical properties, and these will stimulate the potential of producing cutting fluids from non-edible vegetable oils.
Physicochemical properties are the intrinsic physical and chemical characteristics of a substance [4]. A chemical property is any property of a material that emerges throughout a chemical reaction; that is, any feature that could only be generated by altering a material’s chemical characteristics. Chemical qualities cannot be established simply by looking at or touching a thing; the material’s interior composition must be altered to explore its chemical properties. Physical qualities, on the other hand, are those that can be quantified or examined without affecting the material’s chemical composition. A lot of chemical reactions take place when machining at elevated temperatures, and the heat generated causes mist that can be easily inhaled by the machinist. Knowledge of the physicochemical properties is needed to eliminate unsafe practices in machining [5].
The applicability of vegetable oils in the industry for the generation of biofuel, bio-lubricant, or polymer is dependent on their physicochemical properties because determining the best operating parameters and scaling-up of these processes require knowledge of several physicochemical parameters such as viscosity, acid value, density, refractive index, specific heat capacity, saponification value, iodine value, and peroxide value [6]. All of these physicochemical parameter values are intrinsic features of oils and also indicate an overall condition of the oils’ unsaturation [7]. To evaluate the constituent composition of oils, many physical and chemical criteria of edible oil have been used [8,9]. Several researchers have investigated the effect of temperature on the oil stability, viscosity, peroxide value, and iodine value to determine the oil’s quality and functioning [10,11]. The composition and physical and chemical properties of the oils suggest the applicability of the oil and will also help to monitor the individual structure of the vegetable oil. This study was designed to investigate the effect of two lesser-known vegetable oils as potential cutting fluids in machining, with emphasis on some of their physicochemical properties.
2. Methodology
Six liters of vegetable oils were extracted from each of the watermelon and jatropha seeds, which is due to the high percentage of oil recovery for solvent extraction. Viscous washing soap (8–12 mL), sodium molybdate (1–2 mL), triziane (0.5–1.0 mL), and silicones (0.5–1.0 mL) were added as additives to the vegetable oils using 24 factorial designs to determine the best combinations [12,13]. Each assay was formulated by first mixing oil in water, followed by the four additives. Each assay contained a total volume of 100 mL. The aim was to study the best composition for these formulations and the efficiency of the additives. This mixture was carried out with the aid of a mechanical magnetic stirrer at 760 rpm for 10 min at a room temperature of 25 °C. Magnetic stirrers are silent and provide the possibility of stirring closed systems without the need for isolation, as in the case of mechanical agitation, and the mixture was uniformly mixed and no separation after the mixture was observed. The 16 samples were characterized to identify the acid values and viscosity. The acid values of the extracted oils were carried out in triplicate with the procedure adopted from [14,15] and were evaluated using Equation (1). On the other hand, the viscosities of the samples were evaluated using an Oswald kinematic viscometer [16,17] at a temperature of 80 °C and were evaluated using the relationship in Equation (2). The oils’ viscosities were evaluated at a temperature of 80 °C to further check the conformation to viscosity limit at an elevated temperature, as machining is done at an elevated temperature. The photographic view of the viscosity measurement is shown in Figure 1. Minitab software 16 was adopted for the full factorial technique, contour plot, and surface plot analyses. Response surface methodology (RSM) is a sequential procedure and is used to optimize the process parameters and to find the sweet spot for multi-response parameters. The response variables can be influenced by several independent variables, and four phases of RSM were employed in the research, namely, discovery, breakthrough, optimization, and validation. The optimum point is where the sources are minimum, and the output is maximum and we move rapidly sequentially toward the optimum point with a method of steepest ascent. Central composite design (CCD) was used to spot the curvature in the design model. Analysis of variance (ANOVA) was used to determine the parameters that greatly affect the response variable.
where Mo is the molarity of KOH (M), Vo = vol. of KOH (mL), and Ws is the weight of the sample (kg)
where ρ is the density in g/mL, t is time in seconds, and P and Q are the constants.
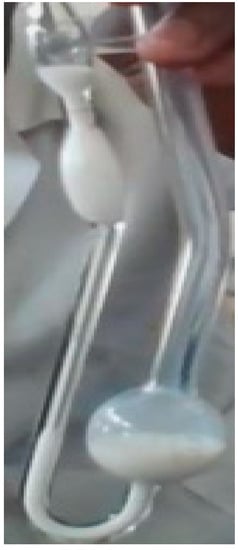
Figure 1.
Determination of the kinematic viscosity.
3. Results and Discussion
The analysis of the physicochemical properties of watermelon seed oil-based cutting fluid was carried out using the four natural variables (emulsifier, antifoam, anti-corrosive agent, and biocide), as presented in Table 1. All of the measurements were taken in triplicates and the average values are recorded in the entire tables.

Table 1.
Analysis of the physicochemical properties of the prepared watermelon seed oil-based cutting fluids.
Given that the natural variables are the emulsifying agent, anti-corrosion agent, biocide, and antifoam agent, their transformations to coded values are given by Equations (3)–(6):
3.1. Response Surface Regression: Acid Value vs. A, B, C, and D
Table 2 and Table 3 show the responses from the surface regression for acid values in watermelon seed oil-based for the estimated regression coefficient and analysis of variance, respectively.
Table 2.
Estimated regression coefficients for acid value of watermelon seed oil-based.
Table 3.
Analysis of variance for acid value of watermelon seed oil-based.
From Table 4, the acid value of watermelon vs. A, B, C, and D, it was observed that only biocide and antifoam agents were significant using the response surface technique. The optimized model for the response surface is given by Equation (7):
Table 4.
Table of coefficients for the acid values.
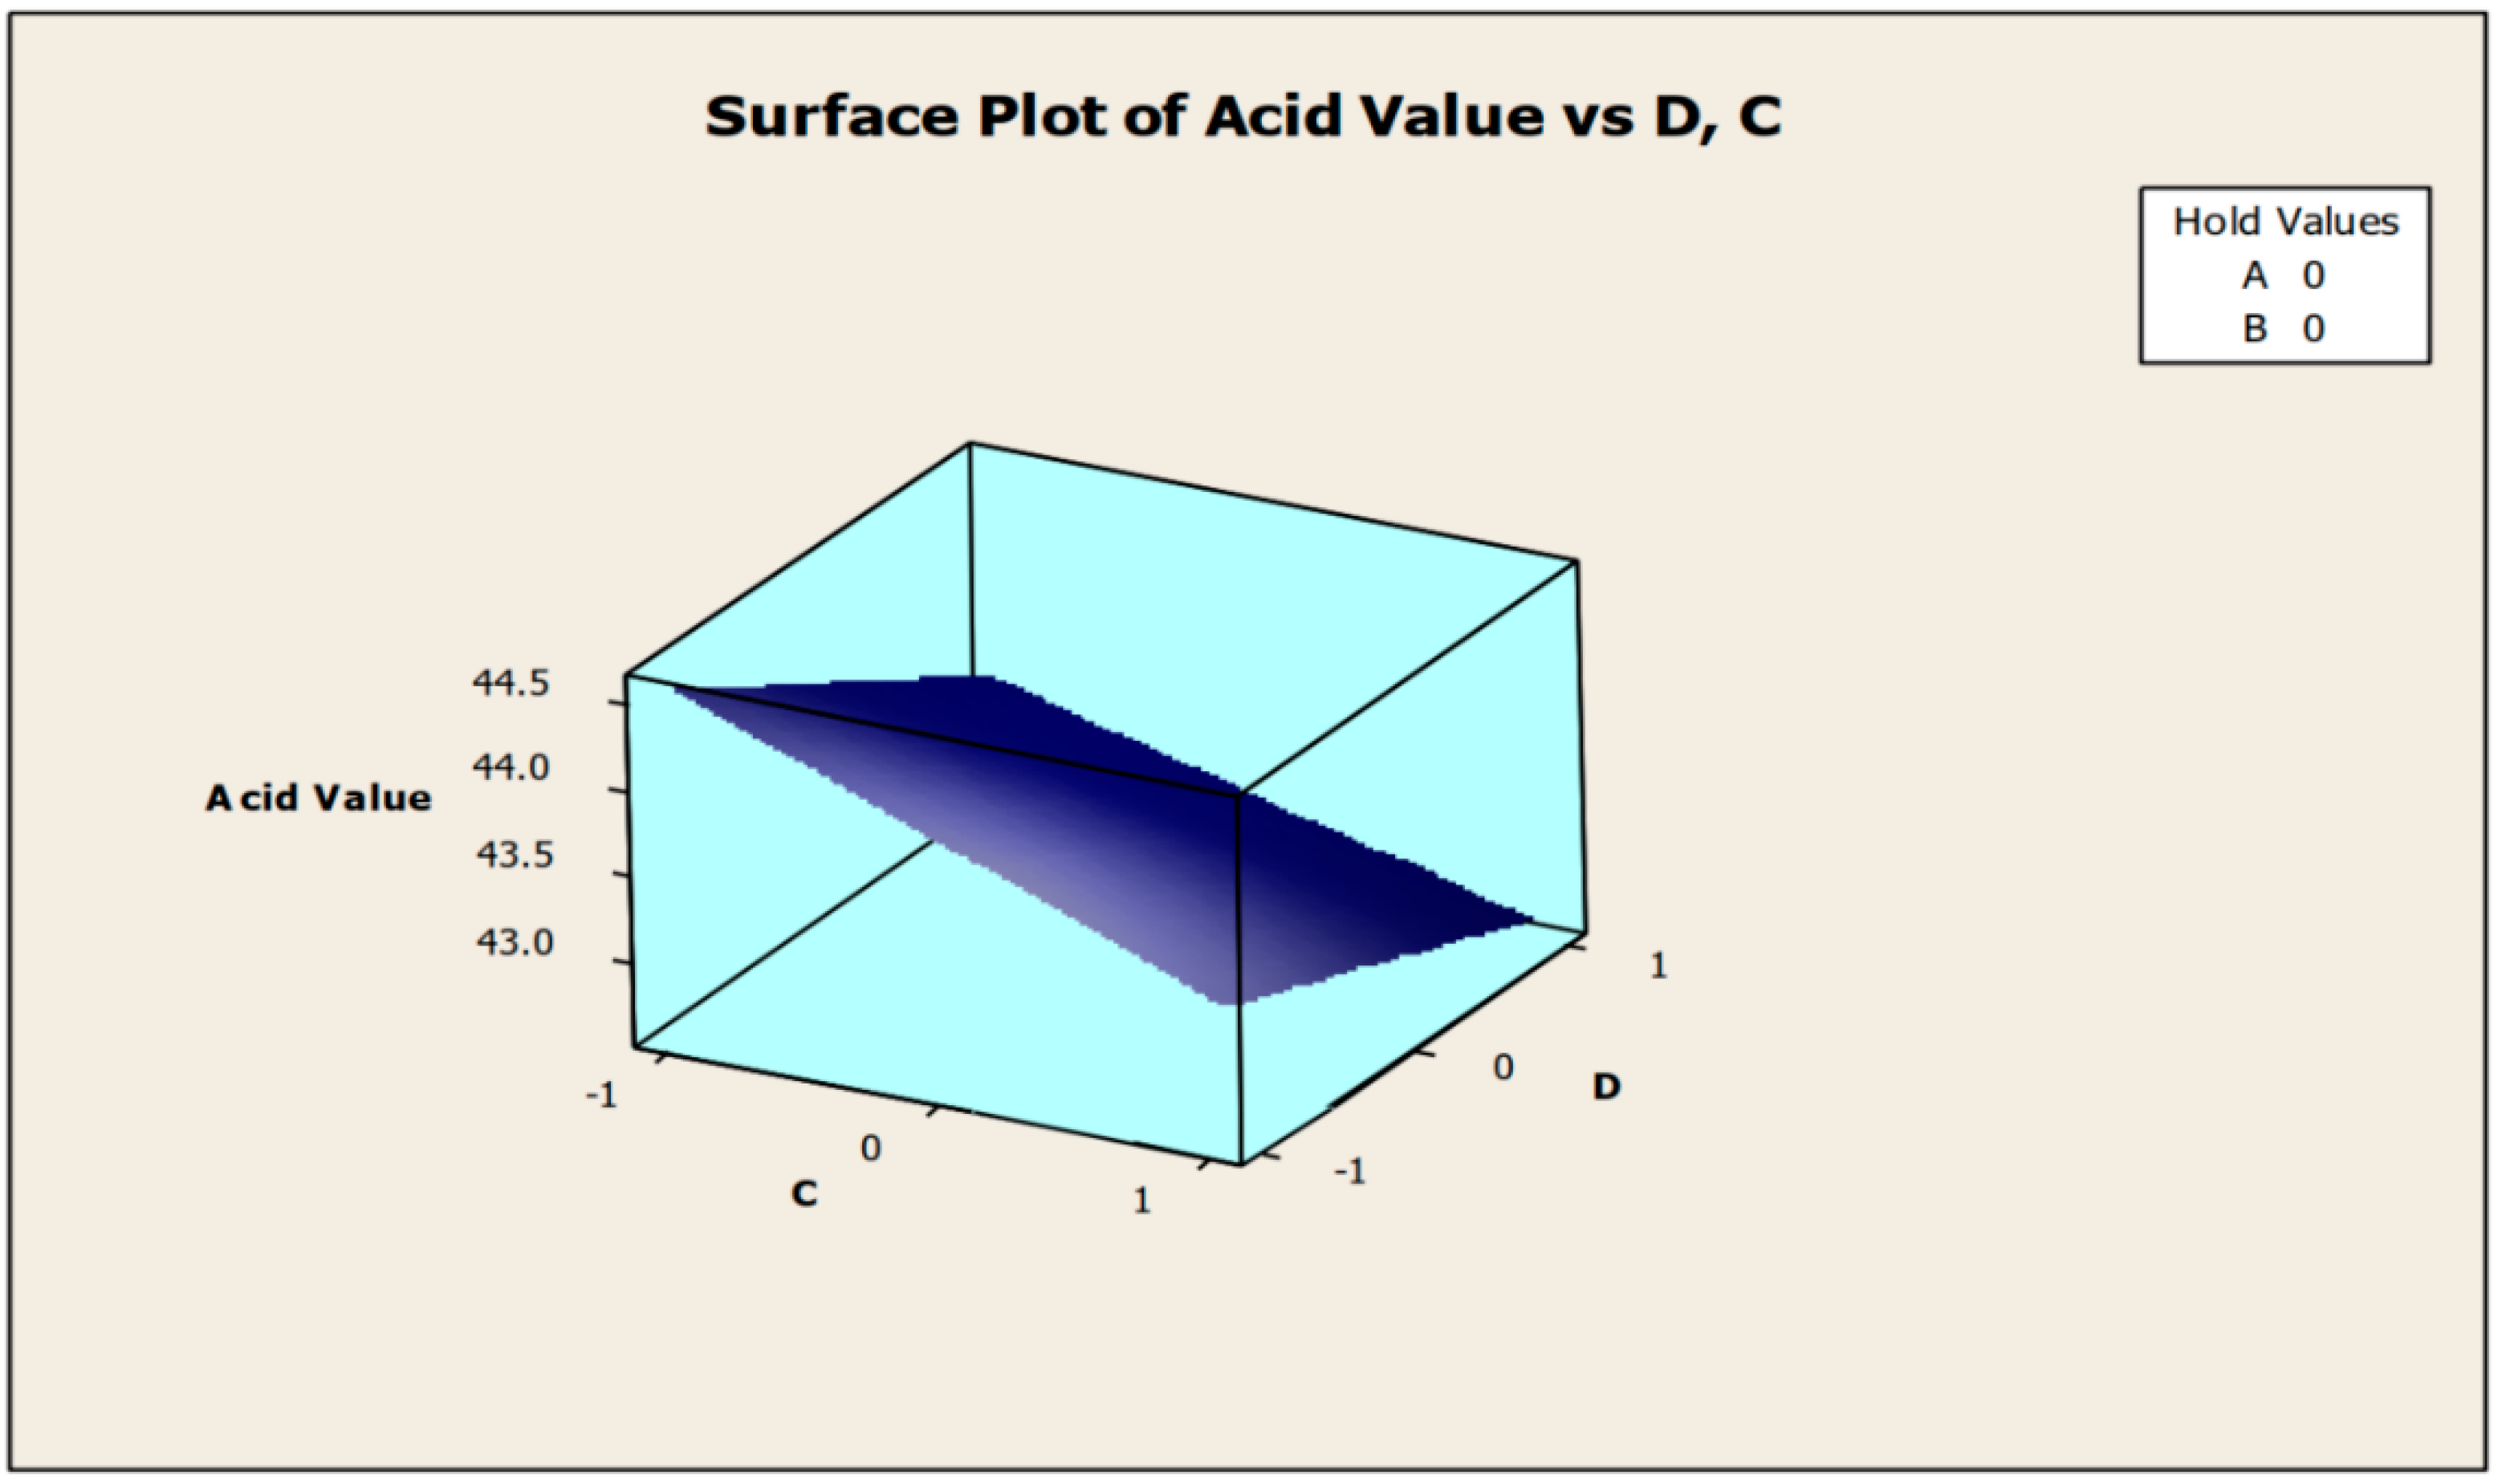
Only the significant coefficients at 5% were selected in the equation. The R-squared indicating the “validity of the model” indicates that the independent variables predicted roughly 89% of the responses obtained from the acidity test (emulsifying agent, anti-corrosion agent, biocide, and antifoam agent). As a result, the developed model is 89% suitable. The aggregate of all linear effects and interaction effects (which compensate for the regression effect) is significant at 10%, but not at 5%, according to Table 5. Figure 2 and Figure 3 show how the addition of a biocide and an antifoam agent alters the acidity of watermelon seed oil-based when used as a cutting fluid. Values greater than 44.5 were discovered to be the acidity peak; this was reached strictly around −1 biocide and −1 antifoam agent (using coded values). This means that when the biocide and antifoam agents contribute 0.525% each, the acidity of watermelon seed oil-based used as a cutting fluid will be larger than 44.5. Around the region where the biocide is 0.7 and the antifoam agent is 0.5, the acid value was found to be less than 43. Biocide and antifoam agents provide 0.925% and 0.875%, respectively, in this region.
Table 5.
Analysis of variance for the acid value.
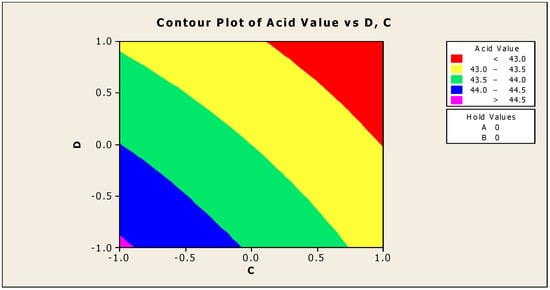
Figure 2.
Contour plot of acid values vs. biocide (C) and antifoam agent (D).

Figure 3.
Surface plot of acid values vs. biocide (C) and antifoam agent (D).
3.2. Response Surface Regression: Viscosity vs. A, B, C, and D
Table 6 and Table 7 show the responses from surface regression for the viscosity of watermelon seeds oil-based for estimated regression coefficient and analysis of variance respectively.
Table 6.
Estimated regression coefficients for viscosity of watermelon seed oil-based.
Table 7.
Responses from surface regression for the viscosity of watermelon seed oil-based.
From Table 8 for viscosity vs. A, B, C, and D, it was observed that only the antifoam agent and the interaction effect between “anti-corrosion agent and biocide” were significant at 5%, meanwhile biocide and the interaction effect between “emulsifying agent” were significant at 10%, using the response surface technique. Equations (8) and (9) give the optimal model for the response surface at 5% and 10% significant levels, respectively:
Table 8.
Table of coefficients for viscosity of watermelon seed oil-based.
The “adequacy of the model” R-squared shows that the independent variables explained roughly 91% of the responses obtained from the acidity experiment (emulsifying agent, anti-corrosion agent, biocide, and antifoam agent). This signifies that the designed model is 91% acceptable. Table 9 also demonstrates that the sum of all linear and interaction effects (which account for the regression effect) is statistically significant at 5%.
Table 9.
Regression effect for the viscosity of watermelon seed oil-based.
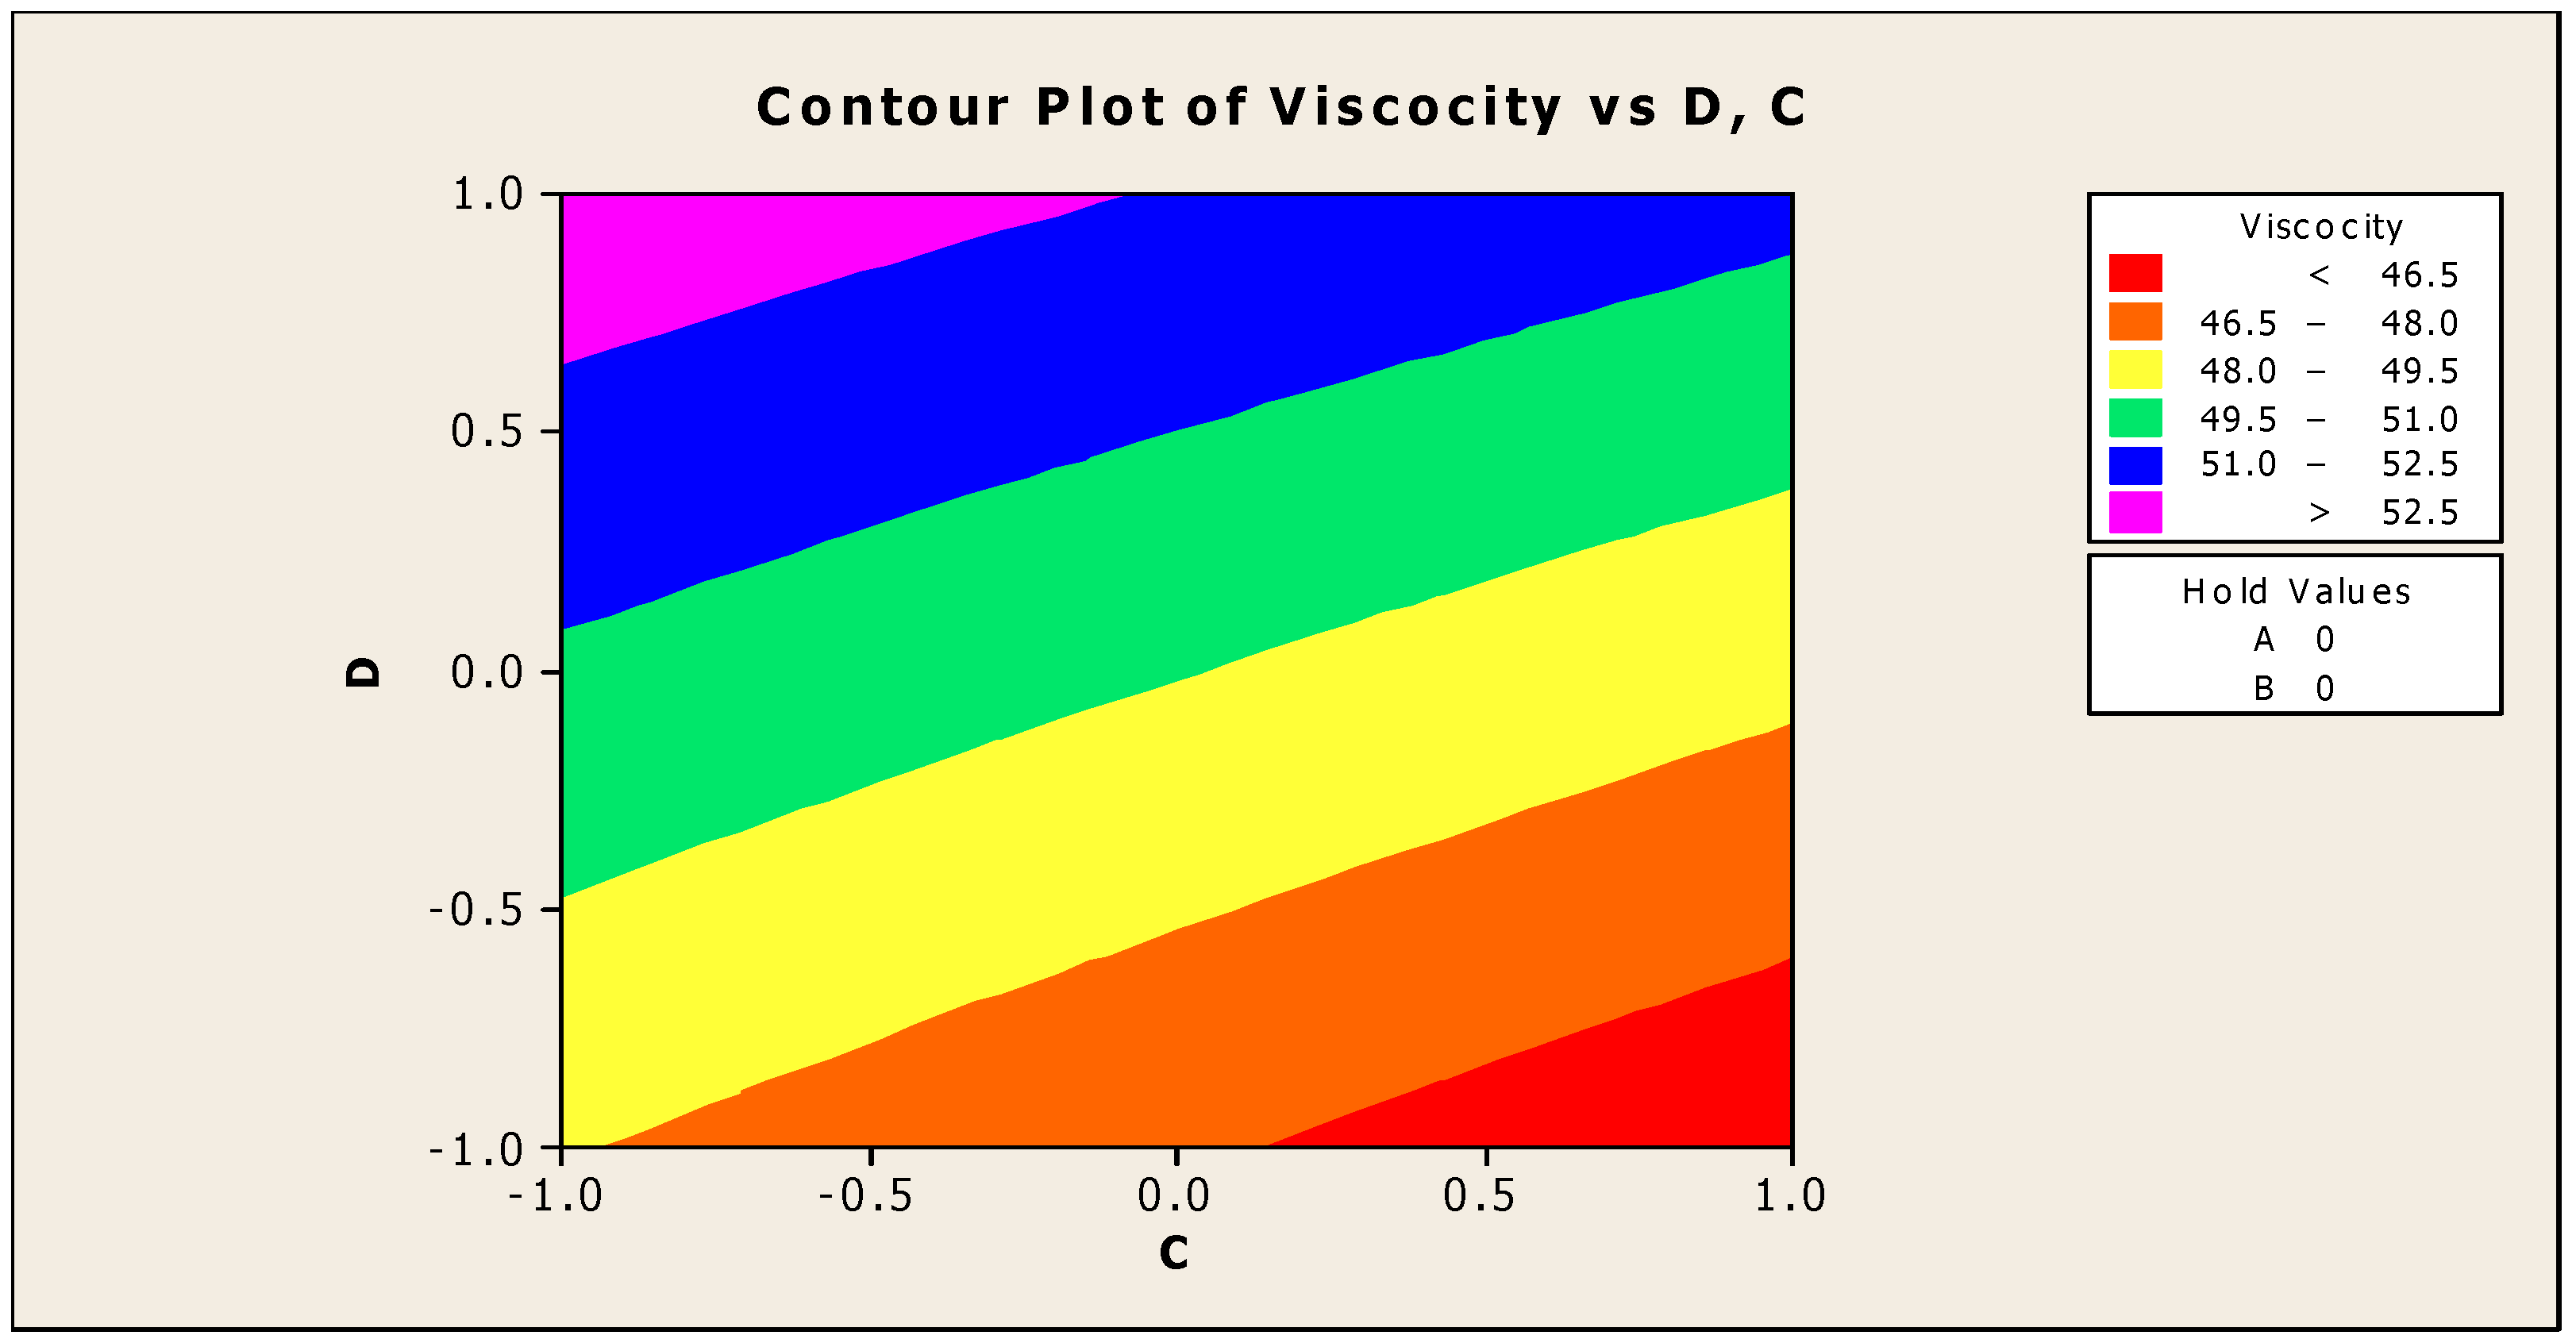
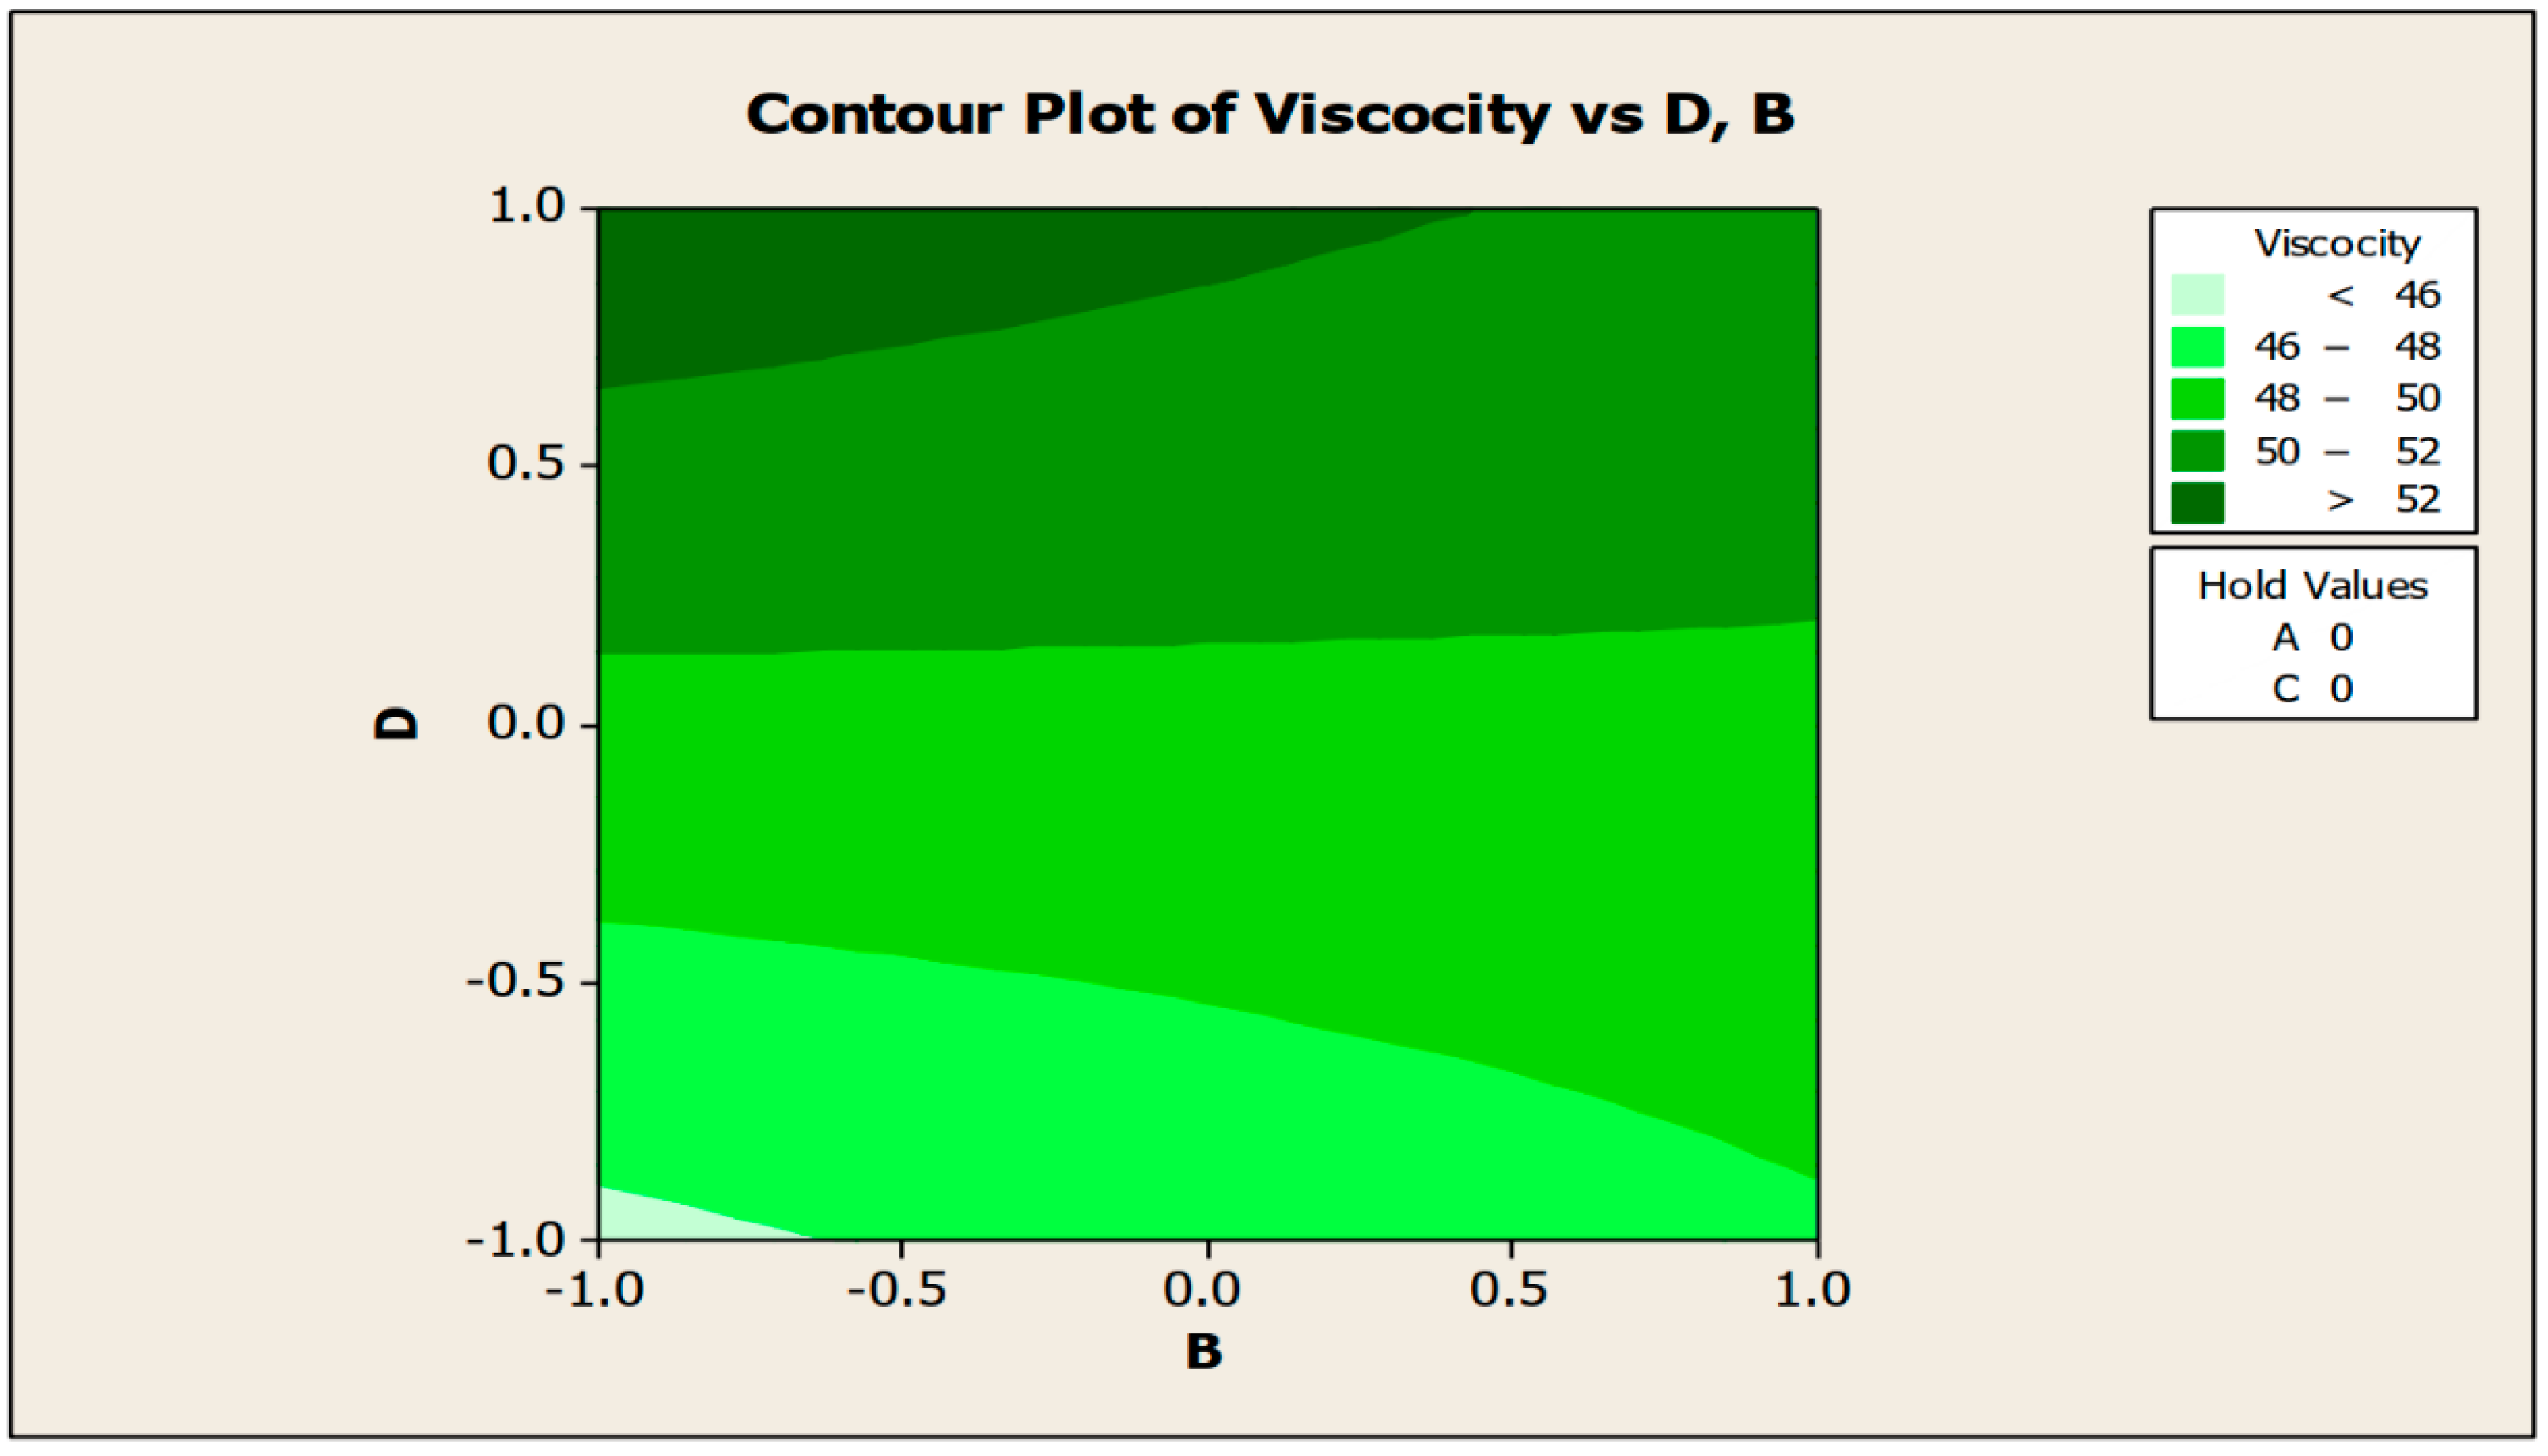
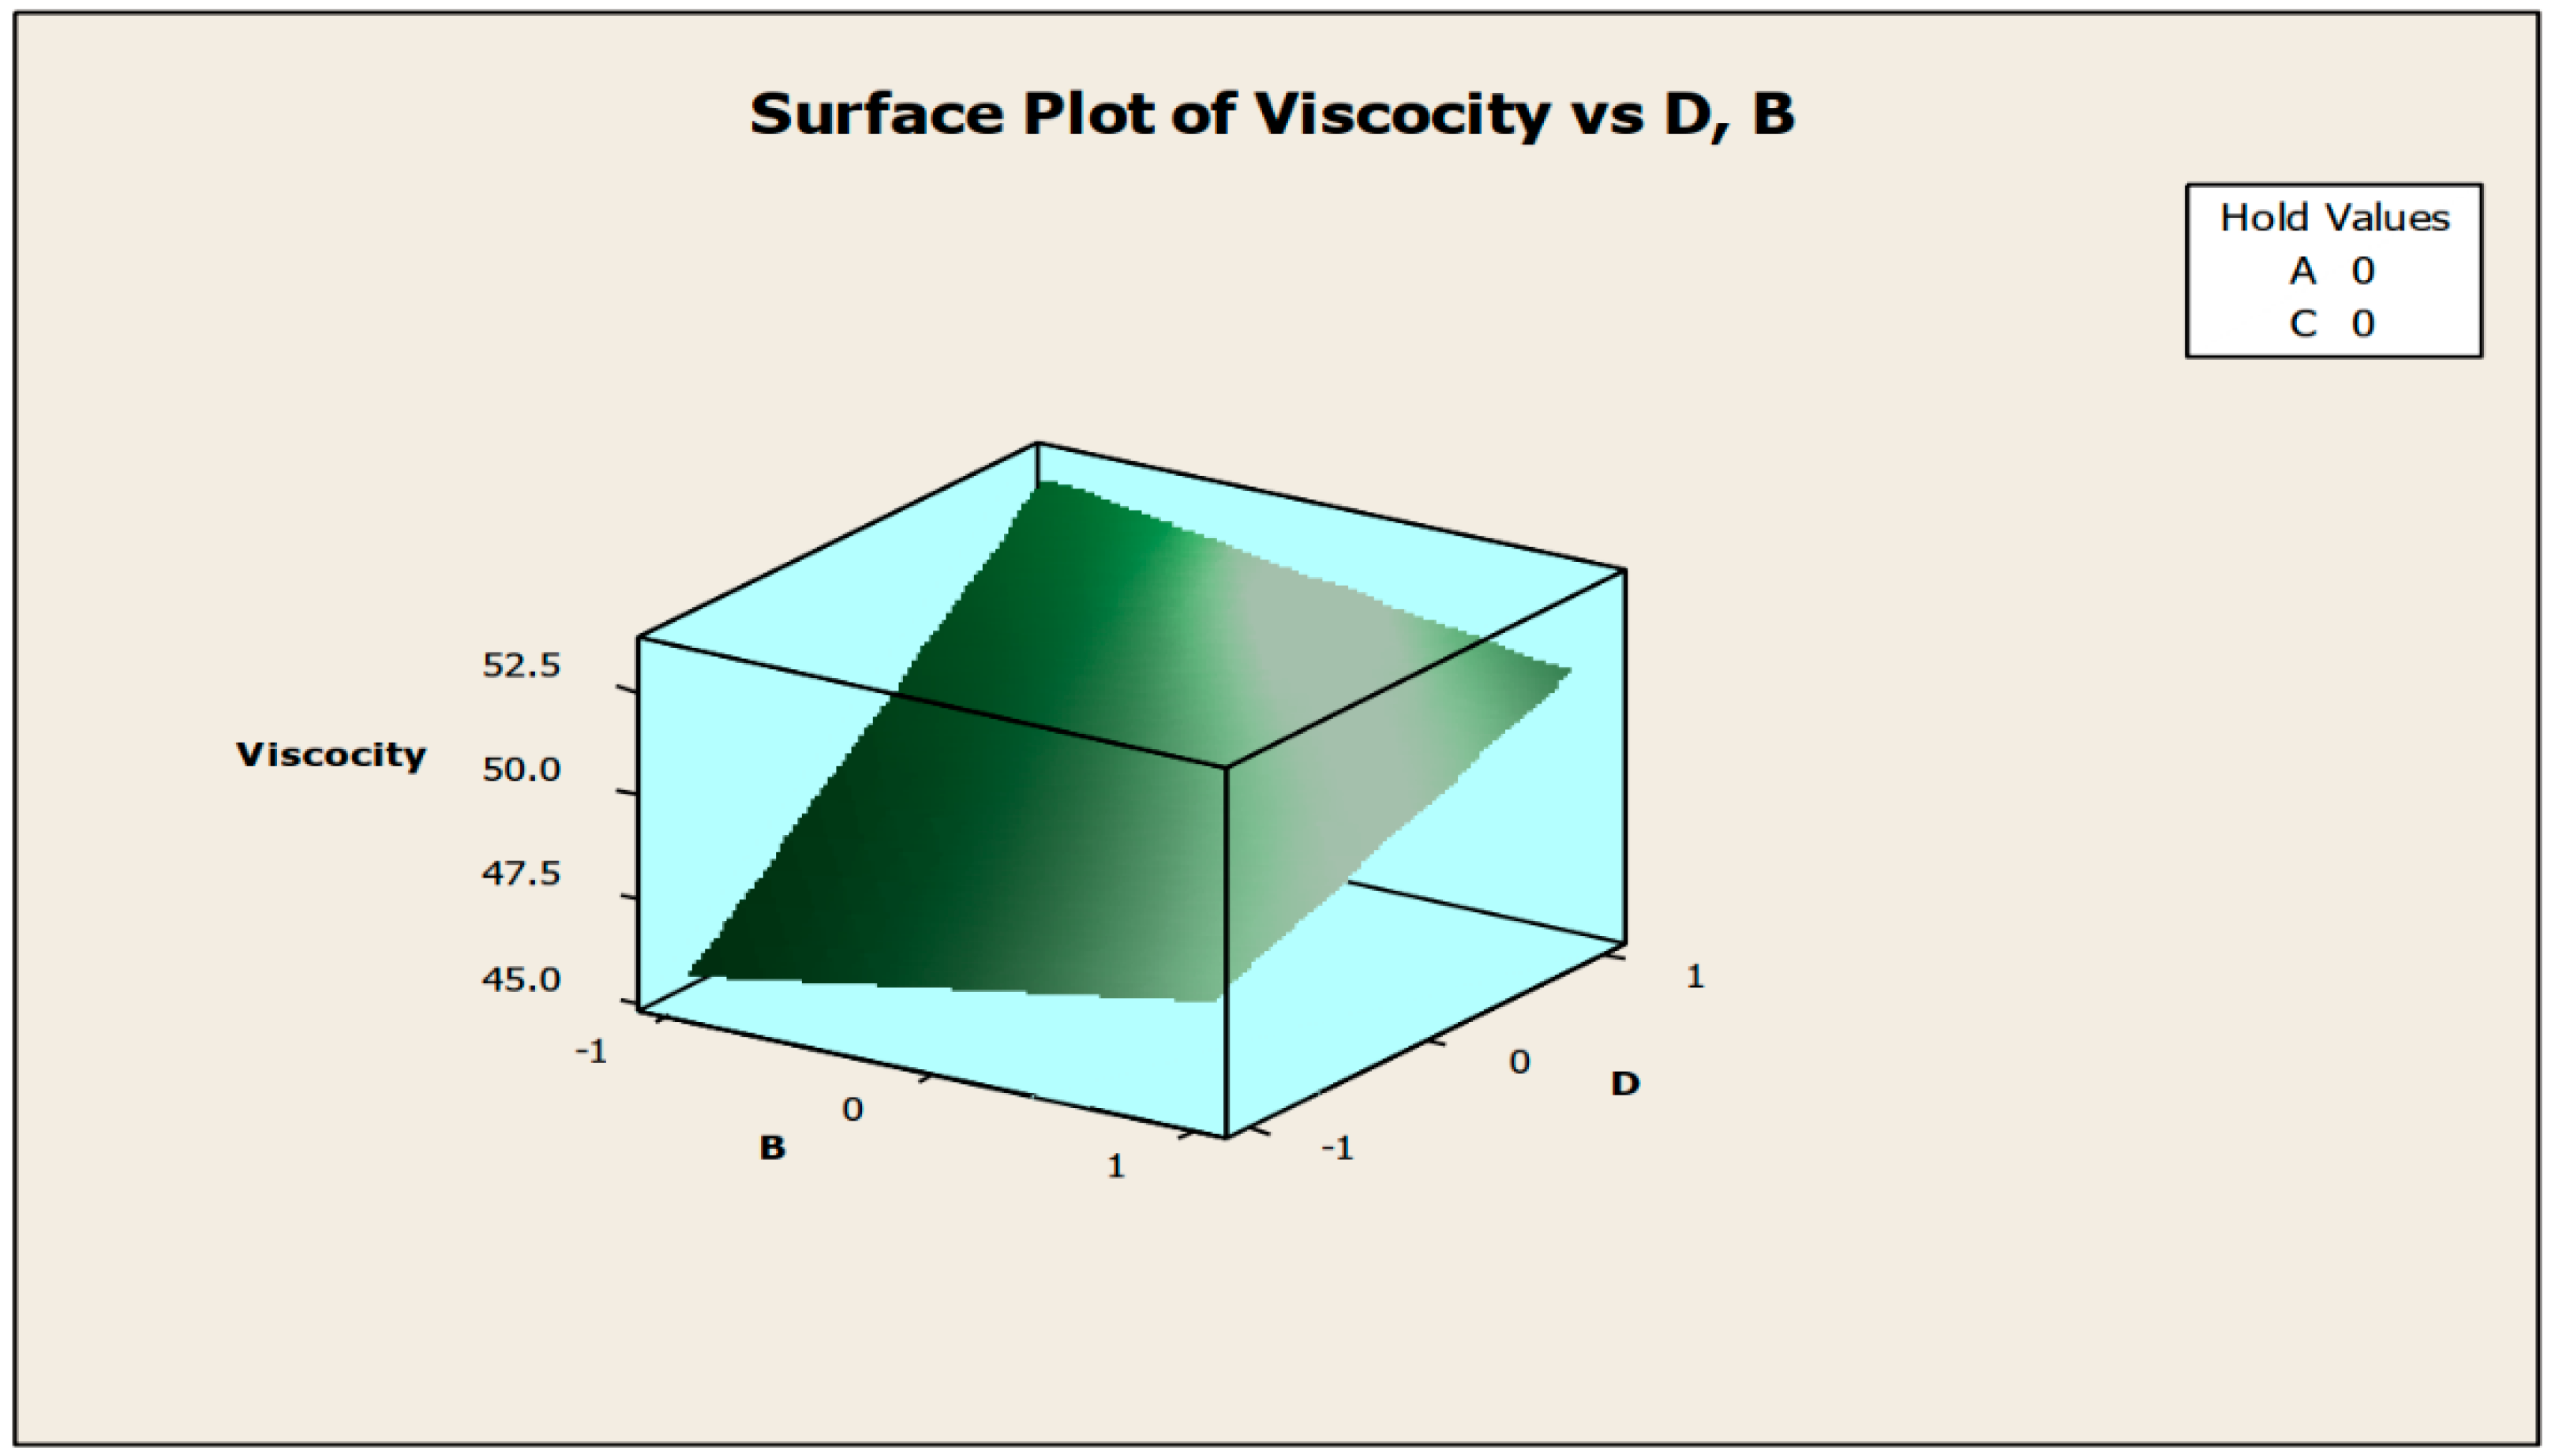
The contour and surface plots in Figure 4 and Figure 5 illustrate how biocide and antifoam agents impact the viscosity of watermelon seed oil-based when used as a cutting fluid. The viscosity peak was found to be more than 52.5 in a region where the viscosity was fairly eased around −0.5 biocide and 0.6 antifoam (using the coded values). This denotes that when watermelon seed oil-based is used as a cutting fluid, the viscosity will exceed 52.5, with biocide and antifoam agent contributions of 0.625% and 0.9%, respectively. The minimum viscosity was found to be less than 46.5 when biocide was loosely around the region of 0.7 and the antifoam agent was also loosely around −0.9 (using coded values). This implies that, to obtain minimum viscosity of values less than 46.5, the contribution from the biocide should be in the region (or slightly deviating from) of 0.925%, and the contribution from the antifoam agent should be in the region (or slightly deviating from) of 0.525%. Figure 6 and Figure 7 show how anti-corrosion and antifoam additives affect the viscosity of watermelon seed oil-based when used as a cutting fluid, respectively. The peak of viscosity was attained in the region of 0.7 for antifoam agents and −0.6 for anti-corrosion agents with values greater than 52 (using coded values). It was also observed that the region around these peak values of viscosity was fairly loose; hence, a little deviation in the contribution of these substances is not expected to disrupt the peakedness of the viscosity of the watermelon seed oil-based cutting fluid [17]. This indicates that when watermelon seed oil-based is used as a cutting fluid, the viscosity will surpass 52 when the antifoam agent contribution is at (or slightly diverging from) 0.925%, and the anti-corrosion agent contribution is at (or slightly deviating from) 1.2%. The viscosity was determined to be at its lowest with values less than 46 in a zone where the antifoam agent and anti-corrosion agent were both strictly −1. Thus, to achieve a minimum viscosity value of less than 46, the contribution of the antifoam agent must not deviate from 0.5%, and the contribution of the anti-corrosion agent must not stray from 1%.

Figure 4.
Contour plot of viscosity vs. biocide (C) and antifoam agents (D).
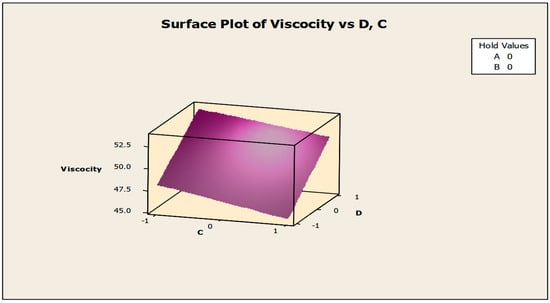
Figure 5.
Surface plot of viscosity vs. biocide (C) and antifoam agents (D).
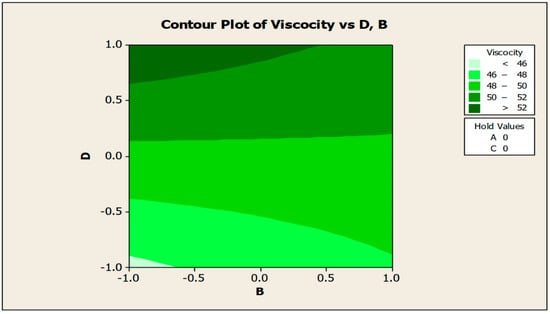
Figure 6.
Contour plot of viscosity vs. anti-corrosive (B) and antifoam agents (D).
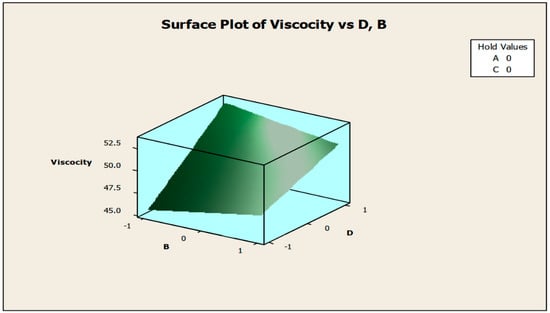
Figure 7.
Surface plot of viscosity vs. anti-corrosive (B) and antifoam agents (D).
The four natural variables (emulsifier, antifoam, anti-corrosive agent, and biocide) were used to analyze the physicochemical parameters of jatropha oil-based cutting fluid, as shown in Table 10.
Table 10.
Analysis of the physicochemical properties of the prepared jatropha oil-based cutting fluids.
3.3. Response Surface Regression: Acid Value vs. A, B, C, and D
Table 11 and Table 12 show the responses from the surface regression for the acid value of jatropha oil-based cutting fluid for the estimated regression coefficient and analysis of variance, respectively.
Table 11.
Estimated regression coefficients for the acid value of jatropha oil-based cutting fluid.
Table 12.
Analysis of variance for the acid value of jatropha oil-based cutting fluid.
According to Table 13 (table of coefficients) for the acid value (of jatropha) vs. A, B, C, and D, none of the qualities were significant at 5% by using the response surface technique; however, at 10% level of significance, the anti-corrosion and antifoam agents were noteworthy. The prediction fit for the response surface is given by Equation (10):
Table 13.
Table of coefficient for acid values.
Only the significant coefficients at 10% were selected in the equation. The R-squared indicating the “accuracy of the model” indicates that the independent variables explained approximately 75% of the responses obtained from the acidity experiment (emulsifying agent, anti-corrosion agent, biocide, and antifoam agent). This implies that the planned model is 75% adequate in agreement with the work reported in [18]. The ANOVA table (see Table 14) also demonstrates that the sum of all linear effects and interaction effects (which compensate for the regression effect) is not significant at 5% or 10%.
Table 14.
Analysis of variance for acid values.
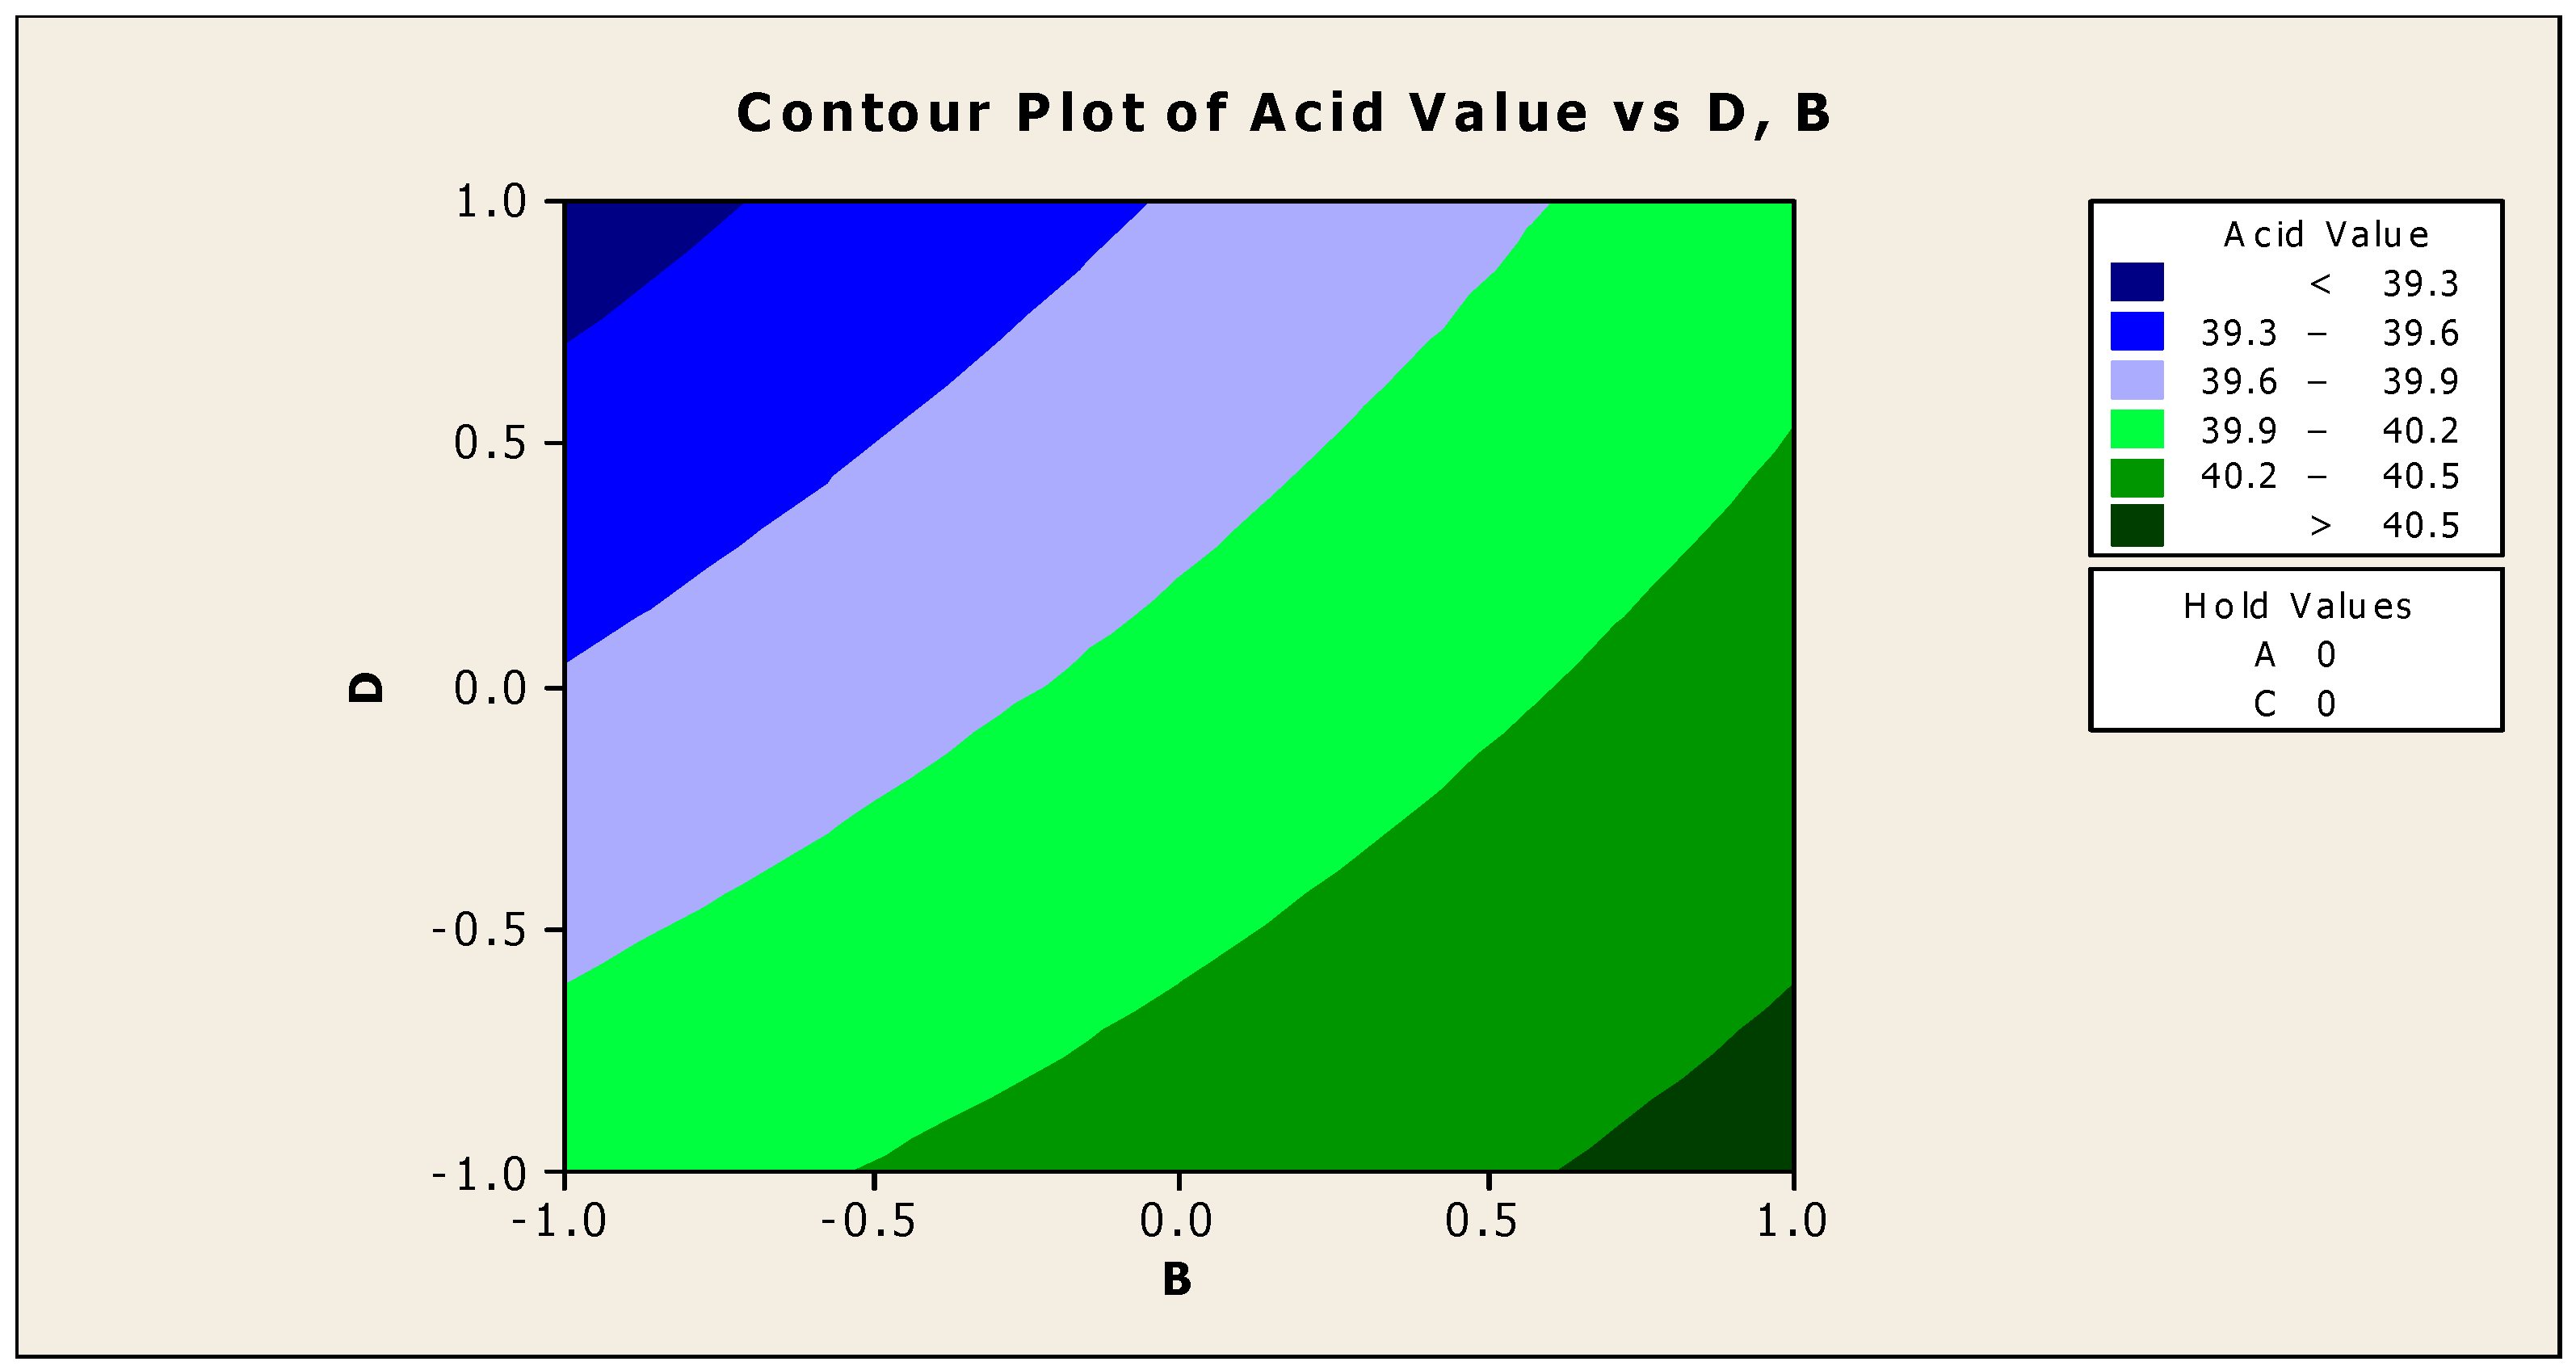
Figure 8 and Figure 9 demonstrate the contour and surface plots of how anti-corrosion and antifoam chemicals alter the acidity of jatropha oil when used as a cutting fluid. The greatest achievable acid values were over 40.5; at this point of acidity, antifoam and anti-corrosion agents are anticipated to strictly lie in the region of −0.9 and 0.9, respectively (using coded values). This explains that the maximal acid value of jatropha oil can be obtained only with 0.525% antifoam agent and 1.95% anti-corrosion agent. The contribution deviation is fairly stringent, thus any noticeable effect will cause the acidity to deviate from its peak [19]. The minimal acidity was found to be less than 39.3 in an area where the antifoam and anti-corrosion agents are both strictly 0.9 (using coded values). This means that for jatropha oil to have the lowest acidity value, the simultaneous contributions of the antifoam and anti-corrosion agents must be 0.975% and 1.05%, respectively, with no fluctuation tolerated.
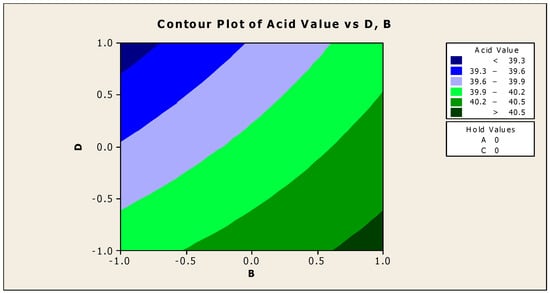
Figure 8.
Contour plot of acid value vs. anti-corrosion agent (B) and antifoam agent (D).
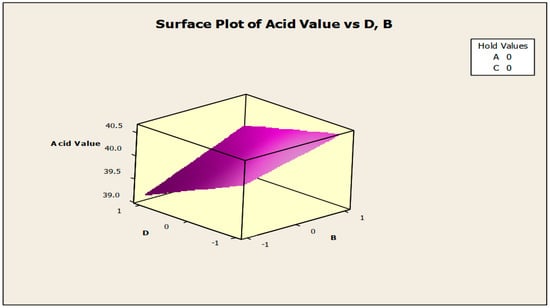
Figure 9.
Surface plot of acid value vs. anti-corrosion agent (B) and antifoam agent (D).
3.4. Response Surface Regression: Viscosity vs. A, B, C, and D
Table 15 and Table 16 show the responses from the surface regression for the viscosity of jatropha oil-based cutting fluid for the estimated regression coefficient and analysis of variance, respectively.
Table 15.
Estimated surface regression coefficients for the viscosity of jatropha oil-based cutting fluid.
Table 16.
Analysis of variance for viscosity of jatropha oil-based cutting fluid.
Table 17 (table of coefficients) for viscosity (of jatropha) vs. A, B, C, and D reveals that neither of the properties were significant at 5% using the response surface technique, but biocide, antifoam agents, the interaction effect of “anti-corrosion agents and biocide”, and the interaction effect of “biocide and antifoam agents” were significant at 10% statistical significance. Equation (11) gives the predictive fit for the response surface:
Table 17.
Table of coefficient for viscosity of jatropha.
In the equation, only significant coefficients at 10% were chosen. The R-squared indicating “model adequacy” demonstrates that the independent variables explained roughly 83% of the responses obtained from the acidity experiment (emulsifying agent, anti-corrosion agent, biocide, and antifoam agent). As a result, the developed model is 83% acceptable. Table 18 also demonstrates that the sum of all linear and interaction effects (which account for the regression effect) is not statically important at 5% or 10%.
Table 18.
Regression effect for the viscosity of jatropha oil.
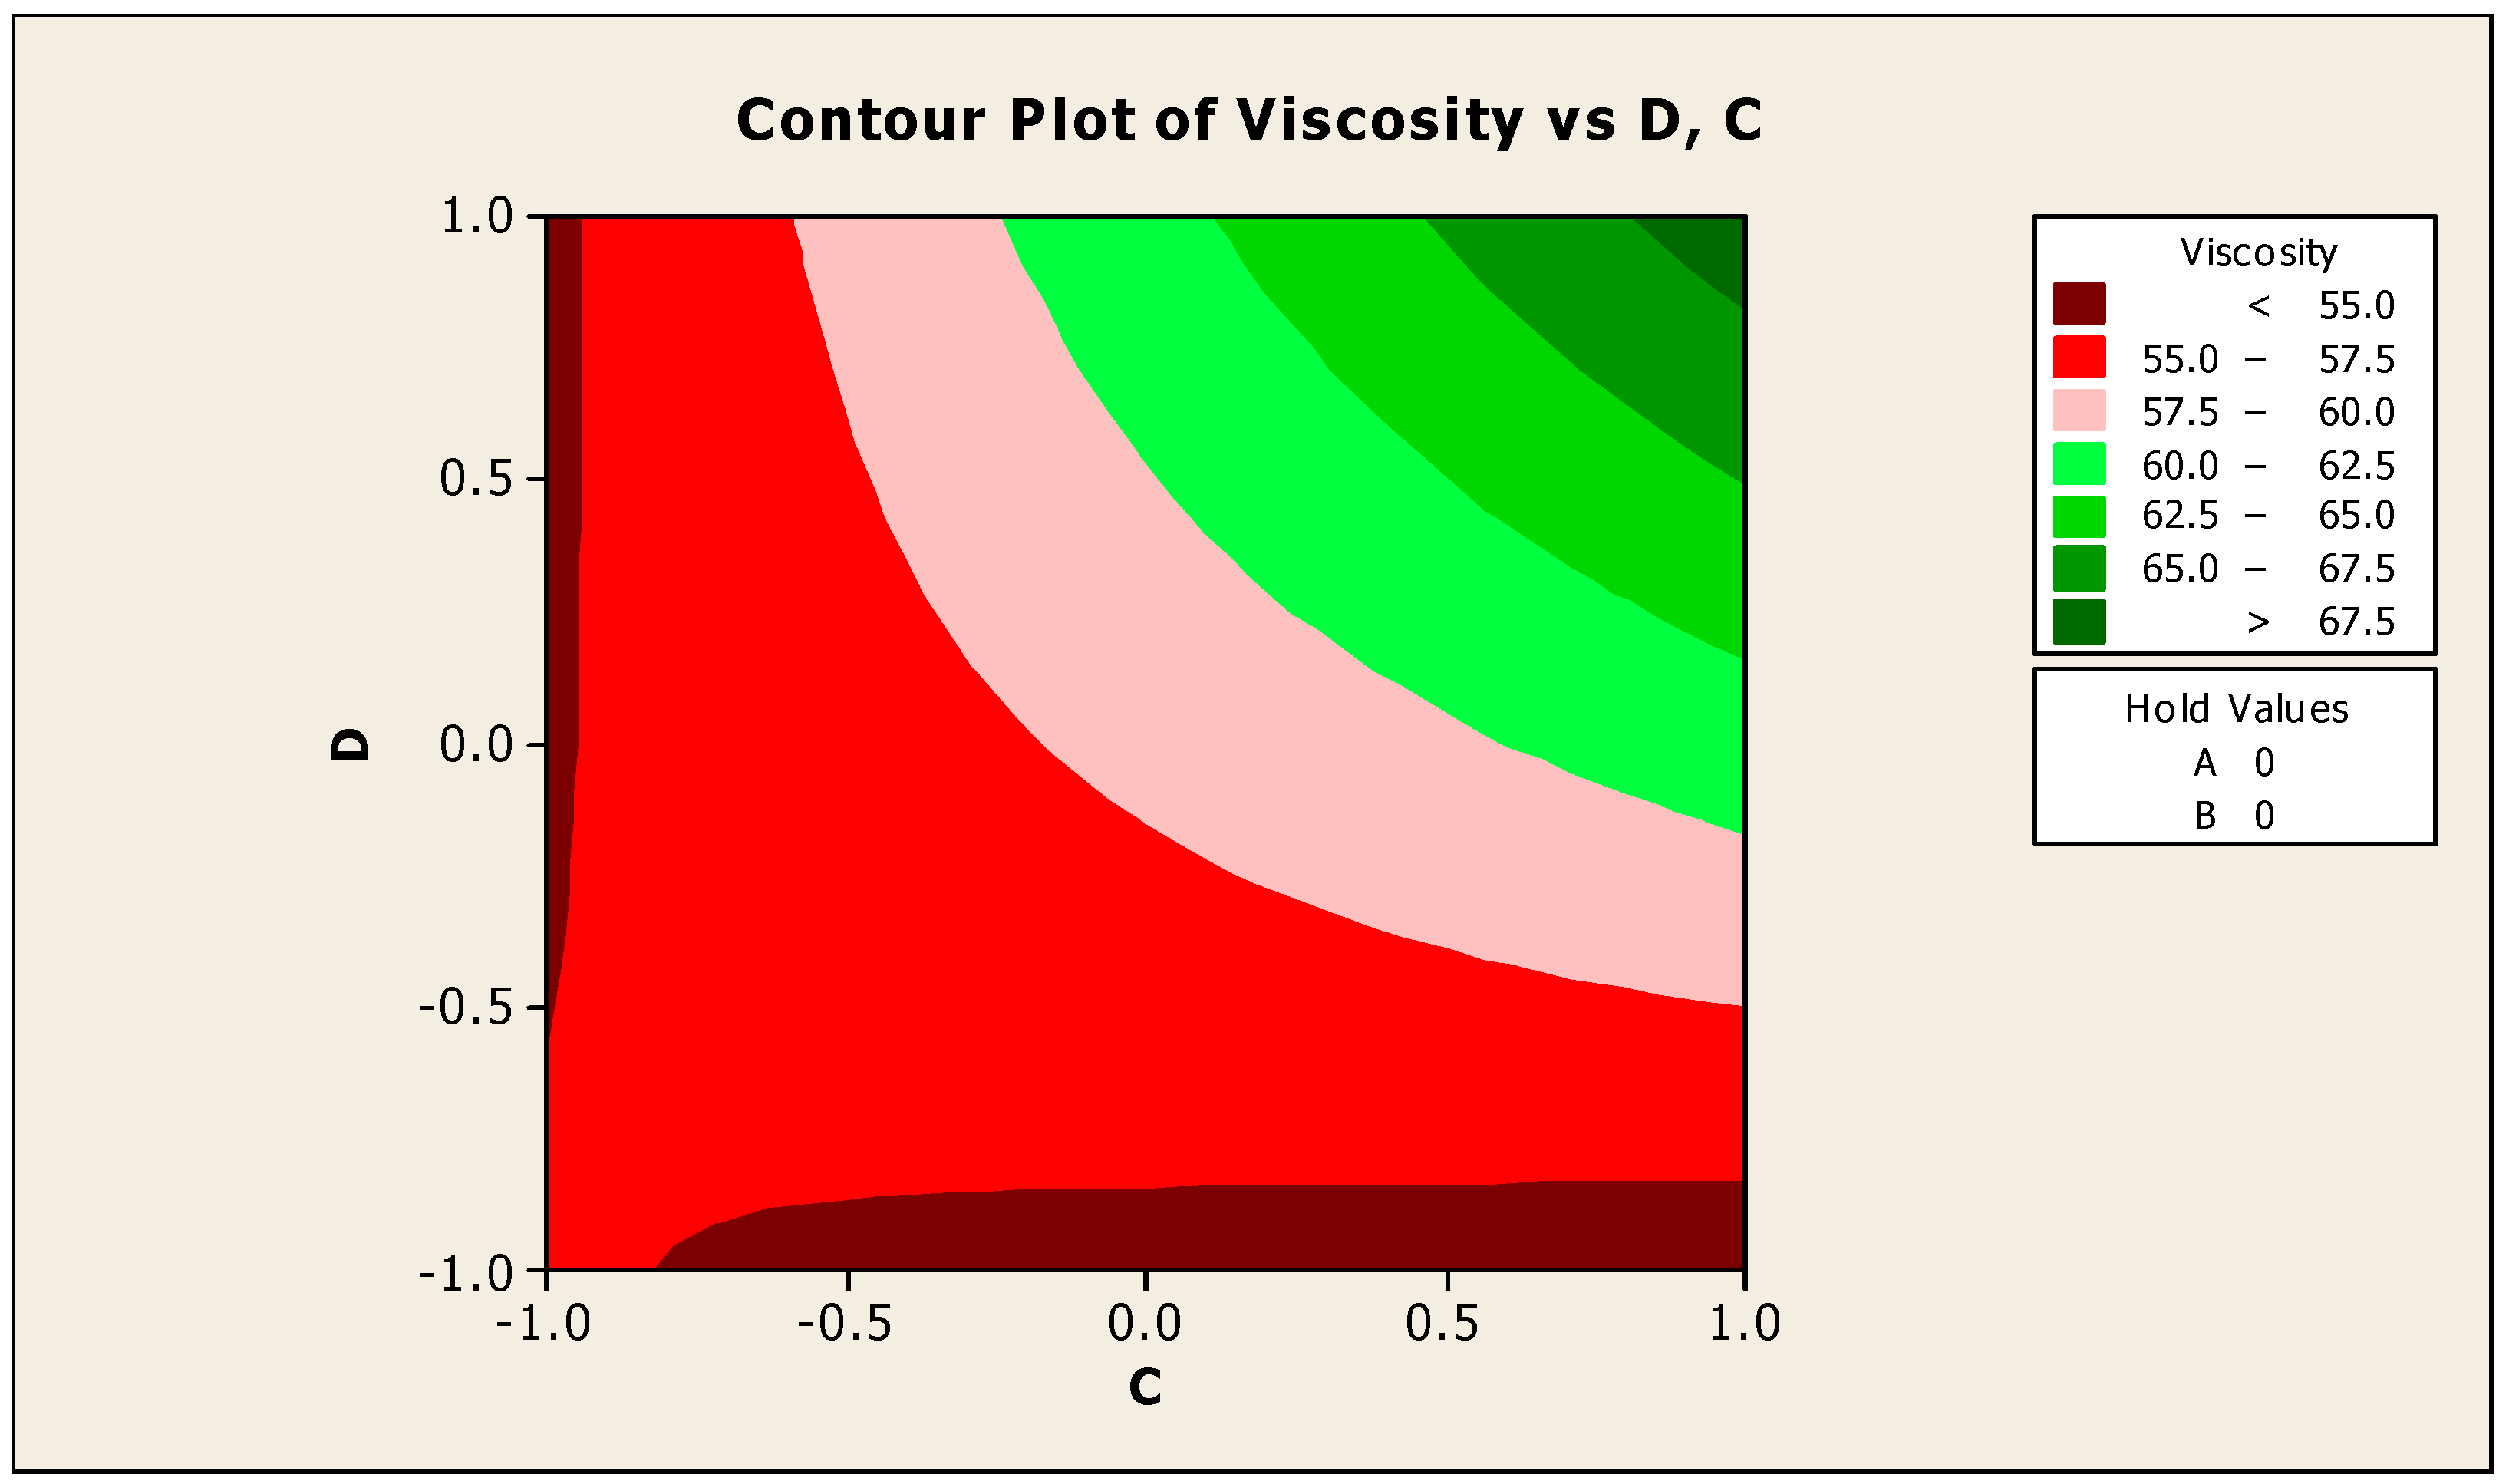
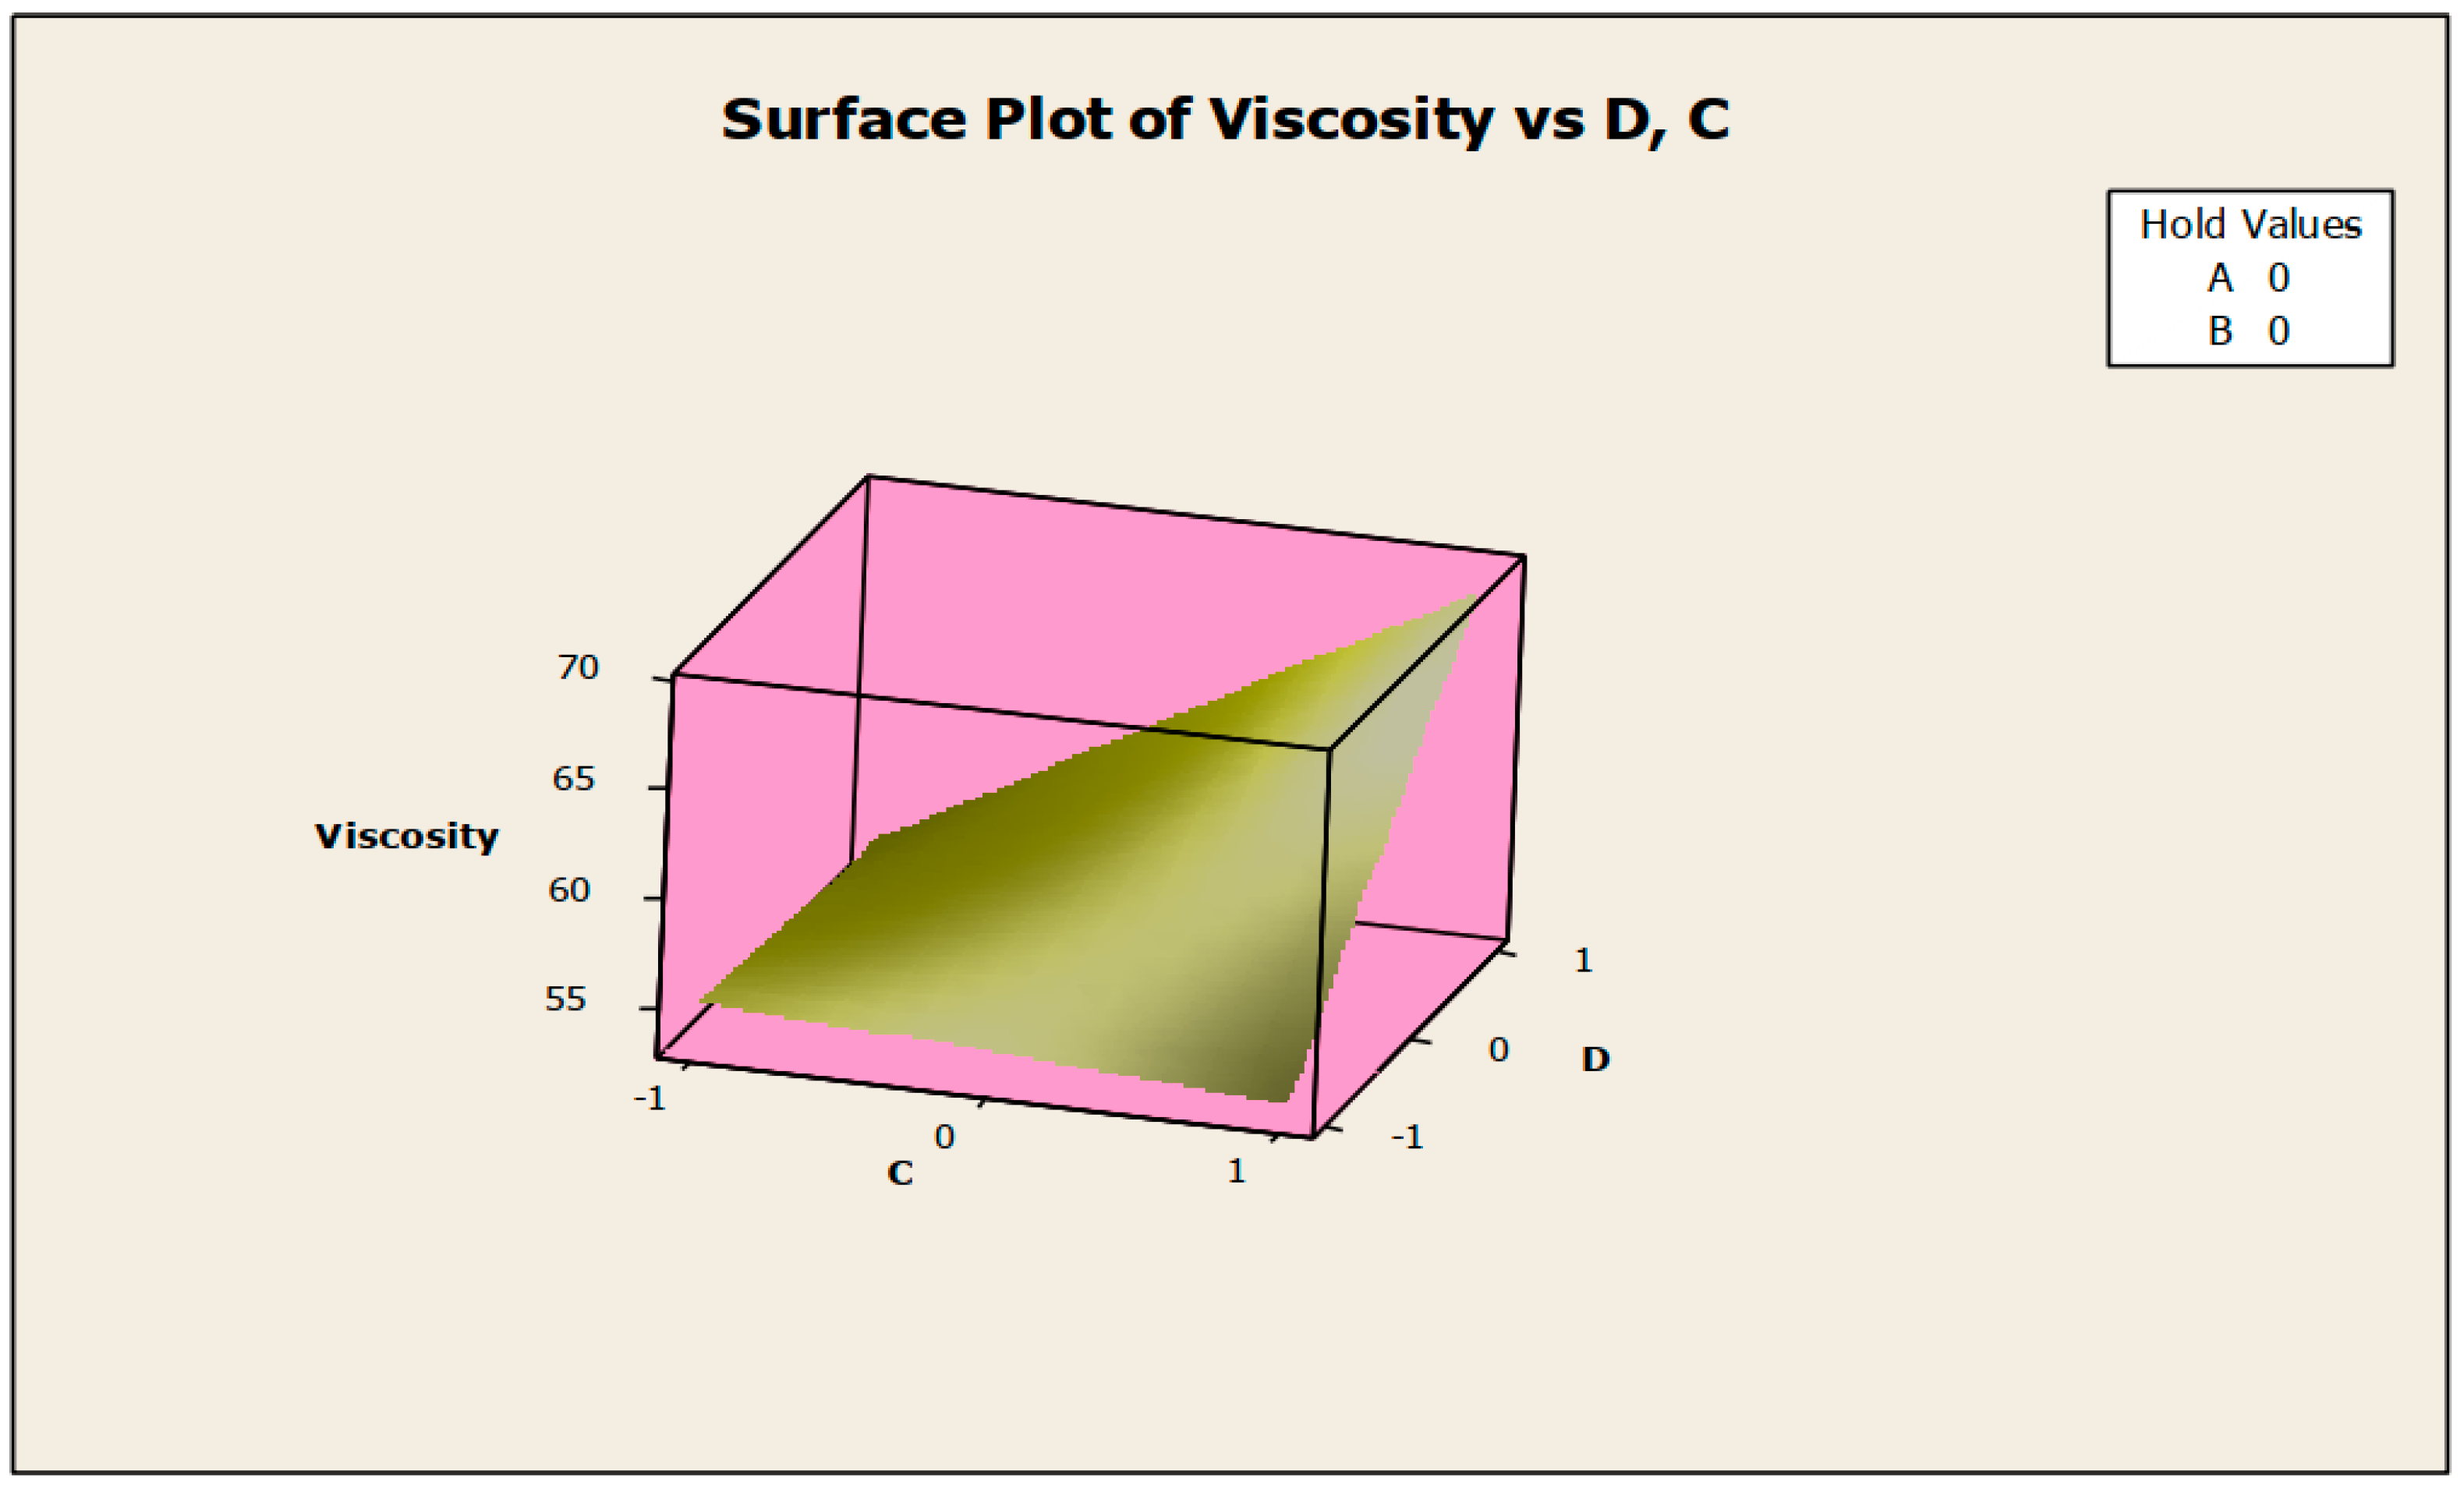
The contour and surface plots of how biocide and antifoam agents alter the viscosity of jatropha oil when used as a cutting fluid are shown in Figure 10 and Figure 11. The optimum viscosity was found to be in the range of 1.0 for the antifoam agent and 1.0 for the biocide (applying coded values); the viscosity of jatropha oil was estimated to be more than 67.5 in this range. This means that to achieve a viscosity peak of more than 67.5, the antifoam agent and biocide should both be kept at a minimum of 1%, and this is inconsonant with the research carried out in [20]. Because the proportion of these compounds is so rigorous, anything less than 1% of biocide and antifoam agents will prevent the viscosity from reaching its peak. At a location where the antifoam is slightly strict on −1 and the biocide is quite free on 0.5, the least viscosity available was found to be below 55 (using coded values). This means that when antifoam is exactly 0.5% and biocide is loosely about 0.875%, the viscosity can be reduced to its bare minimum.
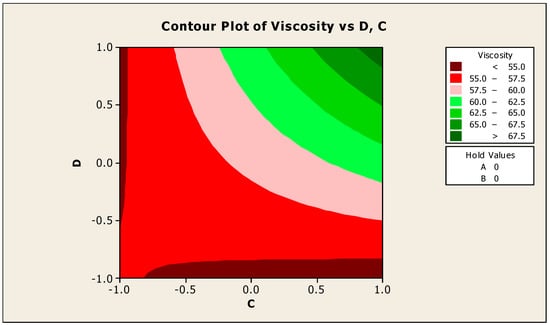
Figure 10.
Contour plot of acid value vs. biocide (C) and antifoam agent (D).
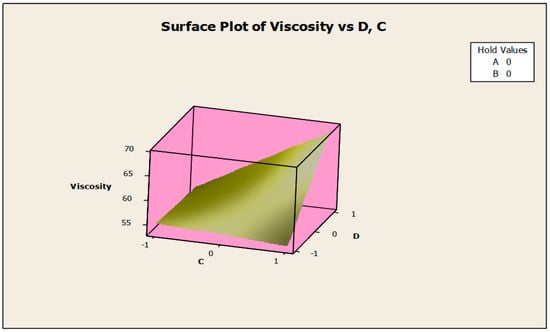
Figure 11.
Surface plot of viscosity vs. biocide (C) and antifoam agent (D).
The summary of the physicochemical properties of watermelon and jatropha oil-based cutting fluids are presented in Table 19 and Table 20 for acid values and viscosities, respectively.
Table 19.
Comparison of the physicochemical properties regarding acidity of fluids.
Table 20.
Comparison of the physicochemical properties regarding viscosity of fluids.
4. Conclusions
The analyses of the physicochemical properties of the watermelon seeds and jatropha oil-based cutting fluids prepared were carried out. The natural variables are an emulsifying agent, anti-corrosion agent, biocide, and antifoam agent. The R-squared showing the “adequacy of the model” for the two prepared cutting fluids was adequate from the responses obtained from the acidity experiment, as explained by the independent variables (emulsifying agent, anti-corrosion agent, biocide, and antifoam agent). The watermelon seed oil-based cutting fluid was 89% accurate, while the jatropha cutting fluid was 75% accurate. ANOVA revealed that the combination of all linear and interaction effects (which make up for the regression effect) was not significant at 5% watermelon seed oil-based and jatropha cutting fluids. In addition, none of the linear or interaction effects were found to be significant. The peaks of acidity and viscosity were also determined. The process parameters were carefully selected and optimized in this study, and can be adopted by future researchers either working on the optimization of the physicochemical properties of watermelon seed and/or jatropha oil-based cutting fluids.
Author Contributions
Conceptualization, R.A.K., D.A.F. and E.T.A.; methodology, R.A.K. and D.A.F.; software, S.A.A. (Sunday A. Afolalu); validation, O.M.I.; formal analysis, S.A.A. (Sunday A. Afolalu); investigation, R.A.K.; resources, S.A.A. (Sunday A. Afolalu); data curation, S.A.A. (Sunday A. Afolalu); writing—original draft preparation, R.A.K.; writing—review and editing, O.M.I., S.A.A. (Stephen A. Akinlabi); visualization, E.T.A.; supervision, D.A.F. and E.T.A.; project administration, O.M.I., S.A.A. (Stephen A. Akinlabi) and S.A.A. (Sunday A. Afolalu); funding acquisition, R.A.K., O.M.I. and E.T.A. All authors have read and agreed to the published version of the manuscript.
Funding
This research received no external funding.
Acknowledgments
The authors would like to express their gratitude to the anonymous reviewers for their insightful remarks, ideas, and constructive review for improving the quality of the paper.
Conflicts of Interest
The authors declare no conflict of interest.
References
- Wang, H.J.; Murphy, P.A. Isoflavone composition of American and Japanese soybeans in Iowa: Effects of variety, crop year, and location. J. Agric. Food Chem. 1994, 42, 1674–1677. [Google Scholar] [CrossRef]
- Demirbas, A. Relationships derived from physical properties of vegetable oil and biodiesel fuels. Fuel 2008, 87, 1743–1748. [Google Scholar] [CrossRef]
- Atabani, A.E.; Silitonga, A.S.; Ong, H.C.; Mahlia, T.M.I.; Masjuki, H.H.; Badruddin, I.A.; Fayaz, H. Non-edible vegetable oils: A critical evaluation of oil extraction, fatty acid compositions, biodiesel production, characteristics, engine performance and emissions production. Renew. Sustain. Energy Rev. 2013, 18, 211–245. [Google Scholar] [CrossRef]
- Bartolomei, M.; Bertocchi, P.; Antoniella, E.; Rodomonte, A. Physico-chemical characterisation and intrinsic dissolution studies of a new hydrate form of diclofenac sodium: Comparison with anhydrous form. J. Pharm. Biomed. Anal. 2006, 40, 1105–1113. [Google Scholar] [CrossRef] [PubMed]
- Kazeem, R.A.; Fadare, D.A.; Abutu, J.; Lawal, S.A.; Adesina, O.S. Performance evaluation of jatropha oil-based cutting fluid in turning AISI 1525 steel alloy. CIRP J. Manuf. Sci. Technol. 2020, 31, 418–430. [Google Scholar] [CrossRef]
- Mengyue, C.; Hui, H.; Xiaoshuang, S.; Xiuyang, J.; Binggui, C. The gradual change characteristics at the end of the Younger Dryas event inferred from a speleothem record from Xianyun Cave, Fujian Province. Quat. Sci. 2018, 38, 711–719. [Google Scholar]
- Knothe, G.; Dunn, R.O. Dependence of oil stability index of fatty compounds on their structure and concentration and presence of metals. J. Am. Oil Chem. Soc. 2003, 80, 1021–1026. [Google Scholar] [CrossRef]
- Ceriani, R.; Paiva, F.R.; Gonçalves, C.B.; Batista, E.A.C.; Meirelles, A.J.A. Densities and viscosities of vegetable oils of nutritional value. J. Chem. Eng. Data. 2008, 53, 1846–1853. [Google Scholar] [CrossRef]
- Mousavi, K.; Shoeibi, S.; Ameri, M. Effects of storage conditions and PET packaging on quality of edible oils in Iran. Adv. Environ. Biol. 2012, 6, 694–701. [Google Scholar]
- Farhoosh, R.; Moosai, S.M.R.; Sharif, A. Investigation on frying oils quality in terms of color index, refractive index and viscosity during frying process. J. Food Sci. Technol. 2008, 5, 13–19. [Google Scholar]
- Pan, J.F.; Shen, H.X.; You, J.; Luo, Y.K. Changes in physiochemical properties of Myofibrillar protein from Silver Carp (Hypophthalmichthys mollitrix) during heat treatment. J. Food Biochem. 2011, 35, 939–952. [Google Scholar] [CrossRef]
- Kazeem, R.A.; Fadare, D.A.; Ikumapayi, O.M.; Azeez, T.M.; Adediran, A.A. Development of Bio-Cutting Fluid (Cirtullus lanatus) and its Performance Assessment on the Machining of AISI 1525 Steel Using Taguchi Technique and Grey Relational Analysis. Biointerface Res. Appl. Chem. 2022, 12, 5324–5346. [Google Scholar]
- Sidney, W.; AOAC. Official Methods of Analysis, 14th ed.; Association of Official Analytical Chemists: Arlington, VA, USA, 1984. [Google Scholar]
- Oyinbo, S.T.; Ikumapayi, O.M.; Jen, T.C.; Ismail, S.O. Experimental and Numerical prediction of extrusion load at different lubricating conditions of aluminium 6063 alloy in backward cup extrusion. Eng. Solid Mech. 2020, 8, 119–130. [Google Scholar] [CrossRef]
- Margheritini, L.; Colaleo, G.; Contestabile, P.; Bjørgård, T.L.; Simonsen, M.E.; Lanfredi, C.; Dell’Anno, A.; Vicinanza, D. Development of an Eco-Sustainable Solution for the Second Life of Decommissioned Oil and Gas Platforms: The Mineral Accretion Technology. Sustainability 2020, 12, 3742. [Google Scholar] [CrossRef]
- Singh, H.; Sharma, V.S.; Dogra, M. Exploration of graphene assisted vegetables oil based minimum quantity lubrication for surface grinding of TI-6AL-4V-ELI. Tribol. Int. 2020, 144, 106113. [Google Scholar] [CrossRef]
- Kumar, M.S.; Krishna, V.M.; Varun, A. Investigation on influence of Hybrid Biodegradable Nanofluids (CuO-ZnO) on Surface Roughness in Turning AISI 1018 Steel. Mater. Today Proc. 2020, 24, 1570–1576. [Google Scholar] [CrossRef]
- Pal, A.; Chatha, S.S.; Sidhu, H.S. Experimental investigation on the performance of MQL drilling of AISI 321 stainless steel using nano-graphene enhanced vegetable-oil-based cutting fluid. Tribol. Int. 2020, 151, 106508. [Google Scholar] [CrossRef]
- Singh, Y.; Sharma, A.; Singh, N.K.; Singla, A.; Kumar, R. Moringa Oleifera: Bio based lubricant development from a novel feedstock for tribological characterization. Adv. Mater. Process. Technol. 2020, 1–13. [Google Scholar] [CrossRef]
- Majak, D.; Olugu, E.U.; Lawal, S.A. Analysis of the effect of sustainable lubricants in the turning of AISI 304 stainless steel. Procedia Manuf. 2020, 43, 495–502. [Google Scholar] [CrossRef]


Publisher’s Note: MDPI stays neutral with regard to jurisdictional claims in published maps and institutional affiliations. |
© 2022 by the authors. Licensee MDPI, Basel, Switzerland. This article is an open access article distributed under the terms and conditions of the Creative Commons Attribution (CC BY) license (https://creativecommons.org/licenses/by/4.0/).