Article

Effects of an Electrical Double Layer and Tribo-Induced Electric Field on the Penetration and Lubrication of Water-Based Lubricants

1
College of Mechanical Engineering, Zhejiang University of Technology, Hangzhou 310023, China
2
Key Laboratory of Special Purpose Equipment and Advanced Processing Technology, Ministry of Education and Zhejiang Province, Zhejiang University of Technology, Hangzhou 310023, China
3
School of Mechanical Engineering, Yanshan University, Qinhuangdao 066004, China
4
School of Mechanical and Mining Engineering, The University of Queensland, Brisbane, QLD 4072, Australia
*
Authors to whom correspondence should be addressed.
Lubricants 2022, 10(6), 111; https://doi.org/10.3390/lubricants10060111
Submission received: 29 April 2022 / Revised: 15 May 2022 / Accepted: 30 May 2022 / Published: 2 June 2022
(This article belongs to the Special Issue Advances in Water-Based Nanolubricants)

Abstract

:
Understanding the effects of electrical double layers (EDL) and tribo-induced electric fields on the electroosmotic behaviors of lubricants is important for developing high-performance water-based lubricants. In this study, EDL conductivities of aqueous lubricants containing a surfactant of 3-[(3-cholamidopropyl)-dimethylammonio]-1-propanesulfonate (CHAPS) or cetyltrimethylammonium bromide (CTAB) were analyzed. The interfacial zeta potentials of the synthesized lubricants and Al2O3 ceramic-alloy steel contacts were measured, and frictional potentials of ceramic and steel surfaces were determined using a modified ball-on-disc configuration. The distribution characteristics of the tribo-induced electric field of the ceramic-steel sliding contact were numerically analyzed. The electroosmotic behaviors of the lubricants were investigated using a four-ball configuration. It was found that an EDL and tribo-induced electric field was a crucial enabler in stimulating the electroosmosis of lubricants. Through altering EDL structures, CHAPS enhanced the electroosmosis and penetration of the water-based lubricant, thus resulting in improved lubrication.

1. Introduction

Water-based lubricants have attracted increasing academic and industrial interest in recent years due to their low-cost and environment-friendly nature [1,2]. They have been successfully applied to hot steel rolling and bearing lubrication [3,4,5]. It has been found that the penetration of water-based lubricants plays a critical role in their lubricating performance [6,7]. Capillary networks at the friction interface are the paths of penetration of lubricants, by which the lubricants can generate lubricating films on the sliding surface to reduce friction and wear [8,9]. Liquid head pressure under the action of the gravity field and capillary pressure caused by surface tension are the main driving forces of conventional capillary penetration [10]. The gradient of liquid surface tension caused by the temperature field makes the lubricant prefer to move away from the areas with the highest temperature [9,11]. Recent studies have proposed a lubricant electrokinetic effect under the electric field within the friction interface (i.e., electroosmosis) [12,13]. The penetrability of lubricants with different electroosmotic characteristics at the friction interface is significantly different [12]. However, in-depth investigations into essential prerequisites for the electroosmosis of lubricants, i.e., the effects of an electrical double layer (EDL) at the solid/liquid interface and a tribo-induced electric field on electroosmosis [14], are currently lacking, which has thus hindered the development of high-performance water-based lubricants.
An EDL is a phenomenon of uneven ion distribution of a liquid phase boundary and bulk caused by interface effects, such as charge transfer and charged particle adsorption [15]. The charged solid surface can attract the equivalent amount of counterions in the liquid bulk to aggregate at the interface, forming a stationary stern layer and a diffuse layer that allows ions to move, as shown in Figure 1. The degree of the uneven distribution of ions is related to the ion concentration in the liquid phase. The lower the ion concentration, the more obvious the uneven distribution, which can be reflected in the difference between the EDL conductivity and the bulk conductivity of the liquid. The adsorption of ionic surfactants on the charged surface can change the structure of the EDL. The electroosmotic velocity and direction can be significantly affected by adding only 10−1 mmol/L surfactant to the base fluid [16,17,18]. Generally, the zeta potential at the shear plane between the two layers reflects the distribution of ions in the EDL [19]. The tangential streaming potential method is a simple and widely used method for measuring the zeta potential [20]. It is worth noting that the contributions to the formation of streaming potential come entirely from the movement of free ions in the diffusion layer [21]. For the interface between an insulating material and the liquid with an extremely low ion concentration, it is important to clarify the EDL conductivity to calculate the zeta potential using the streaming potential. If the liquid bulk conductivity is used for the calculation, the zeta potential will be underestimated. The method of the galvanostatic four-electrodes system combined with electrochemical impedance spectroscopy is usually used to measure the pore conductivity of membranes to obtain information about the membrane structure [22]. The approximate conductivity of the EDL can be calculated when a membrane with a pore diameter closed to the EDL thickness is selected. For the interface between a conductor (e.g., metals) and liquid, a large number of ions will flow through the conductor bulk, and the zeta potential is also easily underestimated. This problem can be effectively solved by measuring the total conductance of the streaming potential measurement cell as a substitute for liquid conductivity [23].
Researchers have shown that triboelectrification can lead to the formation of a high-strength tribo-induced electric field in narrow slits of friction interfaces, which is sufficient to discharge the air in the slits even under boundary lubrication conditions, resulting in an electron avalanche and tribo-plasma phenomena [24,25]. The electrical conductivity of material has a great influence on this electric field. A conductor contains a large number of mobile electrons, and the static surface electricity is easy to dissipate, resulting in a low electric field intensity [26]. Once static electricity is charged on an insulator surface, it is difficult to dissipate, causing a high electric field intensity [27]. The tribo-induced electric field may have a significant effect on the properties of water-based lubricants, such as penetrability and stability [28,29,30]. The electric field distribution at the friction interface can be calculated by Laplace’s equation on the basis of determining the triboelectrification situation of the material [31]. If the electric field intensity within the lubricant penetrated into a capillary is 100–1000 kV/m, the lubricant will penetrate the friction interface by electroosmosis [15,32].
This paper systematically investigates the effects of the EDL and tribo-induced electric field at the interface of alumina ceramic sliding against AISI 52100 steel on the penetration and lubrication of water-based lubricants. The galvanostatic four-electrodes system was established, and the EDL conductivities of dilute lubricants with the highest surfactant CHAPS (or CTAB) concentration of 0.2 mmol/L were measured using the electrochemical impedance spectroscopy. A tangential streaming potential measurement platform was built, and the zeta potentials at friction material/lubricant interfaces were calculated according to the formation principle of the streaming potential. The distribution of the tribo-induced electric field in a capillary at the friction interface was studied by numerical simulation. Finally, the tribological behaviors of lubricants at the ceramic-steel interface were investigated using the four-ball tribometer. The penetrability of lubricants was evaluated by elemental analysis of worn surfaces. The electroosmotic mechanism of lubricants with different electroosmotic characteristics at the ceramic-steel interface was revealed.

2. Experimental Details

2.1. Preparation of Water-Based Lubricants

Potassium chloride (KCl, AR Grade, Sinopharm Chemical Reagent Co., Ltd., Shanghai, China) was added into deionized water to prepare KCl solutions with concentrations of 0.00001–1 mol/L for investigating the influence of ion concentration on the difference of the solution bulk conductivity and EDL conductivity. To avoid the interference of conventional additives, such as rust inhibitors and extreme pressure agents, the lubricants used in this study were only composed of pure water and a surfactant, 3-[(3-cholamidopropyl)-dimethylammonio]-1-propanesulfonate (CHAPS, Biotech Grade, 98%, Shanghai Macklin Biochemical Co., Ltd., Shanghai, China) or cetyltrimethylammonium bromide (CTAB, Biotech Grade, 99%, Shanghai Macklin Biochemical Co., Ltd., Shanghai, China). The concentrations of CHAPS (or CTAB) were 0.0125, 0.05, 0.1 and 0.2 mmol/L. A drop weight method was used to measure the surface tension of the synthesized lubricants. Their wetting angle on the alumina ceramic and AISI 52100 steel surfaces was measured using a goniometry method [33,34]. The effects of CHAPS and CTAB on the capillary penetration of the lubricants were then analyzed.

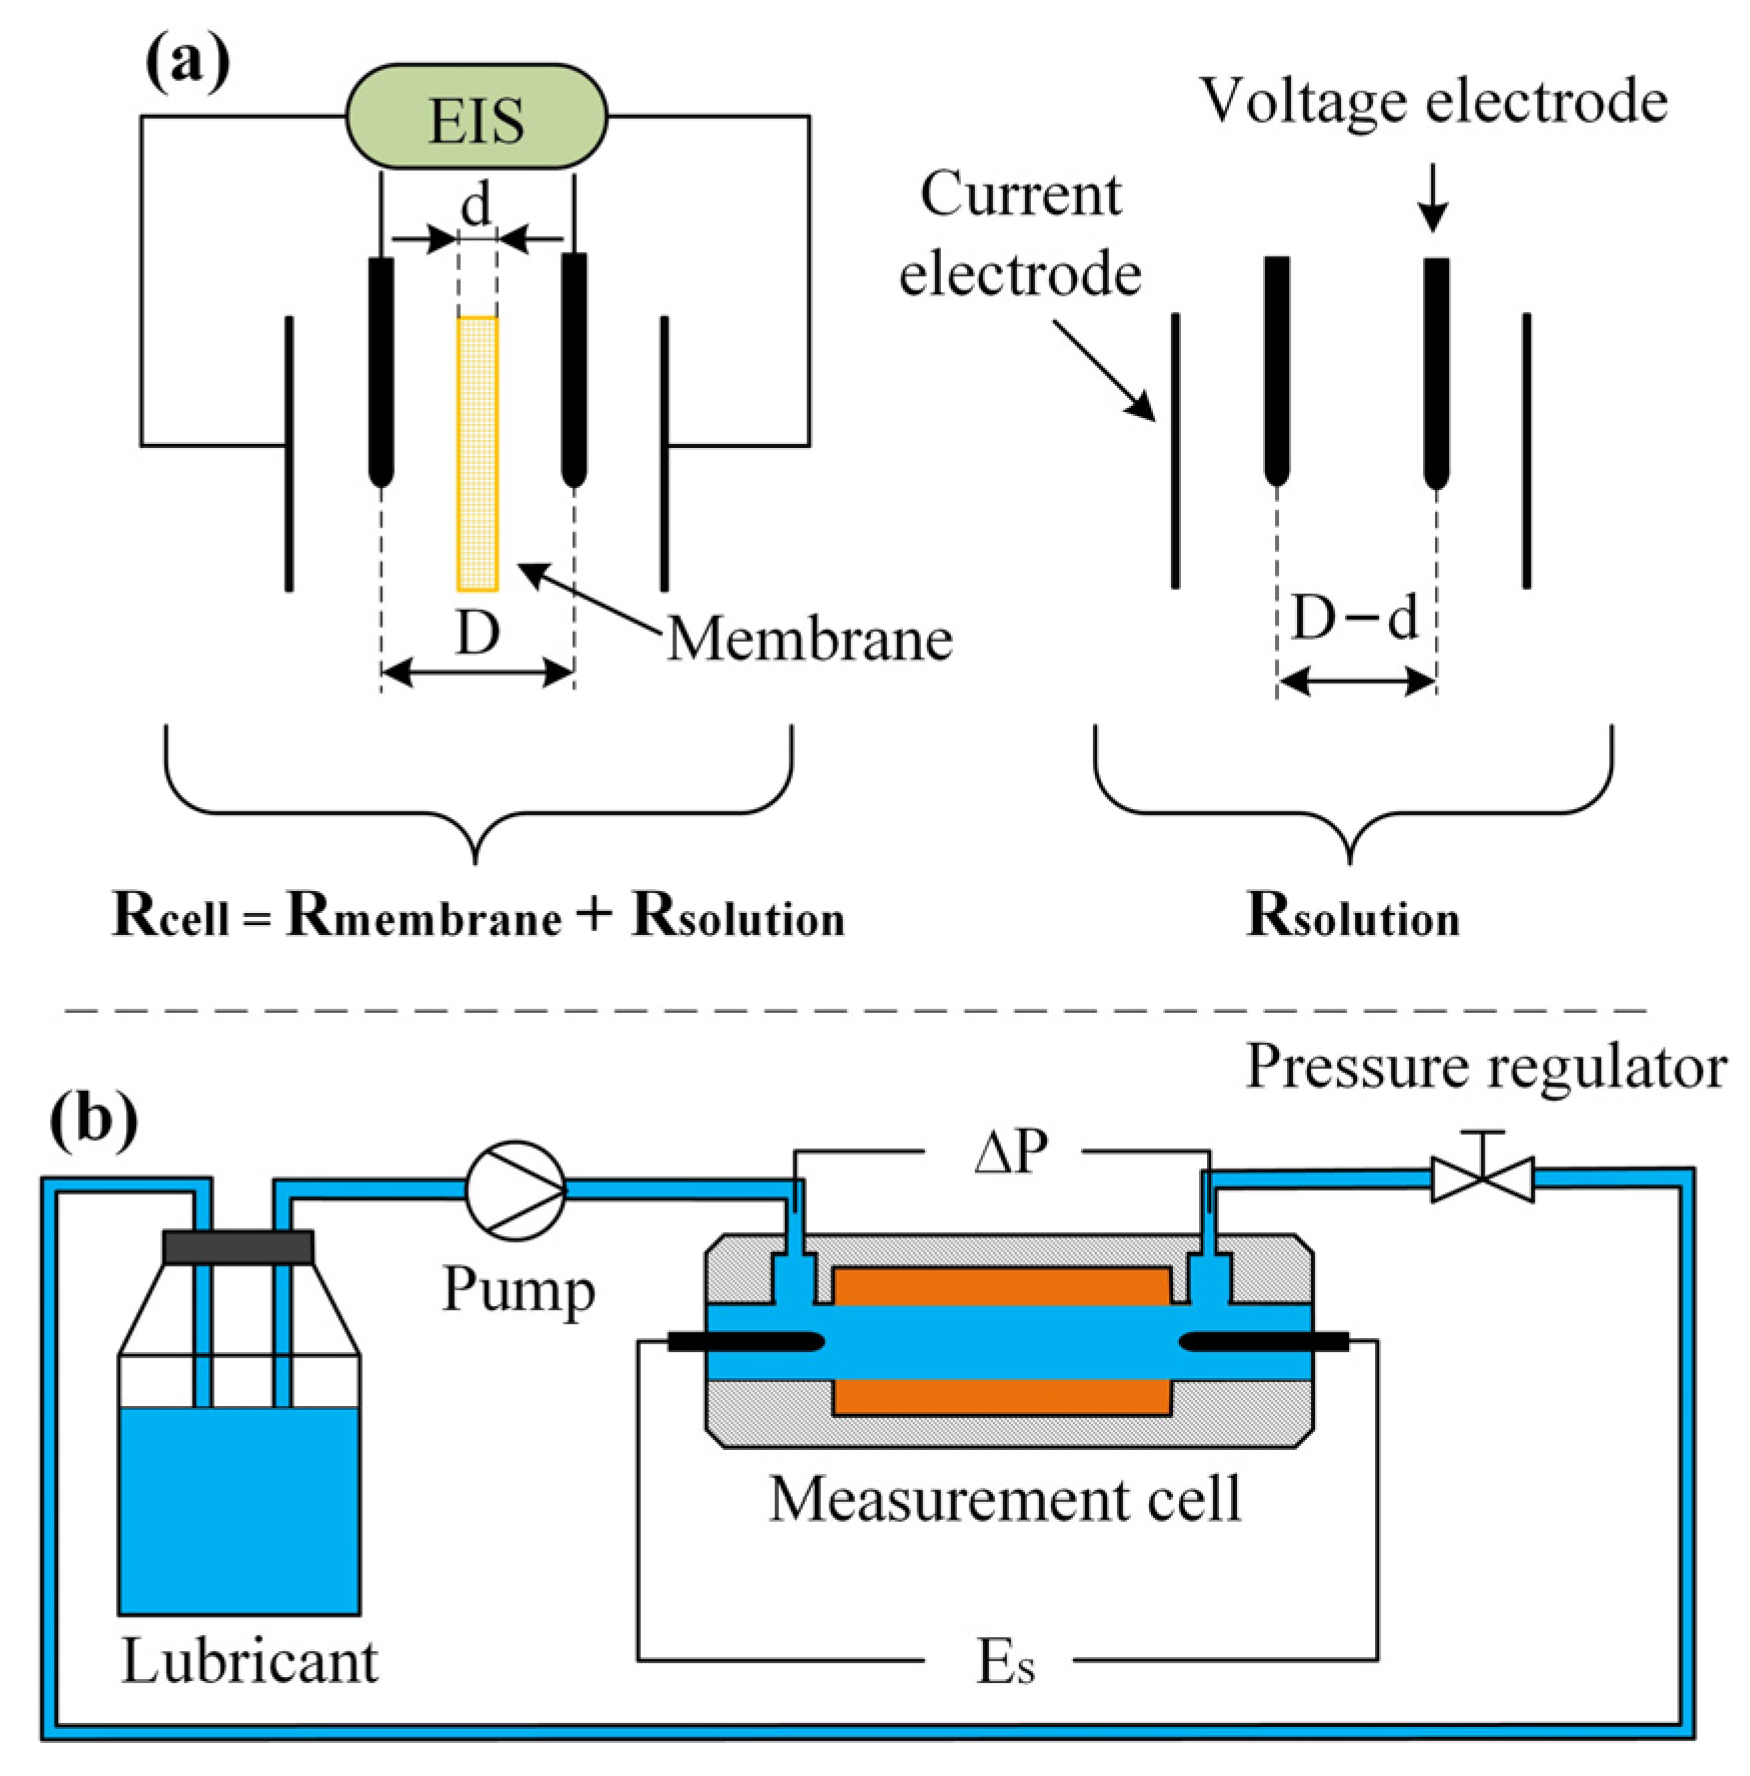
2.2. Measurement of EDL Conductivity and Zeta Potential

The EDL is a phenomenon in which the net charge concentration near the solid/liquid interface is much higher than the liquid phase bulk, as shown in Figure 1. If the solid phase is an annular structure (such as pores in a membrane) and the intracavity diameter is about twice larger than the EDL thickness, it can be considered that the intracavity ions are distributed in the EDL structure; that is, the intracavity liquid conductivity is approximate to the EDL conductivity. The EDL thicknesses of different liquids were firstly calculated with the Poisson–Boltzmann equation. In this paper, the liquid EDL thicknesses are within 50 nm. To avoid the overlap of the EDLs in a membrane pore, the alumina ceramic flat membrane with a pore diameter of about 100 nm was selected for the measurement. The measuring liquid was then pumped through the ceramic membrane for 30 min. Next, the membrane was soaked in this liquid for 24 h to ensure that all pores were filled with the liquid. The membrane resistance was measured using electrochemical impedance spectroscopy on the galvanostatic four-electrodes system to calculate the liquid conductivity within a pore, i.e., the approximate conductivity of the EDL (the deduction details are presented in Appendix A), as shown in Figure 2a. The resistance measurement was carried out in the cell with a membrane immersed in the measuring liquid and the cell with a lone liquid, respectively, to obtain the total resistance of the liquid and membrane (Rm + Rsol) and the resistance of the liquid (Rsol). The membrane resistance Rm can be obtained by subtracting the two values. The dimension “D” in Figure 2a was the distance between the two voltage electrodes when the membrane was immersed in the cell, and “d” was the membrane thickness. In addition, the liquid bulk conductivities were measured using a model DDS-307A conductivity meter.
Figure 2b presents the schematic illustration of the tangential streaming potential measurement platform. During the test, the measuring lubricant was circularly forced through the measurement cell under the drive of a pump. The slit channel within the cell consisted of two alumina ceramic (or AISI 52100 steel) slices, and its dimensions were 160 × 10 × 0.3 mm. The hydrodynamic pressure difference ∆P between the two sides of the channel was regulated by a pressure regulator, which increased from 0.02 to 0.1 Mpa. An Agilent 34420A voltmeter was used to measure the potential difference between the upstream and downstream under different ∆P, i.e., streaming potential Es. The zeta potential at the material/lubricant interface was calculated with the values of Es/∆P of the lubricant on the ceramic and steel surfaces obtained from linear regression (details are shown in Appendix B).

2.3. Analysis of Tribo-Induced Electric Field

A W1 three-dimensional optical profilometer (CHOTEST Instrument Co., Ltd., Shenzhen, China) was used to analyze the worn surface morphologies of the ceramic and steel balls lubricated by water. The geometric parameters of the surface profile were used as the basis for establishing the capillary model at the friction interface. A ball-on-disc material friction device was developed to explore the tribo-electrification between ceramic and steel, as shown in Figure 3. The diameters of the ball and disc were 6 and 75 mm, respectively. The friction load was 1 N, and the sliding velocity was 157 mm/s. Once the disc slipped out of the friction zone, its potential was detected by an EST102 electrometer placed 10 mm above the disc surface. The triboelectrification characteristics of the ceramic (or the steel) were obtained by switching the paired combinations of ball/disc materials. According to the capillary model and the ceramic/steel triboelectrification results, the distribution of tribo-induced electric field within the friction interface was simulated and analyzed with the finite element software ANSYS.

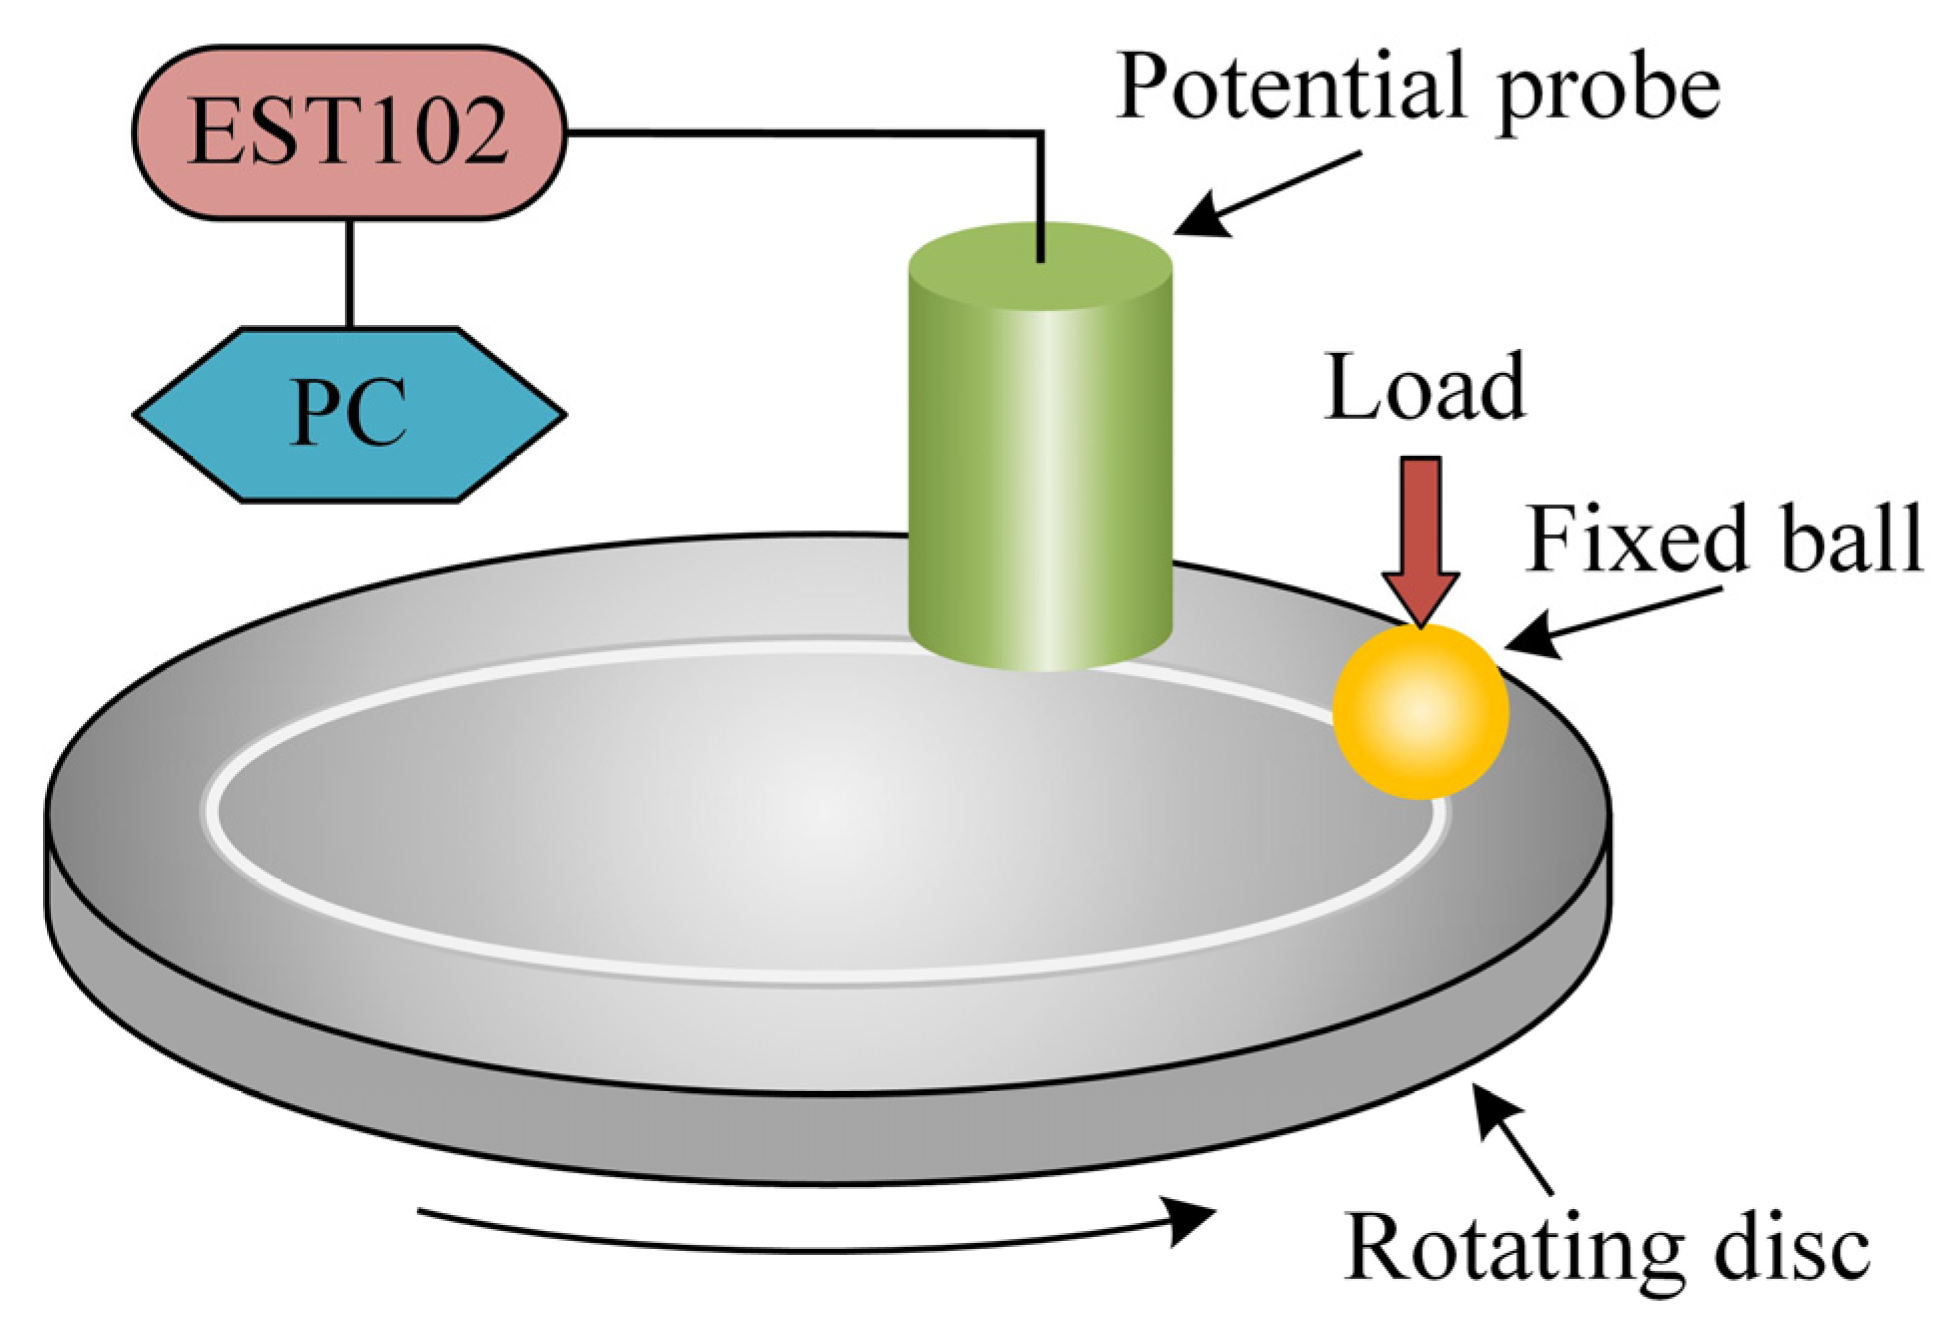
2.4. Tribological Tests

The four-ball module of the MMW-1 tribometer was used to investigate the tribological behaviors and penetrability of the lubricants at the ceramic/steel friction interfaces. The pairing mode of one alumina ceramic ball and three AISI 52100 steel balls was adopted. Before the test, the ball pot, lock ring, ceramic and steel balls were cleaned with acetone. Considering the relatively weak load-carrying capacity of water-based lubricants, the test was conducted under a load of 49 N and a rotation speed of 1000 r/min to avoid the seizure of friction pairs [35]. The test was repeated three times for each lubricant, and the duration was 30 min. The wear scar diameters (WSD) were measured using a VW-6000 microscope system (Keyence Co., Ltd., Osaka, Japan). A Sigma HV-01-43 scanning electron microscope (SEM) (Zeiss Co., Ltd., Oberkochen, Germany) equipped with an angle-selective backscattered electron detector (AsB) and an energy-dispersive spectrometer (EDS) was adopted to analyze the element components on the worn surfaces.

3. Results and Discussion

3.1. Electroosmotic Prerequisites

Table 1 presents the bulk conductivities of KCl solutions with different concentrations and the corresponding membrane resistances. The solution EDL conductivities were calculated using Equation (A4), and their proportional relationships (k) with bulk conductivities were obtained and are shown in Figure 4a. The difference between the EDL conductivity and bulk conductivity gradually increases with the decrease in the KCl concentration. The EDL conductivity of water is about 21 times higher than its bulk conductivity. This is attributed to the ion aggregation at the solid/liquid interface induced by the electrostatic force and van der Waals force between ions and solid surface, which forms a completely different ion distribution from solution bulk, i.e., EDL. Moreover, the lower the ion concentration (lower bulk conductivity), the more obvious this phenomenon is, resulting in the EDL conductivity being much higher than the bulk conductivity. As noted in Appendix B, the contribution of generating streaming potential mainly comes from the ion movement within the diffuse layer of the EDL. Therefore, it is of great significance to clarify the EDL conductivities of extremely dilute solutions to characterize zeta potentials at solid/liquid interfaces.
The bulk conductivities of the diluted lubricants prepared in this paper and the corresponding membrane resistances are listed in Table 2. Figure 4b shows the relationships of CHAPS and CTAB concentrations with the EDL conductivity and k. The EDL conductivities of both types of lubricants are higher than their bulk conductivities, and the k of CHAPS lubricants is larger than that of CTAB lubricants. This might be related to the different effect mechanisms of those two surfactants on the EDL, resulting in differences in the ion concentration within the EDL. The EDL conductivities of these two diluted lubricants were therefore used for the subsequent calculation of the zeta potentials at the ceramic/lubricant interfaces.
Figure 5a,b depict the streaming potentials of water and lubricants on the ceramic and steel surfaces under different hydrodynamic pressures. It is seen that the streaming potentials of pure water and CHAPS lubricants on both surfaces are negative, and the amplitudes increase linearly with the increase in the pressure, indicating that the ceramic and steel surfaces are negatively charged in those liquids. However, CTAB lubricants show positive potential, suggesting that CTAB can change the charge characteristics of the two materials in liquids, and the surfaces are positively charged. In addition, due to the excellent electrical conductivity of the steel, some of the ions accumulated downstream flow back through the material bulk, exhibiting lower streaming potential amplitudes than ceramics. These two material surfaces can be charged by the effects of charge transfer and ion adsorption at the solid/liquid interface. The surface charges can attract the counter ions of the lubricant bulk to form an EDL, one of the electroosmotic prerequisites.
The relationships between the streaming potentials and the hydrodynamic pressures, EsP, were obtained by linear regression, and the zeta potentials at the ceramic/lubricant and steel/lubricant interfaces were calculated using Equations (A12) and (A15), respectively, as shown in Figure 5c,d. With the increase in CHAPS (or CTAB) concentration, the zeta potentials of the two materials show the same change trend: CHAPS does not change the polarity of the zeta potential, while CTAB can change that with the concentration of only 0.0125 mmol/L. Increasing the concentrations of both surfactants can increase the zeta potential amplitude. It is well known from the Helmholtz–Smoluchowski equation that the polarity and amplitude of the zeta potential affect the direction and velocity of electroosmosis, respectively, as shown below,
v e o = ε r ε 0 ζ η E ,
where veo is the velocity of electroosmosis, εr is the liquid permittivity, ε0 is the permittivity of free space, ζ is the Zeta potential, and E is the applied electric field intensity [15]. This indicates that the CHAPS (or CTAB) concentration possesses an important effect on the electroosmotic properties of lubricants. Furthermore, it can be found from Figure 5c,d that the zeta potentials of ceramics are higher than those of steels, indicating that the charging ability of ceramics in lubricants is stronger than that of steels.
Figure 6a,b present the profile curves of the ceramic and steel worn surfaces. It is shown that there are peaks and valleys on the ceramic surface, and the maximal vertical spacings between peaks and valleys are about 0.5 μm. Compared with the ceramic surface, the steel surface profile is smoother, with the largest vertical spacings of about 0.08 μm. The surface roughness of the worn ceramic and steel balls is summarized in Table 3. Referring to the above profile features and roughness information of the ceramic and steel worn surfaces, the geometric model of the lubricant penetrating a capillary at the friction interface was established for simulation analysis of the tribo-induced electric field shown in Figure 6d. Since the capillary is thought to be formed by the peaks of the harder ceramic surface ploughing the softer steel surface, the Rz (maximum height of profile) of the worn ceramic surface is used to define the capillary thickness. The 2Ra (arithmetical mean deviation of the profile) and Rsm (average width of profile unit) of the ceramic and steel surface are used to define the heights and widths of the bulges of the two materials’ walls within the capillary. The specific parameters are shown in Figure 6d.
Figure 6c presents the triboelectrification electrostatic potentials of the worn surfaces of the ceramic sliding against the steel. The potential of the ceramic surface reduces continuously with the increase in friction time and reaches a steady status after 60 s. The averaged potential after stabilization is −3.53 V. This is because the alumina ceramic is ranked after most metals in the triboelectric series, which is negatively charged when rubbed with a metal [36]. Due to the excellent electrical conductivity of the steel, the surface charges are easy to dissipate into the bulk [26], showing a weak positive potential. The average potential within 5 min was 0.04 V.
Laplace’s equation was used to describe the electric field distribution within the capillary to explore the effect of the electric field generated by the material triboelectrification on the lubricant penetration behavior at the ceramic/steel interface. According to the results of triboelectrification between the ceramic and steel, high potentials were loaded on the capillary wall bulges that were not submerged by the lubricant, which was −3.53 and 0.04 V, respectively. The lubricant was loaded with zero potential because it was placed in the grounding ball pot. The simulation results are displayed in Figure 7. Figure 7a depicts the potential distribution within the capillary. The potential in the lubricant gradually increases from the capillary inside to the outside, indicating that the electric field direction within the lubricant points to the inner end of the capillary. Figure 7b shows the electric field intensity values at the capillary center. It is seen that due to the periodic distribution of the micro-bulges on the capillary walls, the electric field intensity within the capillary inner end fluctuates around 8 × 10⁴ V/cm, which is sufficient to induce gas discharge. This is close to the results observed in Nakayama’s experiments [37], indicating the rationality of the finite element model used in this paper. Due to the higher dielectric constant of the lubricant compared to the air, a sudden drop in electric field intensity occurs at the interface of gas and liquid when it decreases from the inside to the outside. In addition, the electric field intensities within the lubricant are about 300–600 V/cm, meeting the strength condition for inducing the lubricant electroosmosis [15,38].

3.2. Tribological Behaviors

The effects of surfactant concentration on the tribological performance of the lubricants are shown in Figure 8. The coefficient of friction (COF) and WSD gradually decreased with the increase in CHAPS concentration but increased when CTAB was used. The COF and WSD of 0.2 mmol/L CHAPS lubricant were 12.5% and 6.8% lower than water, whereas 0.2 mmol/L CTAB lubricant produced 15.5% and 6.2% increases, respectively. The difference in tribological performance might be related to the penetrability of the lubricants and the lubricity of the surfactants.
Figure 9 shows the SEM-AsB images of the worn surface and the corresponding EDS results. Sparse dark areas are observed on the steel worn surface produced using pure water. The corresponding EDS mapping detected high O content in those areas, suggesting that a lubricating film of oxides was likely formed due to the tribochemical reaction between the steel and water [39]. Figure 9b,c show that as the CHAPS concentration increased, more surface areas were oxidized, and O content increased to 6.32 wt.%. This indicates that the lubricant penetrability was improved by increasing the CHAPS concentration. As shown in Figure 9d,e, the worn surfaces lubricated by the 0.2 mmol/L CTAB lubricant present no significant oxide films, and the O content is only 0.55 wt.%. This suggests that the penetrability of the lubricant decreases with increasing CTAB concentration. In addition, a small quantity of S and Br exist on the worn surface, with the contents of 0–0.11 wt.% and 0–0.19 wt.%, respectively. According to the molecular structures of CHAPS and CTAB, element S is derived from the sulfonic group in CHAPS, and element Br is from the bromine ion in CTAB. The result suggests that only a small quantity of CHAPS and CTAB participated in the lubrication during the friction. The lubricity of surfactants possesses a little effect on the anti-friction and anti-wear properties of the lubricants. The difference in the tribological performance between the two lubricants is thus mainly caused by the penetrability at the friction interface.

3.3. Mechanism Discussion

Figure 10a,b exhibit the contact angles of lubricants on ceramic and steel surfaces. The increase in surfactant concentrations leads to a reduction in contact angle for both CHAPS and CTAB lubricants. The contact angles of the 0.2 mmol/L CHAPS on the ceramic and steel surfaces were 5.6% and 4.1% lower compared with water, respectively. However, the contact angles produced using the 0.2 mmol/L CTAB were 9.3% and 7.8% lower than those of water. Figure 10c shows the effects of the surfactants on the lubricant surface tension. The surface tension of the lubricant decreases continuously with increasing CHAPS or CTAB concentration. When the surfactant concentrations increase to 0.2 mmol/L, the surface tension decreases by 9.5% and 13.1%, respectively. This is because the positive adsorptions of CHAPS and CTAB on the liquid surface can reduce the liquid surface tension [40]. It is known from the capillary force equation that the conventional capillary penetration is mainly affected by the liquid surface tension and contact angle, as shown below:
F c a p = 2 π r γ cos θ ,
where Fcap is the capillary force, r is the capillary radius, γ is the surface tension, and θ is the contact angle [41]. Assuming that the contributions of the ceramic and steel surfaces to the capillary force are equal and the capillary diameter is 3 μm, the capillary forces of lubricants at the ceramic/steel friction interfaces were calculated, as shown in Figure 10d. It is shown that with the increase in the CHAPS concentration, the capillary force first increases and then decreases, and the variation range is within 4.0%. As the CTAB concentration increases, the capillary force shows an increasing trend, with an increase of 4.5%. The above results are inconsistent with the lubricant penetrations at friction interfaces, indicating that CHAPS and CTAB present little effect on the lubricant conventional capillary penetration and the differences in the penetration behaviors of lubricants are mainly related to their electroosmotic characteristics.
The investigation into the EDL and tribo-induced electric field characteristics shows that the ceramic/steel friction interface has the prerequisites for inducing lubricant electroosmosis. The ceramic and steel surfaces are negatively charged in pure water through the interface effects of the charge transfer and ion adsorption at the solid/liquid interface, attracting the equivalent amount of the counterions in liquid bulk to form the EDL. Free ions in the diffuse layer of the EDL drive liquid molecules to form an electroosmotic flow (EOF) that flows into the capillary under the tribo-induced electric field, as shown in Figure 11a.
Surfactants impact the EOF rate and orientation by dynamically coating the solid surface [42]. As a zwitterionic surfactant, CHAPS can be absorbed on the negatively charged surface through electrostatic interaction between its positive amino group and the surface. Moreover, its negative sulfonic group attracts the cations in liquid bulk, causing an increase in the number of the free ions in the diffuse layer, thereby increasing the electroosmotic velocity [18,43], as shown in Figure 11b. Therefore, adding the appropriate amount of CHAPS can improve the lubricant penetrability at the friction interface, showing a better tribological performance. As a cationic surfactant, CTAB’s positive group is absorbed on the charged surface. With increasing concentration, the surface was first gradually neutralized by forming a CTAB monolayer and then positively charged by forming a CTAB bilayer, as shown in Figure 11c. As a result, the electroosmotic velocity first decreases to zero and then increases in reverse [16,42]. Thus, adding the appropriate amount of CTAB can suppress the penetrability of the lubricant, presenting worse tribological properties.

4. Conclusions

The major conclusions are as follows:
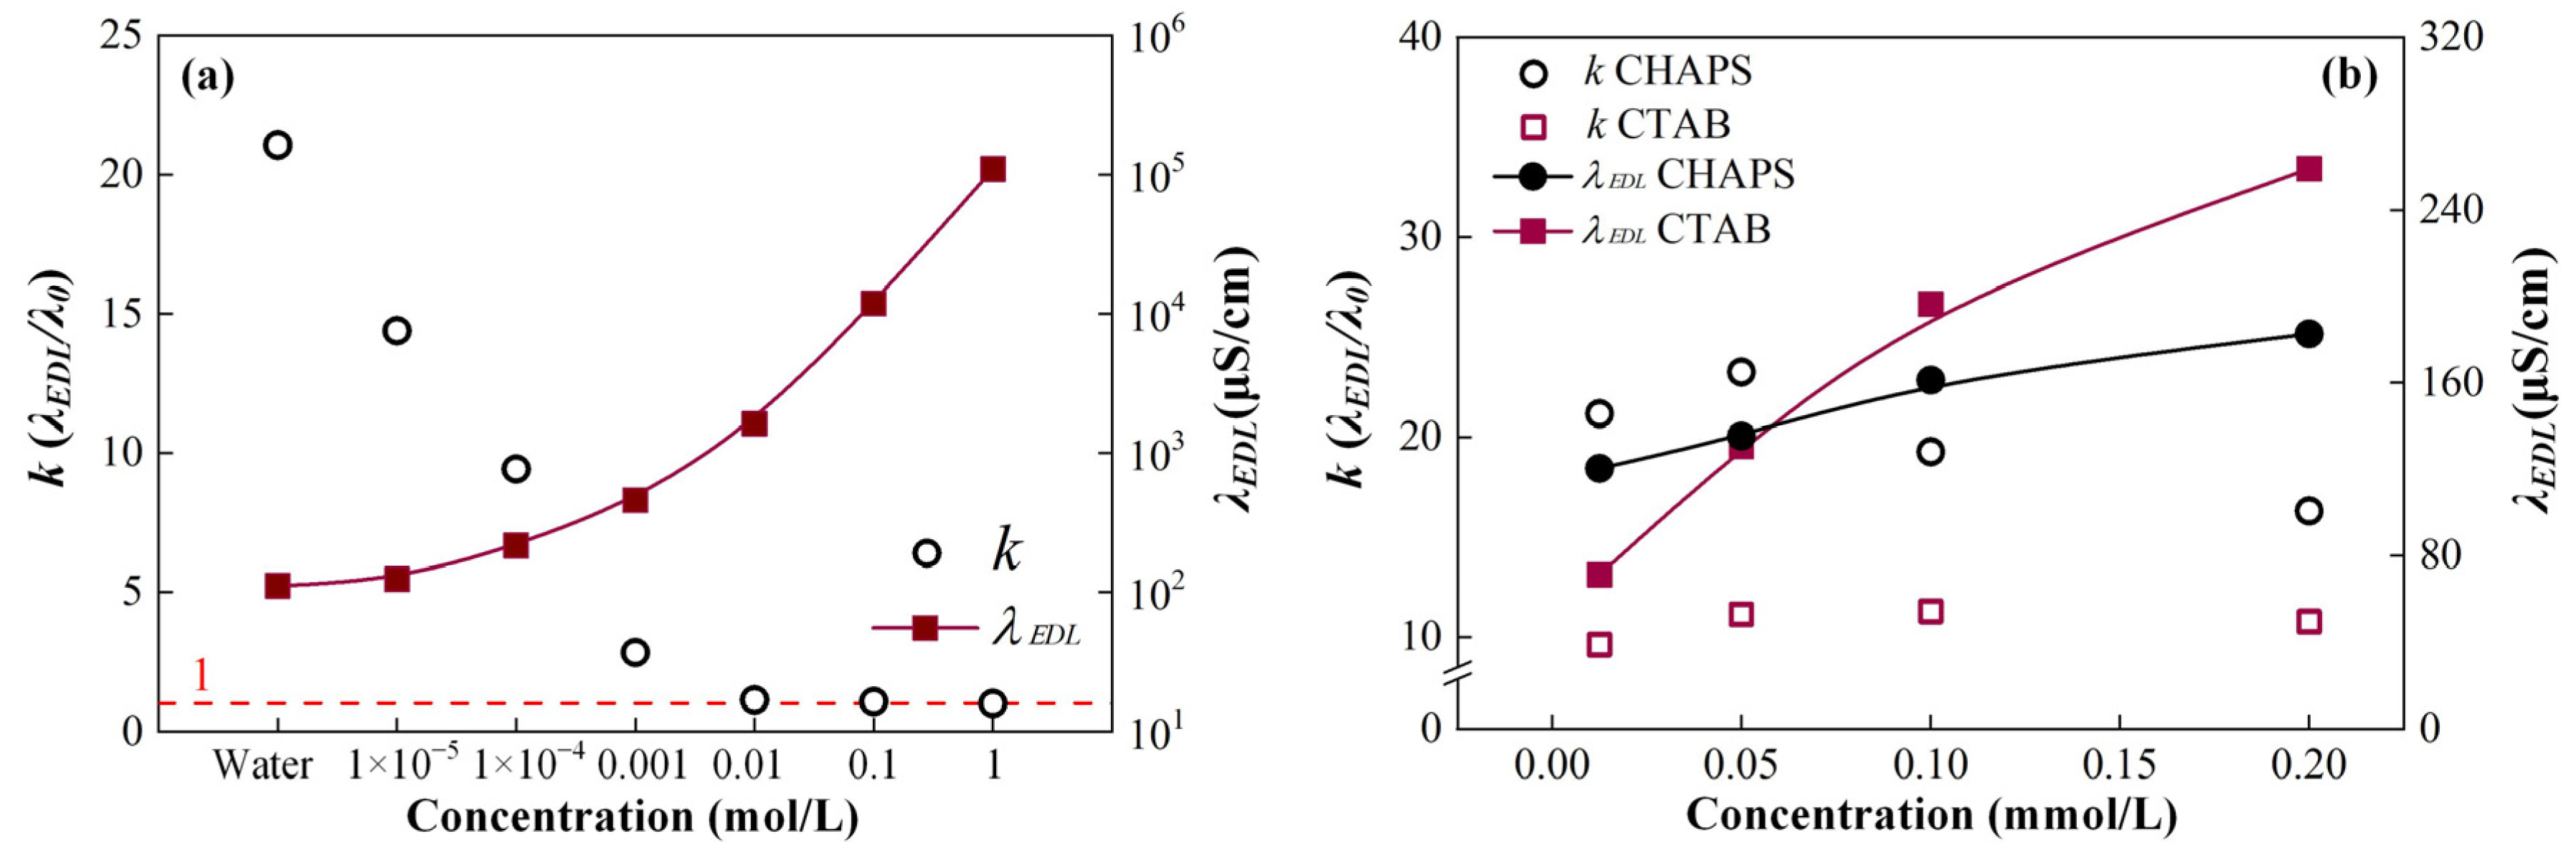
  • The difference between the EDL conductivity and the bulk conductivity of a liquid (λEDL/λ0, k) is sensitive to the change in the ion concentration. The lower the ion concentration, the more obvious the difference. The k of 0.01 mol/L KCl solution is 1.13, while that of pure water is 21.05;
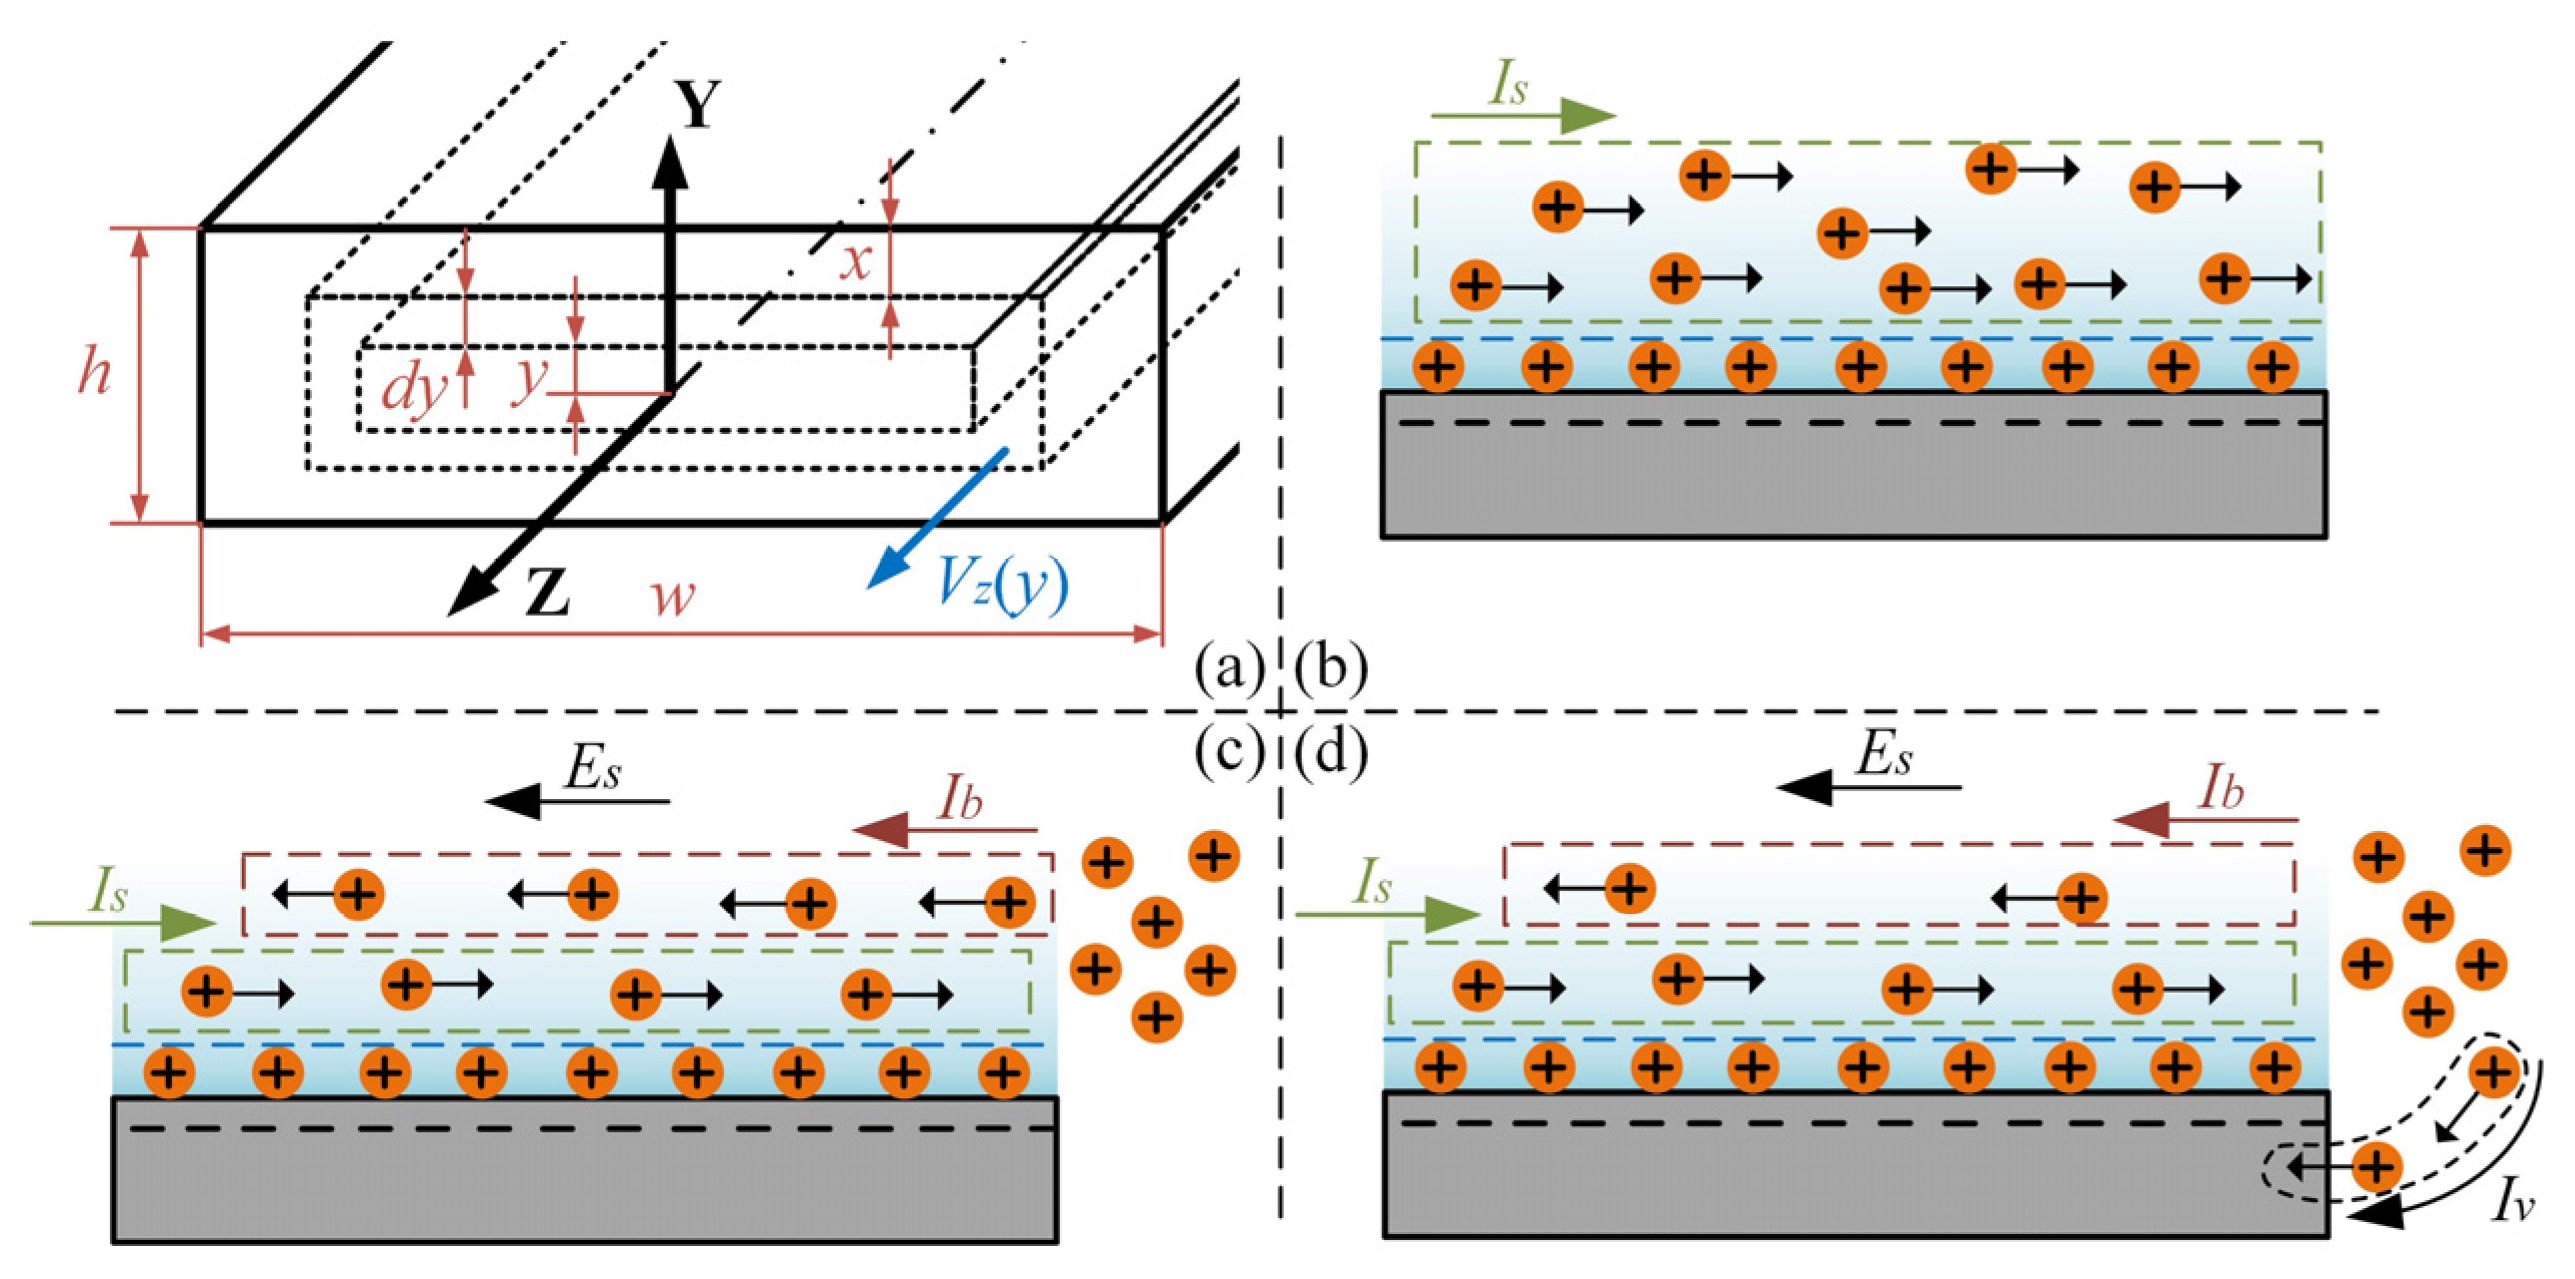
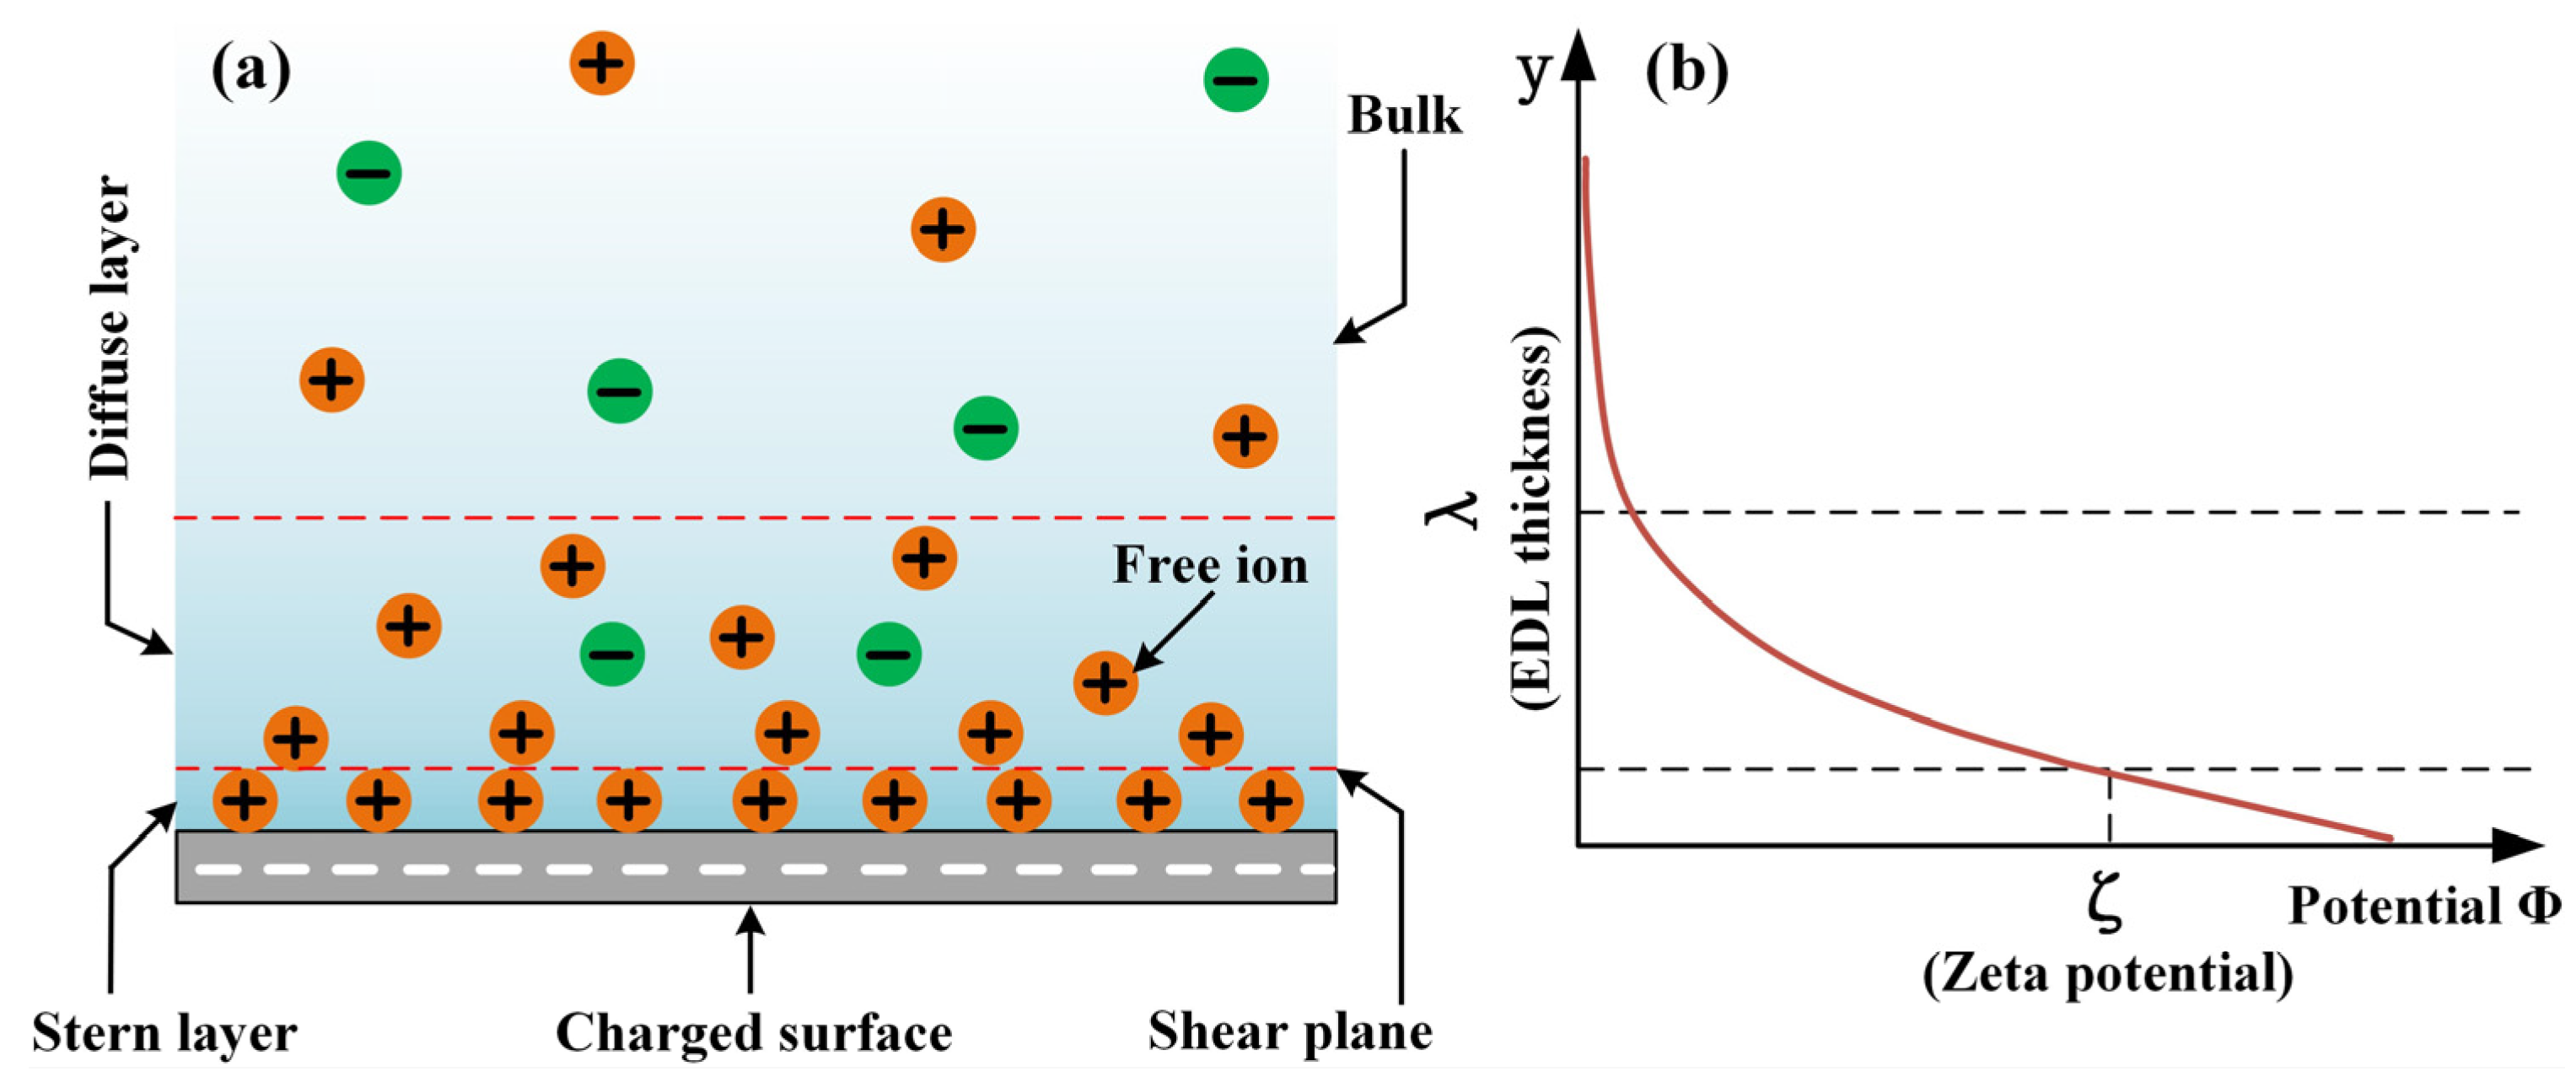
  • Due to the charge transfer and ion adsorption at the solid/liquid interface, the alumina ceramic and AISI 52100 steel surfaces are negatively charged in the prepared lubricants. The charged surface attracts the counterions within the lubricant bulk to form an EDL, one of the electroosmotic prerequisites. Cause of the special molecular structure of surfactants CHAPS and CTAB, their adsorption at the solid/liquid interface changes the EDL structure, showing the different zeta potentials;
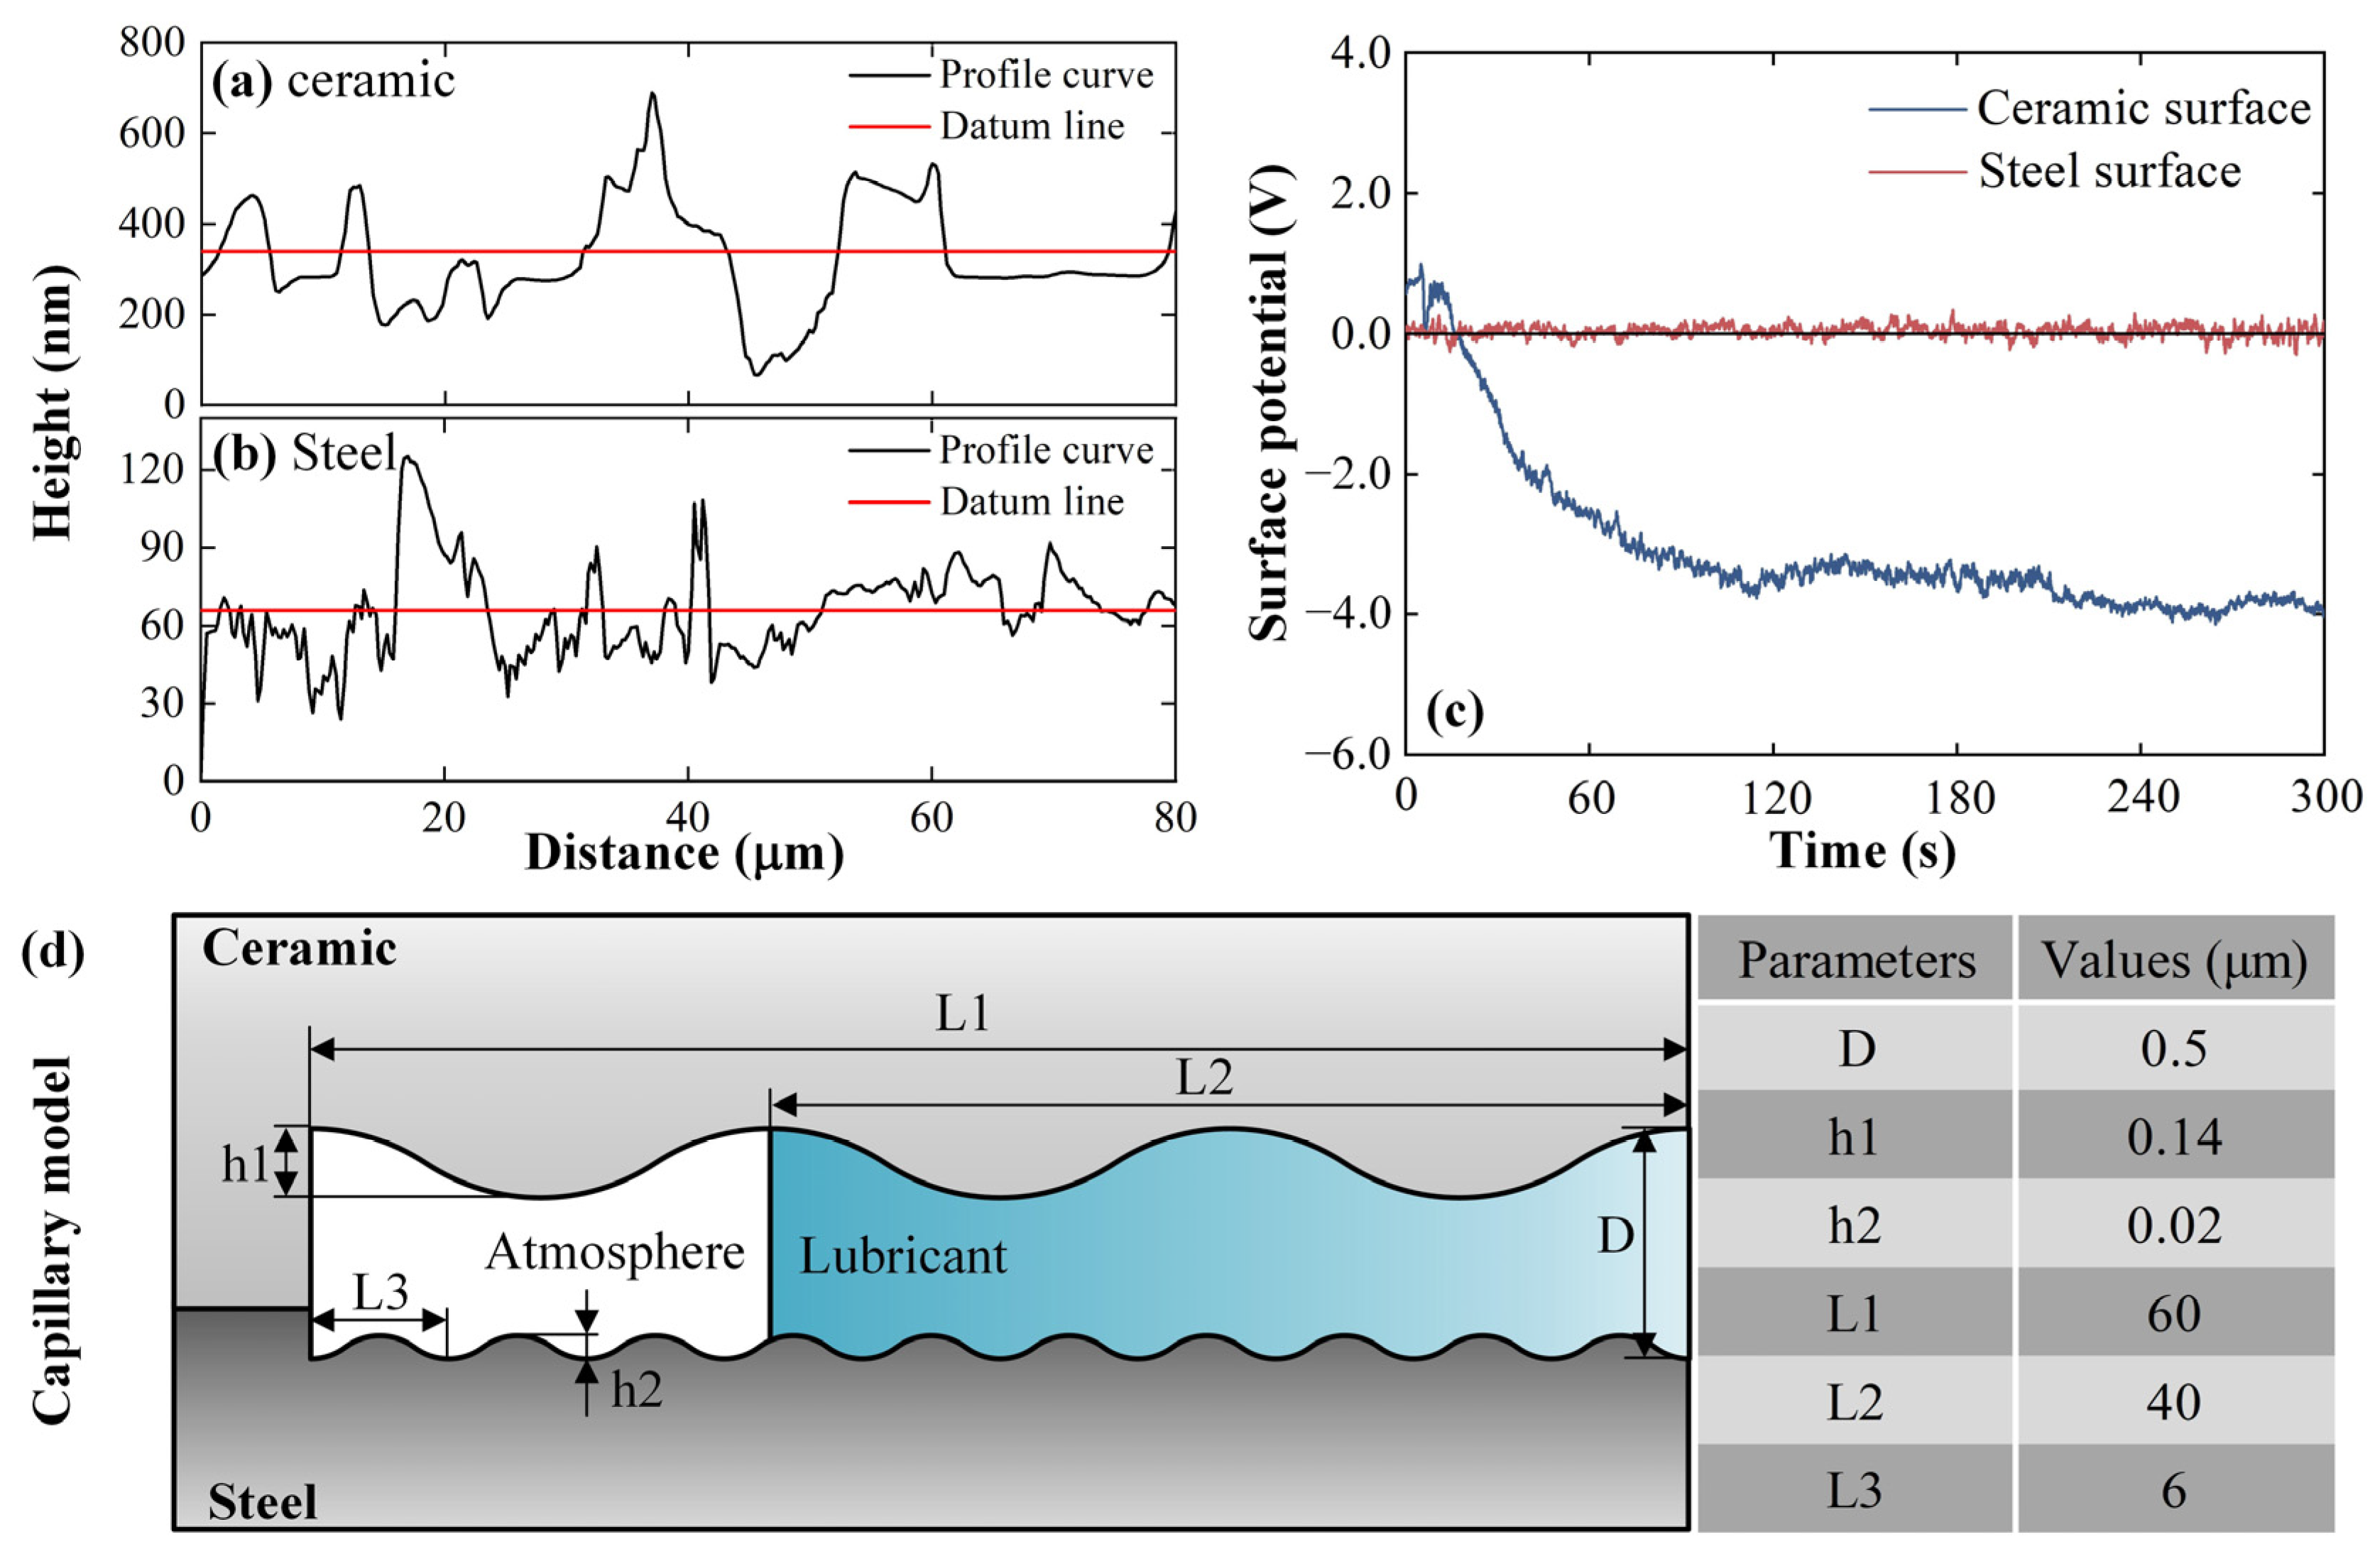
  • The triboelectrification electrostatic potential during ceramic/steel friction was measured. The potential of the ceramic surface is −3.53 V, and that of the steel surface is 0.04 V. The distribution characteristics of the tribo-induced electric field within the capillary at the friction interface were analyzed using the numerical simulation method. The results show that the electric field direction in the lubricant is directed to the capillary inner end, and the intensity is maintained at about 300–600 V/cm, which satisfies the strength condition for driving the lubricant electroosmosis;
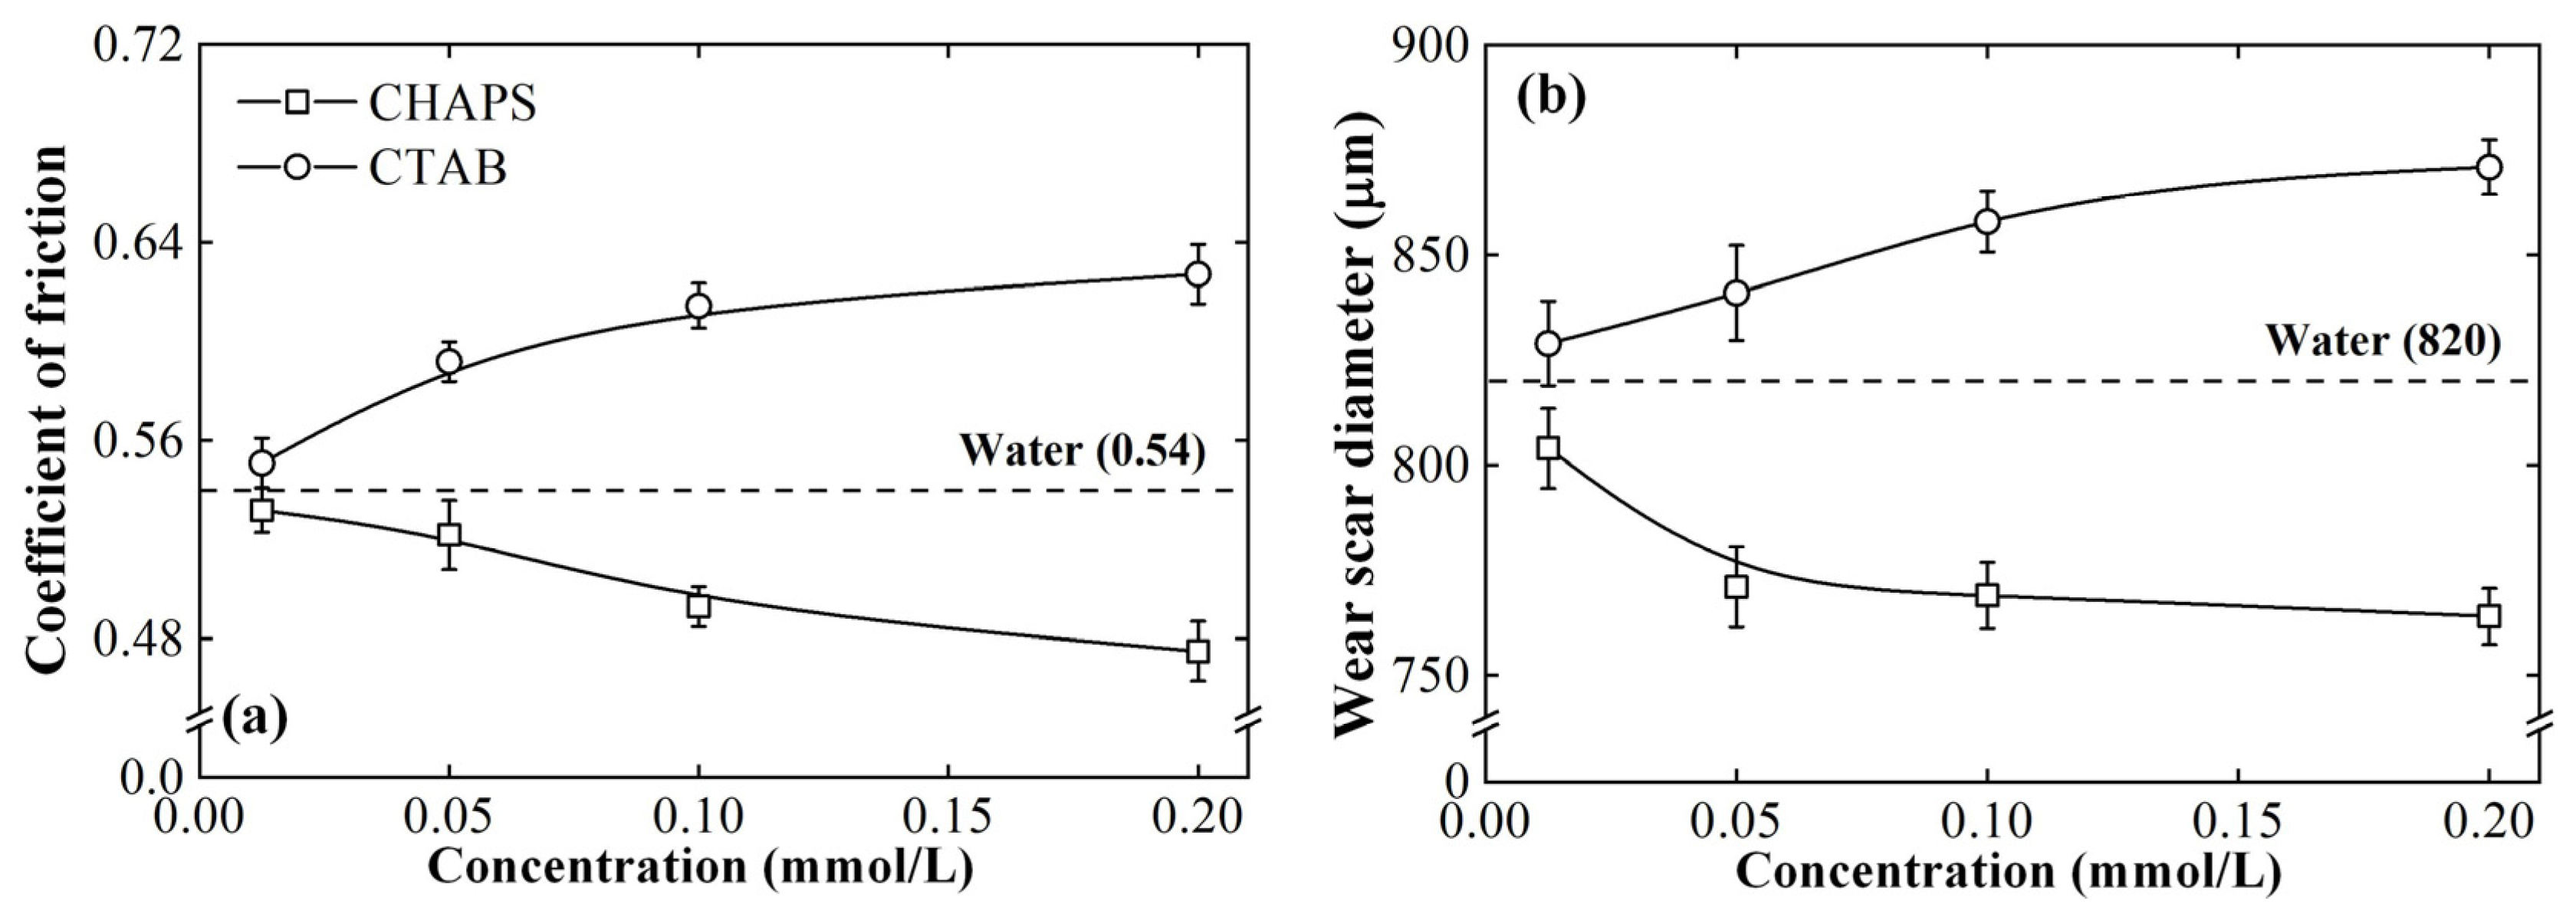
  • The ceramic/steel friction interface possesses the conditions for inducing the capillary electroosmosis of the lubricant. CHAPS can promote the capillary penetration of the lubricant by improving its electroosmotic properties, presenting satisfactory anti-friction and anti-wear performances. CTAB can reverse the lubricant electroosmosis, thus suppressing its penetrability, showing poor tribological performance.

Author Contributions

Conceptualization, Z.L., X.H. and X.X.; methodology, Z.L., R.Z. and X.X.; validation, Z.L., W.L. and Y.X.; formal analysis, B.F. and S.H.; investigation, Z.L., W.L. and X.X.; resources, R.Z., X.H. and X.X.; writing—original draft preparation, Z.L.; writing—review and editing, Z.L., Y.X., S.H. and X.X.; visualization, Z.L., S.H. and B.F.; supervision, R.Z., X.H. and X.X.; project administration, X.X.; funding acquisition, X.H. and X.X. All authors have read and agreed to the published version of the manuscript.

Funding

This research was funded by the National Key Research and Development Program of China, grant number 2020YFB2010600, the National Natural Science Foundation of China, grant number 51775507, and the Natural Science Foundation of Zhejiang Province, grant number LY19E050006.

Informed Consent Statement

Not applicable.

Data Availability Statement

Not applicable.

Conflicts of Interest

The authors declare no conflict of interest.

Appendix A. Calculation of EDL Conductivity from Membrane Resistance

Assuming that the pores in the membrane are ideal parallel capillaries, the membrane resistance Rm can be considered as the resistance of the parallel circuit of the liquid within pores and the pore walls. Since the liquid resistance is much lower than the pore wall resistance, the relationship between the membrane resistance Rm and the liquid resistance within a pore Rpore is as follows:
R m = R p o r e N ,
where N is the number of the pores within the membrane. The relationship between the conductivity and resistance of the liquid within a pore is shown below:
λ p o r e l λ p o r e h = G p o r e l G p o r e h = R p o r e h R p o r e l ,
where λ p o r e l is the measuring liquid conductivity within a pore, λ p o r e h is the conductivity of a high concentration electrolyte solution within a pore (i.e., the liquid conductivity within a pore can be assumed to be equal to its bulk conductivity [44]. 1 mol/L KCl solution is used in this paper), G p o r e l and G p o r e h are the pore conductance of the measuring liquid and the high concentration electrolyte solution, and R p o r e l and R p o r e h are the pore resistances of these two liquids. Substituting for Equation (A2) from Equation (A1):
λ p o r e l = R p o r e h R p o r e l λ p o r e h R m h R m l λ 0 h ,
where R m l and R m h are the membrane resistances when the pores are filled with the measuring liquid and the high concentration electrolyte solution, and λ 0 h is the solution bulk conductivity. Since the selected membrane pore size is equivalent to the EDL thickness of the measuring liquid, it can be considered that:
λ E D L l λ p o r e l R m h R m l λ 0 h ,
where λ E D L l is the EDL conductivity of the measuring liquid.

Appendix B. Calculation of Zeta Potential from Streaming Potential

The streaming potential is an electrokinetic effect at the solid/liquid interface, resulting from the relative movement of the EDL under external pressure, as shown in Figure A1. The free ions in the diffuse layer move downstream to form a streaming current, Is:
I s = 0 h 2 4 w h y v z ( y ) ρ ( y ) d y ,
where h and w are the height and width of the slit channel, and vz (y) is the linear velocity of the liquid at a distance y from the axis of the channel, which is given by Hagen–Poiseuille’s equation:
v z ( y ) = Δ p ( ( h 2 ) 2 y 2 ) 2 η l ,
Since the EDL is a thin region near the solid surface, only the movement of the free ions in the diffuse layer near y = h/2 is important in determining the streaming current [21]. Substituting for Equation (A6) from y = (h/2 − x), hence,
v z ( y ) = v z ( h / 2 x ) = Δ p ( h x x 2 ) 2 η l Δ p h x 2 η l ,
Since the channel height is much larger than the EDL thickness, the upper and lower EDLs do not overlap. The ion density within the channel can be described by Poisson’s equation:
d 2 ψ d x 2 = ρ ε ,
Substituting for Equation (A5) from Equations (A7) and (A8):
I s = ε ζ η l w h Δ p ,
The accumulation of ions downstream results in the formation of an electric field, causing a backflow of ions, i.e., a conduction current, Ib. When the channel is composed of insulating materials with low conductivities, the downstream ions only flow back through the liquid phase, Ib is as follows:
I b = I l = w h E s λ 0 l ,
where Il is the backflow of ions through the liquid phase, l is the channel length, λ0 is the liquid conductivity. Note that when the liquid phase is a dilute solution with an extremely low ion concentration, due to the large difference between the bulk conductivity and the EDL conductivity, the λ0 in Equation (A10) should be replaced by the liquid EDL conductivity λEDL. When the streaming potential, Es, reaches a steady-state, I s + I b = 0 , hence,
w h E s λ E D L l ε ζ η l w h Δ p = 0 ,
ζ = E s Δ p η ε λ E D L ,
where ∆P the is the hydrodynamic pressure difference between the two ends of the channel, η is the liquid viscosity, and ε is the liquid permittivity. When the channel is composed of materials with excellent electrical conductivities, such as metals, a large number of ions flow back through the material bulk; hence,
I b = I l + I v = E s G t ,
where Iv is the backflow of ions through the material bulk, Gt is the total conductance within the channel, and so,
E s G t ε ζ η l w h Δ p = 0 ,
ζ = E s Δ p η ε l w h G t ,
Figure A1. (a) Illustration of the slit channel for the calculation of streaming current, Is; (b) pressure drives ions in diffuse layers to generate a streaming current; (c) the accumulation of ions downstream results in streaming potential Es and an ion backflow to generate a back current, Ib; (d) a backflow through the metal bulk.
Lubricants 10 00111 g0a1

References

  1. Morshed, A.; Wu, H.; Jiang, Z. A Comprehensive Review of Water-Based Nanolubricants. Lubricants 2021, 9, 89. [Google Scholar] [CrossRef]
  2. Rahman, M.H.; Warneke, H.; Webbert, H.; Rodriguez, J.; Austin, E.; Tokunaga, K.; Rajak, D.K.; Menezes, P.L. Water-Based Lubricants: Development, Properties, and Performances. Lubricants 2021, 9, 73. [Google Scholar] [CrossRef]
  3. Wu, H.; Zhao, J.; Luo, L.; Huang, S.; Wang, L.; Zhang, S.; Jiao, S.; Huang, H.; Jiang, Z. Performance Evaluation and Lubrication Mechanism of Water-Based Nanolubricants Containing Nano-TiO2 in Hot Steel Rolling. Lubricants 2018, 6, 57. [Google Scholar] [CrossRef] [Green Version]
  4. Wu, H.; Kamali, H.; Huo, M.; Lin, F.; Huang, S.; Huang, H.; Jiao, S.; Xing, Z.; Jiang, Z. Eco-Friendly Water-Based Nanolubricants for Industrial-Scale Hot Steel Rolling. Lubricants 2020, 8, 96. [Google Scholar] [CrossRef]
  5. Sagraloff, N.; Winkler, K.J.; Tobie, T.; Stahl, K.; Folland, C.; Asam, T. Investigations on the Scuffing and Wear Characteristic Performance of an Oil Free Water-Based Lubricant for Gear Applications. Lubricants 2021, 9, 24. [Google Scholar] [CrossRef]
  6. Lin, W.; Klein, J. Control of surface forces through hydrated boundary layers. Curr. Opin. Colloid Interface Sci. 2019, 44, 94–106. [Google Scholar] [CrossRef]
  7. Huang, S.; Wu, H.; Jiang, Z.; Huang, H. Water-based nanosuspensions: Formulation, tribological property, lubrication mechanism, and applications. J. Manuf. Processes 2021, 71, 625–644. [Google Scholar] [CrossRef]
  8. Godlevskiy, V.A. Technological lubricating means: Evolution of materials and ideas. Front. Mech. Eng. 2016, 11, 101–107. [Google Scholar] [CrossRef]
  9. Brinksmeier, E.; Meyer, D.; Huesmann-Cordes, A.G.; Herrmann, C. Metalworking fluids-Mechanisms and performance. CIRP Ann. 2015, 64, 605–628. [Google Scholar] [CrossRef] [Green Version]
  10. Smith, T.; Naerheim, Y.; Lan, M.S. Theoretical analysis of cutting fluid interaction in machining. Tribol. Int. 1988, 21, 239–247. [Google Scholar] [CrossRef]
  11. Zeytounian, R.K. Interfacial Phenomena and the Marangoni Effect, 1st ed.; Springer: Vienna, Austria, 2002; pp. 123–190. [Google Scholar]
  12. Xu, X.; Luan, Z.; Zhang, T.; Liu, J.; Feng, B.; Lv, T.; Hu, X. Effects of electroosmotic additives on capillary penetration of lubricants at steel/steel and steel/ceramic friction interfaces. Tribol. Int. 2020, 151, 106441. [Google Scholar] [CrossRef]
  13. Feng, B.; Luan, Z.; Zhang, T.; Liu, J.; Hu, X.; Guan, J.; Xu, X. Capillary electroosmosis properties of water lubricants with different electroosmotic additives under a steel-on-steel sliding interface. Friction 2021, 10, 1019–1034. [Google Scholar] [CrossRef]
  14. Chen, L.X.; Ma, J.P.; Tan, F.; Guan, Y.F. Generating high-pressure sub-microliter flow rate in packed microchannel by electroosmotic force: Potential application in microfluidic systems. Sens. Actuators B Chem. 2003, 88, 260–265. [Google Scholar] [CrossRef]
  15. Li, D. EDL Potential. In Encyclopedia of Microfluidics and Nanofluidics; Li, D., Ed.; Springer: West Lafayette, IN, USA, 2008; pp. 444–453. [Google Scholar]
  16. Lucy, C.A.; Underhill, R.S. Characterization of the cationic surfactant induced reversal of electroosmotic flow in capillary electrophoresis. Anal. Chem. 1996, 68, 300–305. [Google Scholar] [CrossRef]
  17. MacDonald, A.M.; Sheppard, M.A.W.; Lucy, C.A. Enhancement of electroosmotic flow using zwitterionic additives. Electrophoresis 2005, 26, 4421–4428. [Google Scholar] [CrossRef]
  18. Buchberger, W.; Winna, K. Determination of free fatty acids by capillary zone electrophoresis. Mikrochim. Acta 1996, 122, 45–52. [Google Scholar] [CrossRef]
  19. Möckel, D.; Staude, E.; Dal-Cin, M.; Darcovich, K.; Guiver, M. Tangential flow streaming potential measurements: Hydrodynamic cell characterization and zeta potentials of carboxylated polysulfone membranes. J. Membr. Sci. 1998, 145, 211–222. [Google Scholar] [CrossRef] [Green Version]
  20. Fievet, P.; Sbaï, M.; Szymczyk, A.; Vidonne, A. Determining the ζ-potential of plane membranes from tangential streaming potential measurements: Effect of the membrane body conductance. J. Membr. Sci. 2003, 226, 227–236. [Google Scholar] [CrossRef]
  21. Hunter, R.J. Chapter 3-The Calculation of Zeta Potential. In Zeta Potential in Colloid Science; Hunter, R.J., Ed.; Academic Press: Cambridge, MA, USA, 1981; pp. 59–124. [Google Scholar]
  22. Szymczyk, A.; Fievet, P.; Aoubiza, B.; Simon, C.; Pagetti, J. An application of the space charge model to the electrolyte conductivity inside a charged microporous membrane. J. Membr. Sci. 1999, 161, 275–285. [Google Scholar] [CrossRef]
  23. Exartier, C.; Maximovitch, S.; Baroux, B. Streaming potential measurements on stainless steels surfaces: Evidence of a gel-like layer at the steel/electrolyte interface. Corros. Sci. 2004, 46, 1777–1800. [Google Scholar] [CrossRef]
  24. Nakayama, K. Triboemission of charged particles from various solids under boundary lubrication conditions. Wear 1994, 178, 61–67. [Google Scholar] [CrossRef]
  25. Nakayama, K. The plasma generated and photons emitted in an oil-lubricated sliding contact. J. Phys. D Appl. Phys. 2007, 40, 1103–1107. [Google Scholar] [CrossRef]
  26. Chang, Y.P.; Chu, H.M.; Chou, H.M. Effects of mechanical properties on the tribo-electrification mechanisms of iron rubbing with carbon steels. Wear 2007, 262, 112–120. [Google Scholar] [CrossRef]
  27. Charlson, E.M.; Charlson, E.J.; Burkett, S.; Yasuda, H.K. Study of the contact electrification of polymers using contact and separation current. IEEE Trans. Electr. Insul. 1992, 27, 1144–1151. [Google Scholar] [CrossRef]
  28. He, J.; Sun, J.; Meng, Y.; Pei, Y. Superior lubrication performance of MoS2-Al2O3 composite nanofluid in strips hot rolling. J. Manuf. Processes 2020, 57, 312–323. [Google Scholar] [CrossRef]
  29. He, J.; Sun, J.; Meng, Y.; Tang, H.; Wu, P. Improved lubrication performance of MoS2-Al2O3 nanofluid through interfacial tribochemistry. Colloids Surf. A Physicochem. Eng. Asp. 2021, 618, 126428. [Google Scholar] [CrossRef]
  30. Xiong, S.; Zhang, B.; Luo, S.; Wu, H.; Zhang, Z. Preparation, characterization, and tribological properties of silica-nanoparticle-reinforced B-N-co-doped reduced graphene oxide as a multifunctional additive for enhanced lubrication. Friction 2021, 9, 239–249. [Google Scholar] [CrossRef] [Green Version]
  31. Pérez, A.T.; Fernández-Mateo, R. Electric force between a dielectric sphere and a dielectric plane. J. Electrostat. 2021, 112, 103601. [Google Scholar] [CrossRef]
  32. Tatsumi, K.; Nishitani, K.; Fukuda, K.; Katsumoto, Y.; Nakabe, K. Measurement of electroosmotic flow velocity and electric field in microchannels by micro-particle image velocimetry. Meas. Sci. Technol. 2010, 21, 11. [Google Scholar] [CrossRef]
  33. Gao, S.; Liu, H. Capillary Mechanics, 1st ed.; Science Press: Beijing, China, 2010; pp. 121–123. [Google Scholar]
  34. Huang, S.; Li, Z.; Yao, W.; Hu, J.; Xu, X. Tribological performance of charged vegetable lubricants. Tribology 2014, 34, 371–378. [Google Scholar]
  35. Wang, J.; Li, C.; Wang, J.; Zhao, G.; Wang, X. Synthesis and tribological properties of a water-soluble lubricant additive. Lubr. Eng. 2012, 37, 1–6. [Google Scholar]
  36. Zou, H.; Guo, L.; Xue, H.; Zhang, Y.; Wang, Z.L. Quantifying and understanding the triboelectric series of inorganic non-metallic materials. Nat. Commun. 2020, 11, 2093. [Google Scholar] [CrossRef] [PubMed]
  37. Nakayama, K.; Hashimoto, H. Effect of surrounding gas-pressure on triboemission of charged-particles and photons from wearing ceramic surfaces. Tribol. Trans. 1995, 38, 35–42. [Google Scholar] [CrossRef]
  38. Zhao, W.; Liu, X.; Yang, F.; Wang, K.G.; Bai, J.T.; Qiao, R.; Wang, G.R. Study of Oscillating Electroosmotic Flows with High Temporal and Spatial Resolution. Anal. Chem. 2018, 90, 1652–1659. [Google Scholar] [CrossRef]
  39. Liu, J.Y.; Liu, H.P.; Han, R.D.; Wang, Y. The study on lubrication action with water vapor as coolant and lubricant in cutting ANSI 304 stainless steel. Int. J. Mach. Tool Manuf. 2010, 50, 260–269. [Google Scholar]
  40. Wang, S.; Li, X.; Liu, D. Surfactant Chemistry, 1st ed.; Chemical Industry Press: Beijing, China, 2005; pp. 8–13. [Google Scholar]
  41. Xu, X.F.; Lv, T.; Luan, Z.Q.; Zhao, Y.Y.; Wang, M.H.; Hu, X.D. Capillary penetration mechanism and oil mist concentration of Al2O3 nanoparticle fluids in electrostatic minimum quantity lubrication (EMQL) milling. Int. J. Adv. Manuf. Technol. 2019, 104, 1937–1951. [Google Scholar] [CrossRef]
  42. Chen, Y. Capillary Electrophoresis Technology and Its Application, 2nd ed.; Chemical Industry Press: Beijing, China, 2005; pp. 9–91. [Google Scholar]
  43. Hines, H.B.; Brueggemann, E.E. Factors affecting the capillary electrophoresis of ricin, a toxic glycoprotein. J. Chromatogr. A 1994, 670, 199–208. [Google Scholar] [CrossRef]
  44. Sbai, M.; Fievet, P.; Szymczyk, A.; Aoubiza, B.; Vidonne, A.; Foissy, A. Streaming potential, electroviscous effect, pore conductivity and membrane potential for the determination of the surface potential of a ceramic ultrafiltration membrane. J. Membr. Sci. 2003, 215, 1–9. [Google Scholar] [CrossRef]
Figure 1. (a) Schematic illustration of EDL produced at a solid-liquid interface and (b) its corresponding potential distribution.
Lubricants 10 00111 g001
Figure 2. Schematic illustrations of (a) galvanostatic four-electrodes system and (b) tangential streaming potential measurement platform.
Lubricants 10 00111 g002
Figure 3. Schematic diagram of triboelectrification electrostatic potential measurement configuration.
Lubricants 10 00111 g003
Figure 4. EDL conductivities of (a) KCl solutions and (b) CHAPS and CTAB lubricants, plotted against concentrations and their relationships with bulk conductivities.
Lubricants 10 00111 g004
Figure 5. The streaming potential of lubricants on (a) ceramic and (b) steel surfaces plotted against pressure values (data in the yellow (or green) area was obtained using lubricants prepared with CTAB (or CHAPS)); Zeta potential of at the (c) ceramic-lubricant and (d) steel-lubricant interfaces, plotted as a function of concentration.
Lubricants 10 00111 g005
Figure 6. Profiles of (a) ceramic and (b) steel worn surfaces, (c) triboelectrification electrostatic potentials of steel and ceramic surfaces, and (d) capillary model of friction interface.
Lubricants 10 00111 g006
Figure 7. Simulation results of the tribo-induced electric field: values of (a) potential and (b) electric field intensities at the capillary center.
Lubricants 10 00111 g007
Figure 8. (a) Coefficient of friction values and (b) wear scar diameters of ceramic/steel friction pairs using different lubricants.
Lubricants 10 00111 g008
Figure 9. SEM-AsB images and EDS analyses of the worn surfaces lubricated by (a) pure water and lubricants with different additive concentrations: (b) 0.05 mmol/L CHAPS, (c) 0.2 mmol/L CHAPS, (d) 0.05 mmol/L CTAB, and (e) 0.2 mmol/L CTAB.
Lubricants 10 00111 g009
Figure 10. Lubricant contact angles on (a) ceramic and (b) steel surfaces. Effects of CHAPS and CATB on (c) lubricant surface tensions and (d) capillary forces at ceramic/steel friction interfaces.
Lubricants 10 00111 g010
Figure 11. Illustrations of (a) pure water EOF and impacts of (b) CHAPS and (c) CTAB on the EOF. Molecular structures of (d) CHAPS and (e) CTAB.
Lubricants 10 00111 g011
Table 1. Membrane resistances and bulk conductivities of KCl solutions.
C (mmol/L)10.10.010.0010.00010.00001Pure water
λ0 (μS/cm)109,60011,0801428161.622.88.565.26
Rm (Ω∙cm2)0.10.936.824518999
Table 2. Membrane resistances and bulk conductivities of lubricants.
ParametersCHAPS LubricantsCTAB Lubricants
Concentration (mmol/L)0.01250.050.10.20.01250.050.10.2
λ0 (μS/cm)5.695.828.3611.207.3911.7117.3924.03
Rm (Ω∙cm2)918168601548455.842.3
Table 3. Roughness Evaluation Parameters of the Ceramic and Steel Worn Surfaces.
Worn SurfaceRa (μm)Rz (μm)Rsm (μm)
Alumina ceramic0.070.5120.05
AISI 52100 steel0.010.085.68
Publisher’s Note: MDPI stays neutral with regard to jurisdictional claims in published maps and institutional affiliations.

