Article

Experimental Investigation on the Wear Performance of Nano-Additives on Degraded Gear Lubricant

Department of Mechanical Engineering, Indian Institute of Technology Delhi, Delhi 110016, India
*
Author to whom correspondence should be addressed.
Lubricants 2023, 11(2), 51; https://doi.org/10.3390/lubricants11020051
Submission received: 27 December 2022 / Revised: 25 January 2023 / Accepted: 28 January 2023 / Published: 30 January 2023
(This article belongs to the Special Issue Nanolubrication and Superlubrication)

Abstract

:
This study investigates the degradation of a commercially available gear lubricant and the potential of nano-additives to mitigate such degradation. Initially, we performed an experimental study on the chemical degradation of commercially available API GL-4 EP90 gear lubricant by mixing the different concentrations of aqueous hydrochloric acid (aqueous HCl) varying from 0.0005% v/v up to 0.0025% v/v, while maintaining overall water content in the oil below the prescribed limits. The degradation was monitored using the pH value, total acid number (TAN) value, and attenuated total reflectance-Fourier transform infrared spectroscopy (ATR-FTIR) analysis. The experiments were performed on a developed gear test rig using conventional gear oil as well as chemically aged gear oil, and the corresponding results of pH value and wear debris were recorded. Based on the results, an empirical regression model between the concentration of aqueous HCl and lubricant aging time has been established. Under chemically aged lubricant, severe wear of gear was observed, which motivated us to explore suitable nano-additive to minimize the gear wear. Initially, three nano-additives—graphite, graphene, and “graphene oxide functionalized with silicon oxide (GO@SiO2)”—were chosen. A series of tests were conducted using the design of experiments method (L8 and L16 orthogonal array) to investigate the effect of nano-additives and to find the optimum additive for wear performance. Finally, experiments were conducted on gear setup using the degraded lubricant optimized with nano-additive. Overall results indicate a very significant contribution of nano-additives in decreasing gear wear.

1. Introduction

Lubricants play a vital role in reducing wear damage, but their selection and design require a comprehensive design methodology [1] to yield the desired purpose. There is a time lapse between the production and use of the lubricant, and during this time, the lubricant starts degrading due to exposure to temperature and solar radiation [2]. American Gear Manufacturers Association (AGMA) 9005-F16 [3] provides the guidelines for using and discarding the lubricant based on the acid number and limiting value of ten times the initial value. In practice, the additive packages [4,5,6,7] are blended in base oils to improve their anti-wear/scuff/rust/pressure-bearing properties. Although all these properties are important for the lubricant, aging is also an important parameter. The aging of lubricant depends on the rate of mechanical shearing, chemical degradation [2,8,9], and various contamination (e.g., dust, wear debris, water). The oxidation of the lubricant occurs due to the depletion of the ROOH into free R* radicals and hydrocarbons –RH– and the formation of oxides and the attribution to H–O–H bending mode absorption in hydroxyl group in carboxylic acid [10,11,12]. An increase in the moisture level [13] leads to deteriorating lubricant; therefore, the acceptable limit of moisture is restricted to 100 ppm or 0.2% [14]. Every commercial gear oil has a small quantity of alkaline base to neutralize the acid content [15]. The measure of acidity in lubricant oil is quantified by the TAN (total acid number) value. Several studies [2,8,9,10,11,16,17,18,19,20] have used ATR-FTIR techniques to track the depletion of lubricant for oxidative and mechanical degradation. The ATR-FTIR data integrated with optical imaging [8] and linear regression [16] were used to track the lubricating oil’s shelf life and service life. De et al. [19] used Fourier transform spectroscopy (FTIR) to determine the depletion of different compounds in engine oil. They used machine learning algorithms to predict the TAN value of the lubricant. Several advanced optimization techniques and tribological methods [21,22,23,24,25,26] have been explored to minimize the failure of tribo-systems. But the lubricants derived from the organic crude oil degrade over time and must be discarded or replenished to maintain their tribological performance. The discarded oil often contaminates the environment by polluting the air, water, soil, etc., leading to long-term catastrophic effects on organic lives (flora and fauna) [27,28]. Researchers have attempted [29,30] to reduce the quantity of lubricant to be discarded. In the present study, an attempt has been made to enhance the lubricant life, reducing the total quantity to be discarded.
To formulate a methodology to enhance the lubricant life and validate the same requires laboratory tests. Various researchers have applied artificial aging techniques like mechanical shearing, thermal stressing, chemical oxidation, etc., to simulate the degradation behavior of the lubricant [31,32,33]. Nagy et al. [33] used laboratory-scale thermal degraded oil and ‘used contaminated lubricant oil’ to compare the chemical (TAN value) and physical properties (viscosity, etc.) and found a good correlation between both oil performances. Seidel et al. [34] studied the effect of chemical oxidation and showed that chemical oxidation affects lubricants’ physical, chemical, and biological properties. They also showed the effect of chemical oxidation on the pH value of the lubricant. Gupta et al. [35] used HCl and ethanol for the chemical aging of the lubricants and checked the effect of chemical aging on the wear and friction properties. Many researchers reported that the lubricant’s acid value increases the moisture, soot content in the oil, and temperature of the lubricant in operation [36,37]. The aging of the oil is becoming a major concern. The supplement of nano-additives to the common lubricating oils is a promising approach towards enhancing the service life of the lubricants. Many researchers in the past [38,39,40,41,42,43,44,45,46,47,48,49,50,51,52] selected solid lubricants as nano-additives. Several researchers [53,54,55,56,57,58,59,60,61,62,63,64] reported nano-additives’ effect on the tribological performance of lubricants. The nanoparticles are classified as metal oxides, carbon allotropes, etc. Shahnazar et al. [41] classified the carbon allotropes further based on the dimension (0-D (fullerene) to 3D). Marian et al. [62], Marian et al. [63] and Rosenkranz et al. [64] showed the effect of 2D layered nano-material on the friction and wear properties along with the application and synthesis of 2D layered material. Thampi et al. [58] and Ashraf et al. [65] classified the effect of nano-additives on wear mechanisms into four categories: (1) rolling effect: small spherical nano-particles roll between friction surfaces; (2) polishing effect: the contact surface is polished to reduce the surface roughness; (3) mending effect: the physical film is formed to compensate for the mass loss; (4) tribo-film formation: a protective layer is formed to reduce friction. A few solid lubricants listed in the literature are Cu (0.1–2% w/w), CuO (0.1–2% w/w), graphene oxide (0.025–0.1% w/w), graphite (0.1–6% w/w), graphene (0.1–4% w/w), functionalized graphene oxides (0.03–0.5% w/w), silicon oxide (0.1–1% w/w), etc. The stability of suspension [65,66,67] of nano-additives must be accounted for.
The present study considers three cases (Case 1: fresh commercial lubricant test; Case 2: artificially aged lubricant; and Case 3: artificially aged lubricant doped with nano-additives) to understand the effect of lubricant aging on wear of spur gears. Due to their self-lubricity and environment-friendly characteristics, the carbon allotropes (graphite, graphene, and GO@SiO2) have been selected for doping the gear lubricant. Further, the ANOVA with L8 and L16 orthogonal array is used to discover the most significant nano-additive for gear lubricant application. The ATR-FTIR study is carried out to find the effectiveness of the nano-additives.

2. Results and Discussions

2.1. Case 1

The commercially available gear lubricant (API GL-4 EP 90) is used to perform the test on an in-house-developed test rig (a detailed description of the test rig is available in the previous publication [68]). The test specifications are listed in Table 1.
Before conducting the test on the gear test rig, the pH and TAN values of the lubricant were measured, and the oil’s pH showed the acidic nature of the lubricant. Due to time-lapse, the degradation of the additives (anti-wear, extreme pressure, etc.) was the most likely cause of the lubricant’s acidic nature. To confirm the time lapse from manufacturing and the use of the pH and TAN, two packets of oil, Packet 1 (March 2022) and Packet 2 (June 2021) (based on availability), were purchased. The measured pH and TAN values were: “Packet 1: March 2022: pH 5.742, TAN 0.0595 mg KOH/g; Packet 2: June 2021: pH 4.786, TAN 0.069 mg KOH/g”. From these values, it can be calculated that the change in pH is on the higher side compared to the change in TAN values. The oil in Packet 1 (March 2022) was used for experimentation on the gear test rig. During the running state of experiments, oil samples (30 mL) were collected at the interval of every 10 min. The pH shows a variation of 15.01%, and the TAN value (initially 0.0578 and after 90 min 0.065) shows a 12.45% variation. Therefore, the pH measurement was considered more beneficial compared to the TAN measurement. The measured pH values have been plotted in Figure 1. From this figure, it can be observed that the pH shows a decreasing trend. According to the LibreTexts organization (of the University of California) [69], “The pH scale follows a logarithmic”. Ukpaka et al. [70] validated the logarithmic theoretical relation for the pH value of ethanol. The present study adopts a logarithm relation between time and pH value. The pH value data have been fitted using the logarithmic fit as shown in Equation (1):
pH = 7.2 1.13 log 10 ( Time )
After the end of the experiment, the lubricant oil was collected and processed for the FTIR analysis. The ATR-FTIR results are plotted in Figure 2. This figure clearly shows the formation of the oxide products (1720–1732 cm−1) and ingress of moisture (increase in the O–H stretching at 3410 cm−1) in the used oil after completing experimentation on spur gears lubricated with fresh gear oil. Thermal degradation of lubricant, formation of wear debris, and oil contamination (i.e., dirt, moisture) that take place during gear operations increase the chances of oxides residues.

2.2. Case 2

As confirmed in Case 1, oil gets oxidized over time, and the pH value of the oil deteriorates over time; oxide formation and water ingress occur, which are signs of lubricant aging. This information hints at the possibility of artificial aging by acidification of lubricating oil. Therefore, in Case 2, firstly, lubricating oil is artificially aged, and subsequently, the artificially aged oil is used in the gear test rig to see its effect on the gear wear.

Artificial Aging Simulation

The aging of the gear oils is an important aspect. The aging of a lubricant can be determined by its ATR-FTIR spectrum (chemical composition, depletion of respective additives), change in viscosity, and TAN/pH values. In normal storage conditions, the lubricants follow time-lapse aging; but the aging reaction speeds up when the lubricant encounters oxygen, catalysts, increased temperatures, increased pressures/mechanical shearing, wear debris, or hostile (e.g., water, dust) environmental conditions [71,72]. Laboratory tests to evaluate the aging and corresponding performance of lubricant are necessary. The present paper simulates the aging of gear lubricants by extrapolating the pH data collected from the application-adapted procedure and developing an oil sample with a similar pH value. Doping it with the different aqueous HCl concentrations has been tried to degrade gear oil artificially. The measured mean pH values are plotted in Figure 3a. The relation of logarithmic fit for the effect of aqueous HCl concentration is represented in Equation (2).
pH = 13.165 5.3705 log 10 ( %   aqueous   HCl )
In this study, lubricant oil accelerated aging is simulated by employing a small quantity of aqueous HCl (36.46% aqueous HCl + 63.54% aqueous), keeping overall water content in oil below the prescribed limit of 0.2% or 100 ppm as reported by Cantlay [14] and the TAN values (Fresh oil: as 0.0595 mg KOH/g and artificially aged oil at the maximum level of 0.0025% v/v of aqueous HCl as 0.1135 mg KOH/g) within limits (see the Figure A1 in the Appendix A for ATR-FTIR spectra for different aqueous HCl concentration effect on gear lubricant). Using Equations (1) and (2), the relation between aging time and the aqueous HCl concentration can be represented as Equation (3):
Time = 10 18.02 × ( %   aqueous   HCl ) 4.75
The effect of chemical contamination from mixing the aqueous HCl on the aging of the lubricant is plotted in Figure 3b. As per this plot, mixing 0.0025% v/v aqueous HCl increases the water content by 0.0015885% and increases the lubricant’s age to nearly 7521 h. The ATR-FTIR analysis of the oil samples provides information on the oxidation products (peak increase at 1720–1732 cm−1) and increase in the water contamination (peak increase at 3410 cm−1) in the oil, as shown in Figure 2. The increase in oxides and moisture occurs due to the chemical reaction between aqueous HCl and base additives. Additionally, an increase in moisture is observed due to the presence of 63.54% of water in aqueous HCl.
The oil aged with 0.0025% v/v aqueous HCl was used for the test in the gear test rig. The test specifications are given in Table 1. The samples collected at an interval of every 10 min were processed for the pH calculation. The results are plotted in Figure 4, illustrating the drastic decrease of the pH to a negative value. The pH value shows a variation of 218.06%, and the TAN value (initially 0.1135 and after 90 min 0.132) shows a variation of 16.29%. It can be observed that pH is more sensitive than the TAN value to track the oil degradation. The results showing the presence of increased oxides in ATR-FTIR of degraded oil compared to the results obtained using fresh oil indicate the enhanced wear of gear material occurring due to the HCl chemical reaction. Therefore, a decrease in the pH value of the lubricant, as displayed in Figure 4, is observed.

2.3. Case 3

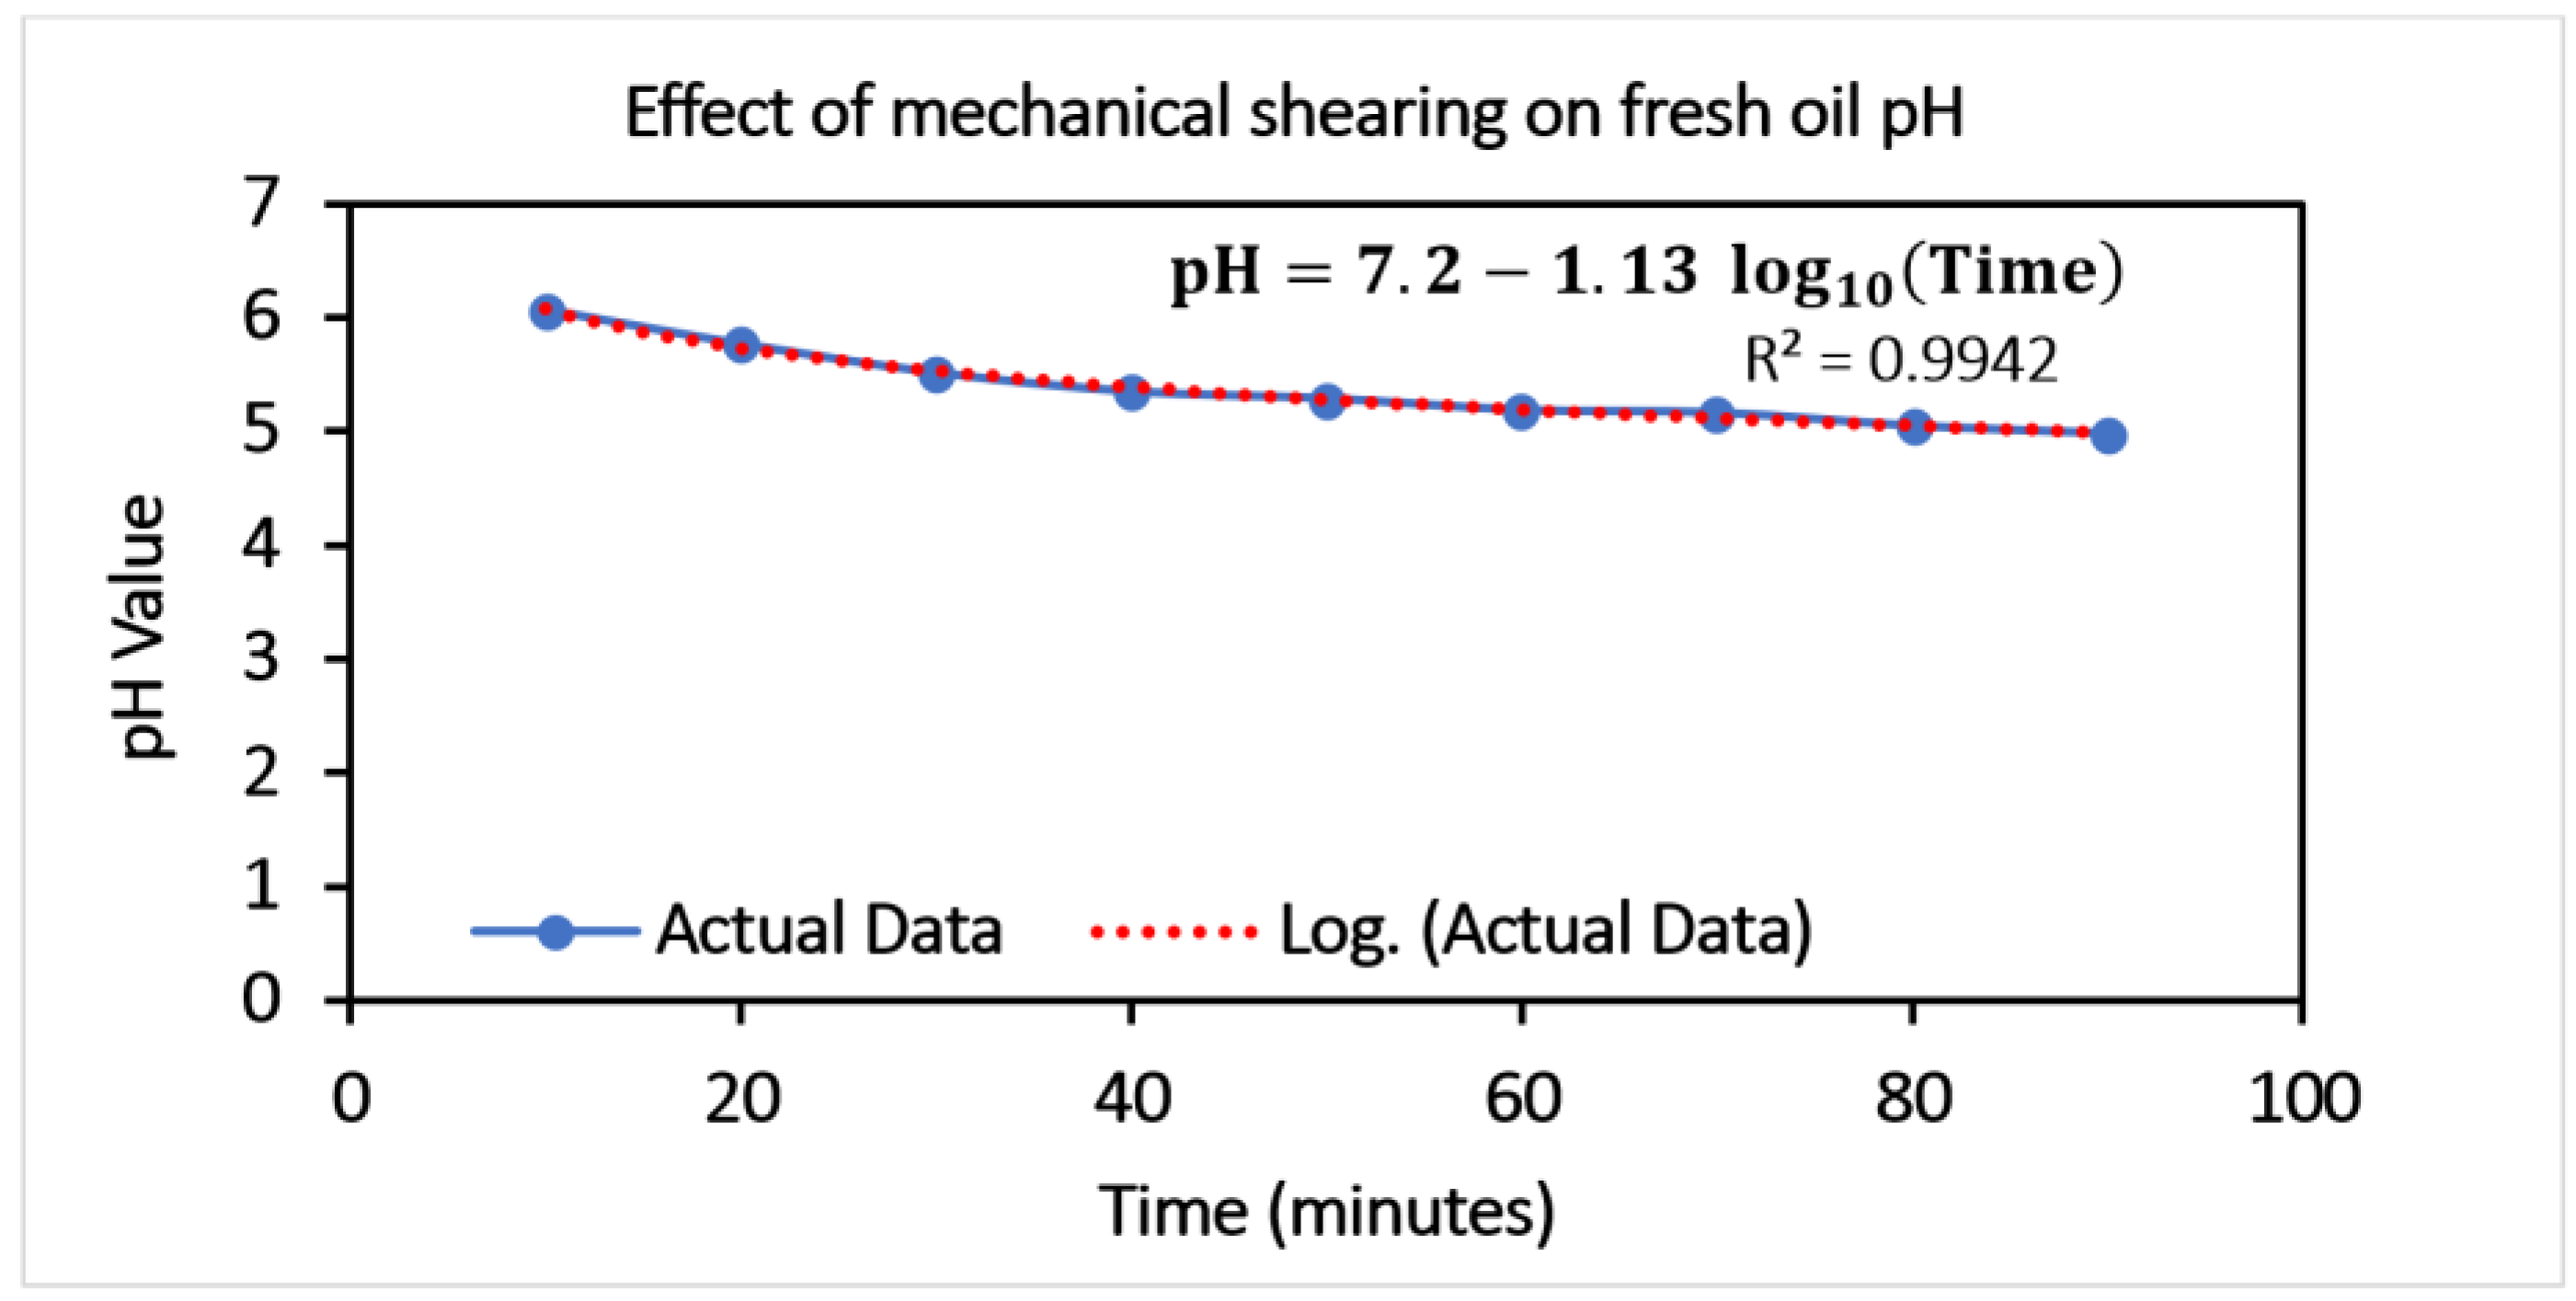
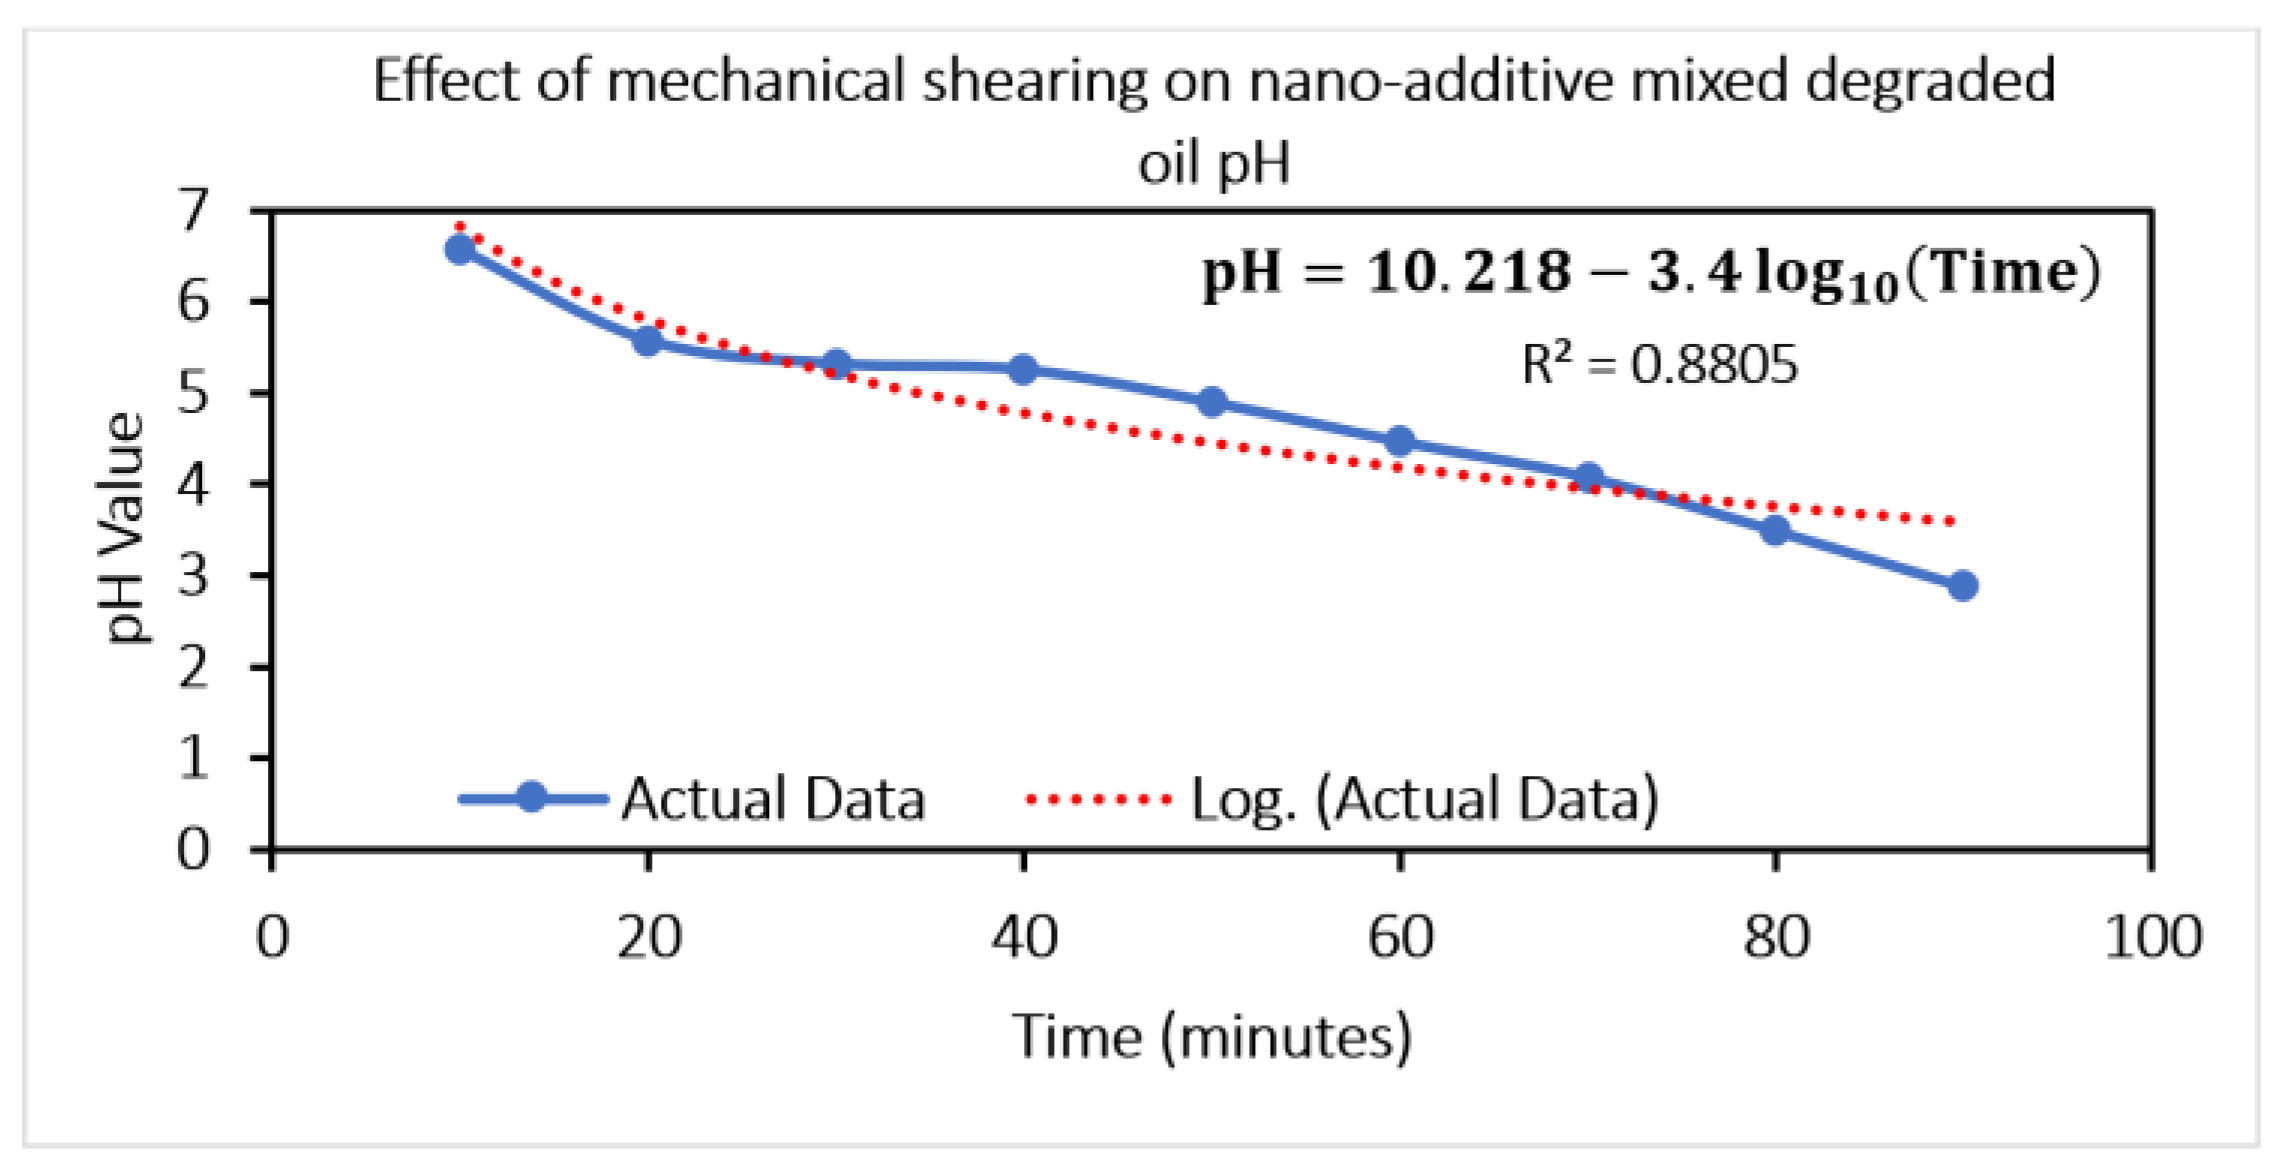
It is confirmed from Case 1 and Case 2 that oil gets oxidized over time, and the pH value of oil deteriorates over time, leading to oxide formation and water ingress, thus confirming the effect of lubricant aging. In Case 3, the main emphasis was given to selecting environment-friendly nano-additives for mixing in with the lubricant. Subsequently, the artificially aged oil was doped with nano-additives and tested in the lubricity tester to evaluate nano-additives’ performance and optimize the concentration. Finally, artificially aged oil doped with the optimum concentration (obtained from experiments on lubricity tester) of nano-additives was used in practical gear operation (on gear test rig) to see the effect on gear wear.

2.3.1. Selection of Nano-Additives

ATR-FTIR results shown in Figure 2 indicate degradation (formation of the oxide products (1720–1732 cm−1)) of the lubricant and moisture ingress (increase in the O–H stretching at 3410 cm−1) in the used oil after experimentation on spur gears lubricated with fresh gear oil (API GL-4 EP90) and oil sample artificially aged with aqueous HCl. Considering this kind of lubricant degradation, some allotropes of carbon (i.e., Graphene, Graphite) can be used as lubricant additives (as green additives or as additives that are environment friendly) to reduce the wear of gear-pair and to enhance the service life of gear oil. Considering these aspects, three nano-additives—graphite, graphene, and GO@SiO2—were selected. The effect of the selected nano-additive is given in Figure A2 in the Appendix A. The use of nano-additives decreases the moisture peak, which is confirmed by the ATR-FTIR as the peak at 3410 cm−1 is reduced. The SEM morphology of the nano-additives used in this study is shown in Figure 5. The graphene particles (Figure 5a) are in the form of flacks, platelets, and graphite (Figure 5b) particles are in the shape of flacks and spheres, and GO@SiO2 (Figure 5c) are in true nanoscale and spherical.
The approximate thickness of graphene, graphite, and GO@SiO2 nanoparticles 400 nm, 200 nm, and 95 nm, respectively, have been observed.
These particles were then mixed with a lubricant and homogenized using an ultrasonic homogenizer, which disintegrated the nanoparticles, and it is plausible that the particles may be even thinner/smaller [73] in the lubricant suspension.
Raman spectroscopy (as shown in Figure 5d) is a widely used technique for characterizing the structural properties of materials, including graphite, graphene, and graphene oxide (GO) compounds. This method is based on the inelastic scattering of light, known as Raman scattering, which can be used to identify specific vibrational modes of the material in question. In the case of graphene and GO, the most commonly observed Raman bands are the G band, which corresponds to in-plane vibrations of the carbon atoms in the sp2-bonded network, and the D band, which is associated with out-of-plane vibrations of the sp3-bonded carbon atoms that result from defects in the hexagonal structure of the graphene lattice. The presence of the 2D band in the Raman spectrum of graphene oxide is also a useful indicator of the presence of oxygen-containing functional groups (like silicon oxide), which are known to introduce structural defects into the graphene lattice. This band typically appears in the range of 2720–2740 cm−1 and is attributed to phonon scattering from the oxygen-modified graphene structure. The intensity ratio of the G band to the D band, also known as the I(D)/I(G) ratio, is a useful indicator of the degree of structural disorder in the graphene lattice. A lower ratio indicates a higher degree of structural disorder, which is commonly associated with the presence of oxygen-containing functional groups and defects in the graphene lattice. In Figure 5d, the presence of carbon strains in the form of graphite and graphene through the observation of the D band (1350 cm−1) and G band (1580 cm−1) in the spectra is confirmed. The presence of SiO2 in the GO compound leads to a higher degree of defects in the GO molecules, as evident by the strong intensity of the D and G bands. The peaks at 520 cm−1 and 976 cm−1 ensure the presence of low-intensity SiO2 in the spectra of GO@SiO2. This attributes low concentration of SiO2.
The nano-additives are mixed in the lubricant and first stirred manually for 15 min, then homogenized using the ultrasonic homogenizer for 30 min. The surfactant is not used along with the nano-additives, so it becomes crucial to check their sedimentation rate. The sedimentation effect was checked by observing for 24 h (the 24 h scale is chosen according to AGMA9005-F16 guidance). Figure 6 confirms the dispersion stability of the lower percentage of the graphene.

2.3.2. Experimental Design for the Tribological Performance of Nano-Additives Doped in Lubricant

Lubricity Tester: The lubricity tester test setup is used to evaluate the tribological performance of the nano-additives. The schematic diagram of the lubricity tester, non-conformal block on disk, and photographs of the lubricity tester are shown in Figure 7.
The test setup, shown in Figure 7, engages a flat EN24 steel block of 12 mm × 12 mm × 12 mm on a 15 mm thick hardened steel disk of diameter 40 mm. This disk is driven by the induction motor and remains partially immersed in the lubricant tank. The lubricant inside the tank was maintained at 40 °C with the help of an inbuilt heater and thermal cut-off switch. The static load is applied on the platform on which the block is fixed. The test specification is given in Table 2.
To simulate the torque (50 Nm) and speed (483 mm/s) conditions of the actual gearbox test, the equivalent load against the mean contact pressure and speed equivalent to the peripheral velocity of both gears at the pitch point are considered. These values are utilized to find the pressure variation along the gear tooth profile and peripheral velocities by solving the analytical relations for the peripheral velocities and contact pressure using MatLab2022b (institute license). The theoretical values of peripheral velocities and contact pressure are shown in Figure 8.
The equivalent speed and force are calculated following the process described by Kleemola et al. [74]. The equivalent speed can be calculated using the peripheral velocity at pitch point (483.52 mm/s), so the equivalent relative rotational speed of the block is determined as below:
N = ( V r ) × 60 2 π = 483.52 × 60 20 × 2 × π = 230.86   rpm
where ‘N’ is the speed in rpm, ‘V’ is the peripheral velocity (mm/s), and ‘r’ is the radius of the disk (counter surface) (mm). As the block is difficult to rotate, the disc was rotated at 231 rpm to create a relative rotational speed between the disc and the block.
The load is calculated using the mean contact pressure of “436.36 MPa” considering the contact of the cylinder on a flat plat and equation of the pressure equation given by Hirani [75]:
P m e a n = 2 F π L b = 2 F π L 4 F E * π L R *
F = P m e a n × π × L × b 2 = 105.2 N = 10.73   kg
where ‘Pmean’ is mean pressure on the gear tooth, ‘F’ is acted force in N, ‘L’ is the length of the block (mm), ‘b’ is semi-Hertzian contact width (mm), ‘E*’ is equivalent Young’s modulus (in this steel case is 2.07 × 10⁵ MPa), ‘R*’ is an equivalent radius.

2.3.3. Orthogonal Array Design and Optimisation of the Concentration of Nano-Additives

Initially, three nano-additives—graphite, graphene, and “graphene oxide functionalized with silicon oxide (GO@SiO2)”—have been selected to enhance the service life of the lubricants and reduce wear for the gear applications. A preliminary study (two levels of each nano-additives) was conducted using L8 orthogonal array to estimate the performance and interaction among nano-additives. Table 3 shows the selected variables and their levels. In the literature, a considerable variation is found for the concentration of the nano-additive mixed in the lubricant (graphite 0.1 % w/w to 6% w/w [44,66]; graphene 0.1% w/w to 4% w/w [45] and GO@SiO2 0.03% to 0.5% [46]), so based on the literature, the values of these additives stayed in between those values.
The L8 (27) orthogonal array used for the wear analysis is shown in Table A1 (see Appendix A), along with interactions. The second, third, and fourth columns are assigned to variables, such as nano-additives (graphite, graphene, and GO@SiO2, respectively) mixed in the lubricant and remain to their interactions.
The parameters selected for the wear analysis are shown in Table 2. The wear analysis is performed on the lubricity tester (see Figure 7b), in which the block (test specimen) is loaded against the disk (counter surface). Before starting the experiment, the test specimen was installed in the holder and pressed under the vertical load. Before and after the experiment, the weight of each specimen was checked using a weighing balance with the least count of 0.00001 g.
The experimental variables, their levels, and the results of conducted experiments on the wear mass are presented in Table 4. The F-value evaluated the model terms with a 95% confidence level.
The analysis of variance (ANOVA) was used to test the suitability of the selected nano-additives. The results of ANOVA and the percentage contribution of the process variables to wear loss are listed in Table 5. The ‘F’ values and percentage contribution indicate the importance of the variables to wear loss. The steps followed in ANOVA are [76]:
Step 1: Total of all responses (see Table 4 for responses)
T = R1 + R2 + R3 + … + R8
where ‘R’ is the number of responses corresponding to the trial experiment
Step 2: Correction factor:
C.F. = T2/n
where n = total number of trials or experiments, ‘8′
Step 3: Total sum of squares (ST)
S T = i = 1 8 R 2 C . F .
Step 4: Factor sum of squares (S)
S j = i = 1 m j m 2 N j m C . F .
j = A, B, C, A × B, A × C, B × C
N j m = total number of experiments where a particular factor is present (see Table 4)
S e r r o r = S T s u m ( S j )
Step 5: Total and factor degree of freedom (DOF)
DOF for factor = No. of Levels − 1
DOF for array = No. of trials − 1
DOF of error = DOF for array − sum (DOF of Factors and Interactions)
Step 6: mean square variance (V)
V = (Sum of square of factor/interaction)/(DOF of factor/interaction)
Step 7: Percentage contribution:
% Contribution = (Sum of square of factor/ interaction)/ST
Step 8: F ratios
F = V of factor/V error
Based on the ANOVA analysis, it can be seen from Table 5 that graphene is the most minor contributor in reducing wear, and GO@SiO2 is the largest contributor. However, before concluding that GO@SiO2 is the best nano-additive, it was decided to experiment with the graphite and GO@SiO2 using L16 (four levels of the selected nano-additives) orthogonal array (see Appendix A, Table A2 for the factors and their interactions). Table 6 presents the experimental plan for the L16 array for four levels of the selected nano-additives. Table 6 shows that the minimum wear mass loss (50 µg) takes place in experiment number 7 for a combination of nano-additive “graphite:0.125% w/w and GO@SiO2: 0.15% w/w”. Furthermore, this optimum concentration was selected for the experiments on the gearbox test rig to prove the enhancement of gear lubricant oil.
The aged oil doped with the optimized concentration of the nano-additives is used for the test in the gear test rig. The test specifications are given in Table 1. The samples collected every 10 min are processed for the pH calculation, and a decreasing trend (Figure 9) is observed. The pH value shows a variation of 65.29 %.
Further, the comparison of the three-test ATR-FTIR spectra (Figure 10) showed that with gear operation under lubricated conditions, the presence of moisture increases (3410 cm−1) in Case 1 and Case 2. The moisture is not present in Case 3 as the nano-additives consume the moisture accumulated during gear operation. The oxidation products (723 cm−1, 1720–1732 cm−1) remain present in all tests, while glycol (879–880 cm−1) and aromatic compound formation (1220 cm−1) are present in Case 1 and Case 2 only. It confirms that nano-additives work effectively and slow down the aging of the lubricant.
The detailed ATR-FTIR analysis of the nano-additive-mixed lubricant is performed to observe the overall effect of the nano-additives. The gear oils are mainly composed of base oil (mineral or synthetic) and additives (anti-wear, extreme pressure, etc.). The different peaks and the baseline of the ATR-FTIR provide information about the compounds in the gear oil. Table A3 (see Appendix A) details the corresponding ATR-FTIR peaks and possible compounds.
The ATR-FTIR curves of the gear oil under different conditions, such as fresh oil, oil mixed with aqueous HCl, and chemically degraded oil mixed with nano-additives, are shown in Figure 11. The spectra results indicate that the gear oil is mineral-based and has a long-chain alkane (723 cm−1). The peaks corresponding to the OH (3410 cm−1), C=O (900–1800 cm−1) stretches appear, indicating the presence of secondary products like ketones, aldehydes, carboxylic acid, esters, and alcohols. The intensity at 1380 cm−1 indicates the existence of the –CH3 group in gear oil. The bend corresponding to 2850 cm−1 and 2920 cm−1 is assigned to the stretching of the –CH2 group presence in oil. The peak corresponding to 1300 cm−1 is attributed to the H–O–H bending; it indicates the absorption of the hydroxyl group into a carboxylic acid (confirming the acidification of the oil). The baseline shift of about 2000 cm−1 confirms the presence of the soot in the gear oil. Adding aqueous HCl leads to the soot formation in the gear oil and acidification of the gear oil as an increase in the peak of about 1720–1732 cm−1. The addition of the nano-additives initially decreases the soot component as the baseline shift (2000 cm−1) reaches a value close to that of the fresh oil and decreases the oxide products by about 1720–1732 cm−1. This initial reaction of the nano-additive in chemically degraded oil leads to a lower acidic level and improves the pH value of the gear oil. The increase in the operation time leads to the consumption of the nano-additives, which leads to the deterioration of the baseline and increases the soot level and carbon content (2000–2200 cm−1) in the lubricant. An increase in the soot level and oxide formation with operation time further decreases the pH level and shows an increase in the acidic level. One possible reason for such behavior of nano-additives may be due to their instability as no surfactant is used, and nano-additives may start sedimenting due to agglomeration, etc.

2.4. Effect of Nano-Additive Doped in Lubricant on Spur Gear Wear

A total of three tests were performed on the gear test rig, as mentioned in previous paragraphs and detailed in Table 1. The wear mass, Fe PPM, and ferrous and nonferrous particle count were measured online for all three tests. Various “30 mL” samples under different operating conditions were collected and processed for the pH measurement and ATR-FTIR analysis.

Online Wear Debris Analysis

The online Fe PPM and wear mass are measured with the help of an online sensor suite (ANALEXrs) (Parker Kittiwake, Littlehampton, West Sussex, UK) and wear debris metallic sensor (Parker Kittiwake made: AS-19144-KW)( (Parker Kittiwake, Littlehampton, West Sussex, UK)) ). Figure 12 shows the distribution of the Fe PPM and wear mass (µg); it can be observed from Figure 12 that the wear rate increases as the lubricant is degraded in the presence of aqueous HCl and increases the wear mass from a value of 66,769 µg to 73,969 µg and Fe PPM from a minimum value of 2149 to 8875. The addition of nano-additives in degraded oil shows a decrease in wear mass loss from 73,969 µg to 61,769 µg and Fe PPM from 8875 to 6096. Further, the particle size distribution (Figure 13) is observed with respect to the effect of nano-additives. It is observed that the dominating contributor in the wear is particle size > 100 µm for test 1 (Case 1: without aqueous HCL) and test 2 (Case 2: with aqueous HCl), but the main contributor in the wear for test 3 is particle size > 60 µm (Case3: aqueous HCl-mixed + nano-additive). It may be due to the action of a small percentage (total 0.4%) of the nano-additives. The nano-additives absorb moisture and form a thin layer on the contacting surface. By action of rolling/sliding (for mechanism, see Figure A3 in the Appendix A), the nano-additives reduce the wear of the gear surface.

3. Conclusions:

In the current study, the impact of nano-additives to combat the effect of degraded lubricant on the wear of the gearbox was investigated. The following conclusions are drawn:
  • The time-lapse as well as mechanical shearing led to a decrease in the pH value and an increase in the lubricant’s TAN value. Significant variation in the pH value (~218%) of “lubricant doped with aqueous HCl” due to mechanical shearing was observed.
  • Controlled artificial aging of lubricant was achieved through doping with an insignificant quantity of aqueous HCl, which was confirmed in the form of oxides (723 cm−1, 1720–1732 cm−1), glycol (879–880 cm−1), aromatic compound formation (1220 cm−1), and water ingress (3410 cm−1). A correlation between aging time and % aqueous HCl was established.
  • A set of experiments on the lubricity tester for “the simulated torque (50 Nm) and speed (483 m/s) conditions of actual gearbox test” was performed using L16 orthogonal array to determine the optimal concentration of nano-additives. The results from the lubricity tester indicated that the minimum wear under lubrication doped with a mixture of graphite: 0.125% w/w and GO@SiO2: 0.15% w/w.
  • The results obtained from the gearbox setup revealed an overall decrease in the value of the wear mass (by 16.49%) and Fe PPM (by 31.31%) using nano-additives.
In summary, the addition of nano-additives slows down the acidification of the lubricant, improves the pH value, and reduces gear wear. However, the stability of nanoparticles using surfactants will be investigated in future research studies.

Author Contributions

Conceptualization, H.H.; methodology, H.H.; resources, H.H.; supervision, H.H.; writing-editing of the manuscript H.H. and D.J.; data curation, D.J. and K.N.S.; formal analysis, D.J. and K.N.S.; writing—original draft preparation, D.J. and K.N.S. All authors have read and agreed to the published version of the manuscript.

Funding

This research not funded by any agency.

Data Availability Statement

Data can be shared on the request.

Conflicts of Interest

The authors declare no conflict of interest.

Appendix A

Table A1. L8 Orthogonal array with factors and their interactions [76].
Column No.1234567Response
VariablesA × BABC(A × B) × CA × CB × C
Experiment Run
11111111
21112222
31221122
41222211
52121212
62122121
72211221
82212112
Table A2. Experimental plan using L16 (45) orthogonal array [76].
12345
Experiment No.ABA × BA × BA × B
111111
212222
313333
414444
521234
622143
723412
824321
931342
1032431
1133124
1234213
1341423
1442314
1543241
1644132
Table A3. ATR-FTIR peaks and their corresponding functional groups.
Wave Number (cm−1)Functional Group
#1723C–H bending, oxidation, fuel
#2879–880C–H bending, Glycol
#31050–1090C=C bending, sulphate
#41220C=C stretching, phosphorous
#51300–1380H–O–H bending, C–C bending, additives
#61460C–H bending, additives
#71720Oxidation
#81732Oxidative products
#92000Soot/ sludge, carbon content
#102200Soot/ sludge, carbo content
#112850C–H stretching alkyl chain
#122920C–H stretching of CH3
#133410Water
Figure A1. The effect of different aqueous HCl concentrations on gear lubricants.
Lubricants 11 00051 g0a1
Figure A2. The effect of nano-additives on the aqueous HCl-doped gear lubricants.
Lubricants 11 00051 g0a2
Figure A3. Lubrication mechanism for (a) without aqueous HCl, a perfect layer of lubricant is formed, (b) aqueous HCl damage the lubricant layer, and (c) the damaged lubricant layer is partially repaired by the combined action of graphite (activated in shear) and GO@SiO2 (head is spherical attached to the surface and provide rolling).
Lubricants 11 00051 g0a3

References

  1. Hirani, H.; Athre, K.; Biswas, S. Comprehensive design methodology for an engine journal bearing. Proc. Inst. Mech. Eng. Part J J. Eng. Tribol. 2000, 214, 401–412. [Google Scholar] [CrossRef]
  2. Ribeiro, F.C.; Oliveira, A.S.; Araujo, A.; Marinho, W.; Schneider, M.P.; Pinto, L.; Gomes, A.A. Detection oxidative degradation in lubricating oil under storage conditions using digital images and chemometrics. Microchem. J. 2019, 147, 622–627. [Google Scholar] [CrossRef]
  3. ANSI/AGMA 9005-F16. Industrial Gear Lubrication. 2016. Available online: https://www.scribd.com/document/527146091/Ansi-Agma-9005-f16-Gear-Oils (accessed on 10 December 2022).
  4. Gosvami, N.N.; Bares, J.A.; Mangolini, F.; Konicek, A.R.; Yablon, D.G.; Carpick, R.W. Mechanisms of anti-wear tribofilm growth revealed in situ by single-asperity sliding contacts. Science 2015, 348, 102–106. [Google Scholar] [CrossRef] [Green Version]
  5. Minami, I. Molecular science of lubricant additives. Appl. Sci. 2017, 7, 445. [Google Scholar] [CrossRef] [Green Version]
  6. Naveed, T.; Zahid, R.; Mufti, R.A.; Waqas, M.; Hanif, M.T. A review on tribological performance of ionic liquids as additives to bio lubricants. Proc. Inst. Mech. Eng. Part J J. Eng. Tribol. 2021, 235, 1782–1806. [Google Scholar] [CrossRef]
  7. Bhaumik, S.; Kamaraj, M.; Paleu, V. Tribological analyses of a new optimized gearbox biodegradable lubricant blended with reduced graphene oxide nanoparticles. Proc. Inst. Mech. Eng. Part J J. Eng. Tribol. 2021, 235, 901–915. [Google Scholar] [CrossRef]
  8. Rezasoltani, A.; Khonsari, M.M. Experimental investigation of the chemical degradation of lubricating grease from an energy point of view. Tribol. Int. 2019, 137, 289–302. [Google Scholar] [CrossRef]
  9. Hirani, H.; Athre, K.; Biswas, S. Lubricant shear thinning analysis of engine journal bearings. Tribol. Trans. 2001, 44, 125–131. [Google Scholar] [CrossRef]
  10. Singh, A.; Gandra, R.T.; Schneider, E.W.; Biswas, S.K. Lubricant degradation and related wear of a steel pin in lubricated sliding against a steel disc. ACS Appl. Mater. Interfaces 2011, 3, 2512–2521. [Google Scholar] [CrossRef]
  11. Zzeyani, S.; Mikou, M.; Naja, J.; Elachhab, A. Spectroscopic analysis of synthetic lubricating oil. Tribol. Int. 2017, 114, 27–32. [Google Scholar] [CrossRef]
  12. Zeng, Q.; Dong, G.; Yang, Y.; Wu, T. Performance deterioration analysis of the used gear oil. Adv. Chem. Eng. Sci. 2016, 6, 67. [Google Scholar] [CrossRef] [Green Version]
  13. Das, R.; Bej, S.; Hirani, H.; Banerjee, P. Trace-level humidity sensing from commercial organic solvents and food products by an AIE/ESIPT-triggered piezochromic luminogen and ppb-level “OFF–ON–OFF” sensing of Cu2+: A combined experimental and theoretical outcome. ACS Omega 2021, 6, 14104–14121. [Google Scholar] [CrossRef] [PubMed]
  14. Cantley, R.E. The effect of water in lubricating oil on bearing fatigue life. ASLE Trans. 1977, 20, 244–248. [Google Scholar] [CrossRef]
  15. Sengupta, S.; Murmu, M.; Mandal, S.; Hirani, H.; Banerjee, P. Competitive corrosion inhibition performance of alkyl/acyl substituted 2-(2-hydroxybenzylideneamino) phenol protecting mild steel used in adverse acidic medium: A dual approach analysis using FMOs/molecular dynamics simulation corroborated experimental findings. Colloids Surf. A Physicochem. Eng. Asp. 2021, 617, 126314. [Google Scholar] [CrossRef]
  16. Idros, M.M.; Ali, S.; Islam, M.S. Optical analysis for condition based monitoring of oxidation degradation in lubricant oil. In Proceedings of the 2012 4th International Conference on Intelligent and Advanced Systems (ICIAS2012), Kuala Lumpur, Malaysia, 12–14 June 2012; IEEE: New York, NY, USA, 2012; Volume 2, pp. 735–740. [Google Scholar] [CrossRef]
  17. Mujahid, A.; Dickert, F.L. Monitoring automotive oil degradation: Analytical tools and onboard sensing technologies. Anal. Bioanal. Chem. 2012, 404, 1197–1209. [Google Scholar] [CrossRef]
  18. Santos, J.; Lima, L.; Santos, I.; Souza, A. Thermal, spectroscopic and rheological study of mineral base lubricating oils. J. Therm. Anal. Calorim. 2007, 87, 639–643. [Google Scholar] [CrossRef]
  19. De Rivas, B.L.; Vivancos, J.L.; Ordieres-Meré, J.; Capuz-Rizo, S.F. Determination of the total acid number (TAN) of used mineral oils in aviation engines by FTIR using regression models. Chemom. Intell. Lab. Syst. 2017, 160, 32–39. [Google Scholar] [CrossRef] [Green Version]
  20. Rezasoltani, A.; Khonsari, M.M. On monitoring physical and chemical degradation and life estimation models for lubricating greases. Lubricants 2016, 4, 34. [Google Scholar] [CrossRef] [Green Version]
  21. Cao, W.; Yan, J.; Jin, Z.; Han, Z.; Zhang, H.; Qu, J.; Zhang, M. Image Denoising and Feature Extraction of Wear Debris for Online Monitoring of Planetary Gearboxes. IEEE Access 2021, 9, 168937–168952. [Google Scholar] [CrossRef]
  22. Cao, W.; Zhang, H.; Wang, N.; Wang, H.W.; Peng, Z.X. The gearbox wears state monitoring and evaluation based on online wear debris features. Wear 2019, 426, 1719–1728. [Google Scholar] [CrossRef]
  23. Wang, S.; Wu, T.H.; Shao, T.; Peng, Z.X. Integrated model of BP neural network and CNN algorithm for automatic wear debris classification. Wear 2019, 426, 1761–1770. [Google Scholar] [CrossRef]
  24. Peng, Y.; Wu, T.; Wang, S.; Peng, Z. Wear state identification using dynamic features of wear debris for online purpose. Wear 2017, 376, 1885–1891. [Google Scholar] [CrossRef]
  25. Ikhlef, B.; Rahmoune, C.; Toufik, B.; Benazzouz, D. Gearboxes fault detection under operation varying condition based on MODWPT, Ant colony optimization algorithm and Random Forest classifier. Advances in Mechanical Engineering 2021, 13. [Google Scholar] [CrossRef]
  26. Hirani, H. Multiobjective optimization of journal bearing using mass conserving and genetic algorithms. Proc. Inst. Mech. Eng. Part J J. Eng. Tribol. 2005, 219, 235–248. [Google Scholar] [CrossRef]
  27. Bartz, W.J. Lubricants and the environment. Tribol. Int. 1998, 31, 35–47. [Google Scholar] [CrossRef]
  28. Freschi, M.; Paniz, A.; Cerqueni, E.; Colella, G.; Dotelli, G. The Twelve Principles of Green Tribology: Studies, Research, and Case Studies—A Brief Anthology. Lubricants 2022, 10, 129. [Google Scholar] [CrossRef]
  29. Mannekote, J.K.; Kailas, S.V.; Venkatesh, K.; Kathyayini, N. Environmentally friendly functional fluids from renewable and sustainable sources—A review. Renew. Sustain. Energy Rev. 2018, 81, 1787–1801. [Google Scholar] [CrossRef]
  30. Havet, L.; Blouet, J.; Valloire, F.R.; Brasseur, E.; Slomka, D. Tribological characteristics of some environmentally friendly lubricants. Wear 2001, 248, 140–146. [Google Scholar] [CrossRef]
  31. De Feo, M.; Minfray, C.; Bouchet MD, B.; Thiebaut, B.; Le Mogne, T.; Vacher, B.; Martin, J.M. Aging impact on tribological properties of MoDTC-containing base oil. Tribol. Int. 2015, 92, 126–135. [Google Scholar] [CrossRef]
  32. Cen, H.; Morina, A.; Neville, A. Effect of lubricant aging on lubricants’ physical and chemical properties and tribological performance; Part I: Effect of lubricant chemistry. Ind. Lubr. Tribol. 2018, 70, 385–392. [Google Scholar] [CrossRef]
  33. Nagy, A.L.; Rohde-Brandenburger, J.; Zsoldos, I. Artificial aging experiments of neat and contaminated engine oil samples. Lubricants 2021, 9, 63. [Google Scholar] [CrossRef]
  34. Seidel, B.; Meyer, D. Influence of artificial aging on the lubricating ability of water miscible metalworking fluids. Prod. Eng. 2019, 13, 425–435. [Google Scholar] [CrossRef]
  35. Gupta, B.; Kumar, N.; Titovich, K.A.; Ivanovich, K.V.; Vyacheslavovich, S.A.; Dash, S. Lubrication properties of chemically aged reduced graphene-oxide additives. Surf. Interfaces 2017, 7, 6–13. [Google Scholar] [CrossRef]
  36. Zhang, J.; Tang, C.; Qiu, Q.; Yang, L. Effect of water on the diffusion of small molecular weight acids in nano-SiO2 modified insulating oil. J. Mol. Liq. 2020, 314, 113670. [Google Scholar] [CrossRef]
  37. Dong, J. Quantitative Condition Monitoring of Lubricating Oils by Fourier Transform Infrared (FTIR) Spectroscopy. Ph.D. Thesis, McGill University, Montréal, QC, Canada, 2000. [Google Scholar]
  38. Chin˜as-Castillo, F.; Spikes, H.A. Mechanism of action of colloidal solid dispersions. J. Tribol. 2003, 125, 552–557. [Google Scholar] [CrossRef]
  39. Zhao, J.; Yang, G.; Zhang, C.; Zhang, Y.; Zhang, S.; Zhang, P. Synthesis of water-soluble Cu nanoparticles and evaluation of their tribological properties and thermal conductivity as a water-based additive. Friction 2019, 7, 246–259. [Google Scholar] [CrossRef] [Green Version]
  40. Zhao, J.; Yang, G.; Zhang, Y.; Zhang, S.; Zhang, C.; Gao, C.; Zhang, P. Controllable synthesis of different morphologies of CuO nanostructures for tribological evaluation as water-based lubricant additives. Friction 2021, 9, 963–977. [Google Scholar] [CrossRef]
  41. Shahnazar, S.; Bagheri, S.; Abd Hamid, S.B. Enhancing lubricant properties by nanoparticle additives. Int. J. Hydrogen Energy 2016, 41, 3153–3170. [Google Scholar] [CrossRef]
  42. Zhmud, B.; Pasalskiy, B. Nanomaterials in lubricants: An industrial perspective on current research. Lubricants 2013, 1, 95–101. [Google Scholar] [CrossRef]
  43. Bai, M.J.; Liu, J.L.; He, J.; Li, W.J.; Wei, J.J.; Chen, L.X.; Miao, J.Y.; Li, C.M. Heat transfer and mechanical friction reduction properties of graphene oxide nanofluids. Diam. Relat. Mater. 2020, 108, 107982. [Google Scholar] [CrossRef]
  44. Zhamu, A.; Jang, B.Z. Nano Graphene-Modified Lubricant. U.S. Patent 8,222,190, 17 July 2012. [Google Scholar]
  45. Guo, P.; Chen, L.; Wang, J.; Geng, Z.; Lu, Z.; Zhang, G. Enhanced tribological performance of aminated nano-silica modified graphene oxide as water-based lubricant additive. ACS Appl. Nano Mater. 2018, 1, 6444–6453. [Google Scholar] [CrossRef]
  46. Bao, Y.Y.; Sun, J.L.; Kong, L.H. Tribological properties and lubricating mechanism of SiO2 nanoparticles in water-based fluid. IOP Conf. Ser. Mater. Sci. Eng. 2017, 182, 012025. [Google Scholar] [CrossRef] [Green Version]
  47. Kong, L.; Sun, J.; Bao, Y. Preparation, characterization and tribological mechanism of nanofluids. RSC Adv. 2017, 7, 12599–12609. [Google Scholar] [CrossRef] [Green Version]
  48. Liu, Y.; Ge, X.; Li, J. Graphene lubrication. Appl. Mater. Today 2020, 20, 100662. [Google Scholar] [CrossRef]
  49. Goilkar, S.S.; Hirani, H.A.R.I.S.H. Tribological characterization of carbon graphite secondary seal. Indian J. Tribol. 2009, 4, 1–6. [Google Scholar]
  50. Paul, G.; Hirani, H.; Kuila, T.; Murmu, N.C. Nanolubricants dispersed with graphene and its derivatives: An assessment and review of the tribological performance. Nanoscale 2019, 11, 3458–3483. [Google Scholar] [CrossRef] [PubMed]
  51. Goilkar, S.S.; Hirani, H. Parametric study on balance ratio of mechanical face seal in steam environment. Tribol. Int. 2010, 43, 1180–1185. [Google Scholar] [CrossRef]
  52. Goilkar, S.S.; Hirani, H. Design and development of a test setup for online wear monitoring of mechanical face seals using a torque sensor. Tribol. Trans. 2008, 52, 47–58. [Google Scholar] [CrossRef]
  53. Singh, A.; Chauhan, P.; Mamatha, T.G. A review on tribological performance of lubricants with nanoparticles additives. Mater. Today Proc. 2020, 25, 586–591. [Google Scholar] [CrossRef]
  54. Patel, J.; Pereira, G.; Irvine, D.; Kiani, A. Friction and wear properties of base oil enhanced by different forms of reduced graphene. AIP Adv. 2019, 9, 045011. [Google Scholar] [CrossRef]
  55. Xie, H.; Dang, S.; Jiang, B.; Xiang, L.; Zhou, S.; Sheng, H.; Yang, T.; Pan, F. Tribological performances of SiO2/graphene combinations as water-based lubricant additives for magnesium alloy rolling. Appl. Surf. Sci. 2019, 475, 847–856. [Google Scholar] [CrossRef]
  56. Ali, I.; Kucherova, A.; Memetov, N.; Pasko, T.; Ovchinnikov, K.; Pershin, V.; Kuznetsov, D.; Galunin, E.; Grachev, V.; Tkachev, A. Advances in carbon nanomaterials as lubricants modifiers. J. Mol. Liq. 2019, 279, 251–266. [Google Scholar] [CrossRef]
  57. Patel, J.; Kiani, A. Effects of reduced graphene oxide (rGO) at different concentrations on tribological properties of liquid base lubricants. Lubricants 2019, 7, 11. [Google Scholar] [CrossRef] [Green Version]
  58. Thampi, A.D.; Prasanth, M.A.; Anandu, A.P.; Sneha, E.; Sasidharan, B.; Rani, S. The effect of nanoparticle additives on the tribological properties of various lubricating oils–Review. Mater. Today Proc. 2021, 47, 4919–4924. [Google Scholar] [CrossRef]
  59. He, T.; Chen, N.; Fang, J.; Cai, G.; Wang, J.; Chen, B.; Liang, Q. Micro/Nano Carbon Spheres as Liquid Lubricant Additive: Achievements and Prospects. J. Mol. Liq. 2022, 357, 119090. [Google Scholar] [CrossRef]
  60. Rahman, M.M.; Islam, M.; Roy, R.; Younis, H.; AlNahyan, M.; Younes, H. Carbon Nanomaterial-Based Lubricants: Review of Recent Developments. Lubricants 2022, 10, 281. [Google Scholar] [CrossRef]
  61. Morshed, A.; Wu, H.; Jiang, Z. A comprehensive review of water-based nanolubricants. Lubricants 2021, 9, 89. [Google Scholar] [CrossRef]
  62. Marian, M.; Berman, D.; Rota, A.; Jackson, R.L.; Rosenkranz, A. Layered 2D nanomaterials to tailor friction and wear in machine elements—A review. Adv. Mater. Interfaces 2022, 9, 2101622. [Google Scholar] [CrossRef]
  63. Marian, M.; Berman, D.; Nečas, D.; Emani, N.; Ruggiero, A.; Rosenkranz, A. Roadmap for 2D materials in biotribological/biomedical applications–A review. Adv. Colloid Interface Sci. 2022, 307, 102747. [Google Scholar] [CrossRef]
  64. Rosenkranz, A.; Liu, Y.; Yang, L.; Chen, L. 2D nano-materials beyond graphene: From synthesis to tribological studies. Appl. Nanosci. 2020, 10, 3353–3388. [Google Scholar] [CrossRef]
  65. Ashraf, A.; Shafi, W.K.; Ul Haq, M.I.; Raina, A. Dispersion stability of nano additives in lubricating oils–an overview of mechanisms, theories and methodologies. Tribol. -Mater. Surf. Interfaces 2022, 16, 34–56. [Google Scholar] [CrossRef]
  66. Gupta, M.K.; Bijwe, J. A complex interdependence of dispersant in nano-suspensions with varying amount of graphite particles on its stability and tribological performance. Tribol. Int. 2020, 142, 105968. [Google Scholar] [CrossRef]
  67. Chakraborty, S.; Panigrahi, P.K. Stability of nanofluid: A review. Appl. Therm. Eng. 2020, 174, 115259. [Google Scholar] [CrossRef]
  68. Kumar, P.; Hirani, H.; Agrawal, A.K. Online condition monitoring of misaligned meshing gears using wear debris and oil quality sensors. Ind. Lubr. Tribol. 2018, 70/4, 645–655. [Google Scholar] [CrossRef]
  69. Available online: https://chem.libretexts.org/Bookshelves/Physical_and_Theoretical_Chemistry_Textbook_Maps/Supplemental_Modules_(Physical_and_Theoretical_Chemistry)/Acids_and_Bases/Acids_and_Bases_in_Aqueous_Solutions/The_pH_Scale (accessed on 25 December 2022).
  70. Ukpakaa, C.; Farrow, T. Investigating the yield of ethanol using palm wine in CSTR connected in series. Am. J. Sci. Adv. 2015, 1, 1–19. [Google Scholar]
  71. Hao, L.; Hao, W.; Li, P.; Liu, G.; Li, H.; Aljabri, A.; Xie, Z. Friction and wear properties of a nanoscale ionic liquid-like GO@ SiO2 hybrid as a water-based lubricant additive. Lubricants 2022, 10, 125. [Google Scholar] [CrossRef]
  72. Besser, C.; Agocs, A.; Ronai, B.; Ristic, A.; Repka, M.; Jankes, E.; Colin, M.; Dörr, N. Generation of engine oils with defined degree of degradation by means of a large scale artificial alteration method. Tribol. Int. 2019, 132, 39–49. [Google Scholar] [CrossRef]
  73. Mahbubul, I.M.; Chong, T.H.; Khaleduzzaman, S.S.; Shahrul, I.M.; Saidur, R.; Long, B.D.; Amalina, M.A. Effect of ultrasonication duration on colloidal structure and viscosity of alumina–water nanofluid. Ind. Eng. Chem. Res. 2014, 53, 6677–6684. [Google Scholar] [CrossRef]
  74. Kleemola, J.; Lehtovaara, A. Experimental evaluation of friction between contacting discs for the simulation of gear contact. Tribotest 2007, 13, 13–20. [Google Scholar] [CrossRef]
  75. Hirani, H. Fundamentals of Engineering Tribology with Applications; Cambridge University Press: Cambridge, UK, 2016. [Google Scholar]
  76. Roy, K.R. A Primer on Taguchi Method. Society of Manufacturing Engineers: New York, NY, USA, 2010. [Google Scholar]
Figure 1. Variation in pH value during running conditions.
Lubricants 11 00051 g001
Figure 2. The effect of aqueous HCl addition on oil. (a) Oil samples for fresh and aqueous HCl-mixed and (b) ATR-FTIR spectra of fresh and aqueous HCl-mixed (0.0025% v/v) oil.
Lubricants 11 00051 g002
Figure 3. (a) Effect of aqueous HCl concentration on pH value of lubricant and (b) effect of aqueous HCl concentration on aging life of the lubricant.
Lubricants 11 00051 g003
Figure 4. Variation of pH under mechanical shearing for the chemically aged lubricant.
Lubricants 11 00051 g004
Figure 5. SEM images of the nano-additives (a) Graphene, (b) Graphite, (c) GO@SiO2, and (d) the Raman spectra recorded at 532 nm excitation wavelength for the graphite, graphene, and GO@SiO2.
Lubricants 11 00051 g005
Figure 6. Effect of weight concentration on particle sedimentation.
Lubricants 11 00051 g006
Figure 7. (a) Lubricity tester schematic diagram and (b) Lubricity tester test setup.
Lubricants 11 00051 g007
Figure 8. Theoretically estimated (a) peripheral velocities and (b) contact pressure for gear at “50 Nm” applied torque and “483.52 mm/s”.
Lubricants 11 00051 g008
Figure 9. Variation in pH value of the aged lubricant doped with nano-additives.
Lubricants 11 00051 g009
Figure 10. ATR-FTIR spectra of the three tests Case 1 (fresh oil), Case 2 (0.0025% v/v aqueous HCl mixed oil), and Case 3 (0.0025% v/v aqueous HCl-mixed + nano-additive-mixed oil).
Lubricants 11 00051 g010
Figure 11. ATR-FTIR of test 3 (0.0025% v/v aqueous HCl + nano-additives) for every 10 min and compared with fresh oil and fresh oil mixed with 0.0025% v/v aqueous HCl.
Lubricants 11 00051 g011
Figure 12. Distribution of Fe PPM and wear mass for test 1 (without aqueous HCl), test 2 (with 0.0025% v/v aqueous HCl-mixed), and test 3 (with 0.0025% v/v aqueous HCl mix + nano-additive-mixed).
Lubricants 11 00051 g012
Figure 13. Ferrous particle size distribution for test 1 (without aqueous HCl), test 2 (with 0.0025% v/v aqueous HCl-mixed), and test 3 (with 0.0025% v/v aqueous HCl mix + nano-additive-mixed).
Lubricants 11 00051 g013
Table 1. Test Specification for the gearbox test rig.
ParameterPinionGear
MaterialEN24EN24
Hardness (HRC)29 ± 129 ± 1
Module (mm)22
Pitch circle diameter (mm)54106
Number of teeth2753
Speed (rpm)500-
Torque (Nm)-50
Roughness (µm) (Ra)0.363 ± 0.0270.357 ± 0.037
Roughness (µm) (Rq)0.579 ± 0.0660.556 ± 0.095
Youngs Modulus (GPa)207207
LubricantAPI GL4-EP90
Nano-additives usedGraphite, GO@SiO2
Case 1Without aqueous HCl mix
Case 2With 0.0025% v/v aqueous HCl mix
Case 3With 0.0025% v/v aqueous HCl mix + graphite (0.125% w/w) + GO@SiO2 (0.15% w/w)
Table 2. Parameters and their levels for wear analysis.
ParametersLevels
Test sampleEN24 with 56 ± 1 HRC
Roughness (µm)Ra: 0.1817 ± 0.05
Rq: 0.3615 ± 0.119
Load (kg)10.73
Time (s)3600
Speed (rpm)231
LubricantAPI GL4-EP90 + 0.0025% Aqueous HCl mix
Nano-additives (for L8)Graphite, Graphene, GO@SiO2 (Two levels each)
Nano-additives (for L16)Graphite, GO@SiO2 (Four levels each)
Table 3. Variables and their levels for wear analysis.
VariablesSymbolLevels
12
GraphiteA00.5% w/w
GrapheneB00.5% w/w
GO@SiO2C00.15% w/w
Table 4. Experimental plan for wear analysis with the response using L8 orthogonal array.
Experiment No.Graphite (in wt%)Graphene (in wt%)GO@SiO2 (in wt%)Wear Volume (m3) (Mean ± Std)
10002.82 × 10−11 ± 2.56 × 10⁻¹²
2000.158.97 × 10−12 ± 1.28 × 10⁻¹²
30.50.502.18 × 10−11 ± 1.28 × 10⁻¹²
40.50.50.151.41 × 10−11 ± 2.56 × 10⁻¹²
500.501.79 × 10−11 ± 2.56 × 10⁻¹²
600.50.151.41 × 10−11 ± 1.28 × 10⁻¹²
70.5001.67 × 10−11 ± 2.56 × 10⁻¹²
80.500.151.15 × 10−11 ± 1.28 × 10⁻¹²
Table 5. ANOVA for wear analysis (first-stage experiments (L8)).
VariablesCodeDegree of Freedom (DOF)Sum of Squares (S)Variance (Mean Squares) (V)Variance Ratio (F)Percentage Contribution
GraphiteA12002000.081.26
GrapheneB150500.020.31
GO@SiO2C198009800462.02
A × B 1125012500.517.91
A × C 18008000.325.06
B × C 1125012500.517.91
Error 124502450 15.05
Total 715,800 100
Table 6. Experimental plan using L16 orthogonal array for wear analysis.
Experiment No.Graphite (in wt%)GO@SiO2 (in wt%)Wear Volume (m3) (Mean ± Std)
1002.82 × 10−11 ± 2.56 × 10⁻¹²
200.0752.05 × 10−11 ± 2.56 × 10⁻¹²
300.158.97 × 10−12 ± 1.28 × 10⁻¹²
400.2257.69 × 10−12 ± 2.56 × 10⁻¹²
50.12502.18 × 10−11 ± 1.28 × 10⁻¹²
60.1250.0758.97 × 10−12 ± 1.28 × 10⁻¹²
70.1250.156.41 × 10−12 ± 2.56 × 10⁻¹²
80.1250.2251.15 × 10−11 ± 1.28 × 10⁻¹²
90.2501.15 × 10−11 ± 1.28 × 10⁻¹²
100.250.0757.69 × 10−12 ± 2.56 × 10⁻¹²
110.250.151.15 × 10−11 ± 1.28 × 10⁻¹²
120.250.2251.54 × 10−11 ± 2.56 × 10⁻¹²
130.501.67 × 10−11 ± 2.56 × 10⁻¹²
140.50.0751.03 × 10−11 ± 2.56 × 10⁻¹²
150.50.151.15 × 10−11 ± 1.28 × 10⁻¹²
160.50.2251.92 × 10−11 ± 2.56 × 10⁻¹²
Disclaimer/Publisher’s Note: The statements, opinions and data contained in all publications are solely those of the individual author(s) and contributor(s) and not of MDPI and/or the editor(s). MDPI and/or the editor(s) disclaim responsibility for any injury to people or property resulting from any ideas, methods, instructions or products referred to in the content.

