Article

Phase Structure, Microstructure, Corrosion, and Wear Resistance of Al0.8CrFeCoNiCu0.5 High-Entropy Alloy

1
School of Mechanical and Vehicle Engineering, West Anhui University, Luan 237010, China
2
Key Laboratory of Materials Physics, Institute of Solid State Physics, Chinese Academy of Sciences, Hefei 230031, China
*
Authors to whom correspondence should be addressed.
Lubricants 2023, 11(9), 358; https://doi.org/10.3390/lubricants11090358
Submission received: 13 July 2023 / Revised: 4 August 2023 / Accepted: 9 August 2023 / Published: 23 August 2023
(This article belongs to the Special Issue Wear and Corrosion Behaviour of Metals and Alloys)

Abstract

:
This study investigates the structure and corrosion behavior of the Al0.8CrFeCoNiCu0.5 high-entropy alloy prepared using non-consumable vacuum arc melting. XRD analysis identified BCC1 and BCC2 phases corresponding to (Fe-Cr) and Al-Ni, respectively, while the FCC phase aligned with Cu. SEM and EBSD observations confirmed an equiaxed grain structure with fishbone-like morphology at grain boundaries and modulated structures within the grains. The alloy exhibited minimal residual stress and strain. The alloy demonstrated a preferred orientation of grain growth along the <001> direction. Electrochemical testing in a 3.5% NaCl solution revealed a corrosion potential of −0.332 V and a corrosion current density of 2.61 × 10⁻⁶ A/cm2. The intergranular corrosion regions exhibited significant depletion of Al and Cu elements, with the corrosion products primarily consisting of Al and Cu. Al and Cu elements are susceptible to corrosion. The wear scar width of Al0.8CrFeCoNiCu0.5 high-entropy alloy is 1.65 mm, which is less than 45# steel, and high-entropy alloy has more excellent wear resistance. Given its unique attributes, this high-entropy alloy could find potential applications in high-end manufacturing industries such as the aerospace engineering, the defense industry, energy production, and chemical processing where high corrosion resistance and wear resilience are crucial.

1. Introduction

With the ongoing development of modern industry, the demand for material performance has been steadily increasing. The dominant design philosophy in metal materials relies on one or two metal elements as the primary constituents, adding small amounts of modified elements to regulate material performance. However, this single-principal-element design concept has certain limitations in terms of the scope of material design. In 2004, Yeh et al. [1] introduced a “multi-principal-element alloy” material design concept named high-entropy alloy. This concept proposes the use of a mixture of multiple elements, each accounting for 5% to 35% of the whole, breaking through the conventional understanding that multi-principal-element alloys tend to form complex and brittle intermetallic compounds and instead create single-phase solid solutions. The definition of high-entropy alloy has evolved from the initial conception of an alloy composed of five or more elements in equal or nearly equal atomic ratios to the realization that alloys with four elements can also possess high-entropy effects [2,3,4,5,6,7]. As research deepens, this definition continues to be updated and refined [8,9,10]. Due to its thermodynamic high-entropy effects, kinetic sluggish diffusion effects, and crystallographic distortion effects, high-entropy alloys exhibit a range of excellent properties such as high strength, high hardness, high wear resistance, high corrosion resistance, and good resistance to annealing softening [11,12,13,14,15,16]. This provides a valuable supplement to the material design system and has attracted widespread attention in materials research [17].
High-entropy alloys can be divided into transitional high-entropy alloys and refractory high-entropy alloys. In a study of the microstructure of an equiatomic quinary TiVZrMoW refractory high-entropy alloy, Pandey et al. [18] found that the alloy comprises two types of body-centered cubic (BCC) phases and a minor amount of ordered B2 and C15 type Laves phases. The BCC1 phase is enriched with Mo and W, whereas the BCC2 phase is dominated by Zr and Ti. When annealed, the alloy transitions from the disordered BCC phase to the ordered B2 phase, and an increase in the quantity of the C15 Laves phase is observed. In the transitional high-entropy alloy systems, the face-centered cubic (FCC) structure of CoCrFeMnNi and the body-centered cubic (BCC) structure of AlCoCrFeNi stand as two primary research subjects [19,20,21,22,23]. Extensive studies have been conducted on the microstructure and corrosion resistance of high-entropy alloys comprising the Fe-Co-Ni-Cr element system. Kao et al. [24] examined the corrosion behavior of AlxCoCrFeNi high-entropy alloys with varying Al content. Through dynamic potential polarization curve tests, it was found that all alloy compositions exhibited noticeable passivation zones in an H2SO4 solution, with passivation current density increasing along with Al content. Weight loss tests conducted in H2SO4 solution indicated a rising mass loss rate with increasing Al content. V. Geantă [25] studied the corrosion resistance of AlxCrFeCoNi high-entropy alloys. The effect of aluminum content (x = 1, 1.5, and 2) on corrosion behavior was investigated using polarization resistance testing in a 3.5% NaCl solution. The results showed that increasing aluminum and decreasing chromium content reduced corrosion resistance. Yan et al. [26] studied the influence of Cr content on the corrosion behavior and microstructure of Al0.3CrxFeCoNi high-entropy alloys. For x values between 0 and 1.0, the Al0.3CrxFeCoNi high-entropy alloy showed a single-phase FCC structure. For x values from 1.5 to 2.0, a mixture of FCC and disordered BCC/ordered BCC (B2) phases were observed. Al0.3CrxFeCoNi high-entropy alloys showed self-passivation behavior similar to stainless steel in a 3.5% NaCl solution. With increased Cr content in the alloy, the pitting potential positively shifted, enhancing the resistance to pitting. The Al0.3CrxFeCoNi (x = 1.5–2.0) high-entropy alloy, due to the rich presence of Cr2O3 in the passivation film, demonstrated excellent pitting resistance. Shi et al. [27] investigated the corrosion behavior of AlxCoCrFeNi high-entropy alloys in a 3.5% NaCl solution. They found that as the volume fraction of the Cr-depleted B2 phase increased, there was an increase in corrosion current density and a decrease in the pitting potential. These Cr-depleted B2 phases led to uneven growth of the passivation film, reducing the localized corrosion resistance of AlxCoCrFeNi high-entropy alloys. Dispersed B2 phases increased the occurrence of metastable pitting events, ultimately decreasing the localized corrosion resistance of AlxCoCrFeNi high-entropy alloys.
Although researchers have studied the AlCoCrFeNiCu high-entropy alloy system and found that the addition of Al and Cu can promote the transformation of the alloy towards BCC and FCC phases, the competitive relationship between Al and Cu in phase formation requires further experimental support with different Al and Cu compositions in the AlCoCrFeNiCu high-entropy alloy system. Moreover, no studies have been reported on the as-cast Al0.8CrFeCoNiCu0.5 high-entropy alloy. Therefore, this study aims to investigate the Al0.8CrFeCoNiCu0.5 high-entropy alloy, focusing on its phase structure and microstructure as well as its corrosion resistance in a 3.5% NaCl solution, to reveal the properties of the alloy with specific proportions of Al and Cu. This research will provide a theoretical basis for studying the AlCoCrFeNiCu high-entropy alloy system and offer valuable insights for engineering applications.

2. Materials and Methods

This experiment used a non-consumable vacuum arc melting furnace (X-DHL400) to prepare Al0.8CrFeCoNiCu0.5 high-entropy alloy samples. The nominal composition and ratio of the alloy are shown in Table 1. To ensure the alloy’s purity, elements with a minimum purity of 99.95% (mass fraction) were employed, and accurate weighing was carried out based on the composition design. The melting process was carried out in the vacuum arc melting furnace under argon gas protection. Before melting, Ti blocks were used to eliminate impurities in the furnace atmosphere. Each sample underwent five repeated melting cycles in the furnace to ensure a uniform distribution of elements. In the last two melting cycles, electromagnetic stirring was employed to obtain button-shaped as-cast samples.
The middle part of the samples was selected for microstructural and performance analysis and cut using an electrical discharge cutting machine. The sample surfaces were sequentially polished using sandpaper and then polished on a polishing machine. After achieving a scratch-free mirror-like surface, the samples were etched with aqua regia (2 mL HNO3 + 6 mL HCl + 8 mL ethanol) to observe the microstructure. For electron backscatter diffraction (EBSD) analysis, the samples were mechanically polished, followed by 30 s of electrochemical polishing using a 10% ethanol solution with high chloric acid. The polishing temperature was controlled at −30 °C, with a polishing voltage of 20 V and a current of approximately 0.5 A. After 10 s of polishing, the samples were quickly removed and rinsed with flowing water to remove the etching residue. Finally, they were cleaned with anhydrous ethanol and dried with cold air to obtain EBSD samples with smooth and bright surfaces.
The XRD7000S X-ray diffractometer (XRD) from Shimadzu Corporation, Japan, was utilized to characterize the crystal structure of the alloy. The experimental parameters included a Cu target with Kα radiation (wavelength of 0.154056 nm), an operating voltage of 40 kV, an operating current of 40 mA, a scanning range (2θ) of 20° to 90°, a scan speed of 8°/min, and a step size of 0.02°.
The alloy’s microstructure and composition were characterized using the SU6600 field emission scanning electron microscope (SEM) from Hitachi Corporation, located in Tokyo, Japan, coupled with an energy-dispersive X-ray spectrometer (EDS) Oxford EDS System (UltimMax100).
EBSD analysis was employed to examine the samples’ grain structure and grain orientation distribution. The observation surface was sequentially polished with 400#, 800#, 1500#, and 2500# water sandpaper, and then the EBSD sample was prepared using electrolytic polishing. The electrolytic polishing solution is a mix of 10% acetic acid and 90% perchloric acid. The polishing temperature was controlled at −30 °C, the polishing voltage was set at 20 V, and the polishing current was approximately 0.3 A. After polishing for 60 s, the sample was rapidly removed and the corroded surface was rinsed with running water. It was then cleaned with anhydrous ethanol for the final wash. After drying with cold air, a flat and shiny EBSD sample surface was obtained. The EBSD technique utilized the EBSD Oxford EBSD System (Symmetry) with an electron voltage of 20 kV, a current of 5.6 nA, and a scanning step size of 0.5 μm. The collected EBSD data were analyzed using Aztec software.
The electrochemical workstation (Nova2, Metrohm, Bern, Switzerland) was employed to measure the samples’ potentiodynamic polarization curves and electrochemical impedance spectroscopy (EIS). ZView software was used for data fitting and calculations. The experimental setup involved a three-electrode system, with the sample as the working electrode, a saturated calomel electrode as the reference electrode, and a platinum sheet electrode as the auxiliary electrode.
Before the electrochemical tests, the surface of the working electrode was carefully polished using sandpaper to achieve a smooth and flat surface. For electrochemical assessments, samples were embedded in polyester resin to establish electrical contact, with special precautions taken to prevent any crevice formation. The exposed area was strictly 1.0 cm2. All electrochemical examinations were carried out at 25 °C in a newly prepared 3.5% NaCl solution.
To ensure the accuracy of the results, each test was conducted more than three times. From all the prepared specimens, a set of reproducible samples was chosen. One sample from this set was then selected for further testing and analysis. During the potentiodynamic polarization curve test, the initial and final potentials were set to −0.8 V and 2.3 V, respectively, relative to the saturated calomel electrode, with a scanning rate of 1 mV/s. The open circuit potential (OCP) of the sample was measured and allowed to stabilize for a period of 30 min to ensure system stability. The frequency range for the EIS measurements was set between 100 kHz and 10 MHz, with an amplitude of 10 mV. Upon completion of the corrosion test, the surface morphology of the samples was inspected using a field-emission scanning electron microscope.
The sliding friction wear test was performed on an MM-10000A testing machine under a 200 N load for 20 min at room temperature without lubrication. The sample surface was pre-polished with sandpaper for smoothness and cleaned ultrasonically using ethanol before and after testing.

3. Results and Discussion

3.1. XRD Analysis

The XRD pattern of Al0.8CrFeCoNiCu0.5 high-entropy alloy is shown in Figure 1a, with Figure 1b,c representing the deconvolution of the BCC peaks. In Figure 1b,c, the red, green, and purple lines represent the deconvolution fitting curves for various diffraction peaks Diffraction peaks located at 44.8° and 65.1° are, respectively, attributed to the (110) and (200) planes of the BCC1 phase, which matches with the (Fe, Cr) phase. Peaks appearing at 31.3°, 44.9°, and 65.3° confirm the presence of an ordered BCC2 phase within the alloy, corresponding to the (100), (110), and (200) planes, consistent with the Al-Ni phase [28]. Peaks shown at 43.7°, 50.9°, and 74.7° indicate the FCC phase, which is attributed to the (111), (200), and (220) planes, matching with the Cu phase. These results are in line with previous research on as-cladding Al0.8CrFeCoNiCu0.5 high-entropy alloy [29]. Notably, the diffraction peak of the BCC phase (200) plane exhibits higher intensity than that of the (110) plane. The peak at (200) is the most intense and sharply defined, indicating a high degree of crystallinity. Moreover, it demonstrates a significant textural advantage in the (200) direction, which could be due to more or better ordered grain growth in the (200) direction during the crystal’s growth or processing. This can primarily be attributed to the BCC phase’s preferred orientation along the (200) direction [30].
According to the Gibbs phase rule, a six-element alloy can theoretically form up to seven equilibrium phases and even more under non-equilibrium conditions [31]. However, the number of phases in Al0.8CrFeCoNiCu0.5 high-entropy alloy is far less than this theoretical prediction. This is attributed to the numerous elements in the alloy and the comparable atomic percentages, which increase the mixing entropy, thereby reducing the system’s Gibbs free energy [32]. This process hinders the formation of ordered compounds, promoting the development of disordered solid solutions instead.
Furthermore, the small mixing enthalpy and minor atomic radius differences among Fe, Co, Ni, and Cr elements facilitate lattice substitution, contributing to solid solution formation. These elements’ similar valence electron concentrations lead to analogous chemical bonds, further enhancing lattice substitution possibilities [33]. This similarity also produces a uniform electron distribution, reducing energy fluctuations and increasing alloy stability.

3.2. Microstructure

Figure 2 displays the unetched morphology and the associated surface scanning imagery of the Al0.8CrFeCoNiCu0.5 high-entropy alloy. In Figure 2, the area marked by the white rectangle represents the region for surface scanning. Table 2 provides the related elemental distribution findings. It can be observed that the composition of the alloy post-melting basically aligns with the theoretical composition.
Figure 3 presents the microstructure of the Al0.8CrFeCoNiCu0.5 high-entropy alloy post aqua regia. Figure 3a–c display the low-magnification SEM of the alloy, demonstrating an equiaxed grain composition and a fishbone-like structure along the grain boundaries. Figure 3d–f depict the high-magnification morphology, revealing a network-like woven structure within the grains. The emergence of this network-like woven structure suggests phase separation and spinodal decomposition during the solidification process of the alloy.
Spinodal decomposition is a solid-state phase transformation based on the diffusion-aggregation mechanism, which can directly evolve into phases without requiring nucleation. During this transformation, the alloy’s solute atoms form solute-rich and solute-depleted zones without uphill diffusion [34]. The two phases generated in the spinodal decomposition always maintain a coherent relationship, sharing similar crystal structures despite their chemical composition differences, leading to relatively minor strain and preserving the coherence. The spinodal decomposition tends to grow along the crystal direction with the lowest coherent strain energy to minimize the energy, forming a periodic pattern.
Based on the XRD results, the alloy exhibits BCC1 and BCC2 structures. By correlating with the previous observations on the as-cast AlCrFeCoNiCu alloy, it can be inferred that the spinodal decomposition structure consists of a BCC1 phase enriched with Fe and Cr and a BCC2 phase enriched with Al and Ni.
To further analyze the microstructure of the alloy, EBSD analysis was performed. Figure 4a displays the alloy’s grain boundary map and KAM map. The KAM, closely related to dislocation density, is often used to reflect the size of residual strain within the grains. It can be seen from the figure that residual strain exists at the grain boundaries, while the residual strain within the grains is relatively small, indicating fewer lattice defects. Red lines and black lines represent low-angle grain boundaries (LAGB, 2° ≤ θ ≤ 15°) and high-angle grain boundaries (HAGB, θ ≥ 15°), respectively. The low-angle grain boundaries only account for 10.6%, and the high-angle grain boundaries account for 89.4%, suggesting that the residual stress within the alloy is relatively tiny [35]. As the selected scanning step length is 0.5 μm and the width of the modulated decomposition structure within the grain is at the nanometer level, it is challenging to calibrate it. Figure 4b shows the phase diagram of the alloy, revealing that the high-entropy alloy mainly consists of the red BCC phase and the green FCC intergranular phase, consistent with the XRD results. Figure 4c presents the IPF diagram of the alloy. It can be observed that the alloy grains prefer to grow in the <001>.

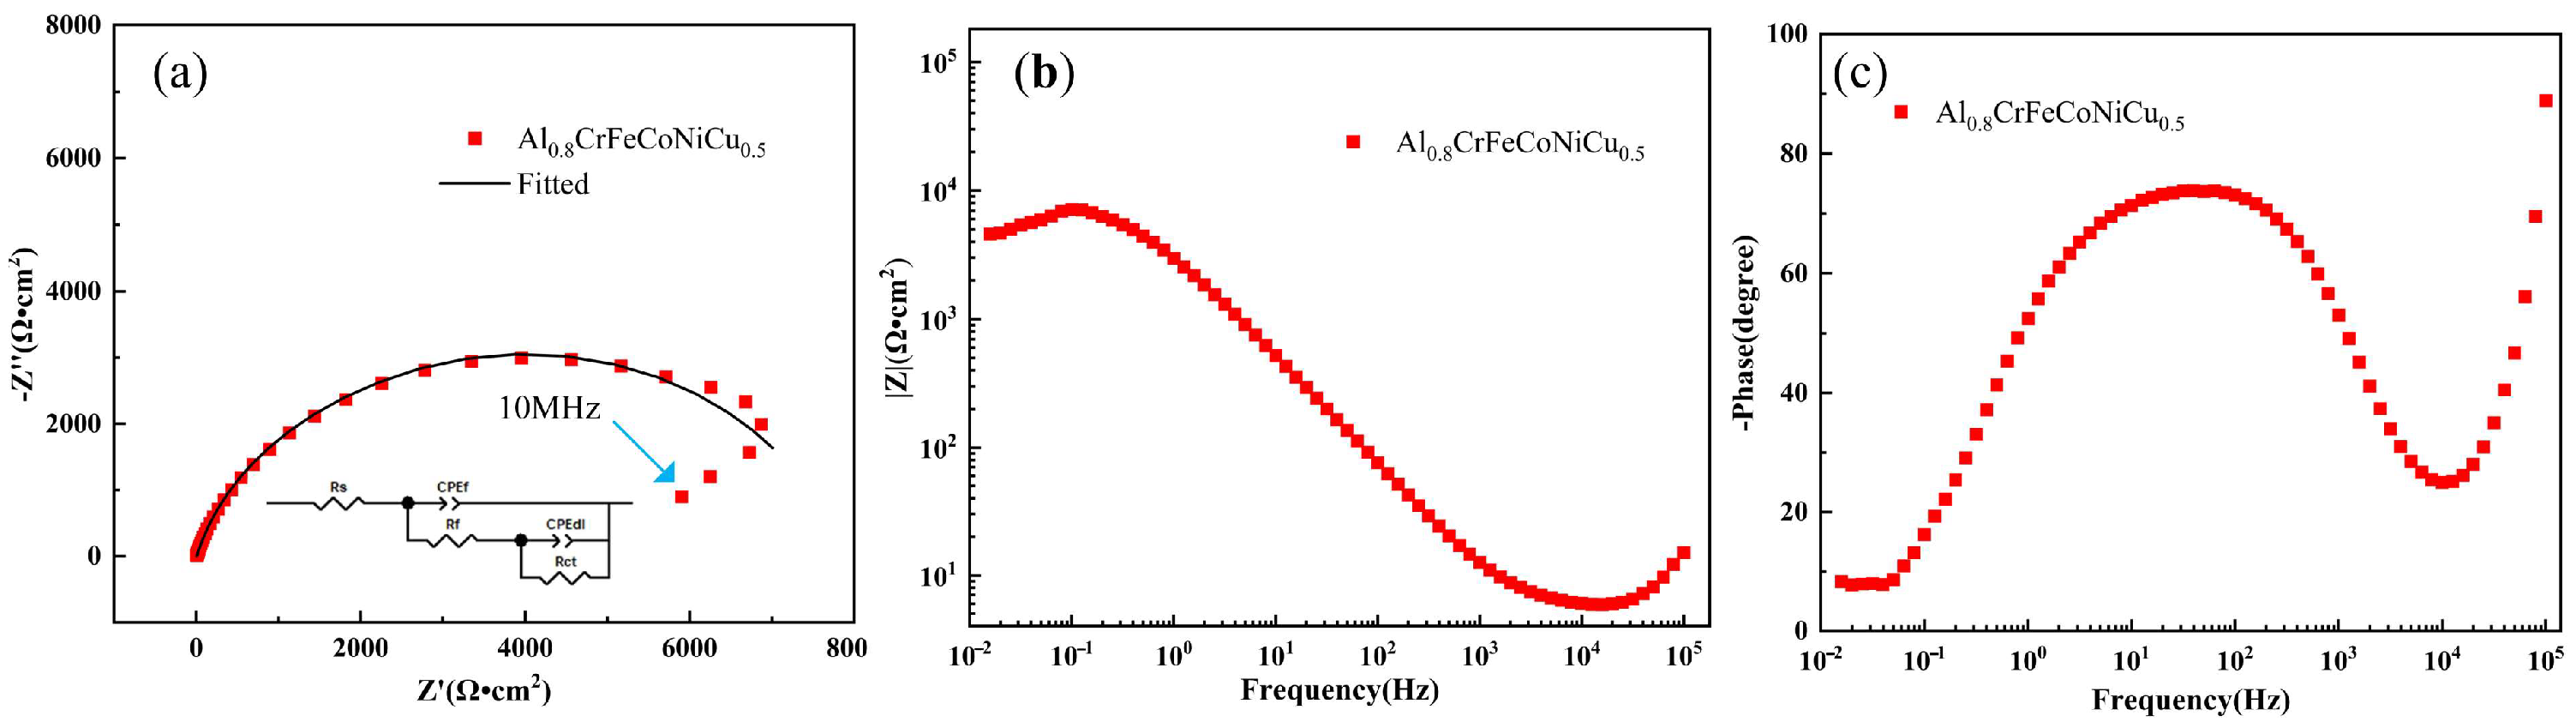
3.3. Corroison Resistance

Figure 5 depicts the polarization test curve of Al0.8CrFeCoNiCu0.5 high-entropy alloy, derived from a single selected sample. The corrosion current density is calculated via the Tafel extrapolation method. The corrosion potential of the alloy is measured at −0.332 V, and the corrosion current density stands at 2.61 × 10⁻⁶ A/cm2. In a study conducted by Rovere et al. [36], the corrosion resistance of AISI 304 stainless steel was compared to that of three Fe–MnSiCrNiCo shape memory stainless steels (SMSSs). AISI 304 showed a lower corrosion potential in a 3.5% NaCl solution, signifying superior corrosion resistance compared to the SMSSs, but inferior when compared to the Al0.8CrFeCoNiCu0.5 high-entropy alloy investigated in this study. This alloy exhibited superior corrosion resistance in the same environment, as evidenced by its higher corrosion potential. Rovere et al. attributed the relatively better corrosion resistance of AISI 304, compared to the SMSSs, to its higher Cr content. Similarly, the Al0.8CrFeCoNiCu0.5 high-entropy alloy has an even higher Cr content, which can be seen as the reason for its superior corrosion resistance when compared to both the AISI 304 and the SMSSs. Furthermore, high-entropy alloys benefit from the cocktail effect. Therefore, the higher content of Cr and Ni in the Al0.8CrFeCoNiCu0.5 alloy is another significant factor contributing to its superior corrosion resistance compared to both AISI 304 stainless steel and the SMSSs.
Figure 6 presents the corrosion morphology of the alloy after the polarization test. Figure 6a shows the low-magnification SEM image of the sample, indicating that the alloy maintains a complete surface even after corrosion. Figure 6b is a magnified view, revealing a tendency towards intergranular corrosion in the alloy, with no observable pitting corrosion. An elemental scan was performed on the regions of corrosion detachment and corrosion product to identify the corrosion-prone phase in the alloy.
Figure 7 presents a local scan image of the alloy’s corroded surface, where corrosion products and pits can be clearly observed on the sample surface. In Figure 8, the area marked by the white rectangle represents the region for surface scanning.The distribution patterns of Fe, Co, Ni, and Cr elements are similar, with apparent pixel absences at the corrosion product sites, indicating that these elements are not involved in forming the corrosion products. In the composition maps of Al and Cu, elemental pixels are also missing at the locations of the corrosion pits, suggesting that the regions rich in Al and Cu were primarily corroded during the polarization test. The pixel densification of Al and Cu at the sites of corrosion products further confirms that Al and Cu were corrupted during the polarization test, resulting in corrosion products that adhered to the alloy surface. Impedance spectroscopy was performed to better understand the corrosion behavior of the Al0.8CrFeCoNiCu0.5 high-entropy alloy.
Figure 8 illustrates the Nyquist plot, impedance modulus curve, and phase angle plot for the Al0.8CrFeCoNiCu0.5 high-entropy alloy, all of which are based on a single chosen sample. The scattered data points in the Nyquist plot (Figure 8a) represent the experimental measurements, while the curve represents the fitted data. The diameter of the capacitive semicircle is related to the charge transfer resistance. A larger capacitive semicircle diameter indicates better corrosion resistance, and the capacitance radius of this sample is approximately 3000 Ω·cm2. The Bode plot’s higher |Z| value signifies better corrosion resistance. From the Bode plot of the sample (Figure 8b), it can be observed that the sample’s highest |Z| value reaches 56,710 Ω·cm2 in the low-frequency region. Generally, the higher the |Z| value in the Bode diagram, the better the corrosion resistance. As shown in Figure 8b, the |Z| value of the sample exhibits an increasing trend in the high frequency range (0.01 Hz to 0.1 Hz), reaching a maximum value of 7153 Ω·cm2. The Bode value continuously decreases in the mid-frequency range (0.1 Hz to 10,000 Hz), ending at 5.918 Ω·cm2. The high phase angle indicates good oil repellency in the high-frequency range, whereas the large modulus in the low-frequency range suggests enhanced corrosion resistance. The sample shows high phase angles in both the high-frequency and low-frequency ranges, indicating a certain degree of corrosion resistance. The high phase angle in the high-frequency range indicates good repellent performance, while the large modulus in the low-frequency range suggests enhanced corrosion resistance. The sample exhibits high phase angles in both the high-frequency and low-frequency ranges, indicating a certain level of corrosion resistance. This may be attributed to the formation of a dense chromium oxide film on the sample surface and the synergistic effect with other elements in forming a passive film. The phase angle plot shows that in the high-frequency range (0.01 Hz to 0.1 Hz) the phase angles are close to 10 degrees, indicating that the impedance is predominantly determined by electrolytic resistance. Within a narrow band in the mid-frequency region (10 Hz to 20 Hz), the phase angle values reach their maximum, which is indicative of capacitive behavior characteristics [37].
The equivalent circuit model for impedance spectroscopy is shown in Figure 8a. The specific fitting data is shown in Table 3.
In the equivalent circuit model, Rs represents the solution resistance, reflecting the resistance to charge movement through the liquid environment, which is 5.155 Ω·cm2. Rf represents the passive film resistance, reflecting its ability to block corrosive ions from reaching the substrate, which is 7339 Ω·cm2. Rct represents the charge transfer resistance, reflecting the power of the sample surface to hinder the movement of interface charges, which is 487.6 Ω·cm2. This indicates that corrosive chloride ions encounter significant resistance when entering the sample, which confirms the analysis results. The constant phase element (CPE) is used to replace the pure capacitor as it provides a better fit in the equivalent circuit. The calculation of the constant phase angle impedance is given by equation [28]:
zCPE = 1/[Y0()n]
where ω is the angular frequency, Y0 is the capacitance, and n is the dispersion coefficient, which describes the deviation of the element from an ideal capacitor due to dispersion effects. When n = −1, zCPE represents a perfect inductor; when n = 0, zCPE represents an ideal resistor; and when n = 1, zCPE represents a perfect capacitor. CEFf represents the constant phase element forccouble layer on the sample surface, reflecting the charge storage in the double layer. CEFdl represents the continual phase element at the membrane-substrate inter. The value of χ2, an indicator of the goodness of fit, is calculated to be 4.1 × 10³. This suggests that the error between the original data and the fitted data is quite small, indicating a high level of data fitting accuracy.

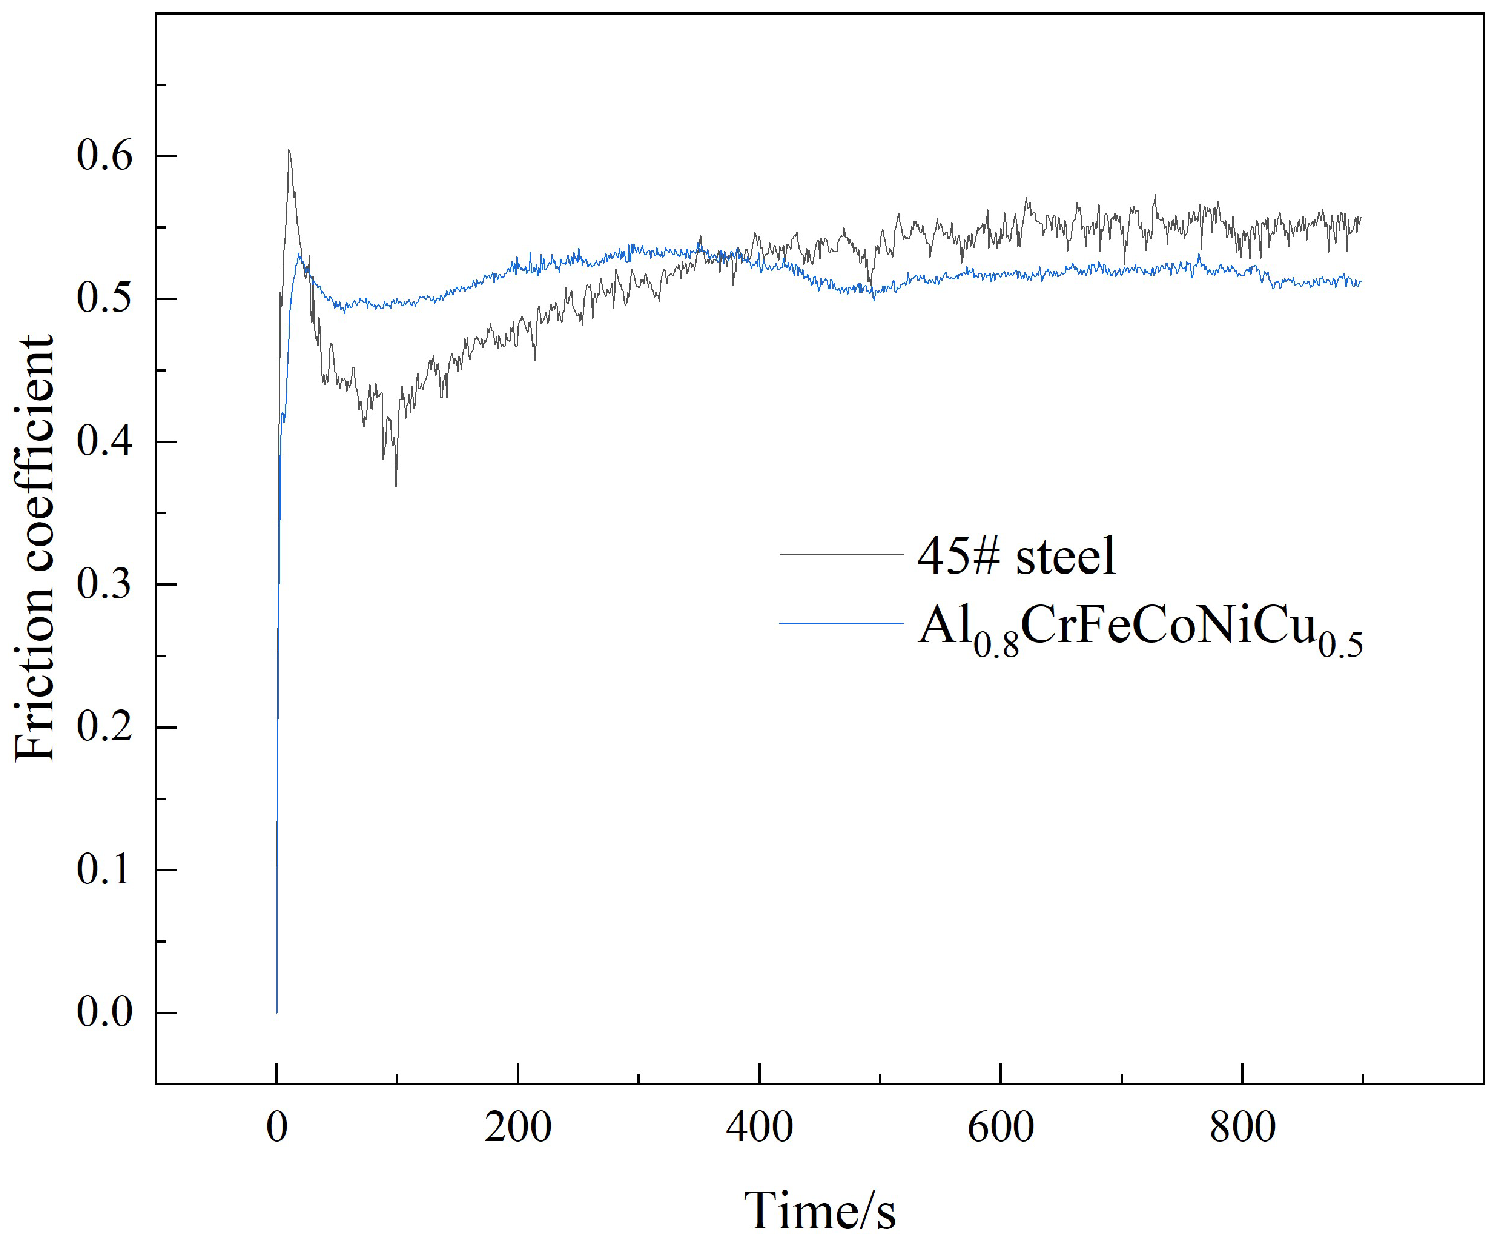
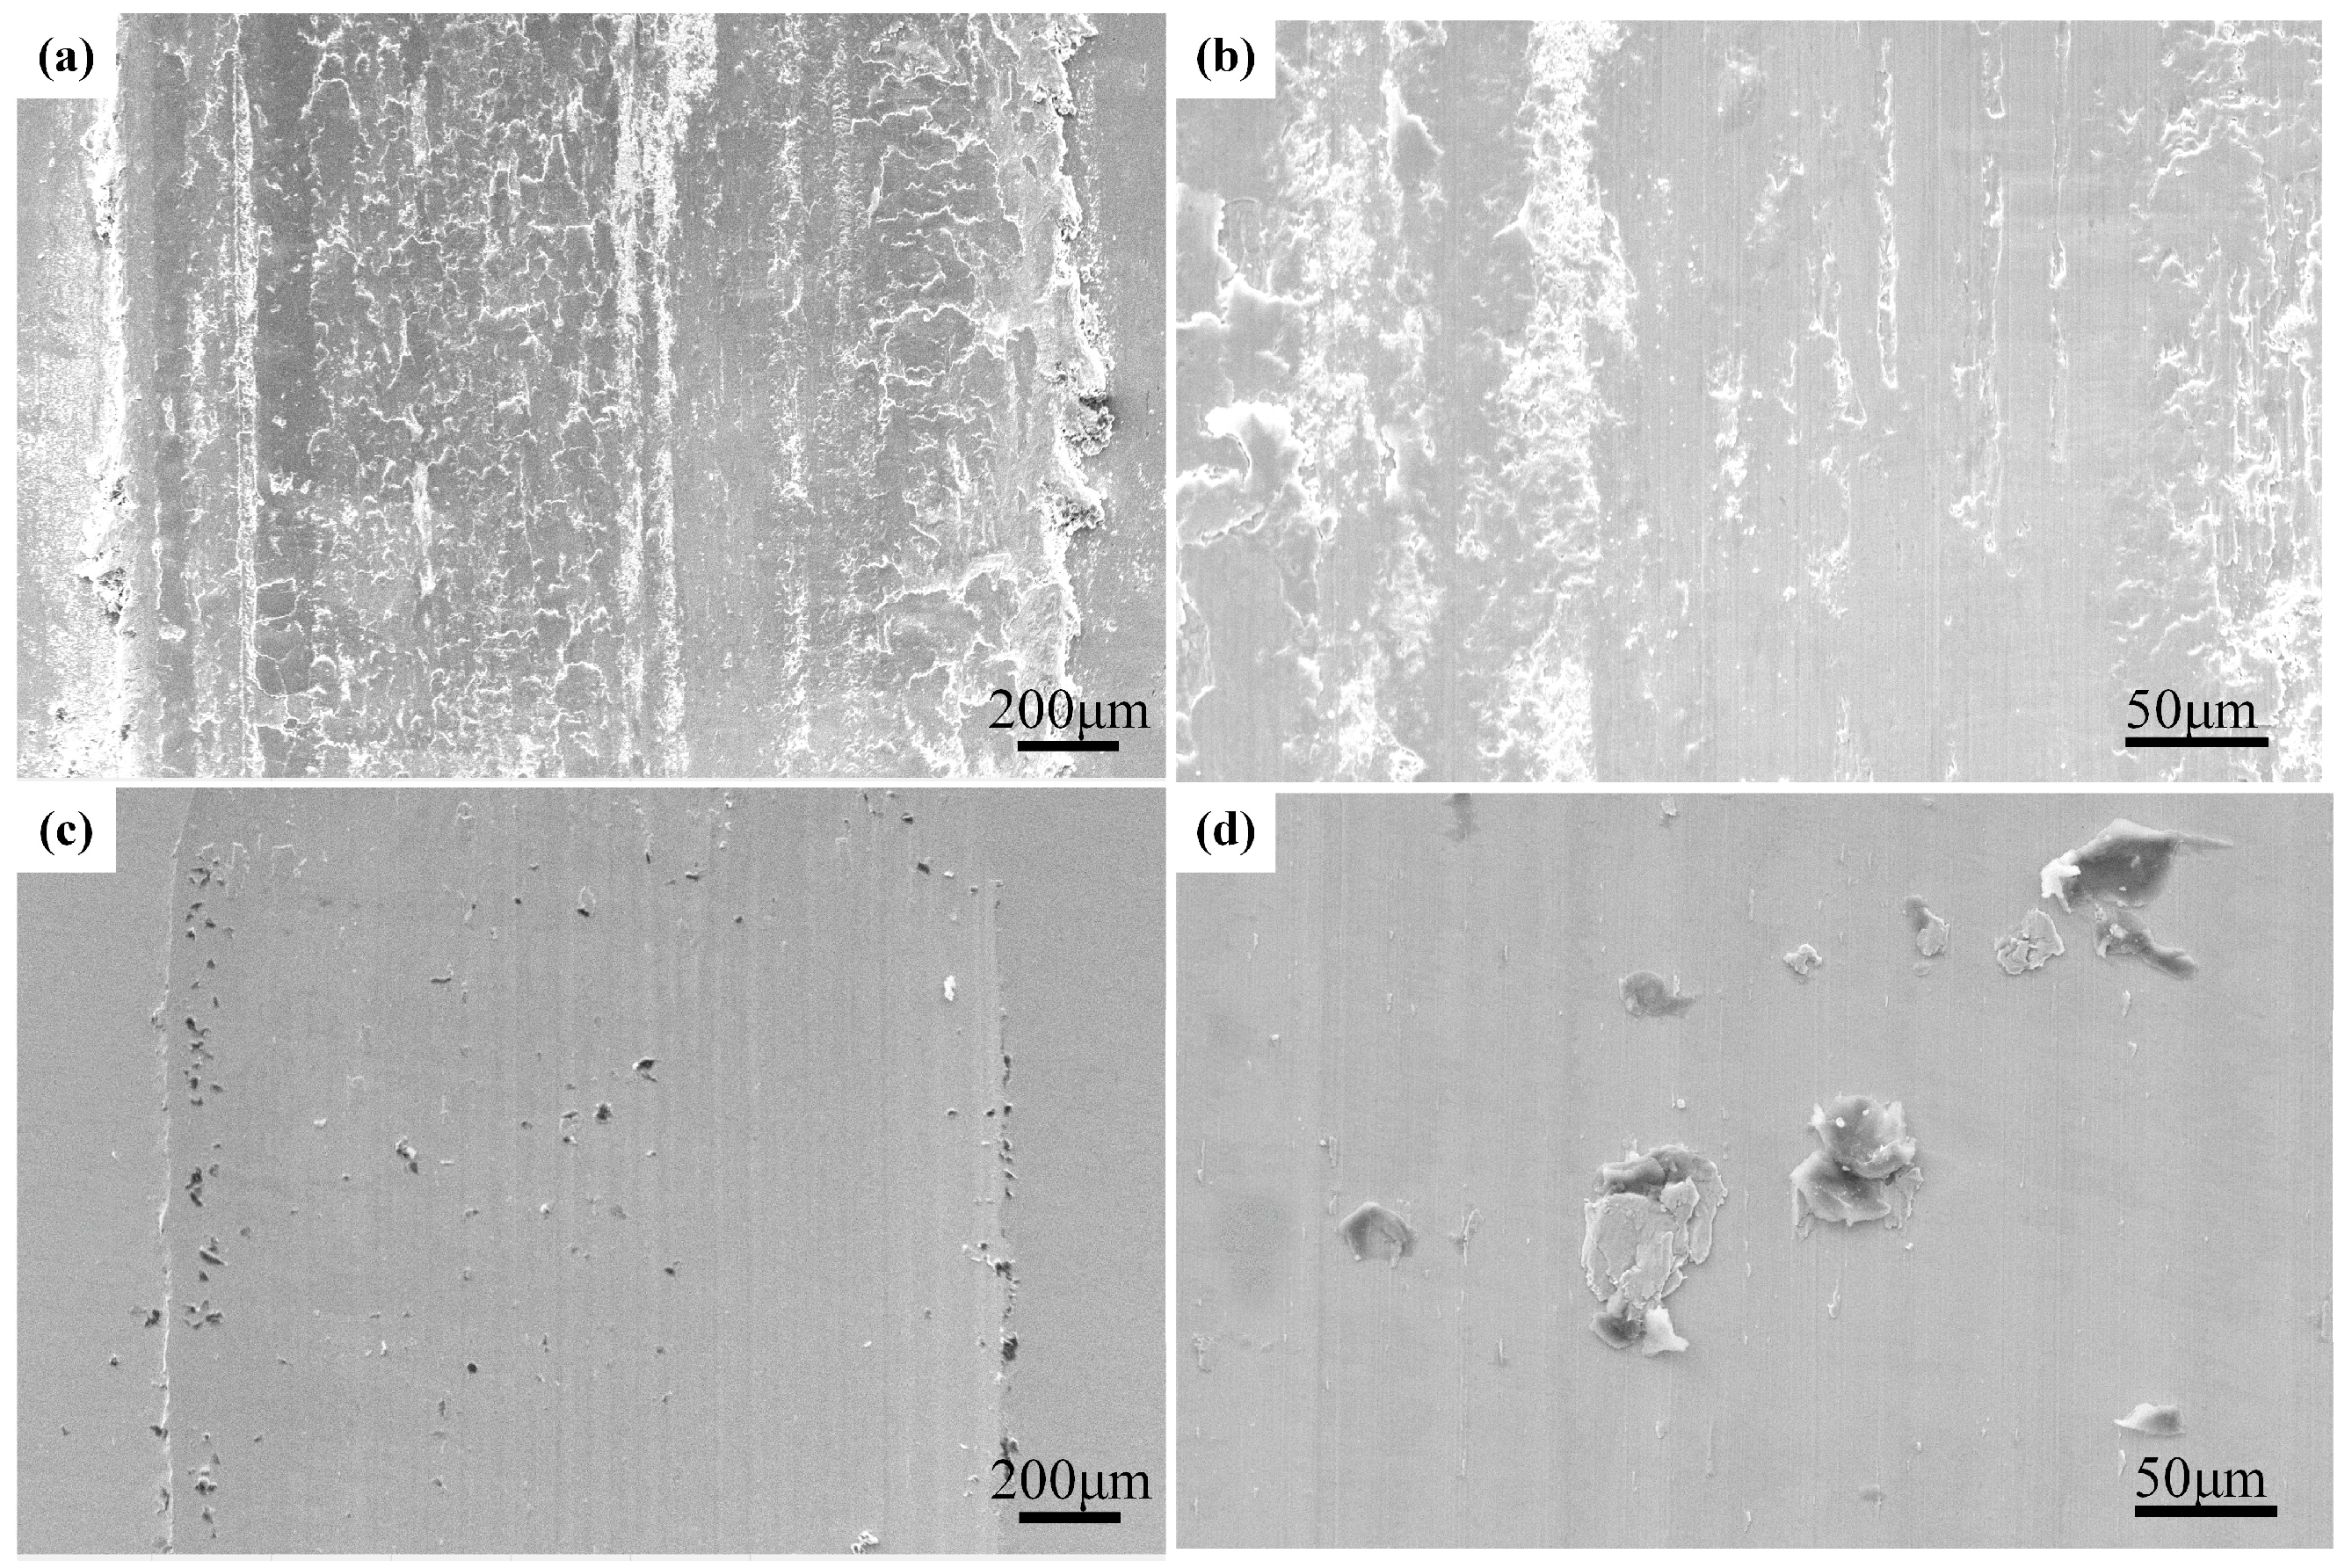
3.4. Wear Resistance

The friction and wear of materials is a complex coupling of mechanics and chemistry. In the interaction between the alloy and the grinding pair, the alloy surface endures the accumulated action of various forces, such as the normal stress and compressive stress caused by the normal load, and the stress generated by the rolling of debris in the furrow. The accumulation of these forces forms an energy buildup on the alloy surface, and the release of these stresses usually leads to surface fragmentation, peeling, and other phenomena.
Figure 9 presents the friction coefficient curve of Al0.8CrFeCoNiCu0.5 high-entropy alloy and 45# steel. As observed, there are significant fluctuations in the curve during the initial phase of wear. This is primarily due to the unevenness of the worn surface, which affects the workpiece during wear. The surface contact occurs mainly at points or lines, leading to an unstable frictional performance throughout the wear experiments. The friction coefficients of Al0.8CrFeCoNiCu0.5 high-entropy alloy and 45# steel are 0.519 and 0.514, respectively, showing a minimal difference.
Figure 10 shows the wear surface morphology of 45# steel and Al0.8CrFeCoNiCu0.5 high-entropy alloy under dry friction conditions. Figure 10a,c, respectively, show the wear mark morphology of 45# steel and Al0.8CrFeCoNiCu0.5 high-entropy alloy. The wear mark width of Al0.8CrFeCoNiCu0.5 high-entropy alloy is 1.65 mm, smaller than the 1.88 mm of 45# steel, indicating that the high-entropy alloy has superior wear resistance. Figure 10b,d are magnified images of their wear morphology. The surface of 45# steel shows severe plastic deformation and has wider furrows, with the worn form mainly being adhesive wear and abrasive wear. During the friction wear process, a significant extent of plastic deformation first occurs along the direction of shear stress on the friction block. Under the continued action of shear forces, the material fractures and some of the elongated plastic surfaces shrink after being torn, forming ductile dimples. The newly formed surfaces contact the friction block and continue to repeat the above process, resulting in severe plastic deformation. This outcome confirms that No. 45 steel has a higher toughness, lower hardness, and inferior wear resistance. In contrast, the wear surface of Al0.8CrFeCoNiCu0.5 high-entropy alloy is more intact, and the worn condition is mainly adhesive wear. The Al0.8CrFeCoNiCu0.5 high-entropy alloy mainly comprises BCC components, and its higher hardness gives it superior wear resistance.

4. Conclusions

This study presents a comprehensive investigation of the Al0.8CrFeCoNiCu0.5 high-entropy alloy, exploring its structural characteristics, electrochemical behavior, and wear resistance. The principal findings from this research are:
(1)
The Al0.8CrFeCoNiCu0.5 high-entropy alloy exhibits the presence of BCC1 and BCC2 phases, corresponding to (Fe-Cr) and Al-Ni, respectively. The identified FCC phase aligns with the Cu element.
(2)
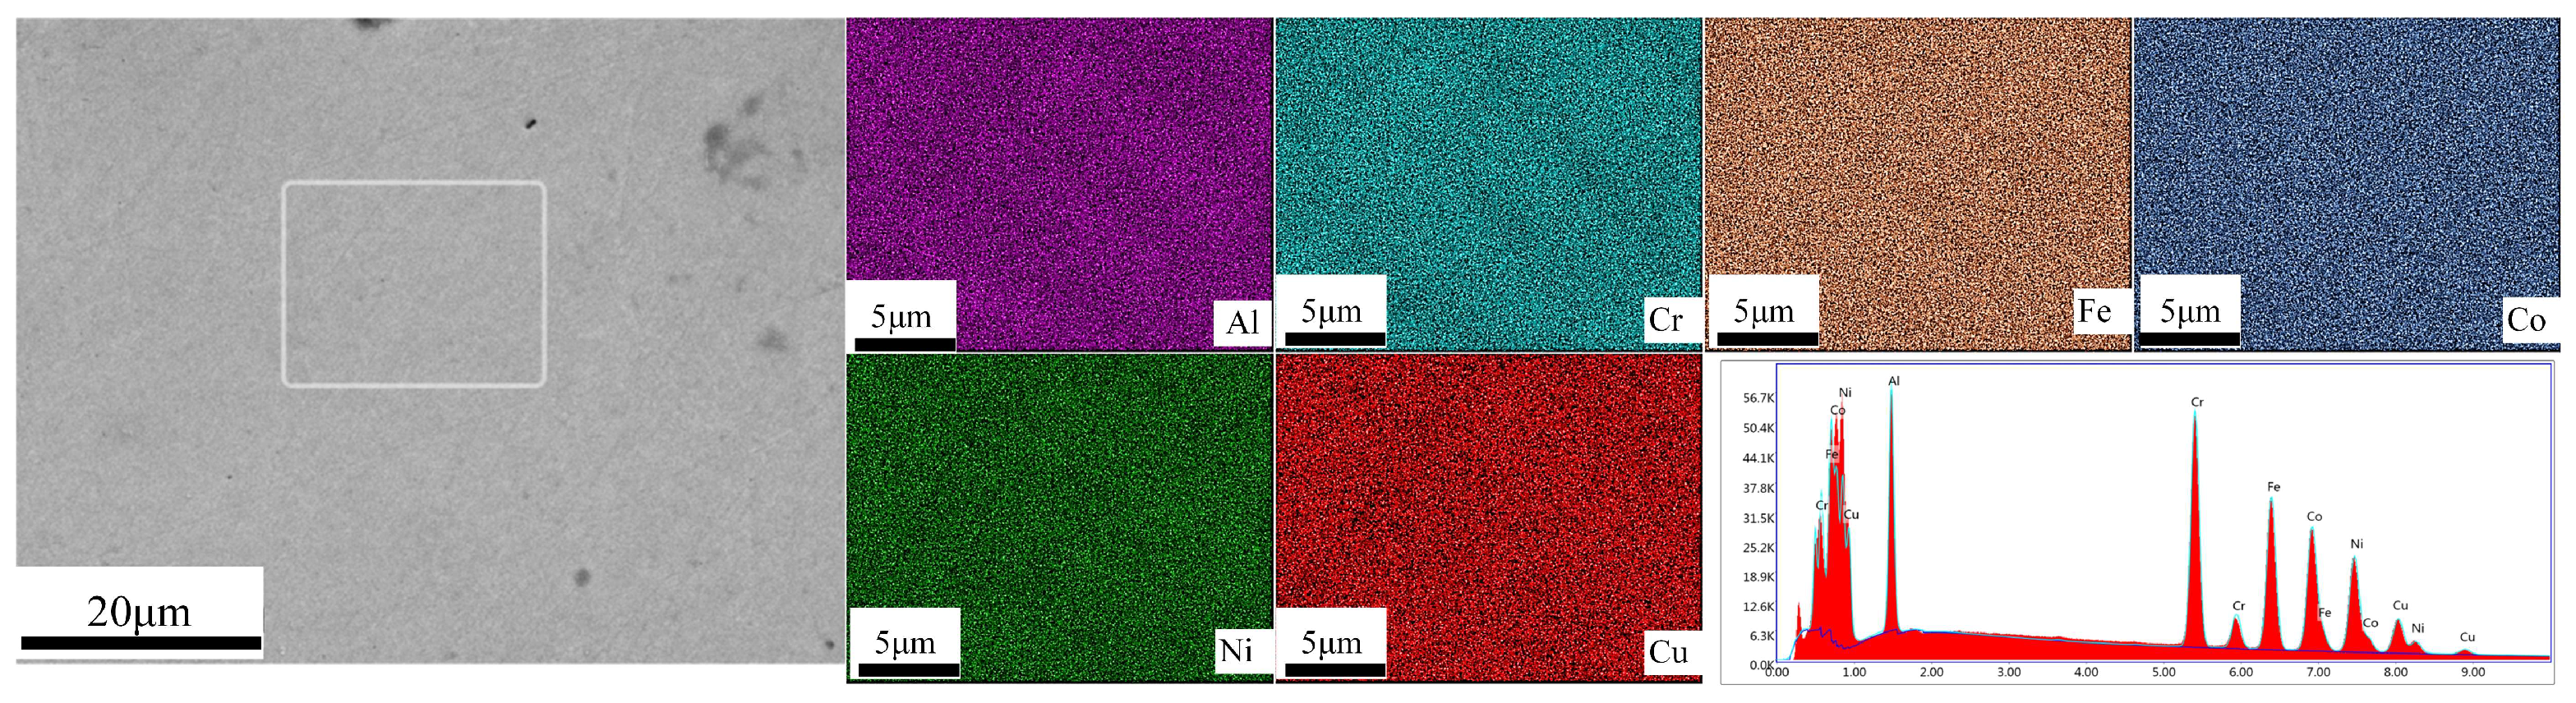
Te Al0.8CrFeCoNiCu0.5 high-entropy alloy exhibits an equiaxed grain structure with a fishbone-like morphology at the grain boundaries and the presence of modulated structures within the grains. The intragranular regions predominantly comprise the BCC, while the intergranular areas primarily comprise the FCC. The alloy demonstrates minimal residual stress and strain within its internal structure. The alloy grains tend to grow along the <001> direction.
(3)
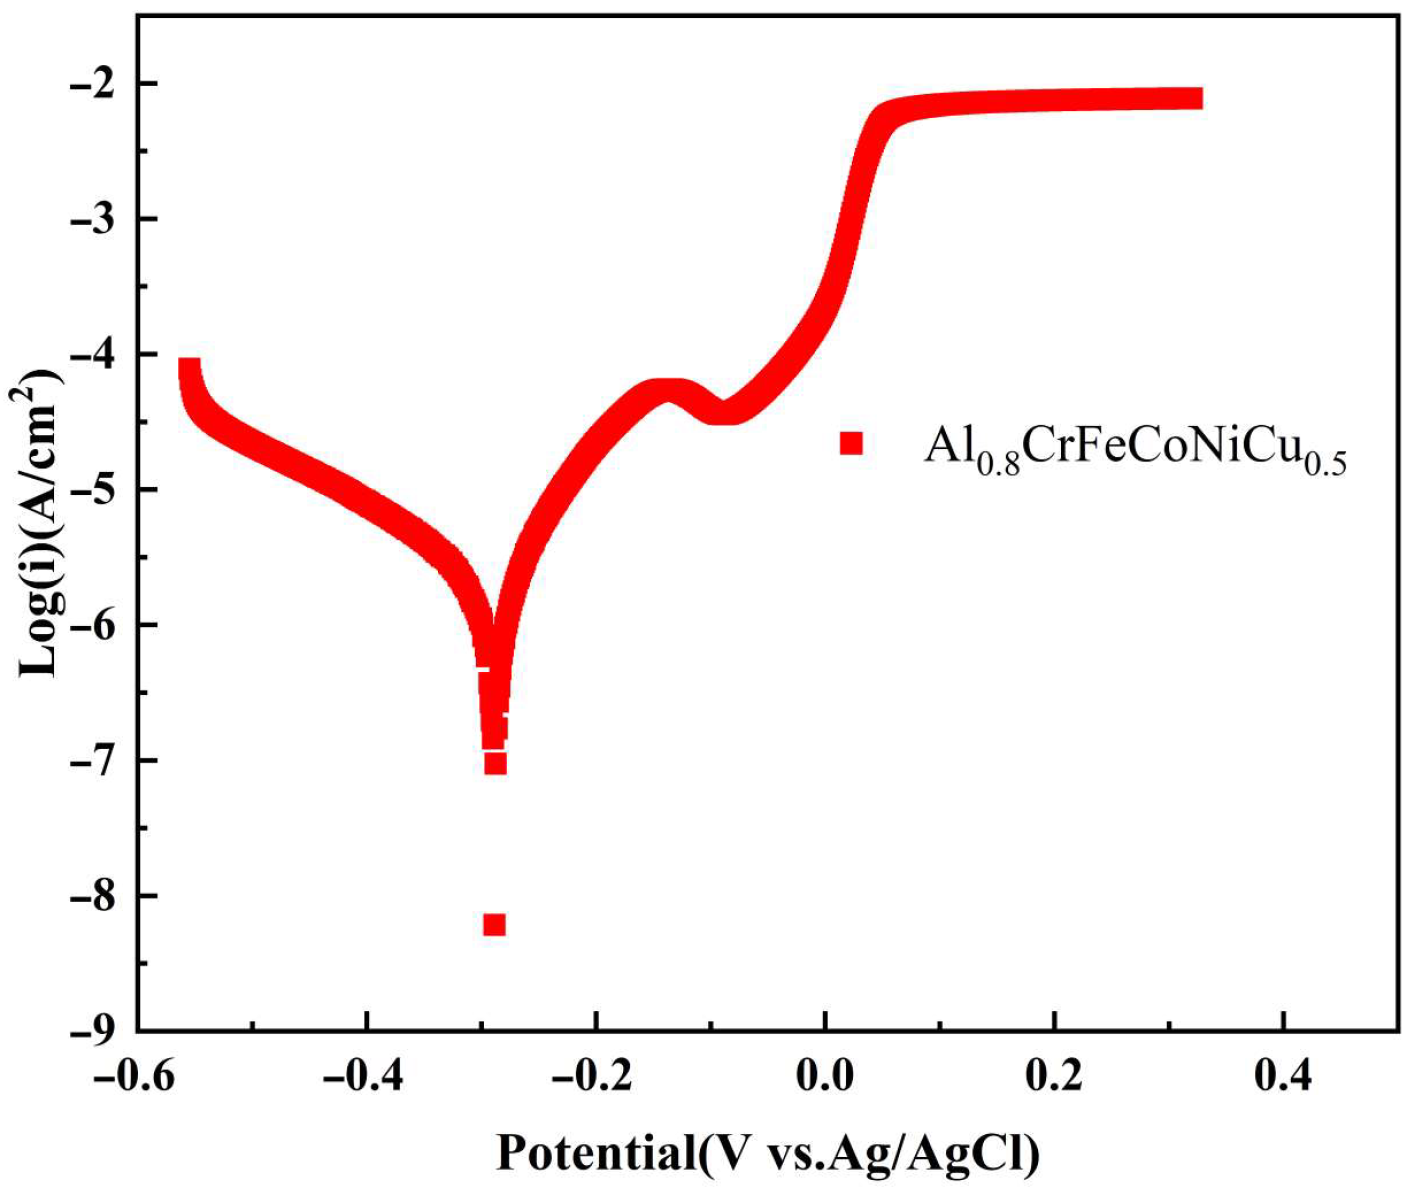
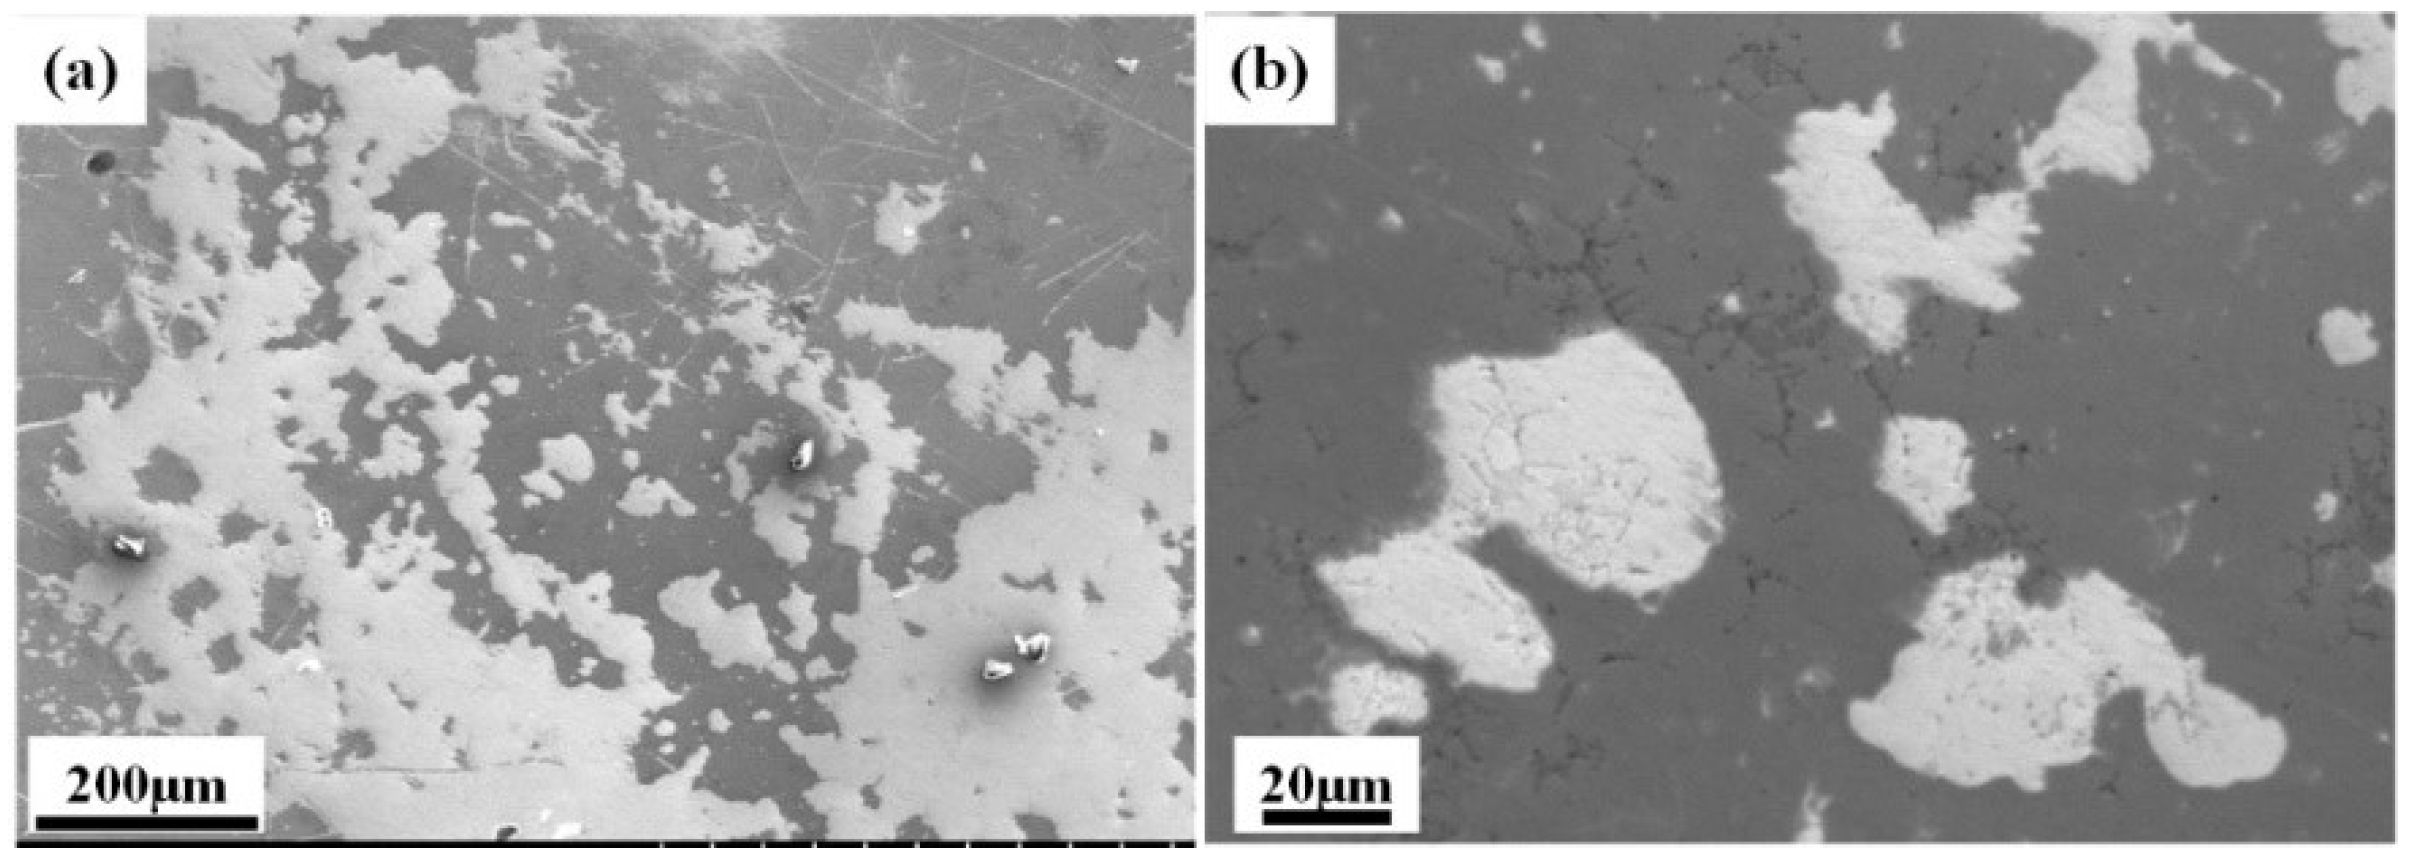
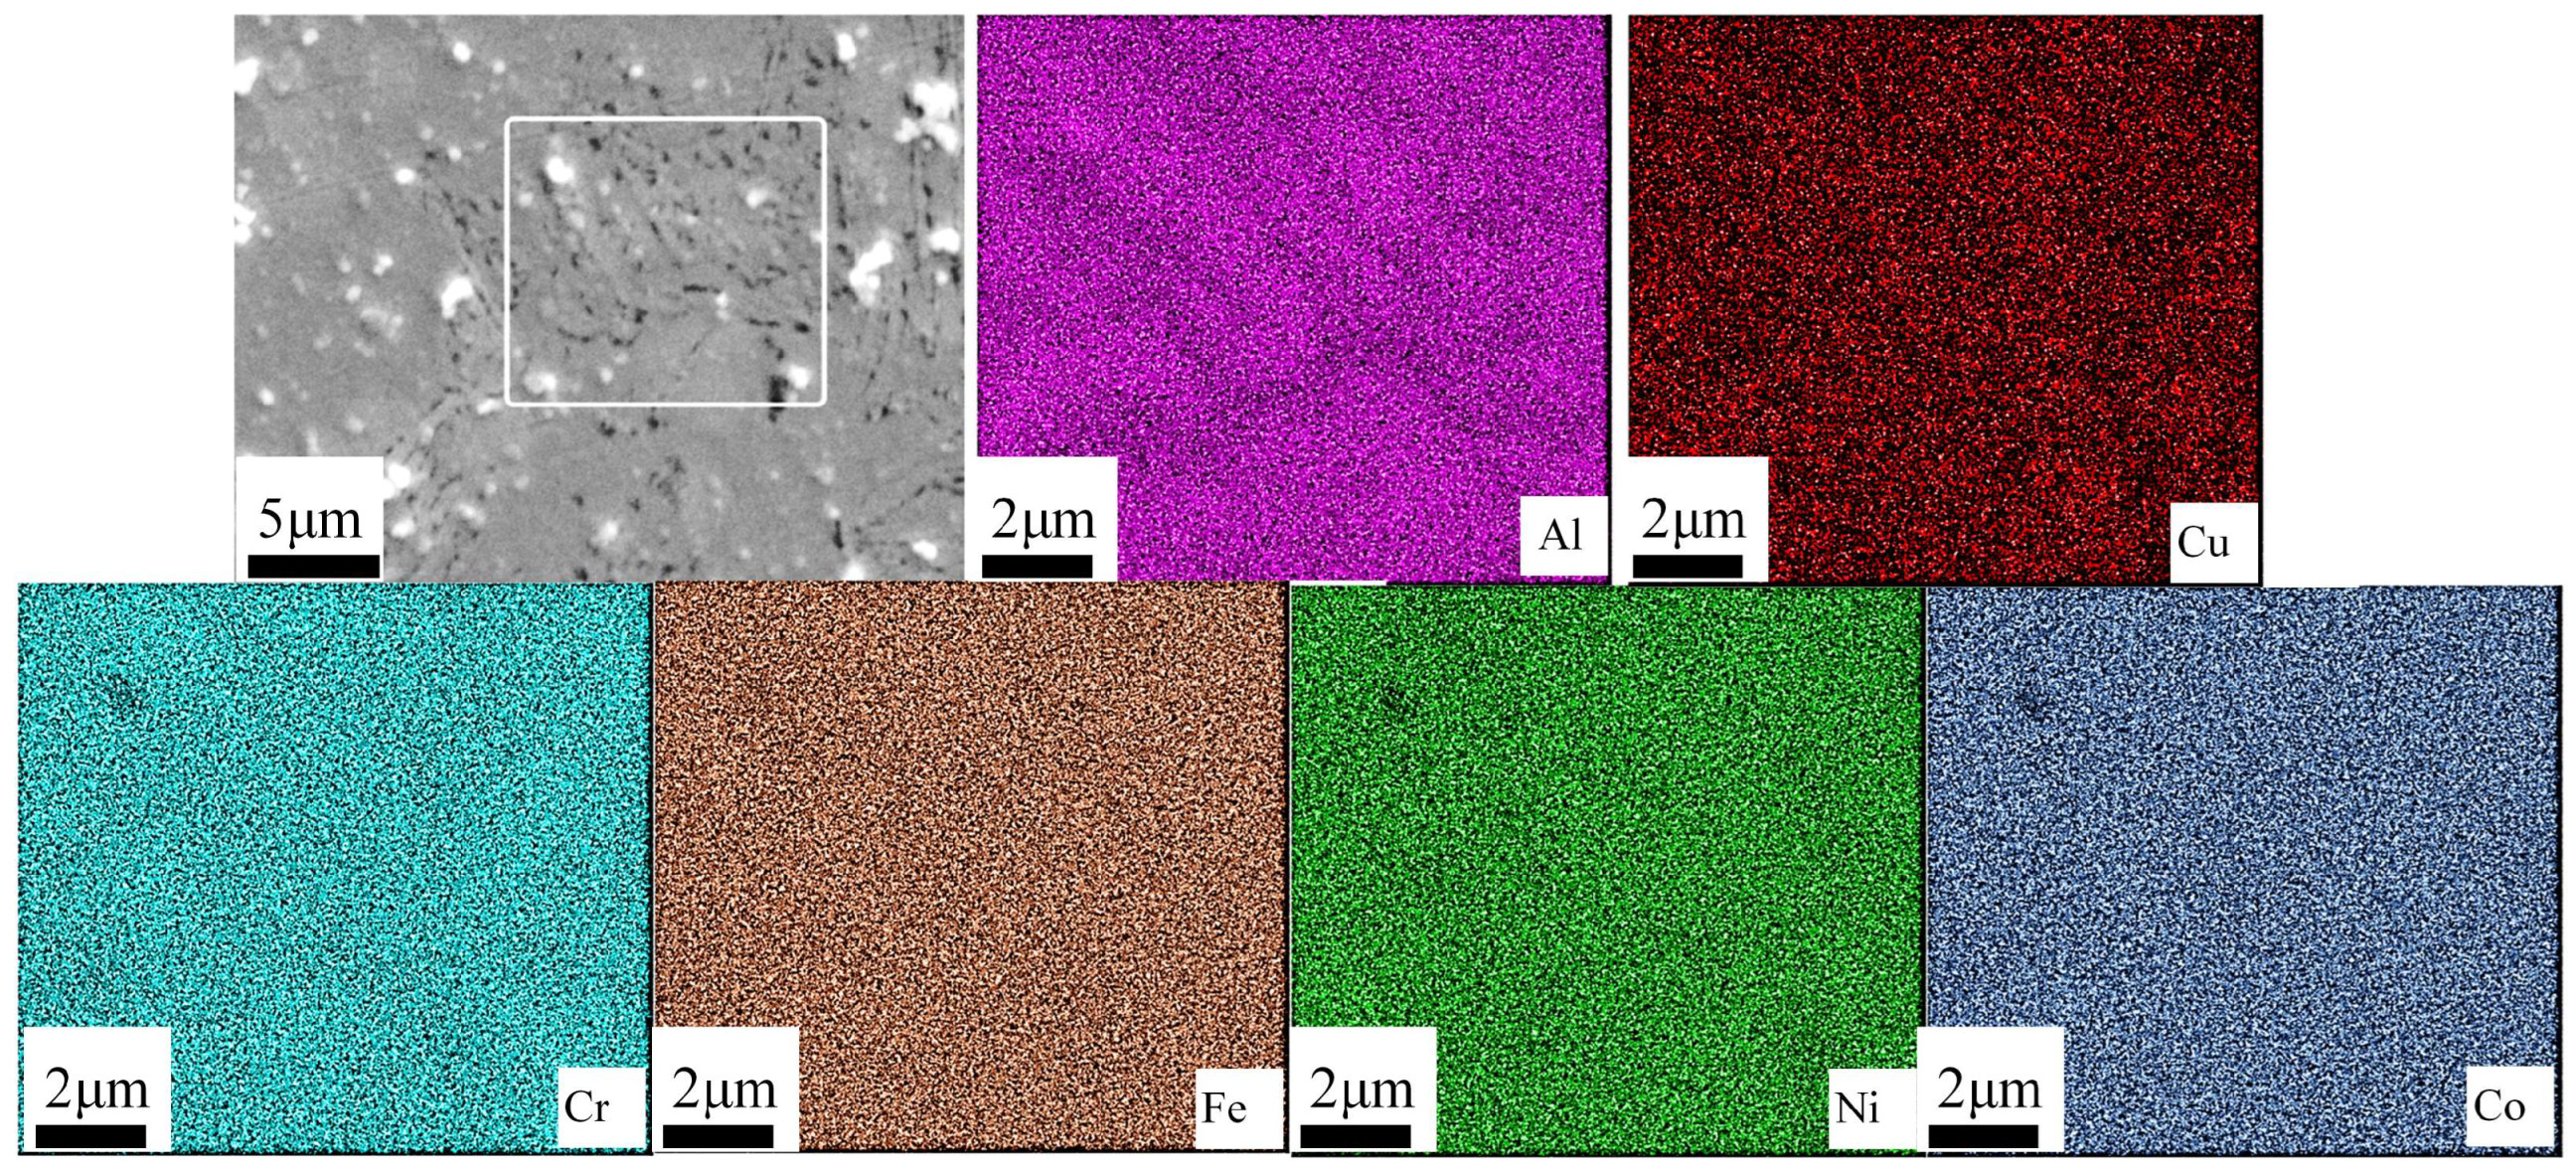
The Al0.8CrFeCoNiCu0.5 high-entropy alloy showed a corrosion potential of −0.332 V and a corrosion current density of 2.61 × 10⁻⁶ A/cm2. The corrosion surface of the alloy remained relatively intact, with some areas exhibiting intergranular corrosion. The intergranular corrosion regions exhibited significant depletion of Al and Cu elements, while the corrosion products primarily consisted of Al and Cu elements. Al and Cu phases contribute to the alloy’s susceptibility to corrosion.
(4)
The wear scar width of Al0.8CrFeCoNiCu0.5 high-entropy alloy is 1.65 mm, which is less than 45# steel, and high-entropy alloy has more excellent wear resistance. Compared with 45# steel, the wear surface of Al0.8CrFeCoNiCu0.5 high-entropy alloy is more intact, and the wear form is mainly adhesive wear.
This study offers valuable insights into the Al0.8CrFeCoNiCu0.5 high-entropy alloy, highlighting its potential in applications requiring high corrosion and wear resistance. However, the research identified gaps in the understanding of the alloy’s long-term corrosion behavior, specifically the lack of extended electrochemical impedance spectroscopy (EIS) studies. To fill this gap, future research should focus on long-term EIS investigations of the alloy and explore its behavior under varied conditions. This would contribute to the alloy’s design optimization, enhancing its performance in harsh operational environments.

Author Contributions

Conceptualization, Z.S.; methodology, Z.S.; validation, Y.L., formal analysis, Y.L.; investigation, Y.L.; resources, Z.S.; datacuration, X.W.; writing—original draft preparation, Y.L.; writing—review and editing, Y.L.; visualization, Y.L.; supervision, Z.S.; project administration, X.W.; funding acquisition, Z.S. and J.L. All authors have read and agreed to the published version of the manuscript.

Funding

This study was supported by the Natural Science Research Project of Major science and Major science and technology project of Anhui Province (202003c08020002),the technology project of Anhui Province (202003c08020002). Key Science and Technology Program of Anhui Province of China (2021001), Key generic technology research and development project of Hefei City (2021GJ053), Natural Science Foundation of Anhui Province (2108085ME142), National Natural Science Foundation of China [52001304], Science and Technology Program of Inner Mongolia Autonomous Region (2022YFDZ0004). Anhui Provincial Department of Education (Grant Nos. KJ2021A0947), the University level natural science research project of West Anhui University (Grant Nos. WXZR202116, WGKQ2021068), High-level Talents Research Project of West Anhui University (Grant No. WGKQ2021068, WGKQ 201802004).

Data Availability Statement

The data that support the findings in this study are available from the author Y. L. upon reasonable request.

Conflicts of Interest

The authors declare no conflict of interest.

References

  1. Yeh, J.W.; Chen, S.K.; Lin, S.J.; Gan, J.Y.; Chin, T.S.; Shun, T.T.; Tsau, C.H.; Chang, S.Y. Nanostructured high-entropy alloys with multiple principal elements: Novel alloy design concepts and outcomes. Adv. Eng. Mater. 2004, 6, 299–303. [Google Scholar] [CrossRef]
  2. Zhang, Z.; Zhang, J.; Zhang, M.; Peng, P. First-principles calculations on brazed diamond with FeCoCrNi high entropy alloys doped with strong carbide-forming elements. Solid State Commun. 2022, 357, 114980. [Google Scholar] [CrossRef]
  3. Yu, Y.; Yu, Y. Simulations of irradiation resistance and mechanical properties under irradiation of high-entropy alloy NiCoCrFe. Mater. Today Commun. 2022, 33, 104308. [Google Scholar] [CrossRef]
  4. Ali, M.M.; Abd Elmoamen, S.S.; Gepreel, M.A.H.; Ahmed, H.A.; Elrefaie, F.A. High temperature oxidation of non equi-atomic Al5Cr12Fe35Mn28Ni20 high entropy alloy. Mater. Res. Express 2021, 8, 036508. [Google Scholar] [CrossRef]
  5. Duan, X.T.; Han, T.Z.; Guan, X.; Wang, Y.N.; Su, H.H.; Ming, K.S.; Wang, J.; Zheng, S.J. Cooperative effect of Cr and Al elements on passivation enhancement of eutectic high-entropy alloy AlCoCrFeNi 2.1 with precipitates. J. Mater. Sci. Technol. 2023, 136, 97–108. [Google Scholar] [CrossRef]
  6. Li, X.F.; Yang, X.H.; Yi, D.H.; Liu, B.S.; Zhu, J.C.; Li, J.X.; Gao, C.; Wang, L.Z. Effects of NbC content on microstructural evolution and mechanical properties of laser cladded Fe50Mn30Co10Cr10-xNbC composite coatings. Intermetallics 2021, 138, 107309. [Google Scholar] [CrossRef]
  7. Wang, F.; Wang, H.; Zhou, X.; Fu, R. A Driving Fatigue Feature Detection Method Based on Multifractal Theory. IEEE Sens. J. 2022, 22, 19046–19059. [Google Scholar] [CrossRef]
  8. Zhu, Y.T.; Wu, X.L. Heterostructured materials. Prog. Mater. Sci. 2023, 131, 101019. [Google Scholar] [CrossRef]
  9. Sathiyamoorthi, P.; Kim, H.S. High-entropy alloys with heterogeneous microstructure: Processing and mechanical properties. Prog. Mater. Sci. 2022, 123, 100709. [Google Scholar] [CrossRef]
  10. Cantor, B. Multicomponent high-entropy Cantor alloys. Prog. Mater. Sci. 2021, 120, 100754. [Google Scholar] [CrossRef]
  11. Zhu, Z.X.; Liu, X.B.; Liu, Y.F.; Zhang, S.Y.; Meng, Y.; Zhou, H.B.; Zhang, S.H. Effects of Cu/Si on the microstructure and tribological properties of FeCoCrNi high entropy alloy coating by laser cladding. Wear 2023, 512, 204533. [Google Scholar] [CrossRef]
  12. Zhou, Z.; Li, H.; Liu, Y.; Niu, T.; Li, H. Effect of Ti on the corrosion behavior of (FeCrCoNi)100−xTix alloy. Corros. Sci. 2022, 209, 110807. [Google Scholar] [CrossRef]
  13. Zhang, X.; Liu, L.; Yao, K.D.; Duan, K.; Wu, F.F.; Zhao, R.D.; Zhang, Y.; Shang, J.; Chen, M.H. The evolution of eutectic microstructure and mechanical properties of AlxCoCrFeNi2.1 high-entropy alloys. J. Mater. Res. 2022, 37, 2082–2092. [Google Scholar] [CrossRef]
  14. Wan, Q.; Hua, K.; Zhou, Z.; Zhang, F.; Wu, H.; Zhou, Q.; Wang, H. Revealing the B addition on tribology performance in TiZrHfTa0.5 refractory high-entropy alloy at ambient and elevated temperature. J. Alloys Compd. 2023, 931, 167521. [Google Scholar] [CrossRef]
  15. Li, Y.Z.; Shi, Y.; Wang, H.X.; Zhou, B.J.; Li, D.F.; Lin, H.; Wang, J.Q. Effect of Y on Microstructure and Properties of Al0.8FeCrCoNiCu0.5 High Entropy Alloy Coating on 5083 Aluminum by Laser Cladding. Lubricants 2023, 11, 50. [Google Scholar] [CrossRef]
  16. Zhang, Y.P.; Chen, X.Z.; Jayalakshmi, S.; Singh, R.A.; Deev, V.B.; Prusov, E.S. Factors determining solid solution phase formation and stability in CoCrFeNiX0.4 (X=Al, Nb, Ta) high entropy alloys fabricated by powder plasma arc additive manufacturing. J. Alloys Compd. 2021, 857, 157625. [Google Scholar] [CrossRef]
  17. Gao, Y.; Lu, P.; Bai, S.; Qin, B.; Zhang, D. Influence of Laser Power on Microstructure and Properties of Al-Si+Y2O3 Coating. Coatings 2023, 13, 1289. [Google Scholar] [CrossRef]
  18. Pandey, V.K.; Shadangi, Y.; Shivam, V.; Sarma, B.N.; Mukhopadhyay, N.K. Theoretical and experimental study on phase stability of TiVZrMoW refractory high entropy alloy. Philos. Mag. 2022, 102, 480–503. [Google Scholar] [CrossRef]
  19. Huang, C.; Yao, Y.; Yang, B.; Chen, S.H. Hierarchical toughening mechanisms in face centered cubic CoCrFeMnNi high-entropy alloy at room temperature and cryogenic temperatures. Phys. Rev. B 2023, 107, 174103. [Google Scholar] [CrossRef]
  20. Zhang, P.L.; Qi, Y.F.; Cheng, Q.Q.; Sun, X.M. Welding Dissimilar Alloys of CoCrFeMnNi High-Entropy Alloy and 304 Stainless Steel Using Gas Tungsten Arc Welding. J. Mater. Eng. Perform. 2023, 212, 348–365. [Google Scholar] [CrossRef]
  21. Lee, U.H. Precipitation growth of a-phase along the interface in CoCrFeMnNi high-entropy alloy. Vacuum 2023, 213, 112103. [Google Scholar] [CrossRef]
  22. Xu, Z.; Li, Q.Y.; Li, W.; Li, D.Y. Microstructure, mechanical properties, and wear behavior of AlCoCrFeNi high-entropy alloy and AlCrFeNi medium-entropy alloy with WC addition. Wear 2023, 522, 204701. [Google Scholar] [CrossRef]
  23. Li, Y.T.; Fu, H.G.; Wang, K.M.; Yang, X.J.; Zong, B.; Lin, J. Effect of Mo addition on microstructure and wear resistance of laser clad AlCoCrFeNi-TiC composite coatings. Appl. Surf. Sci. 2023, 623, 157071. [Google Scholar] [CrossRef]
  24. Kao, Y.-F.; Lee, T.-D.; Chen, S.-K.; Chang, Y.-S. Electrochemical passive properties of AlxCoCrFeNi (x = 0, 0.25, 0.50, 1.00) alloys in sulfuric acids. Corros. Sci. 2010, 52, 1026–1034. [Google Scholar] [CrossRef]
  25. Geant, V.; Voiculescu, I.; Cotrut, M.C.; Vranceanu, M.; Vasile, I.M.; Rosca, J. Effect of Al on Corrosion Behavior in 3.5%NaCl Solution of Al_xCoCrFeNi High Entropy Alloys. Int. J. Eng. Res. Afr. 2021, 53, 20–30. [Google Scholar] [CrossRef]
  26. Yan, X.; Guo, H.; Yang, W.; Pang, S.; Wang, Q.; Liu, Y.; Liaw, P.K.; Zhang, T. Al0.3CrxFeCoNi high-entropy alloys with high corrosion resistance and good mechanical properties. J. Alloys Compd. 2021, 860, 158436. [Google Scholar] [CrossRef]
  27. Shi, Y.; Collins, L.; Feng, R.; Zhang, C.; Balke, N.; Liaw, P.K.; Yang, B. Homogenization of AlxCoCrFeNi high-entropy alloys with improved corrosion resistance. Corros. Sci. 2018, 133, 120–131. [Google Scholar] [CrossRef]
  28. Li, Y.Z.; Shi, Y. Microhardness, wear resistance, and corrosion resistance of AlxCrFeCoNiCu high-entropy alloy coatings on aluminum by laser cladding. Opt. Laser Technol. 2021, 134, 106632. [Google Scholar] [CrossRef]
  29. Li, Y.Z.; Shi, Y.; Olugbade, E. Microstructure, mechanical, and corrosion resistance properties of Al0.8CrFeCoNiCux high-entropy alloy coatings on aluminum by laser cladding. Mater. Res. Express 2020, 7, 026504. [Google Scholar] [CrossRef]
  30. Li, H.; Zeng, S.; Zhou, Y.K.; Li, H.L.; Zhang, H.W.; Zhang, H.F.; Zhu, Z.W. High Tensile Strength and Superelasticity of Directionally Solidified Ti30Ni30Fe10Hf10Nb20 Eutectic High Entropy Alloy. Acta Metall. Sin.-Engl. Lett. 2022, 35, 1583–1590. [Google Scholar] [CrossRef]
  31. Thirugnanasambantham, K.G.; Singh, A.; Jegannathan, P.; Barathwaj, A.; Vignesh, P.; Vinayak, S.; Vikram, S.V.; Cheepurupalli, M.V. A novel alloy design for non-equiatomic high-entropy alloy (Cr-Fe-Ni-Ti-Nb): Predicting entropy mix and enthalpy mix. Int. J. Interact. Des. Manuf. IJIDeM 2023, 6, 467–489. [Google Scholar] [CrossRef]
  32. Jiang, Y.Q.; Li, J.; Juan, Y.F.; Lu, Z.J.; Jia, W.L. Evolution in microstructure and corrosion behavior of AlCoCrxFeNi high-entropy alloy coatings fabricated by laser cladding. J Alloy. Compd. 2019, 775, 1–14. [Google Scholar] [CrossRef]
  33. George, E.P.; Raabe, D.; Ritchie, R.O. High-entropy alloys. Nat. Rev. Mater. 2019, 4, 515–534. [Google Scholar] [CrossRef]
  34. Zhang, Y.; Chen, Z.; Cao, D.D.; Zhang, J.Y.; Zhang, P.; Tao, Q.; Yang, X.Q. Concurrence of spinodal decomposition and nano-phase precipitation in a multi-component AlCoCrCuFeNi high-entropy alloy. J. Mater. Res. Technol. 2019, 8, 726–736. [Google Scholar] [CrossRef]
  35. Li, L.L.; Kamachali, R.D.; Li, Z.M.; Zhang, Z.F. Grain boundary energy effect on grain boundary segregation in an equiatomic high-entropy alloy. Phys. Rev. Mater. 2020, 4, 053603. [Google Scholar] [CrossRef]
  36. Della Rovere, C.A.; Alano, J.H.; Silva, R.; Nascente, P.A.P.; Otubo, J.; Kuri, S.E. Influence of alloying elements on the corrosion properties of shape memory stainless steels. Mater. Chem. Phys. 2012, 133, 668–673. [Google Scholar] [CrossRef]
  37. Della Rovere, C.A.; Alano, J.H.; Silva, R.; Nascente, P.A.P.; Otubo, J.; Kuri, S.E. Characterization of passive films on shape memory stainless steels. Corros. Sci. 2012, 57, 154–161. [Google Scholar] [CrossRef]
Figure 1. XRD of as-cast Al0.8CrFeCoNiCu0.5 HEA ((a) represents the XRD pattern of the sample, (b) is the deconvolution of the (110) peak, and (c) shows the deconvolution of the (200) peak).
Lubricants 11 00358 g001
Figure 2. Unetched Morphology and Associated Surface Scanning Imagery of the Al0.8CrFeCoNiCu0.5 High-Entropy Alloy.
Lubricants 11 00358 g002
Figure 3. The SEM of the Al0.8CrFeCoNiCu0.5 High-Entropy Alloy((a) represents a 350-fold magnified SEM image, (b) represents a 500-fold magnified SEM image, (c) represents a 1000-fold magnified SEM image, (d) represents a 5000-fold magnified SEM image, (e) represents a 15,000-fold magnified SEM image, and (f) represents a 30,000-fold magnified SEM image).
Lubricants 11 00358 g003
Figure 4. The EBSD of the Al0.8CrFeCoNiCu0.5 High-Entropy Alloy ((a) BC+KAM map, (b) phase map, and (c) EBSD BC+IPFmap).
Lubricants 11 00358 g004
Figure 5. The polarization test curve of Al0.8CrFeCoNiCu0.5 high-entropy alloy.
Lubricants 11 00358 g005
Figure 6. The corrosion morphology of Al0.8CrFeCoNiCu0.5 high-entropy alloy ((a) represents a 110-fold magnified SEM image and (b) represents a 600-fold magnified SEM image).
Lubricants 11 00358 g006
Figure 7. Displays the corrosion morphology and localized compositional surface scan of the Al0.8CrFeCoNiCu0.5 alloy.
Lubricants 11 00358 g007
Figure 8. The impedance test results of the Al0.8CrFeCoNiCu0.5 high-entropy alloy. ((a) Nyquist plot, (b) Bode plot, and (c) Phase angle.)
Lubricants 11 00358 g008
Figure 9. The friction coefficient curve of samples.
Lubricants 11 00358 g009
Figure 10. The wear surface morphology of (a) 45# steel and (b) Al0.8CrFeCoNiCu0.5 high-entropy alloy.
Lubricants 11 00358 g010
Table 1. Nominal components and abbreviation of Al0.8FeCoNiCrCu0.5.
ElementAlCrFeCoNiCu
Atomic %15.0918.8618.8618.8618.869.43
Table 2. Elemental Distribution Corresponding to Figure 2 for the Al0.8CrFeCoNiCu0.5 High-Entropy Alloy.
ElementAlCrFeCoNiCu
Atomic %13.2520.3419.2519.3319.008.83
Table 3. Equivalent circuit fitting data for Al0.8CrFeCoNiCu0.5 high-entropy alloy.
Rs (Ω·cm2)Rf (Ω·cm2)CPEdl (μF/cm−2·S(α−1))Rct (Ω·cm2)2)
5.15573391.162487.64.1E3
Disclaimer/Publisher’s Note: The statements, opinions and data contained in all publications are solely those of the individual author(s) and contributor(s) and not of MDPI and/or the editor(s). MDPI and/or the editor(s) disclaim responsibility for any injury to people or property resulting from any ideas, methods, instructions or products referred to in the content.

