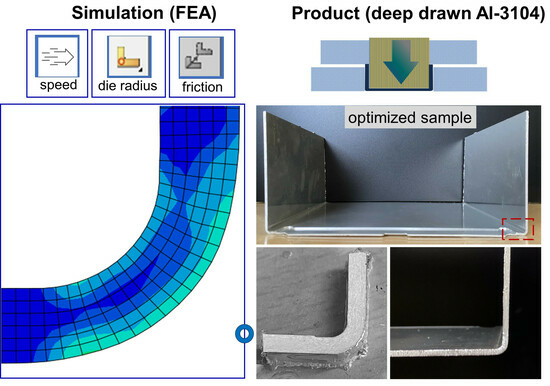
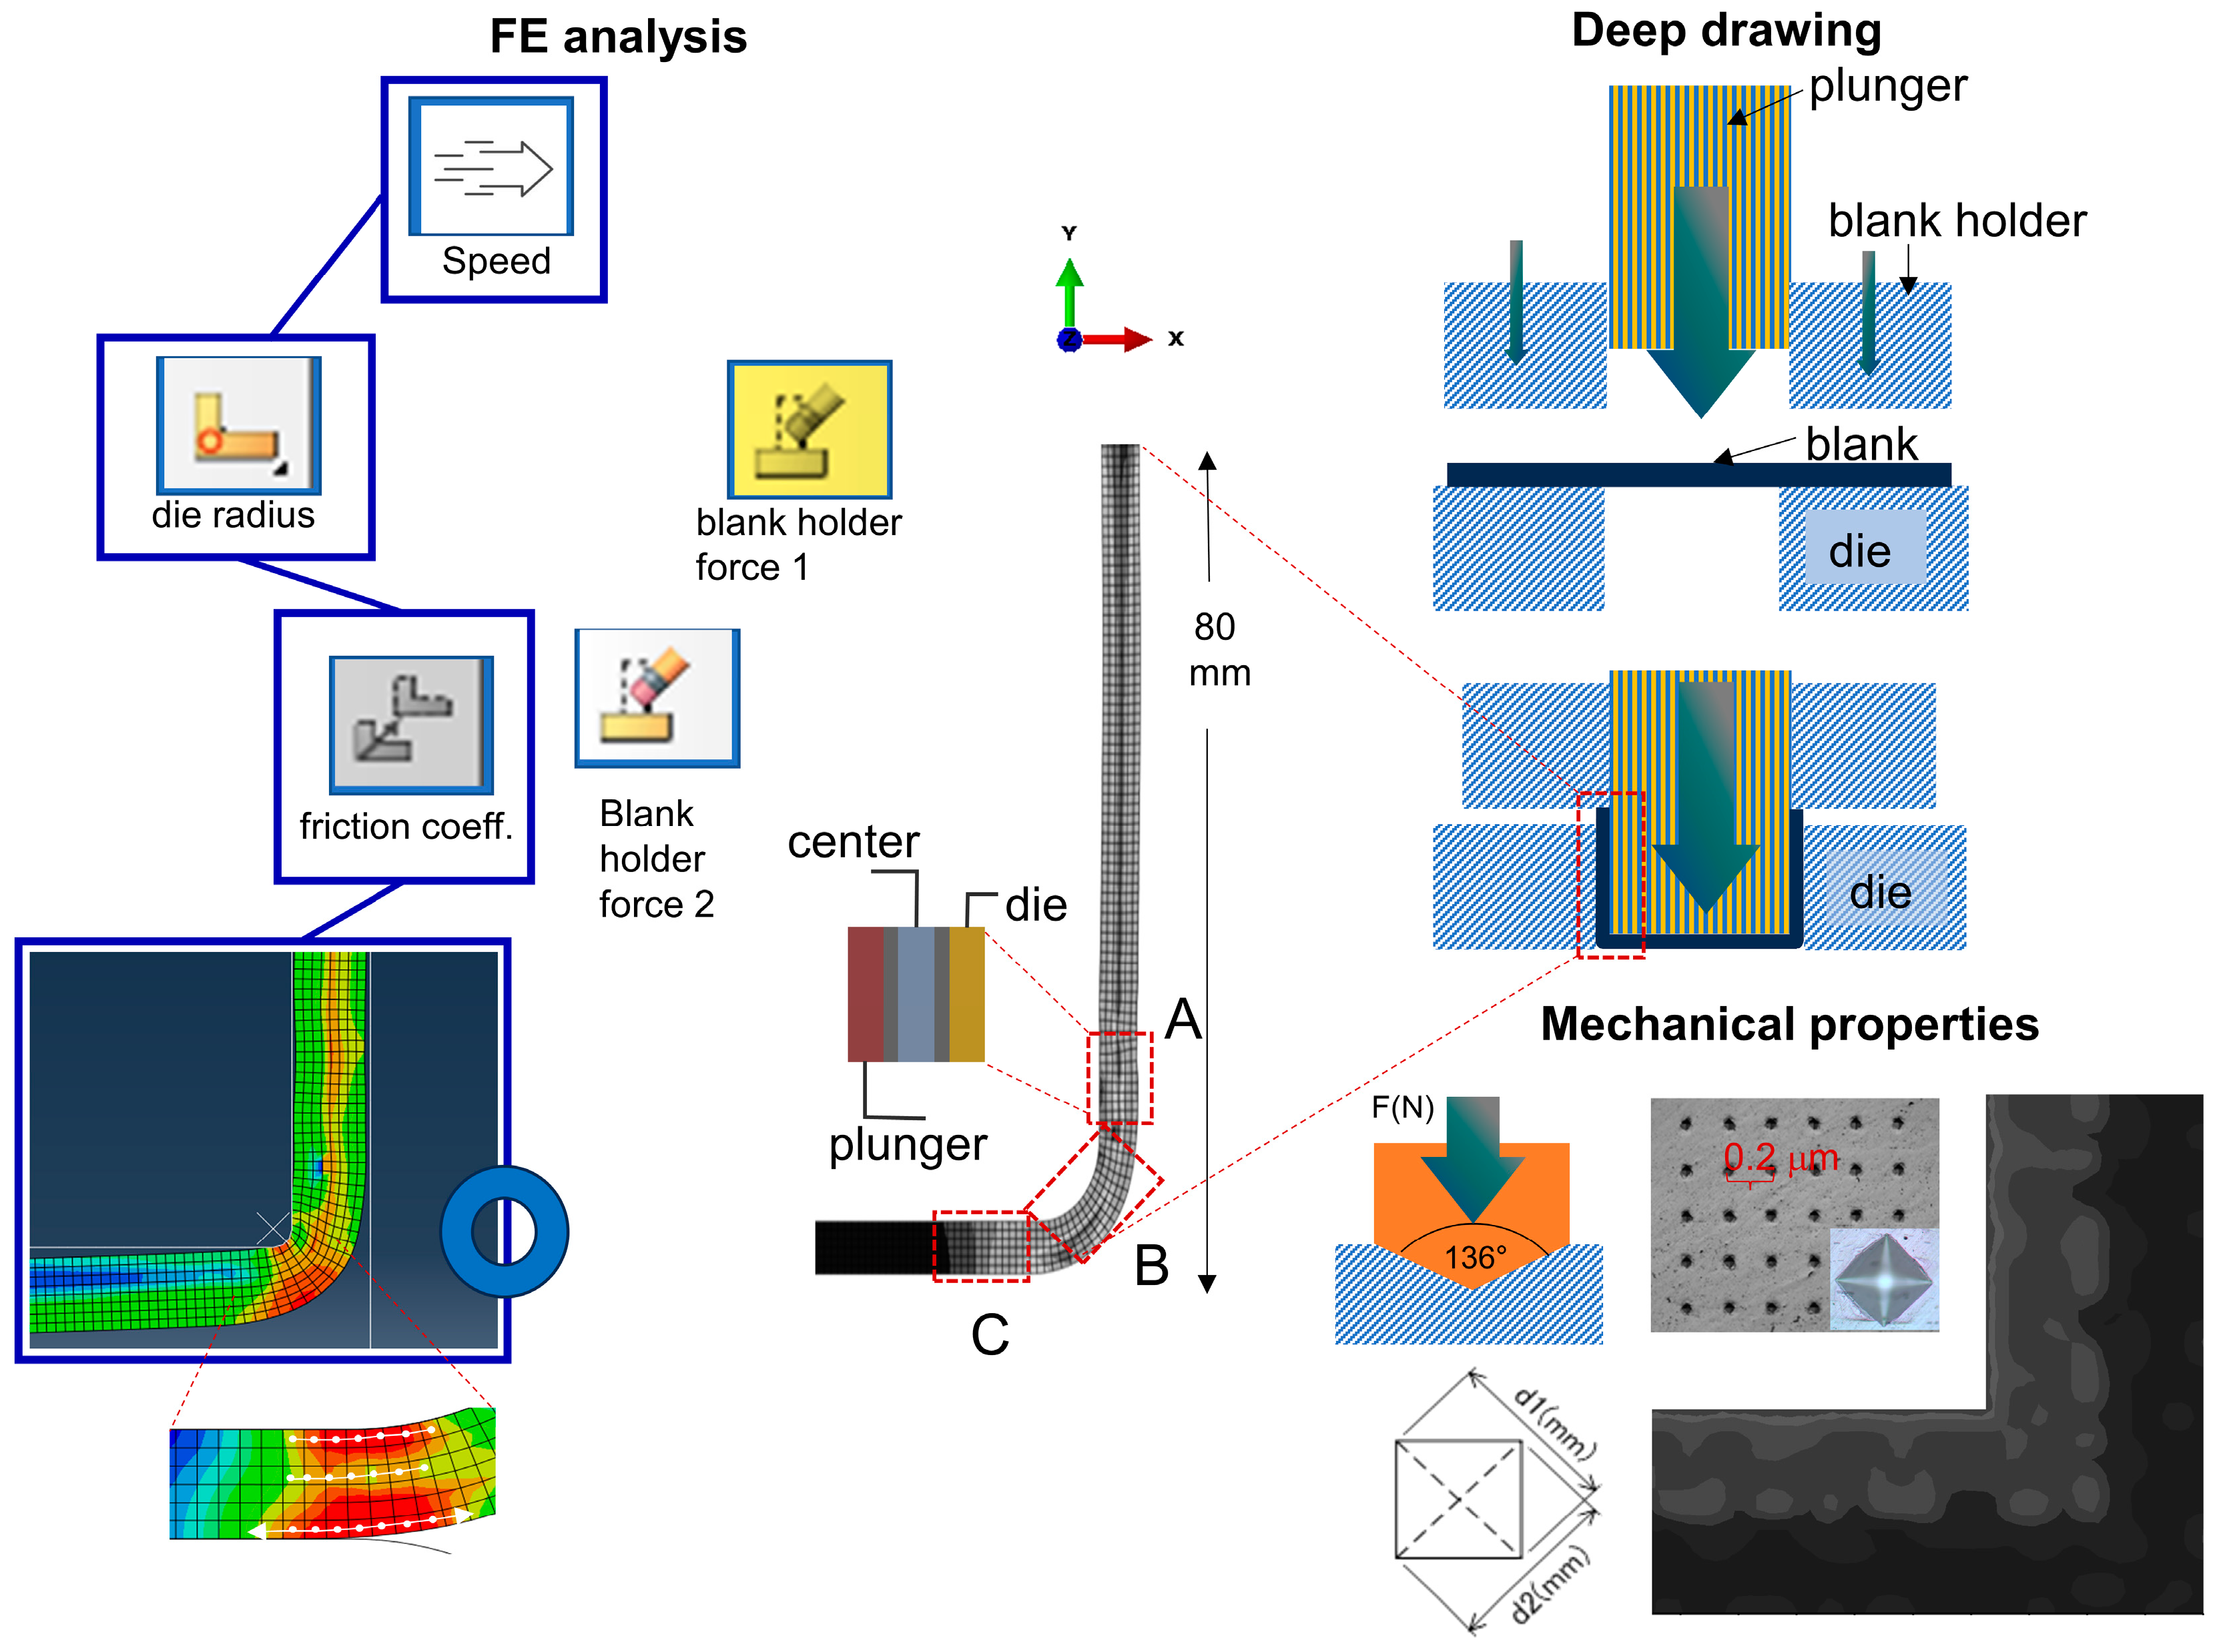
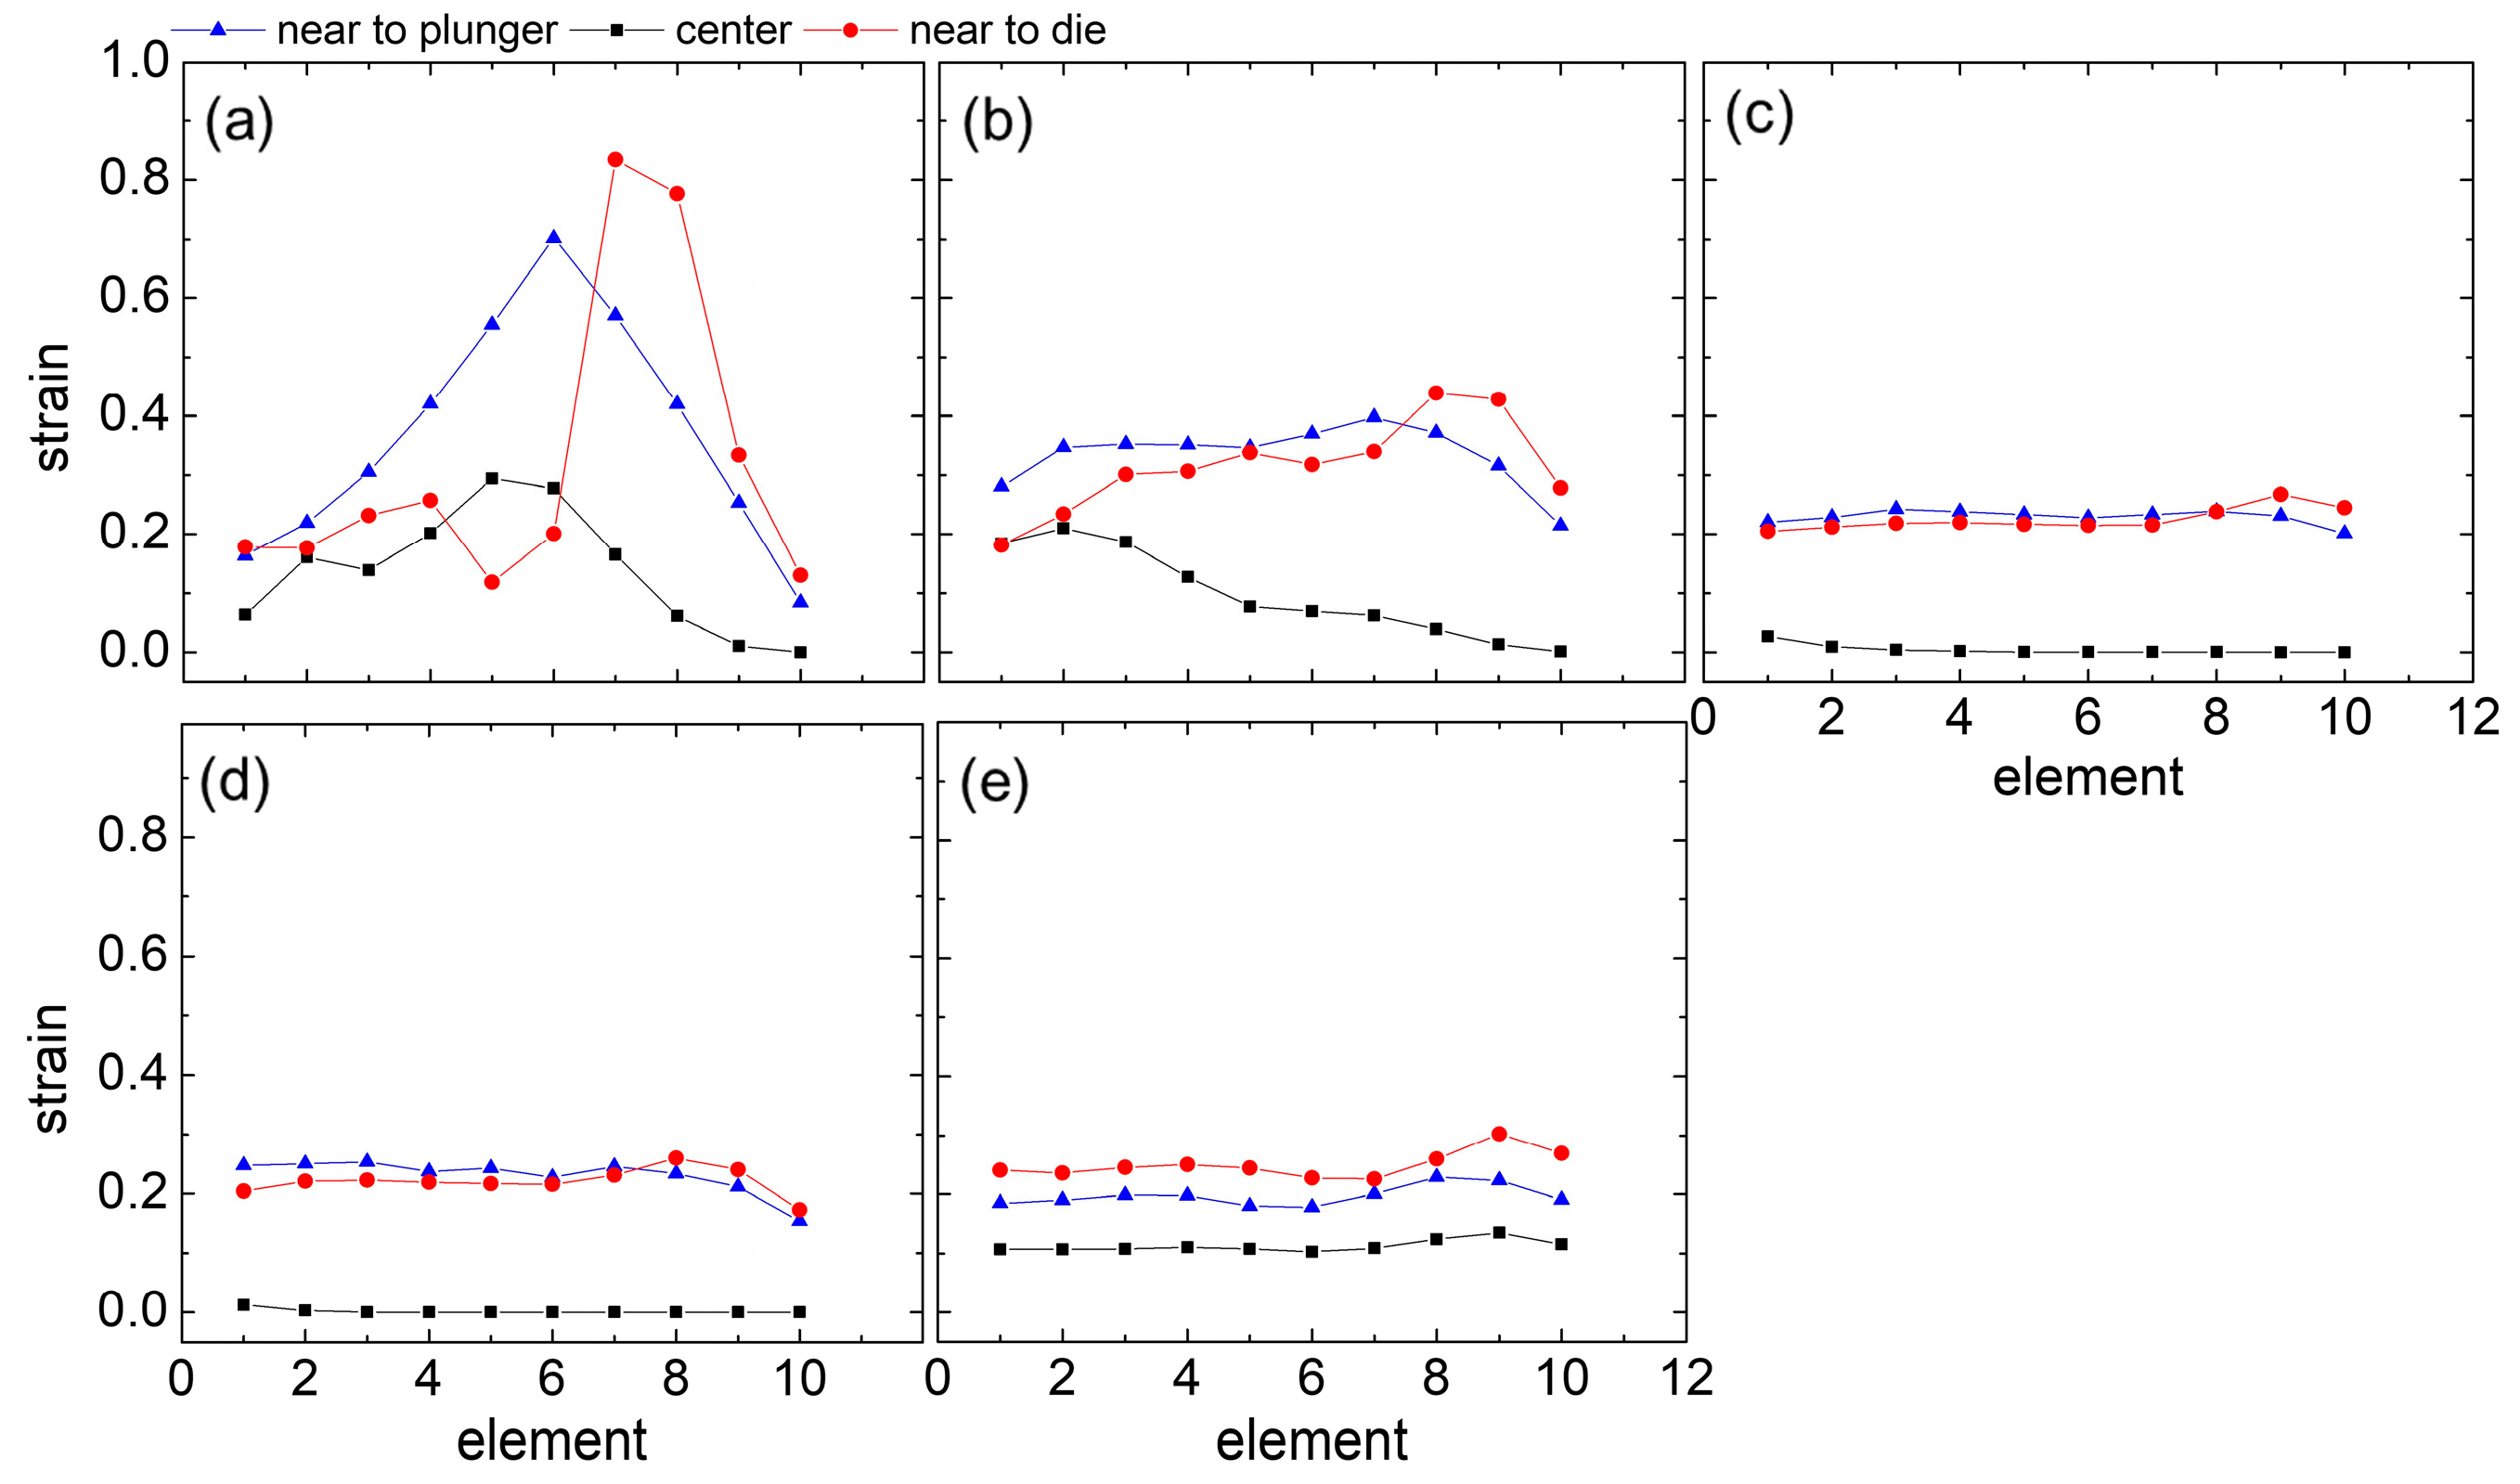
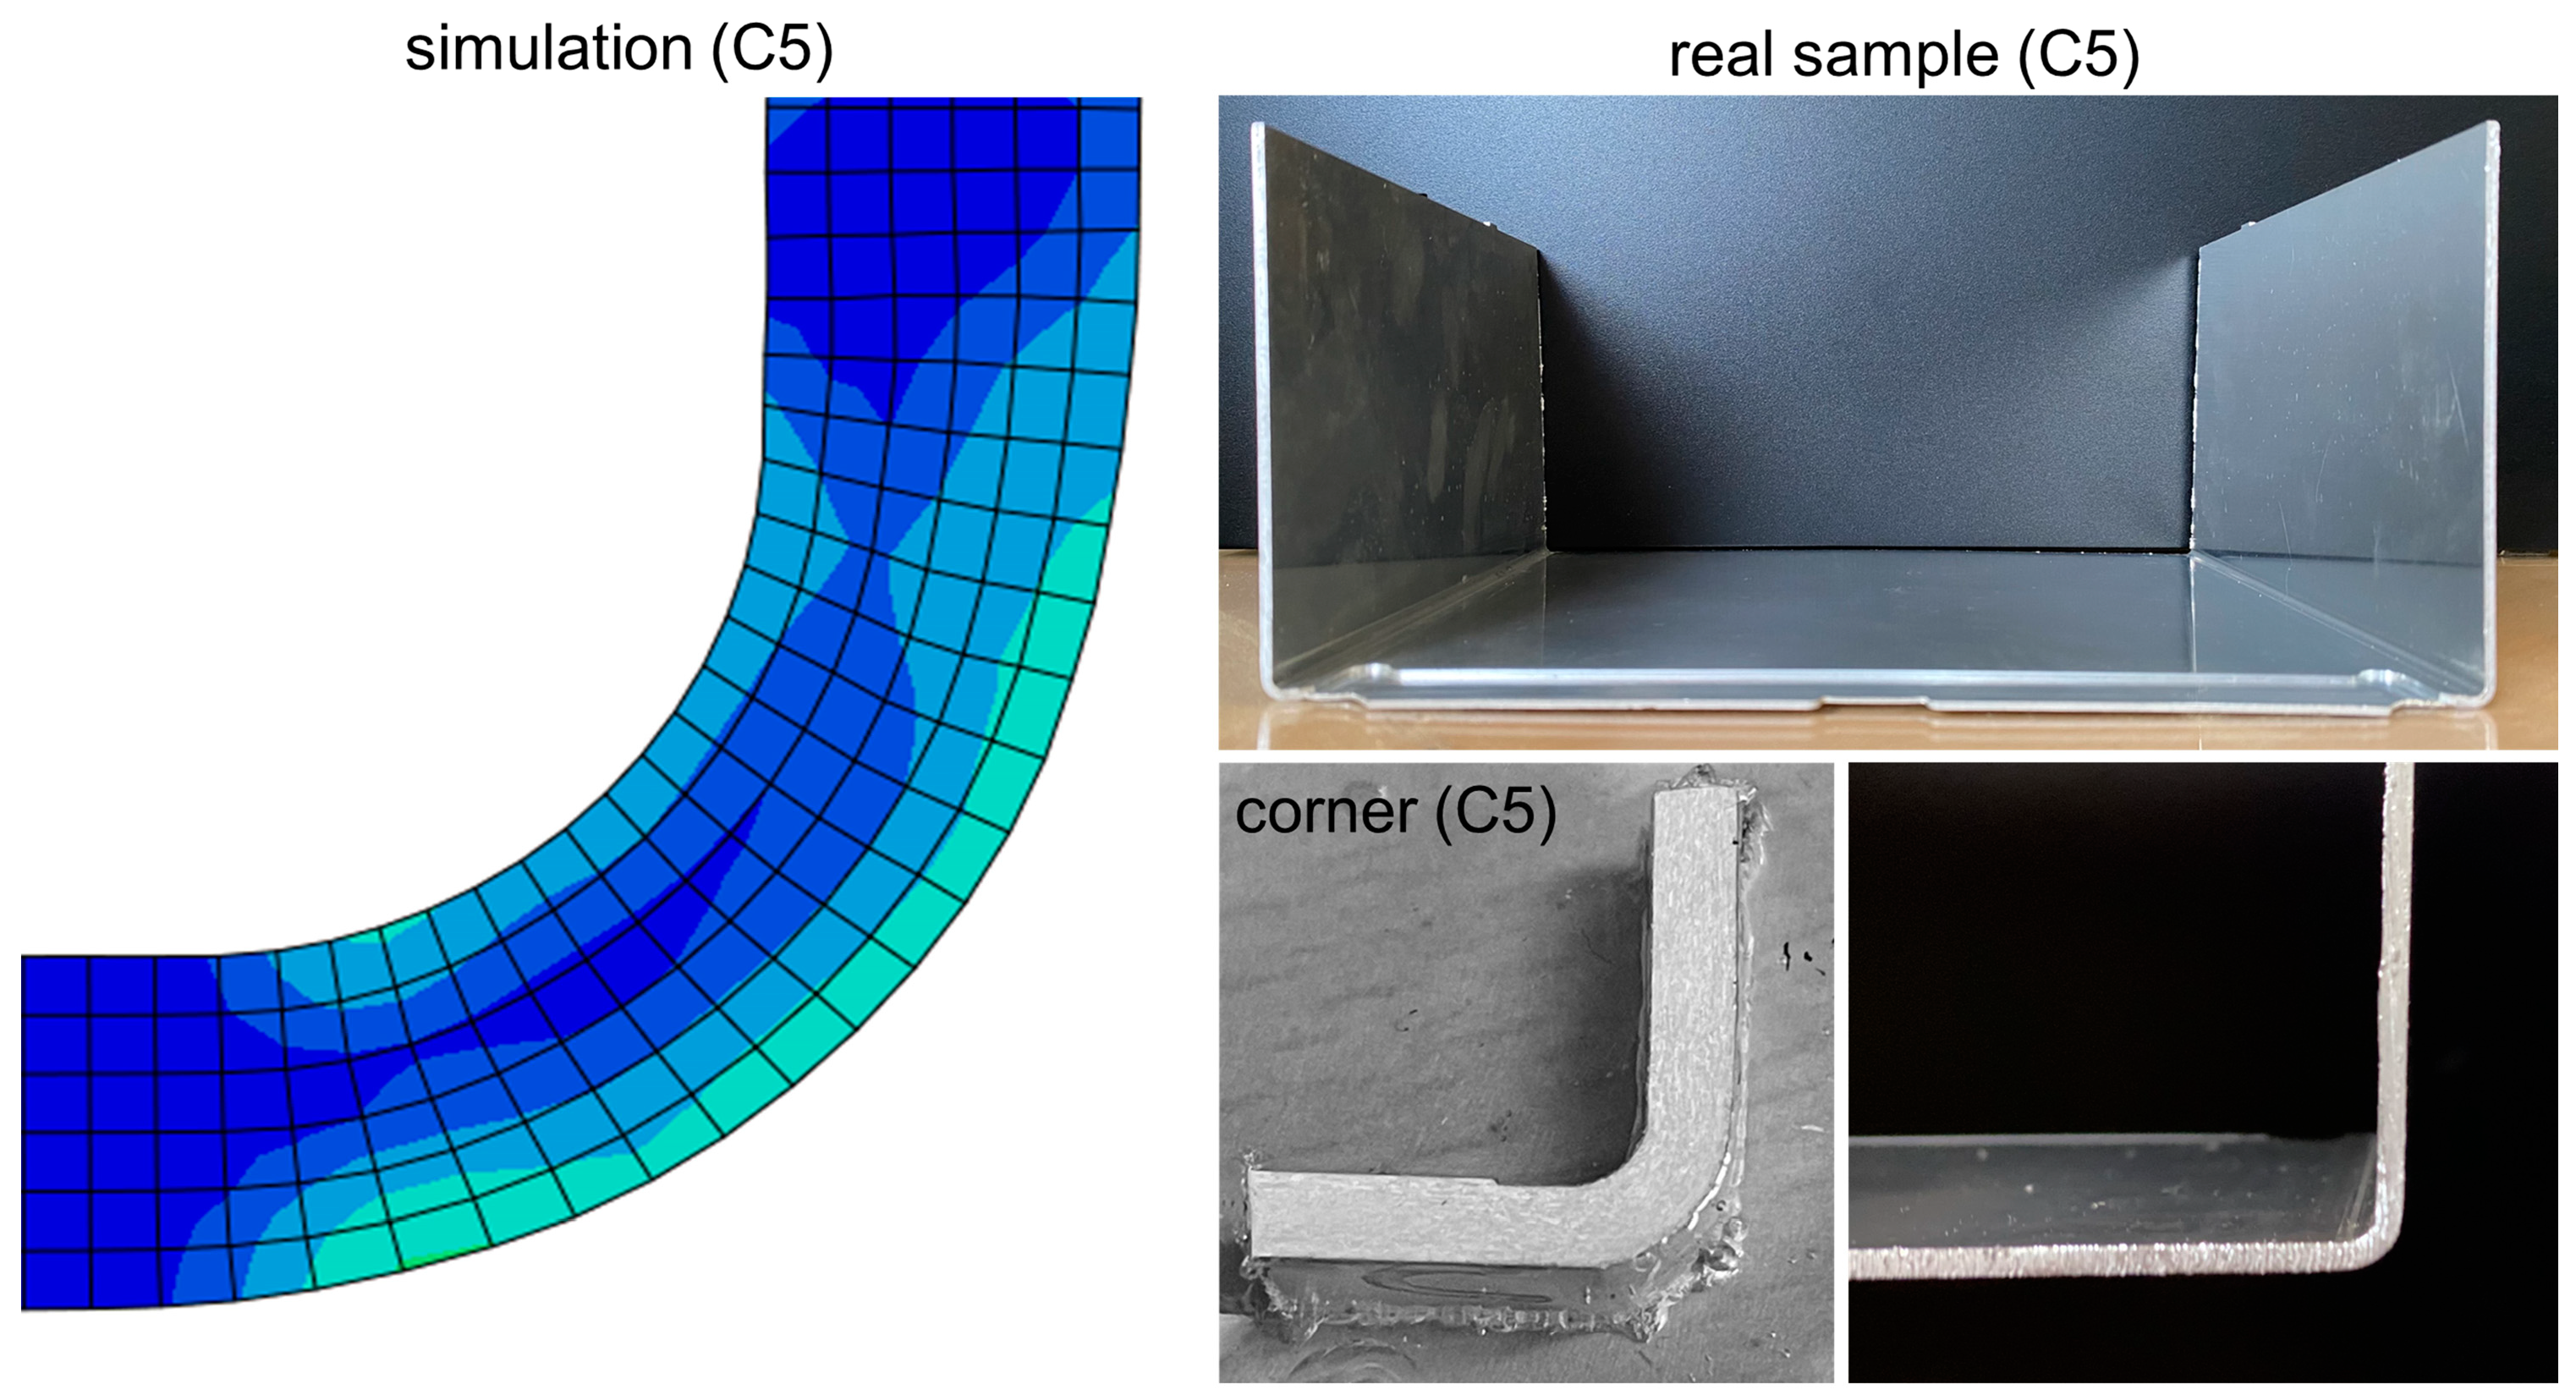
A Finite Element Analysis of Cold Deep Drawing of Al Alloy Considering Friction Condition and Corner Design of Plunger

 , ,
, ,
Abstract
:
1. Introduction
2. Materials and Methods
3. Results
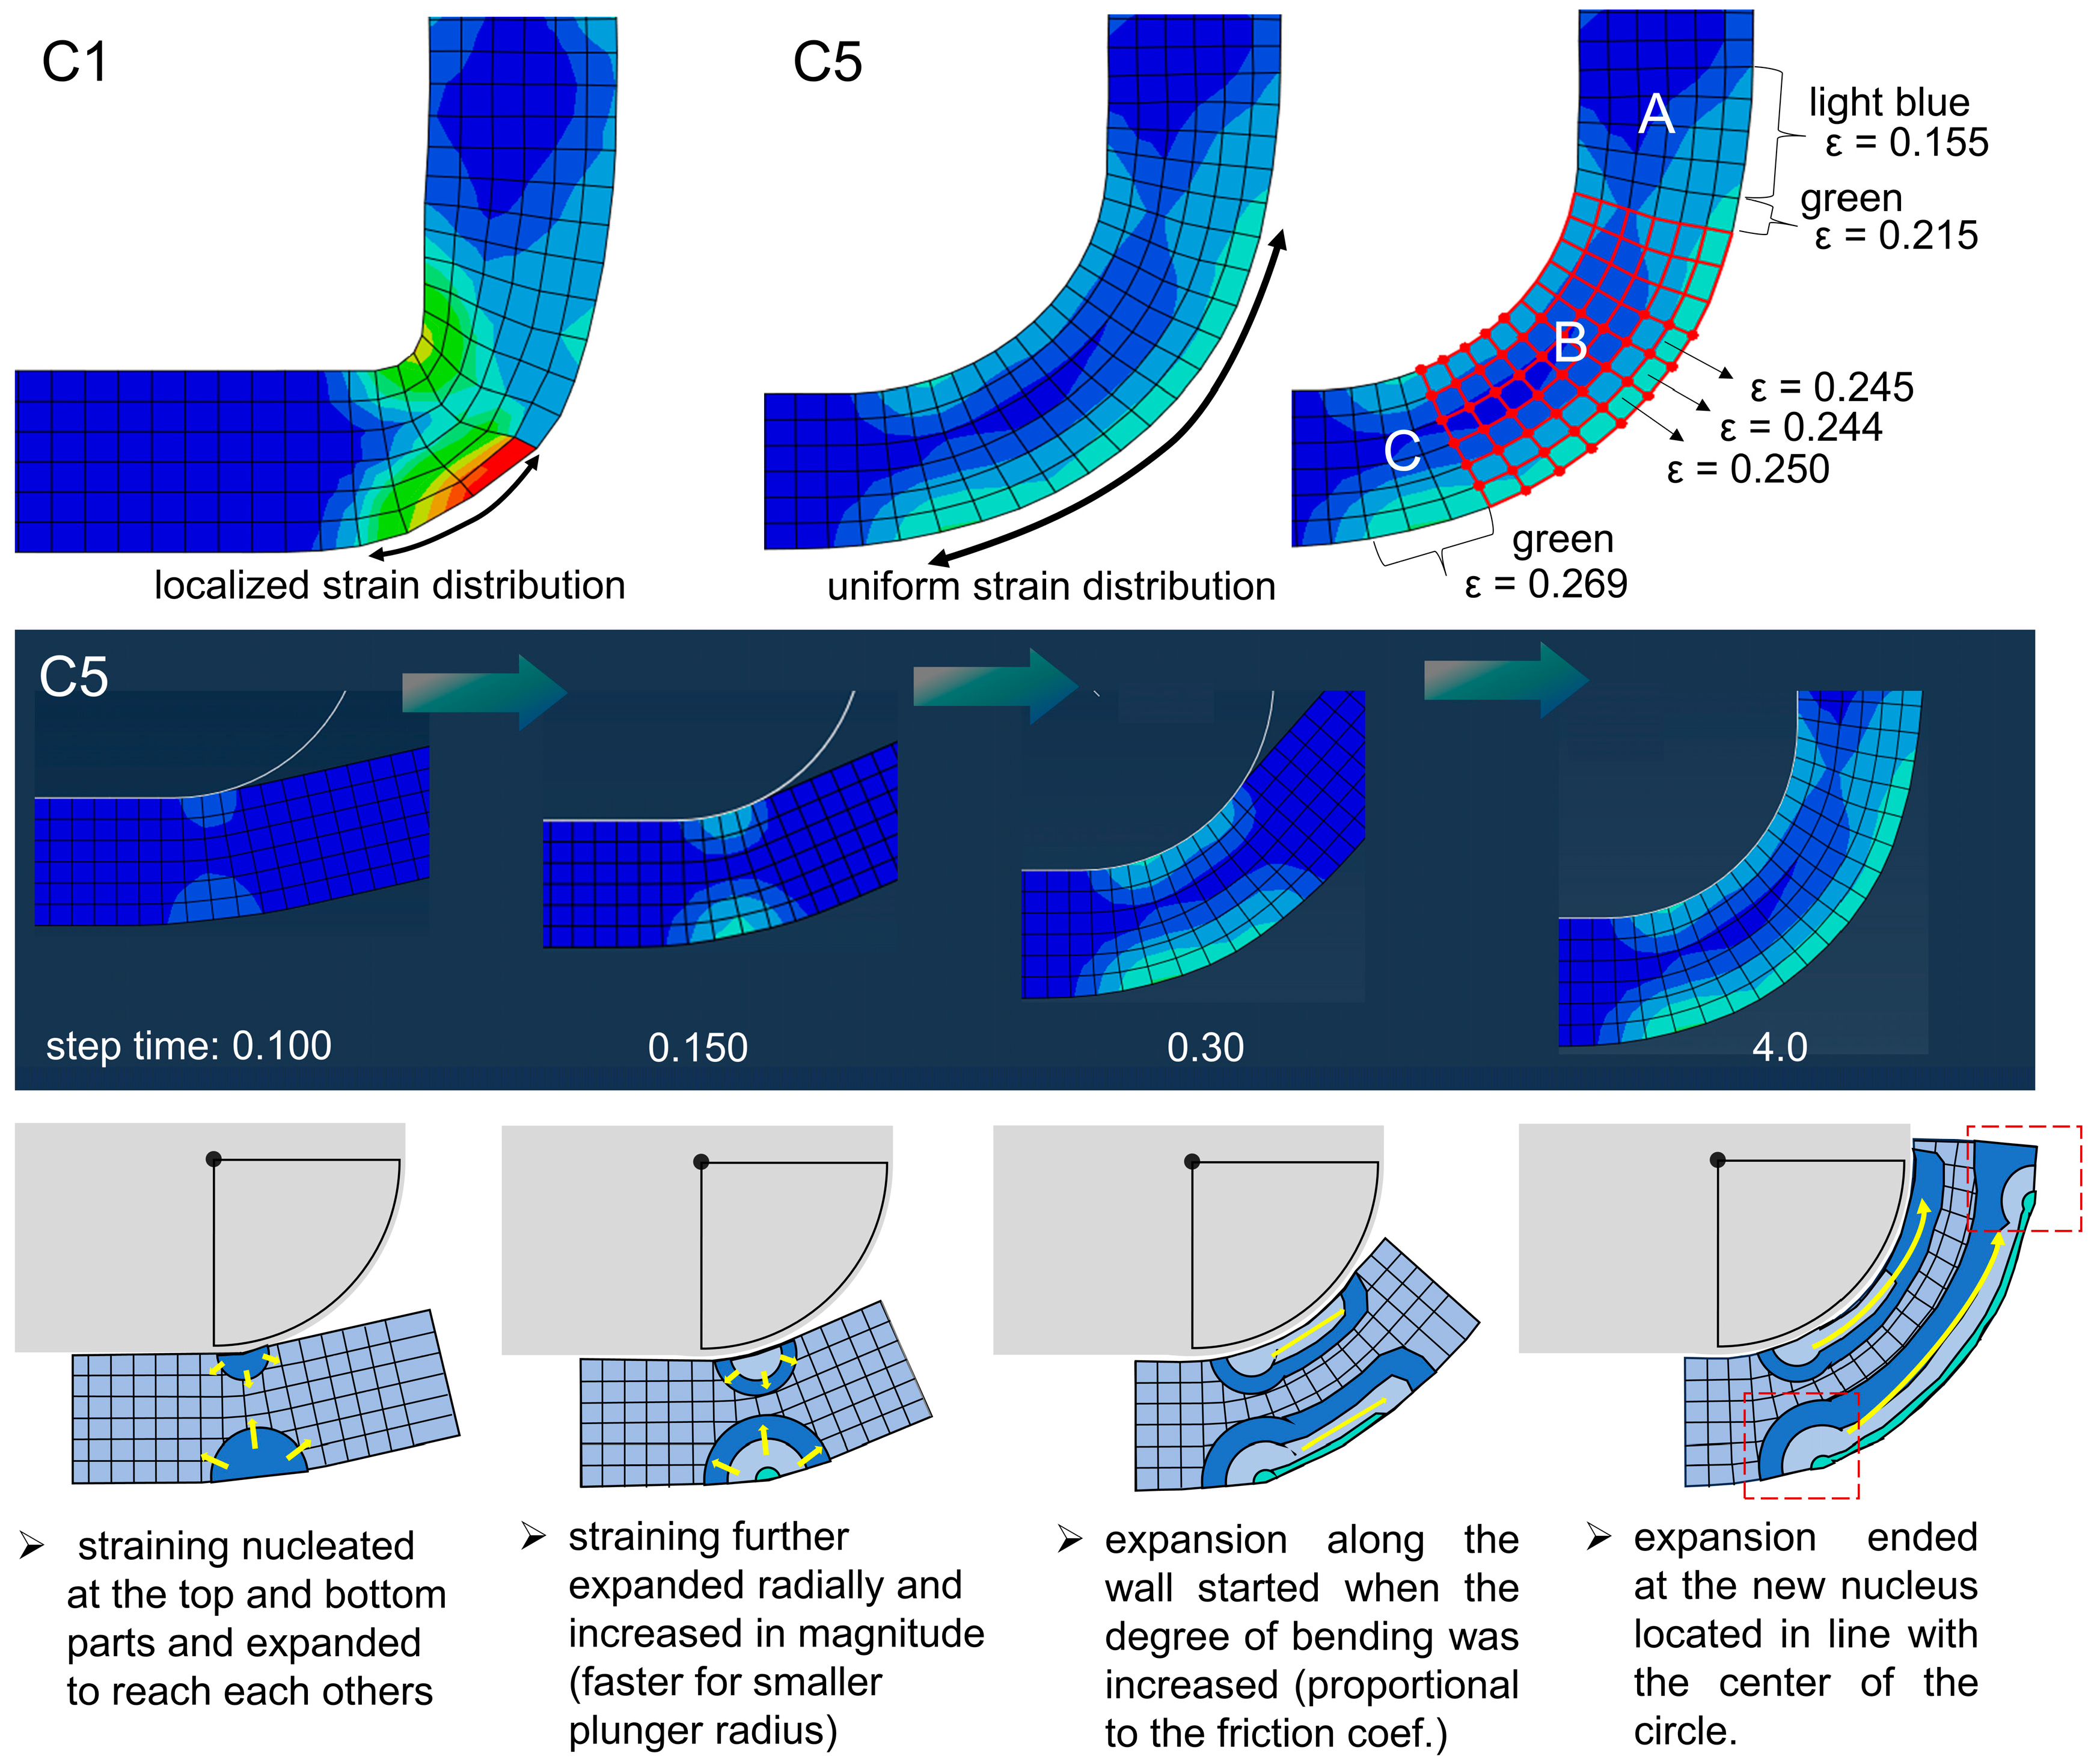
3.1. FEM Analysis
Equivalent Strain Distribution
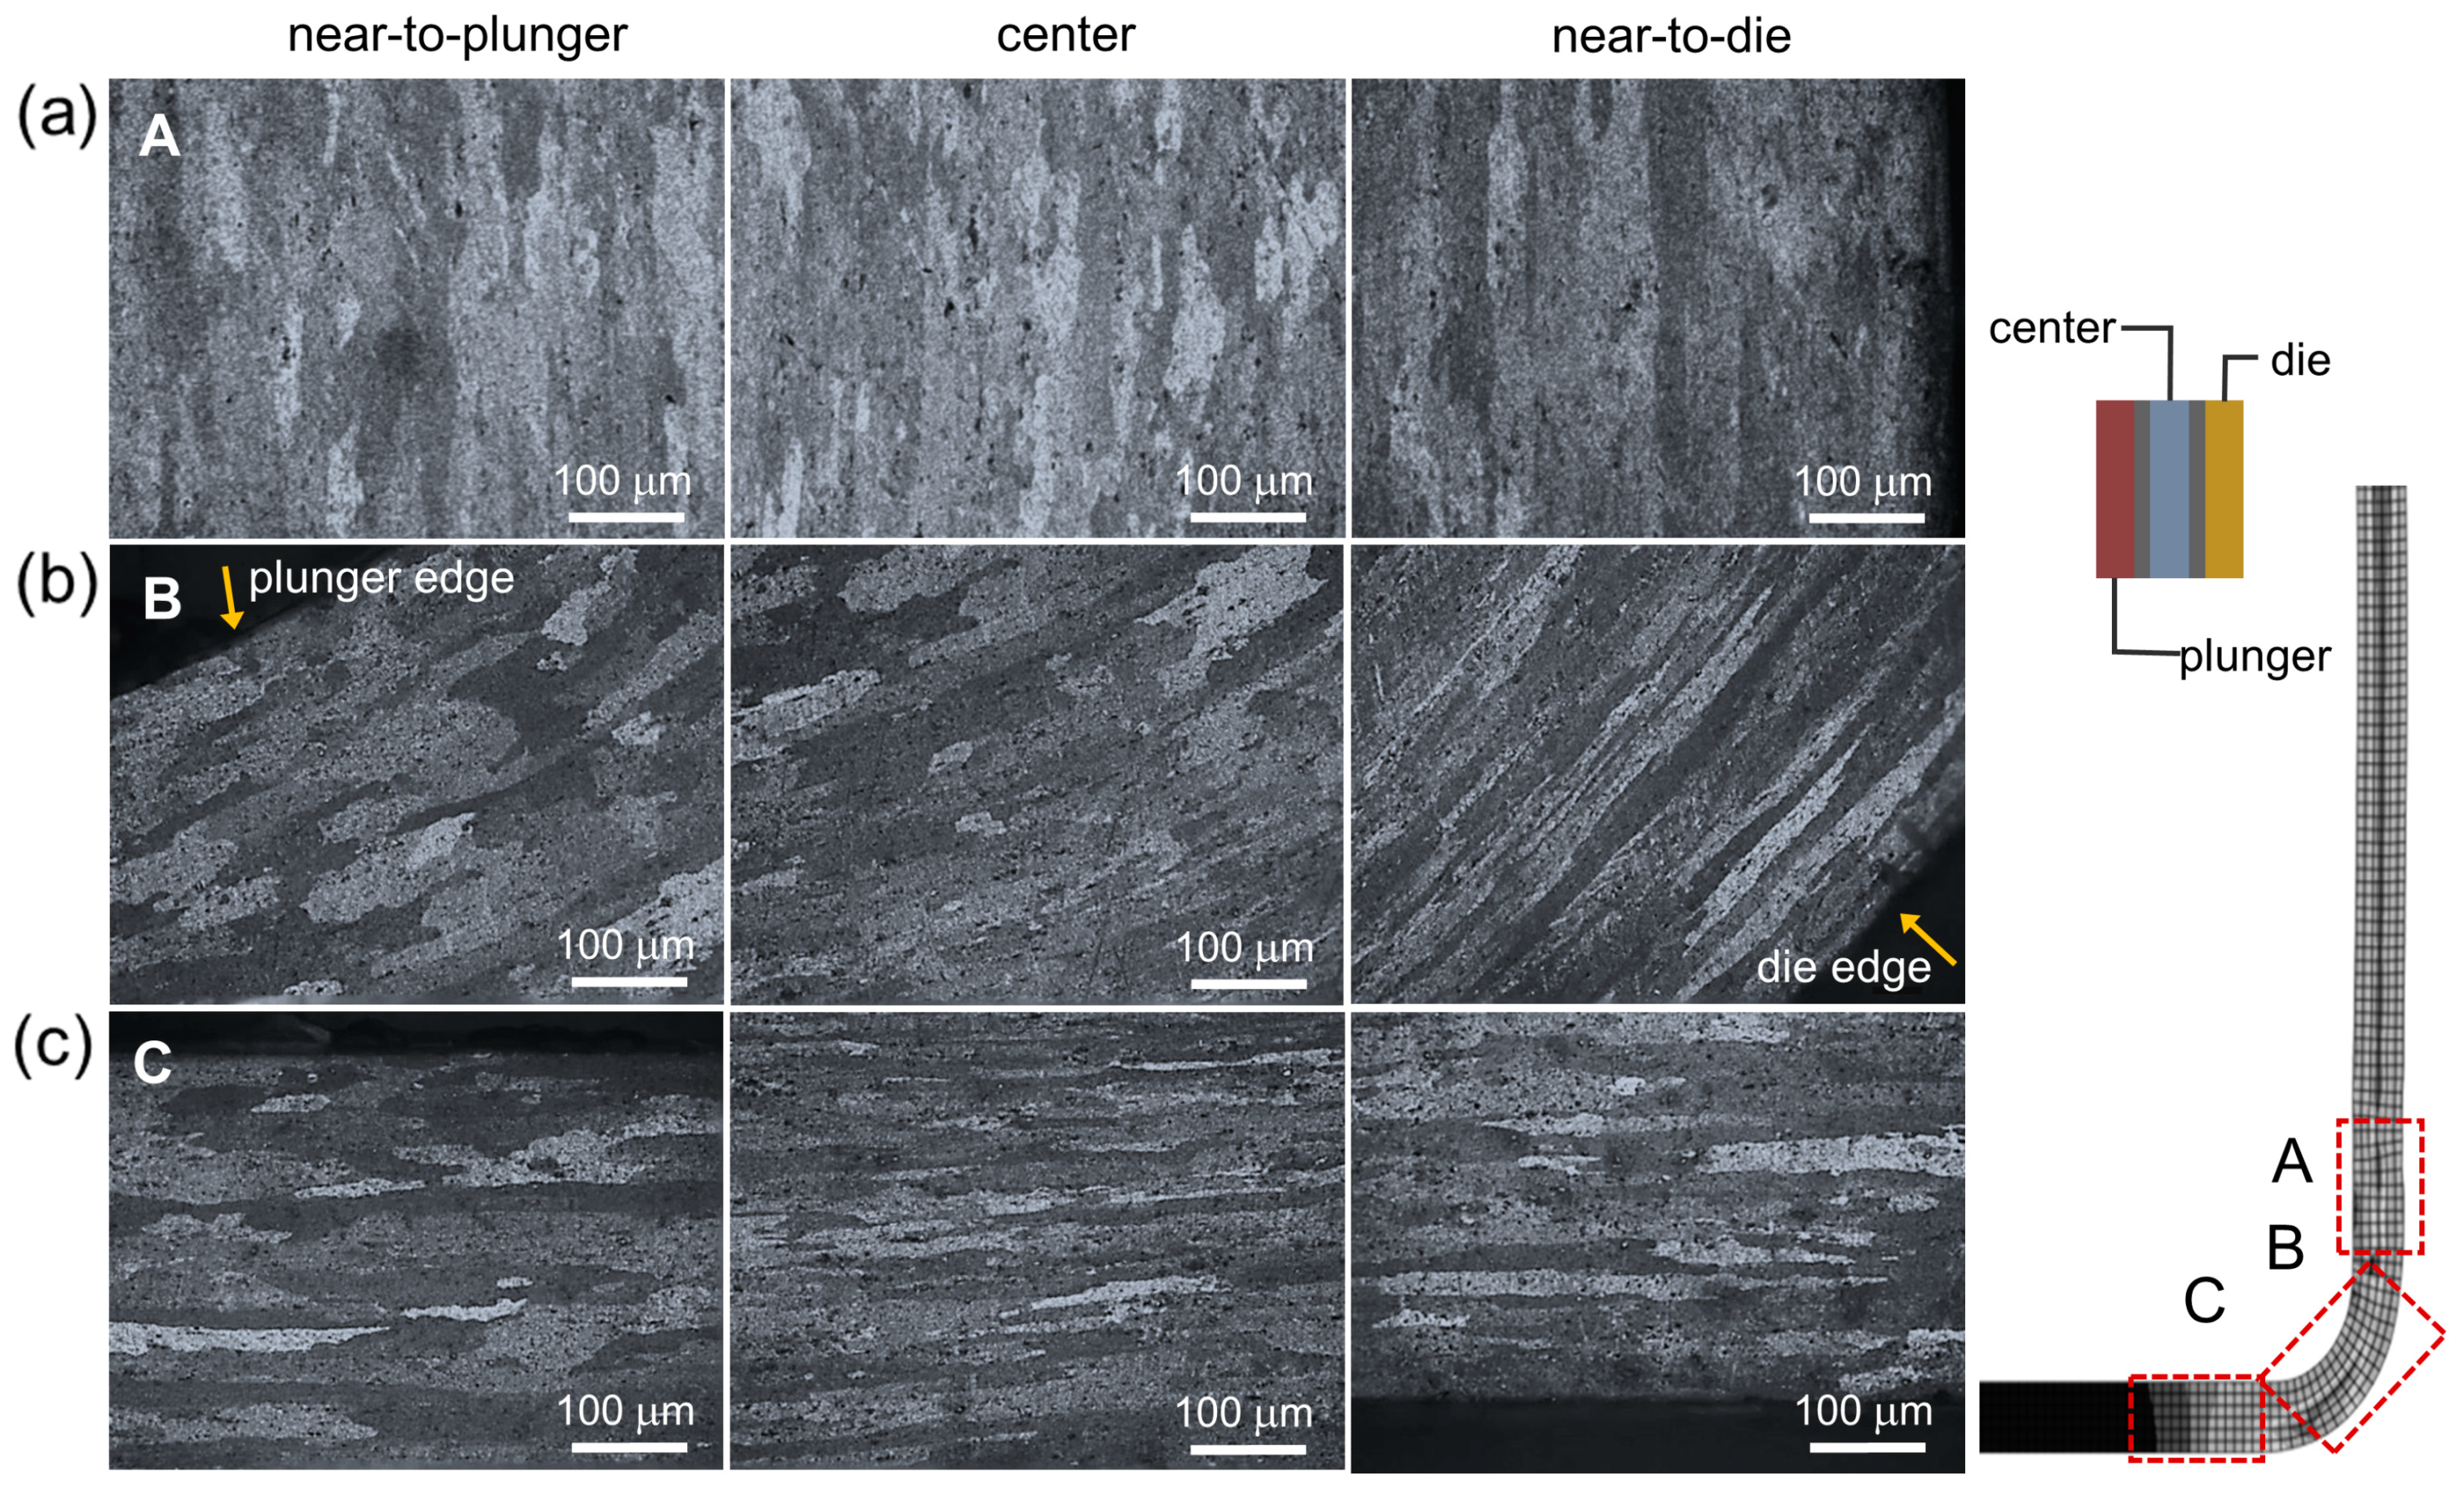
3.2. Surface Morphologies
3.2.1. Surface Roughness
3.2.2. Microstructures
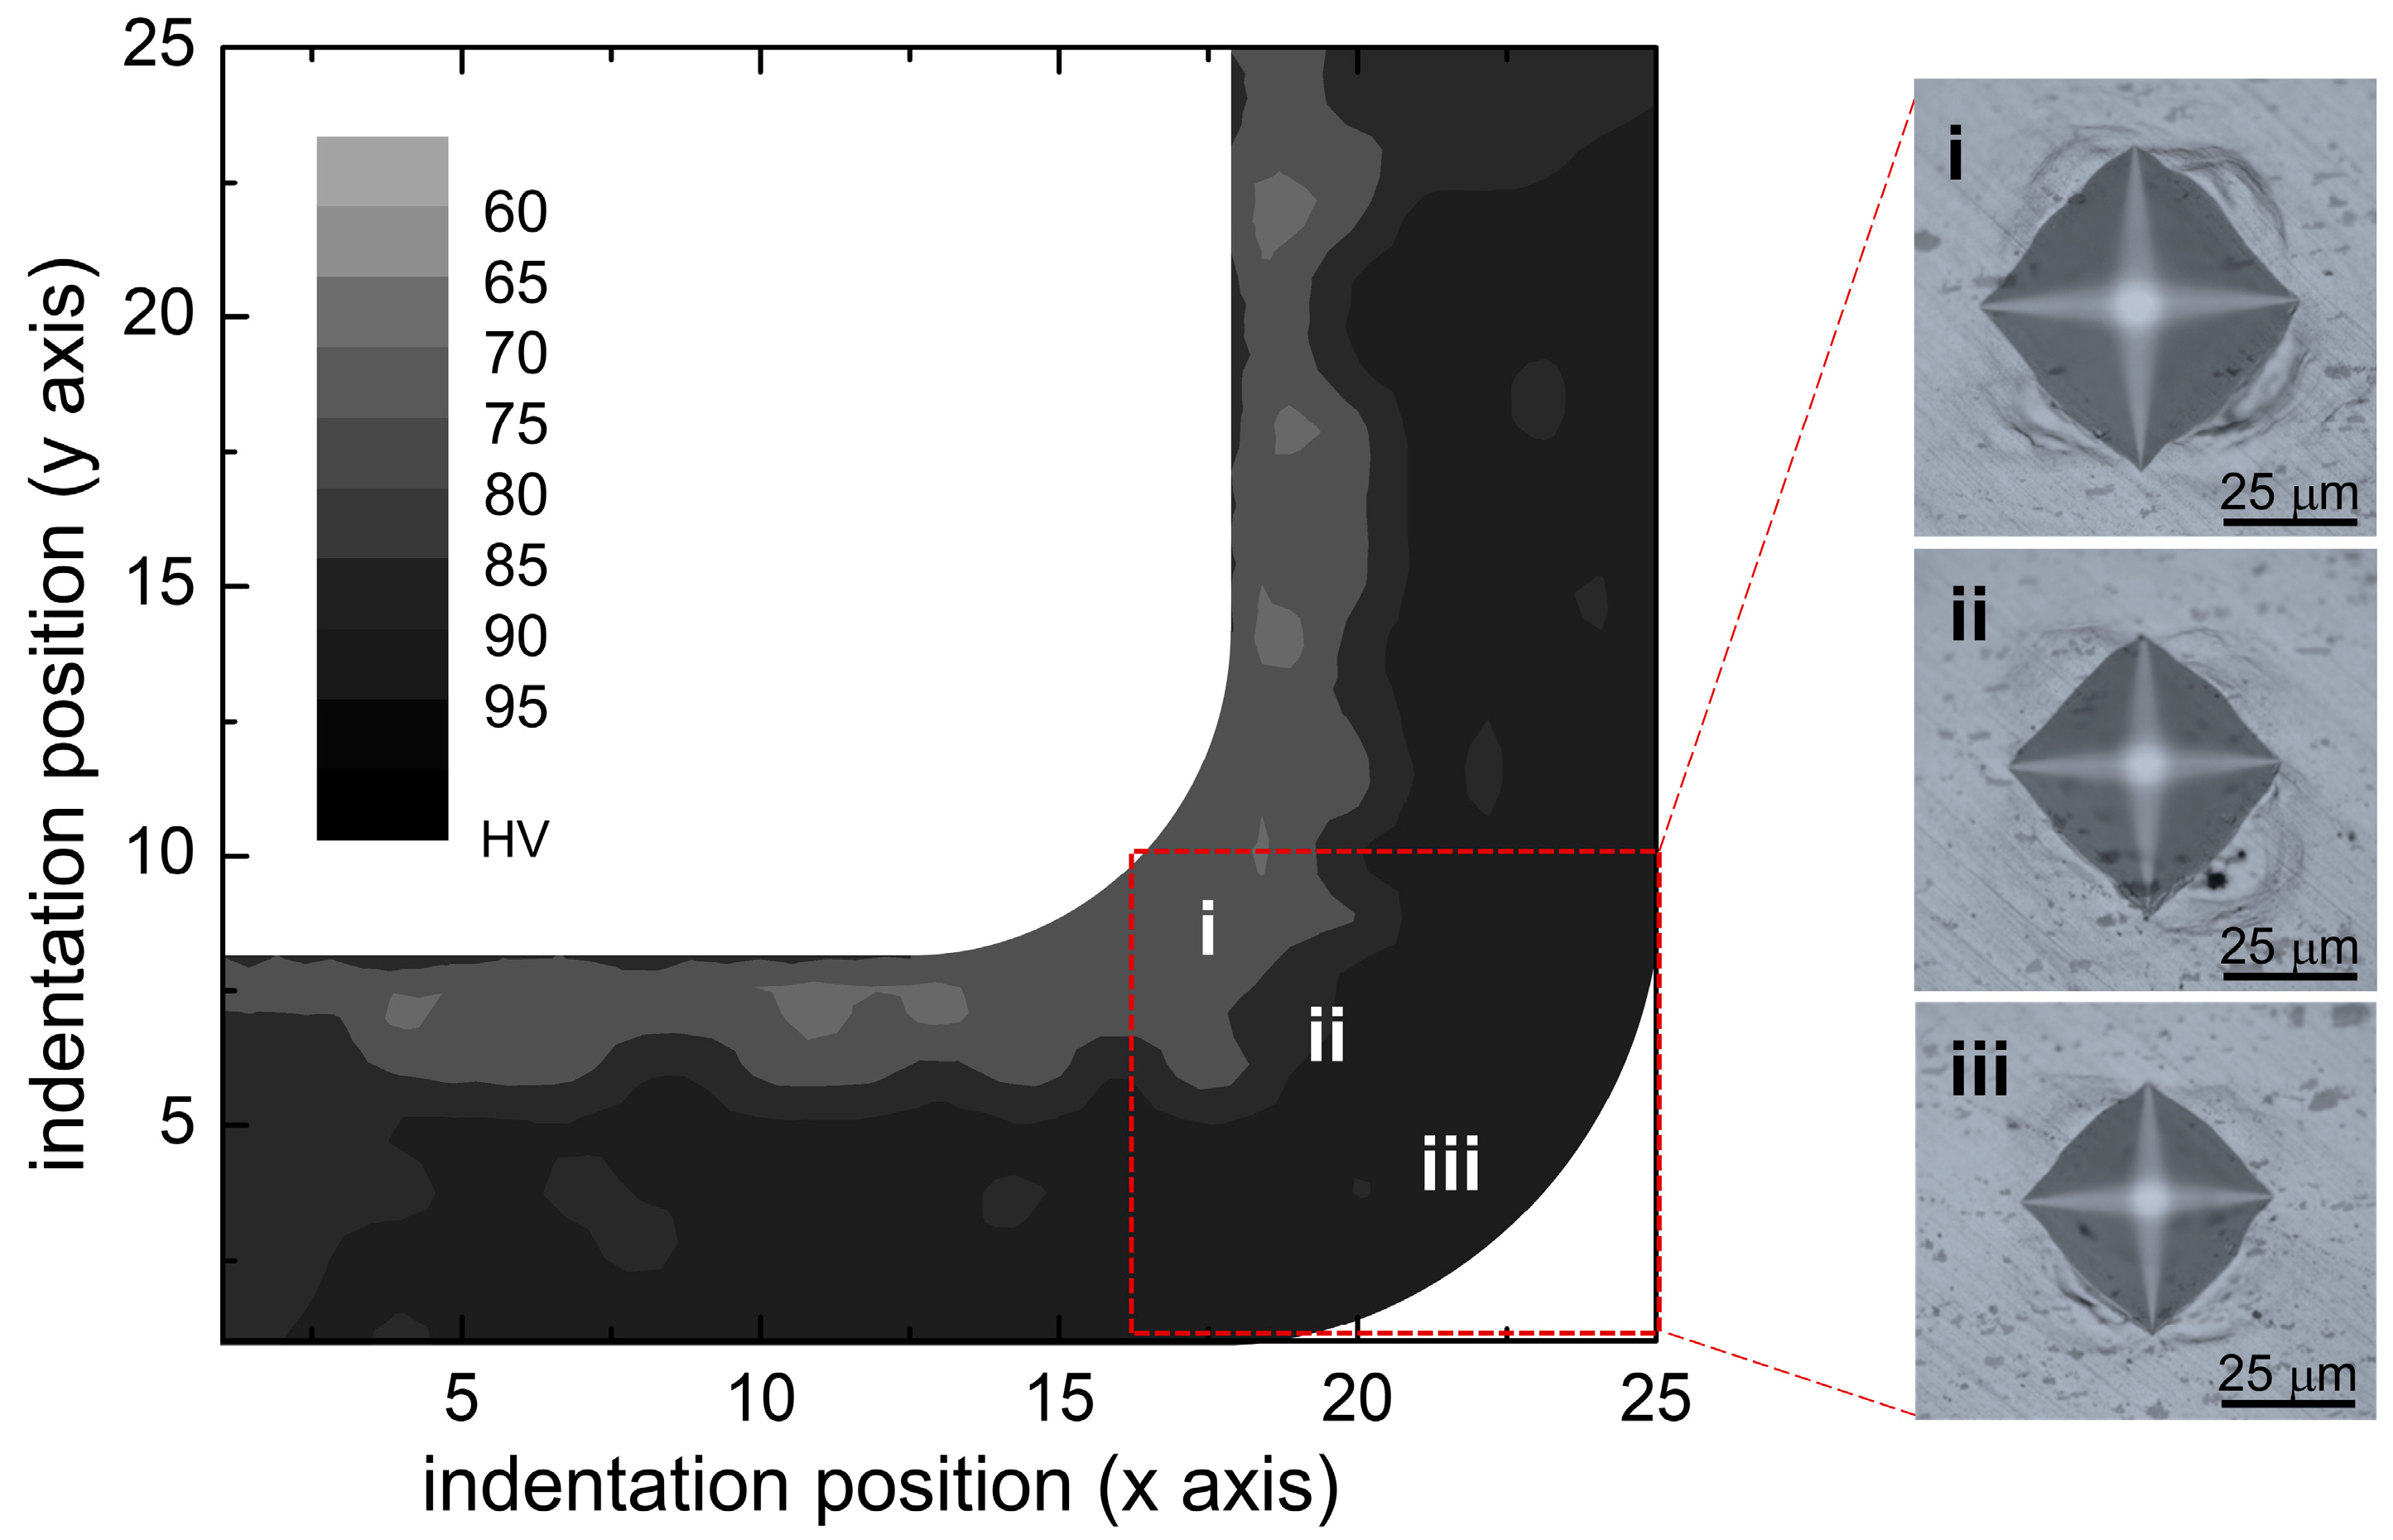
3.3. Mechanical Properties
4. Discussion
5. Conclusions
Author Contributions
Funding
Data Availability Statement
Conflicts of Interest
References
- Schneider, R.; Grant, R.J.; Schlosser, J.M.; Rimkus, W.; Radlmayr, K.; Grabner, F.; Maier, C. An Investigation of the Deep Drawing Behavior of Automotive Aluminum Alloys at Very Low Temperatures. Metall. Mater. Trans. A Phys. Metall. Mater. Sci. 2020, 51, 1123–1133. [Google Scholar] [CrossRef]
- Ramulu, P.J. Aluminum Alloys Behavior during Forming; IntechOpen: London, UK, 2019; ISBN 978-1-78984-514-3. [Google Scholar]
- Benedyk, J.C. International Temper Designation Systems for Wrought Aluminum Alloys: Part I—Strain Hardenable (H Temper) Aluminum Alloys. Light Met. Age 2009, 67, 26–30. [Google Scholar]
- Aamir, M.; Giasin, K.; Tolouei-Rad, M.; Vafadar, A. A Review: Drilling Performance and Hole Quality of Aluminium Alloys for Aerospace Applications. J. Mater. Res. Technol. 2020, 9, 12484–12500. [Google Scholar] [CrossRef]
- Ahmed, M.M.Z.; El-Sayed Seleman, M.M.; Sobih, A.M.E.S.; Bakkar, A.; Albaijan, I.; Touileb, K.; Abd El-Aty, A. Friction Stir-Spot Welding of AA5052-H32 Alloy Sheets: Effects of Dwell Time on Mechanical Properties and Microstructural Evolution. Materials 2023, 16, 2818. [Google Scholar] [CrossRef] [PubMed]
- Vollertsen, F.; Hu, Z.; Niehoff, H.S.; Theiler, C. State of the Art in Micro Forming and Investigations into Micro Deep Drawing. J. Mater. Process. Technol. 2004, 151, 70–79. [Google Scholar] [CrossRef]
- Hattalli, V.L.; Srivatsa, S.R. Sheet Metal Forming Processes—Recent Technological Advances. Mater. Today Proc. 2018, 5, 2564–2574. [Google Scholar] [CrossRef]
- Dalong, L.; Yanting, L.; Enlin, Y.; Yi, H.; Feng, L. Theoretical and Experimental Study of the Drawing Force under a Current Pulse. Int. J. Adv. Manuf. Technol. 2018, 97, 1047–1051. [Google Scholar] [CrossRef]
- Becker, N.; Pöhlandt, K.; Lange, K. Improvement of the Plane-Strain Compression Test for Determining Flow Curves. CIRP Ann.-Manuf. Technol. 1989, 38, 227–230. [Google Scholar] [CrossRef]
- Singh, D.; Yousefi, R.; Boroushaki, M. Identification of Optimum Parameters of Deep Drawing of a Cylindrical Workpiece Using Neural Network and Genetic Algorithm. World Acad. Sci. Eng. Technol. 2011, 78, 211–217. [Google Scholar]
- Colgan, M.; Monaghan, J. Deep Drawing Process: Analysis and Experiment. J. Mater. Process. Technol. 2003, 132, 35–41. [Google Scholar] [CrossRef]
- Yusop, N.M.; Abdullah, A.B. Evaluation of Square Deep Drawn AA6061-T6 Blank Based on Thinning Pattern. IOP Conf. Ser. Mater. Sci. Eng. 2019, 670, 8–14. [Google Scholar] [CrossRef]
- Horton, P.M.; Allwood, J.M.; Cleaver, C.; Nagy-Sochacki, A. An Experimental Analysis of the Relationship between the Corner, Die and Punch Radii in Forming Isolated Flanged Shrink Corners from Al 5251. J. Mater. Process. Technol. 2020, 278, 116486. [Google Scholar] [CrossRef]
- Padmanabhan, R.; Oliveira, M.C.; Alves, J.L.; Menezes, L.F. Influence of Process Parameters on the Deep Drawing of Stainless Steel. Finite Elem. Anal. Des. 2007, 43, 1062–1067. [Google Scholar] [CrossRef]
- Liu, W.; Huang, J.; Pang, Y.; Zhu, K.; Li, S.; Ma, J. Multi-Scale Modelling of Evolving Plastic Anisotropy during Al-Alloy Sheet Forming. Int. J. Mech. Sci. 2023, 247, 108168. [Google Scholar] [CrossRef]
- Shahzamanian, M.M.; Wu, P.D. Study of Forming Limit Diagram (FLD) Prediction of Anisotropic Sheet Metals Using Gurson Model in M-K Method. Int. J. Mater. Form. 2021, 14, 1031–1041. [Google Scholar] [CrossRef]
- Shahzamanian, M.M. Anisotropic Gurson-Tvergaard-Needleman Plasticity and Damage Model for Finite Element Analysis of Elastic-Plastic Problems. Int. J. Numer. Methods Eng. 2018, 115, 1527–1551. [Google Scholar] [CrossRef]
- Takuda, H.; Mori, K.; Masuda, I.; Abe, Y.; Matsuo, M. Finite Element Simulation of Warm Deep Drawing of Aluminium Alloy Sheet When Accounting for Heat Conduction. J. Mater. Process. Technol. 2002, 120, 412–418. [Google Scholar] [CrossRef]
- Kim, H.S.; Koç, M.; Ni, J. Development of an Analytical Model for Warm Deep Drawing of Aluminum Alloys. J. Mater. Process. Technol. 2008, 197, 393–407. [Google Scholar] [CrossRef]
- Hou, J.; Deng, P.; Wang, S.; Xu, H.; Shi, Y. Study on Formability and Microstructure Evolution of Hot Deep Drawing Manufactured 7005 Aluminum Alloy Sheet Metal. Mater. Today Commun. 2023, 36, 106794. [Google Scholar] [CrossRef]
- Szlosarek, R.; Holzmüller, P.; Kröger, M. Analyzing the Fretting Fatigue of Bolt Joints by Experiments and Finite Element Analysis. Lubricants 2023, 11, 348. [Google Scholar] [CrossRef]
- Barrett, T.J.; Knezevic, M. Deep Drawing Simulations Using the Finite Element Method Embedding a Multi-Level Crystal Plasticity Constitutive Law: Experimental Verification and Sensitivity Analysis. Comput. Methods Appl. Mech. Eng. 2019, 354, 245–270. [Google Scholar] [CrossRef]
- Nesterova, E.V.; Bacroix, B.; Teodosiu, C. Microstructure and Texture Evolution under Strain-Path Changes in Low-Carbon Interstitial-Free Steel. Metall. Mater. Trans. A Phys. Metall. Mater. Sci. 2001, 32, 2527–2538. [Google Scholar] [CrossRef]
- Raju, S.; Ganesan, G.; Karthikeyan, R. Influence of Variables in Deep Drawing of AA 6061 Sheet. Trans. Nonferrous Met. Soc. China 2010, 20, 1856–1862. [Google Scholar] [CrossRef]
- Kishor, N.; Ravi Kumar, D. Optimization of Initial Blank Shape to Minimize Earing in Deep Drawing Using Finite Element Method. J. Mater. Process. Technol. 2002, 130–131, 20–30. [Google Scholar] [CrossRef]
- Edwards, T.E.J.; Di Gioacchino, F.; Goodfellow, A.J.; Mohanty, G.; Wehrs, J.; Michler, J.; Clegg, W.J. Transverse Deformation of a Lamellar TiAl Alloy at High Temperature by in Situ Microcompression. Acta Mater. 2019, 166, 85–99. [Google Scholar] [CrossRef]
- Ikumapayi, O.M.; Afolalu, S.A.; Kayode, J.F.; Kazeem, R.A.; Akande, S. A Concise Overview of Deep Drawing in the Metal Forming Operation. Mater. Today Proc. 2022, 62, 3233–3238. [Google Scholar] [CrossRef]
- Fan, J.P.; Tang, C.Y.; Tsui, C.P.; Chan, L.C.; Lee, T.C. 3D Finite Element Simulation of Deep Drawing with Damage Development. Int. J. Mach. Tools Manuf. 2006, 46, 1035–1044. [Google Scholar] [CrossRef]
- Zareh-Desari, B.; Davoodi, B.; Vedaei-Sabegh, A. Investigation of Deep Drawing Concept of Multi-Point Forming Process in Terms of Prevalent Defects. Int. J. Mater. Form. 2017, 10, 193–203. [Google Scholar] [CrossRef]
- Reddy, A.C. Formability of High Temperature and High Strain Rate Superplastic Deep Drawing Process for AA2219 Cylindrical Cups. Int. J. Adv. Res. 2015, 10, 1016–1024. [Google Scholar]
- Nie, N.; Su, L.; Deng, G.; Li, H.; Yu, H.; Tieu, A.K. A Review on Plastic Deformation Induced Surface/Interface Roughening of Sheet Metallic Materials. J. Mater. Res. Technol. 2021, 15, 6574–6607. [Google Scholar] [CrossRef]
- Furushima, T.; Tsunezaki, H.; Hirose, Y. Fracture and Surface Roughening Behaviors in Micro Metal Forming. Procedia Manuf. 2018, 15, 1481–1486. [Google Scholar] [CrossRef]
- Tiwari, A.; Almqvist, A.; Persson, B.N.J. Plastic Deformation of Rough Metallic Surfaces. Tribol. Lett. 2020, 68, 129. [Google Scholar] [CrossRef]
- Basak, S.; Prasad, K.S.; Sidpara, A.M.; Panda, S.K. Single Point Incremental Forming of AA6061 Thin Sheet: Calibration of Ductile Fracture Models Incorporating Anisotropy and Post Forming Analyses. Int. J. Mater. Form. 2019, 12, 623–642. [Google Scholar] [CrossRef]
- Loorent, Z.; Ko, Y.G. Effect of Differential Speed Rolling Strain on Microstructure and Mechanical Properties of Nanostructured 5052 Al Alloy. J. Alloys Compd. 2014, 586, S205–S209. [Google Scholar] [CrossRef]
- Bozcheloei, J.E.; Sedighi, M.; Hashemi, R. The Effect of Temperature on the Mechanical Properties and Forming Limit Diagram of Al 5083 Produced by Equal Channel Angular Rolling. Int. J. Adv. Manuf. Technol. 2019, 105, 4389–4400. [Google Scholar] [CrossRef]
- Yang, T.S. Investigation of the Strain Distribution with Lubrication during the Deep Drawing Process. Tribol. Int. 2010, 43, 1104–1112. [Google Scholar] [CrossRef]
- Tiwari, P.R.; Rathore, A.; Bodkhe, M.G. Factors Affecting the Deep Drawing Process—A Review. Mater. Today Proc. 2022, 56, 2902–2908. [Google Scholar] [CrossRef]
- Roizard, X.; Pothier, J.M.; Hihn, J.Y.; Monteil, G. Experimental Device for Tribological Measurement Aspects in Deep Drawing Process. J. Mater. Process. Technol. 2009, 209, 1220–1230. [Google Scholar] [CrossRef]
- Efe, M.; Gwalani, B.; Tao, J.; Song, M.; Kaspar, T.C.; Devaraj, A.; Rohatgi, A. Nanomechanical Scratching Induced Local Shear Deformation and Microstructural Evolution in Single Crystal Copper. Appl. Surf. Sci. 2021, 562, 150132. [Google Scholar] [CrossRef]
- Chen, J.; Wei, H.; Zhang, X.; Peng, Y.; Kong, J.; Wang, K. Flow Behavior and Microstructure Evolution during Dynamic Deformation of 316 L Stainless Steel Fabricated by Wire and Arc Additive Manufacturing. Mater. Des. 2021, 198, 109325. [Google Scholar] [CrossRef]


| Parameters | C1 | C2 | C3 | C4 | C5 |
|---|---|---|---|---|---|
| Speed (mm/s) | 20 | 20 | 20 | 20 | 20 |
| Radius (mm) | 0 | 1.5 | 3.0 | 3.0 | 3.0 |
| Friction | 0.05 | 0.05 | 0.05 | 0 | 0.1 |
| Time (s) | Strain ε | Strain Rate | Near the Plunger Element | Near the Die Element | |
|---|---|---|---|---|---|
| C1 | 2.1 | 0.096 | 2.20 |  |  |
| 2.4 | 0.78 |  PE11 = −0.411 PE22 = −0.066 PE12 = −0.05 |  PE11 = 0.358 PE22 = 0.076 PE12 = 1.187 | ||
| C2 | 2.1 | 0.041 | 0.90 |  |  |
| 2.4 | 0.32 |  PE11 = −0.269 PE22 = −0.042 PE12 = −0.125 |  PE11 = 0.093 PE22 = 0.057 PE12 = 0.482 | ||
| C3 | 2.2 | 0.001 | 0.70 |  |  |
| 2.5 | 0.22 |  PE11 = −0.154 PE22 = −0.05 PE12 = −0.132 |  PE11 = 0.041 PE22 = 0.06 PE12 = 0.329 | ||
| C4 | 2.2 | 0.003 | 0.70 |  |  |
| 2.5 | 0.22 |  PE11 = −0.142 PE22 = −0.08 PE12 = −0.132 |  PE11 = 0.041 PE22 = 0.065 PE12 = 0.333 | ||
| C5 | 2.2 | 0.0042 | 0.77 |  |  |
| 2.5 | 0.245 |  PE11 = −0.139 PE22 = −0.032 PE12 = −0.094 |  PE11 = 0.039 PE22 = 0.079 PE12 = 0.369 |
Disclaimer/Publisher’s Note: The statements, opinions and data contained in all publications are solely those of the individual author(s) and contributor(s) and not of MDPI and/or the editor(s). MDPI and/or the editor(s) disclaim responsibility for any injury to people or property resulting from any ideas, methods, instructions or products referred to in the content. |
© 2023 by the authors. Licensee MDPI, Basel, Switzerland. This article is an open access article distributed under the terms and conditions of the Creative Commons Attribution (CC BY) license (https://creativecommons.org/licenses/by/4.0/).
Share and Cite
Bahanan, W.; Fatimah, S.; Go, J.H.; Oh, J.M.; Kim, M.J.; Kim, M.J.; Kang, J.-H.; Kim, D.-J.; Widiantara, I.P.; Ko, Y.G. A Finite Element Analysis of Cold Deep Drawing of Al Alloy Considering Friction Condition and Corner Design of Plunger. Lubricants 2023, 11, 388. https://doi.org/10.3390/lubricants11090388
Bahanan W, Fatimah S, Go JH, Oh JM, Kim MJ, Kim MJ, Kang J-H, Kim D-J, Widiantara IP, Ko YG. A Finite Element Analysis of Cold Deep Drawing of Al Alloy Considering Friction Condition and Corner Design of Plunger. Lubricants. 2023; 11(9):388. https://doi.org/10.3390/lubricants11090388
Chicago/Turabian StyleBahanan, Warda, Siti Fatimah, Jae Hoon Go, Jeong Moo Oh, Min Jun Kim, Myung Jae Kim, Jee-Hyun Kang, Dong-Ju Kim, I Putu Widiantara, and Young Gun Ko. 2023. "A Finite Element Analysis of Cold Deep Drawing of Al Alloy Considering Friction Condition and Corner Design of Plunger" Lubricants 11, no. 9: 388. https://doi.org/10.3390/lubricants11090388