Effect of Speed and Number of Sliding Cycles on the Film Formation Behavior of Fluorine-Based Grease


1
Department of Mechanical Engineering, Yonsei University, Seoul 03722, Republic of Korea
2
Actuator Development Team, LG Innotek, Seoul 15588, Republic of Korea
*
Author to whom correspondence should be addressed.
Lubricants 2024, 12(1), 26; https://doi.org/10.3390/lubricants12010026
Submission received: 12 December 2023
/
Revised: 2 January 2024
/
Accepted: 15 January 2024
/
Published: 20 January 2024
(This article belongs to the Special Issue Current and Future Trends in Tribological Research: Fundamentals and Applications–The 10th Anniversary of Lubricants)
Abstract
:Grease, a type of lubricant, finds applications in various mechanical components due to advantages such as shape stability and sealing. However, grease is classified as a non-Newtonian fluid, and its film formation behavior is not fully understood to date due to variations in the mechanism related to the film formation behavior of grease based on factors like the base oil, bleed oil, thickener, and additives. In this study, the film formation behavior of fluorine-based grease was analyzed through the 3D profile of the grease after a friction test. In particular, the film formation behavior of the grease during sliding motion was analyzed. The experimental equipment used was a reciprocating-motion-type experimental equipment. Variations in the 3D profile were observed based on the speed and the cycle, indicating differences in the film formation behavior corresponding to changes in viscosity. In contrast to numerous studies that have observed the film formation behavior of grease under rolling motion, investigating the film formation behavior during the initial cycles of sliding motion will provide a profound understanding of the grease’s film formation process.
1. Introduction
According to the UN Environment report, the number of environmental laws enacted since 1972 has increased 38-fold, emphasizing the global significance of environmental issues [1]. A considerable proportion of machinery (up to 70%) is discarded due to wear- and friction-related damage that occurs during the contact between two surfaces. Additionally, about 23% (119 EJ) of global energy consumption arises from frictional contacts; thus, resolving problems occurring due to frictional contacts is a key factor in reducing energy losses. The estimated value of energy loss reduction achieved through tribological treatments by 2030 is approximately EUR 970 billion [2]. Therefore, tribology has emerged as an environmentally friendly technology within mechanical engineering, offering the potential to address environmental issues from an engineering perspective.
Numerous efforts have been made from a tribological perspective to minimize energy loss, and many of them involve the formation of thin films on surfaces and the creation of surface textures, aiming to reduce friction and wear resulting from contact [3,4,5,6]. Among these, lubricants are the most common and straightforward means used to enhance frictional characteristics. Lubricants range from oils to solid lubricants and are adapted to various operating conditions and environments. Grease, in particular, is a frequently employed lubricant due to its advantages in shape stability, sealing, and leakage prevention [7,8,9,10]. Consequently, the frictional characteristics of grease, which vary according to environmental conditions, are under investigation.
Research has been conducted on the exposure of grease to humid environments [11,12]. Moisture penetration into mechanical components is a crucial environmental factor that can induce changes in friction and wear mechanisms. Consequently, numerous studies have been carried out to establish standards and experimental methods for measuring moisture, aiming to compare and analyze the frictional characteristics of greases with varying moisture contents. One study analyzed the tribological characteristics based on the moisture content of grease. As the moisture content increased, the contact angle decreased, accompanied by higher friction coefficients and wear rates. However, over time, the moisture evaporated due to the heat generated by frictional motion, leading to the convergence of the system to a steady state [12]. On the contrary, some studies have demonstrated that the presence of water can enhance tribological characteristics. In the case of calcium sulfonate complex grease with calcite (CSCG-C), the moisture content plays a role in the formation of tribofilms on the surfaces during frictional motion. A higher water content is associated with the favorable creation of a conducive environment, contributing to an improvement in tribological properties through increased moisture content [11]. Such divergent findings based on water content highlight the ongoing and diverse nature of research in this field, underscoring the need for continued investigation.
Understanding the film formation behavior of grease has long been a focal point of research [13,14,15]. Classical elastohydrodynamic (EHD) lubrication theory has proven effective in explaining the film formation behavior of oils. However, for grease, the applicability of EHD theory is questionable in the presence of unique characteristics, such as thickeners, additives, and non-Newtonian properties. Describing the film formation behavior of grease has led to the presentation of a wide range of equations and experimental results. However, achieving a comprehensive understanding of the film formation behavior of grease remains challenging [13].
In many studies, film thickness based on EHD theory has been employed as a criterion to classify starved lubrication conditions, where lubrication may be below this thickness. Under such conditions, various variables, such as temperature and the type of oil, affecting the film formation behavior of grease have been analyzed. In a particular study, the thickness of the grease lubricating film was investigated under rolling motion in a thermoelastohydrodynamics (TEHL) analysis, considering variations in the load and speed. The study revealed discrepancies between the measured thickness of the grease lubricating film and the calculated results based on the use of base oil. Furthermore, through TEHL analysis, the study suggested that the collapse of the plug flow and the subsequent reduction in grease lubricating film thickness could lead to changes in lubrication conditions [16,17].
One study compared the grease film formation behavior based on the ball size and rolling speed. Simultaneously, a study comparing the film thickness between base oil and grease was conducted in the same situation [14,15]. In another study, the film formation behavior of grease was analyzed based on differences in the composition of the base oil forming the grease. It was confirmed that the film thickness formed by grease is influenced not only by the bleed oil but also by the thickener.
Moreover, the analysis of the film formation behavior of grease for various speed variables revealed that the thickener is a key factor determining the film thickness at low speeds, while the bleed oil plays a predominant role at high speeds. Additionally, the speed at which a lubrication deficiency occurs was observed to vary depending on differences in the base oil. A high rolling speed in ball-on-disc-type motion experiments resulted in considerable variability in the experimental results, attributed to the replenishment of the lubricant due to centrifugal force [14]. Research on the lubricating film formation of grease according to the rolling frequency has been conducted, and the relationship between the rolling frequency and replenishment has been elucidated. Furthermore, through film thickness measurements, it has been confirmed that the thickener in the grease contributes to the lubricating film [15].
Numerous studies have been conducted on the film formation behavior of grease during rolling motion. However, research on the film formation behavior of grease in sliding motion is insufficient. In sliding motion, grease exhibits film formation behavior that is different from that in rolling motion [18,19]. Moreover, slip occurs, even between rolling motions, necessitating a deeper understanding of and further research on film formation behavior during sliding motion [20]. Furthermore, most experiments on rolling motion have been conducted using disc-type tribometers. If reciprocating motion is employed, it will show different grease replenishment and film formation behavior compared to that obtained using the disc type. Therefore, research on this aspect is also essential. In this study, the film formation behavior during the initial cycles, with no material wear, was investigated by measuring the grease film thickness and observing 3D profiles. Additionally, the study aimed to examine the outcomes concerning speed variations.
2. Materials and Methods
2.1. Preparation of Specimens
The study utilized 1 mm zirconia balls from NIKKATO Co., Ltd. (Sakai, Japan) and 30 × 30 × 2 mm polymer plates. The maximum Hertzian contact pressure occurring between the two specimens is 0.53 GPa.
The lubricant used in the study is a fluorine-based grease. The grease employed is classified into the NLGI 1 consistency class. The grease was applied as shown in Figure 1. Masking tape with a thickness of 30 μm was attached to both ends of the polymer plate. A sliding glass was used to ensure that the masking tape adhered well to the polymer plate. Then, the grease for the experiment was placed between the masking tapes and uniformly spread using the sliding glass. Once the grease application was complete, the masking tape was removed for use in the experiment.
The thickness of the masking tape used for grease application and the thickness of the applied grease were measured using Keyence Corporation’s 3D laser confocal microscope. Figure 2 illustrates the process of measuring the grease thickness. The average height within a 500 × 500 μm2 square on the polymer plate was measured, and the polymer plate’s height was set to 0 by offsetting this value. Similarly, the applied grease was measured for the average height within a 500 × 500 μm2 square. After completing measurements at five arbitrary points, the average was calculated to determine the grease height. The thickness of the masking tape was also measured using the same method.
The measured thickness of the grease sample was 30.16 ± 0.71 μm, and the masking tape thickness was 30.70 ± 0.98 μm. This confirmed the effectiveness of uniformly applying grease, as depicted in Figure 1, and validated the use of a 3D laser confocal microscope for observing the shape of the grease after the friction test.
2.2. Friction Test
Friction tests were conducted using a ball-on-reciprocating-type friction tester, as depicted in Figure 3. The zirconia ball and the plate were securely fixed, and the friction test proceeded in accordance with the schematic outlined in Figure 3. The applied load was administered through a deadweight mechanism. The friction motion occurred in a sliding manner, and the experimental conditions are detailed in Table 1. The experiments were repeated at least three times for each condition to ensure the reliability of the experimental data.
3. Results
After conducting friction tests, as described in Section 2.2, the profiles of the grease were observed after 30 min using a 3D laser confocal microscope. Since the profiles of the grease were not observed concurrently with the experiments, it was impractical to measure the shapes under identical time conditions for all conducted experiments. Consequently, the shapes were measured 30 min after the completion of experiments, capturing the state in which the flow of the grease stabilized, for subsequent analysis.
Additionally, the thickness of the grease was measured at the central contact area of the ball after friction, as depicted in Figure 4. Measurements were also taken for the thickness of the grease at non-central contact areas. As evident in Figure 5, Figure 6, Figure 7 and Figure 8, it can be observed that, upon completing the friction tests and removing the ball from the start point, the grease exhibited a high profile due to sticking to the ball. Therefore, the analysis and measurements of experimental results do not consider the shape at the start point. The experiments were conducted in an environment with a room temperature of approximately 22 °C and a relative humidity below 30%.
3.1. Three-Dimensional Profiles of Grease
Figure 5, Figure 6, Figure 7 and Figure 8 depict the 3D profiles of grease obtained using a 3D laser confocal microscope after friction tests under various experimental conditions. Throughout the cycles, the displaced grease accumulates at the endpoint, allowing for the intuitive observation that in 1 cycle, 2 cycles, 5 cycles, and 10 cycles, the grease demonstrates resistance to flow.
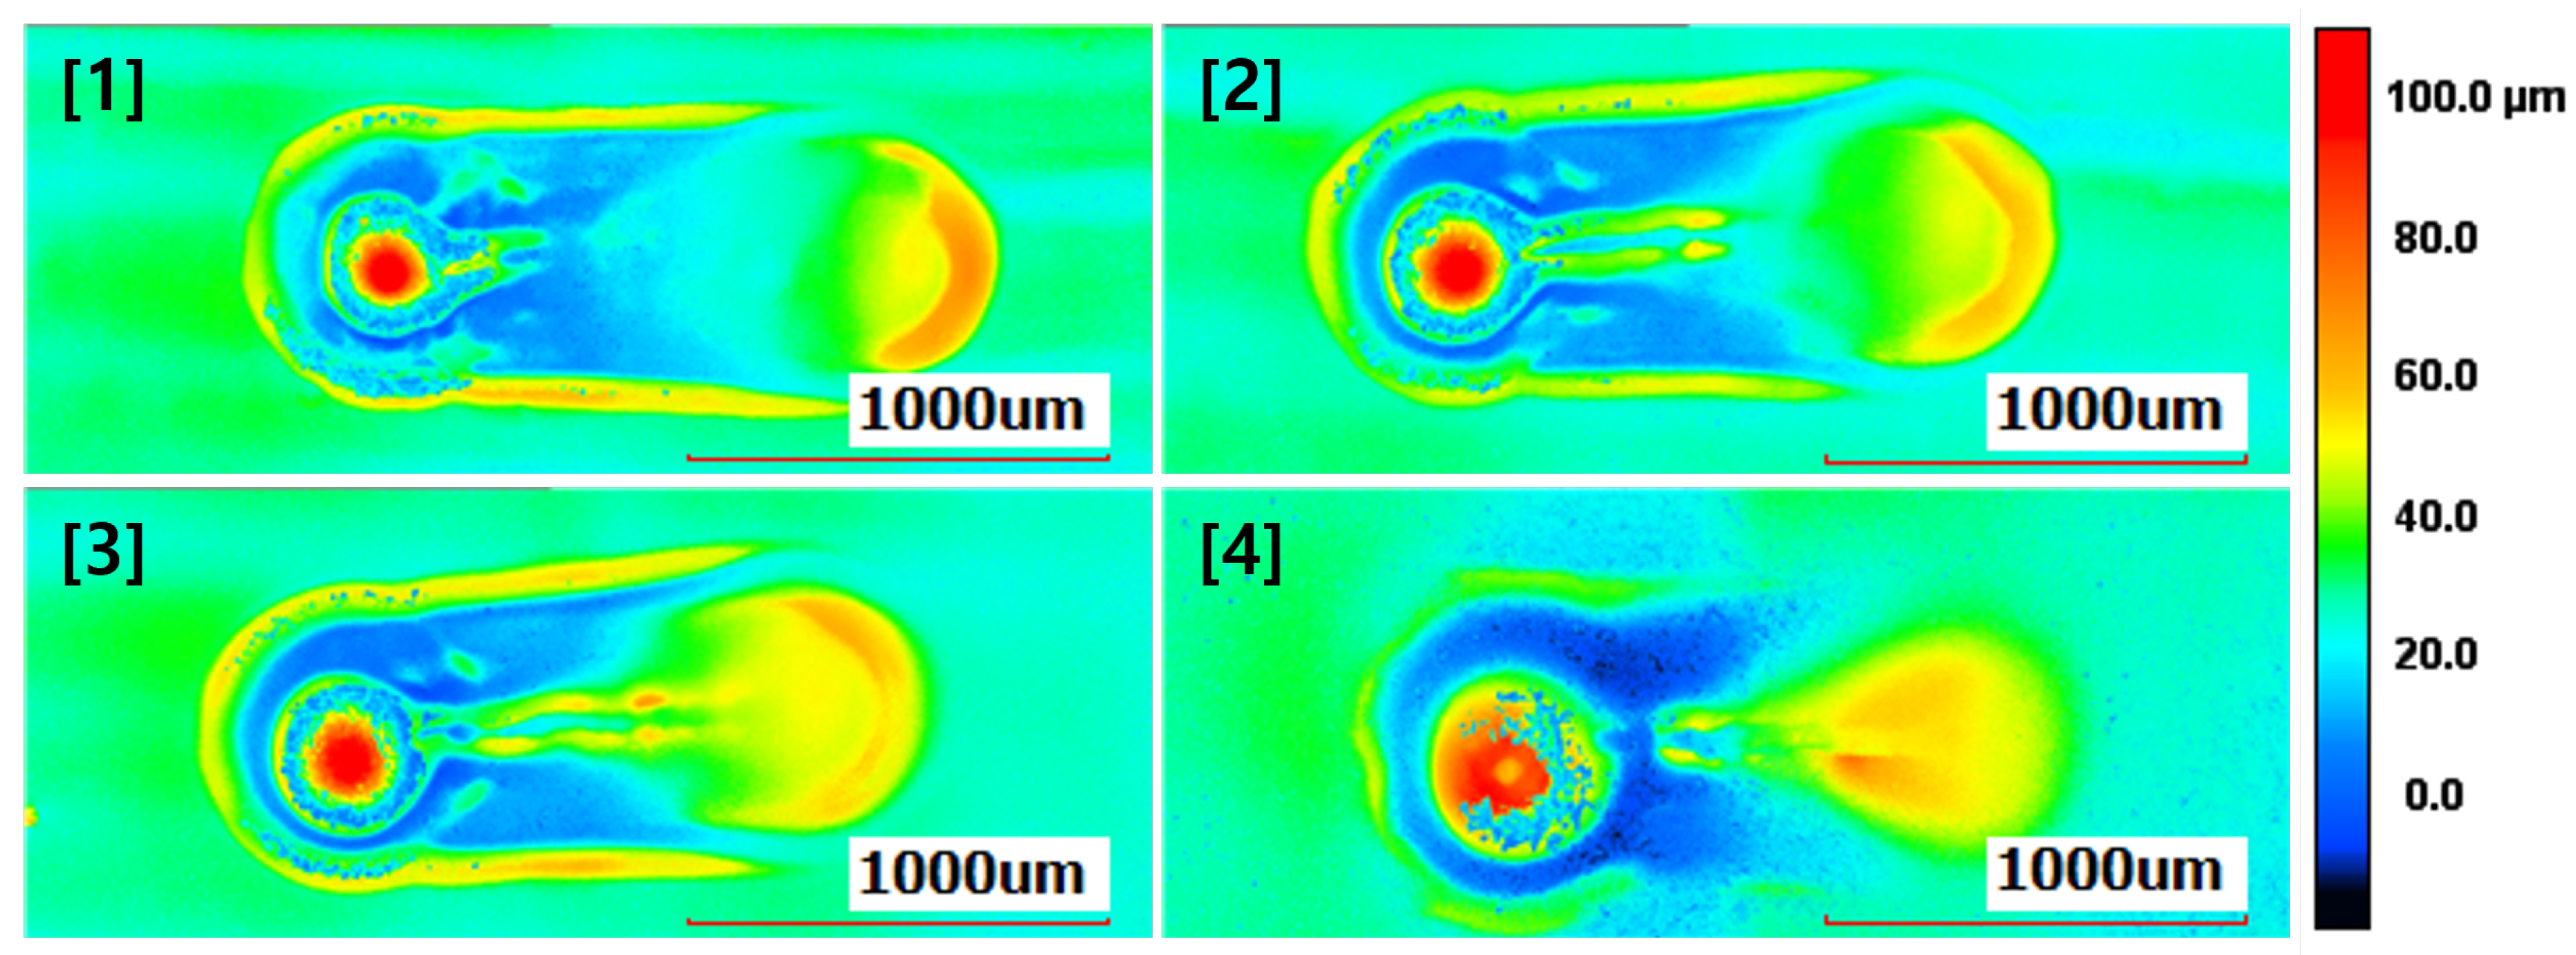
After one cycle and two cycles, it is noted that at 1 mm/s and 2 mm/s, the distribution of grease on the friction track is uniform. However, at 4 mm/s and 8 mm/s, there is a partial elevation in the grease thickness in the central contact region, indicating relatively non-uniform behavior compared to that at lower speeds.
After five cycles, the grease distribution exhibits a fan-shaped pattern at the endpoint, regardless of speed. However, grease displaced at 1 mm/s shows a sharp change in grease thickness compared to that under other speed conditions. As the speed increases, the change in grease thickness becomes relatively gradual. Additionally, at 2 mm/s and above, higher grease levels are observed around the central contact compared to the non-central contact area.
After 10 cycles, a similar 3D shape to that observed after 5 cycles is evident. However, with increasing cycles, more grease is displaced, resulting in reduced grease thickness in the non-central contact area. The central contact exhibits a 3D shape identical to that in 5 cycles, and partially similar 3D shapes are even observed at 1 mm/s.
3.2. Analysis of Grease Thickness in the Central Contact Area
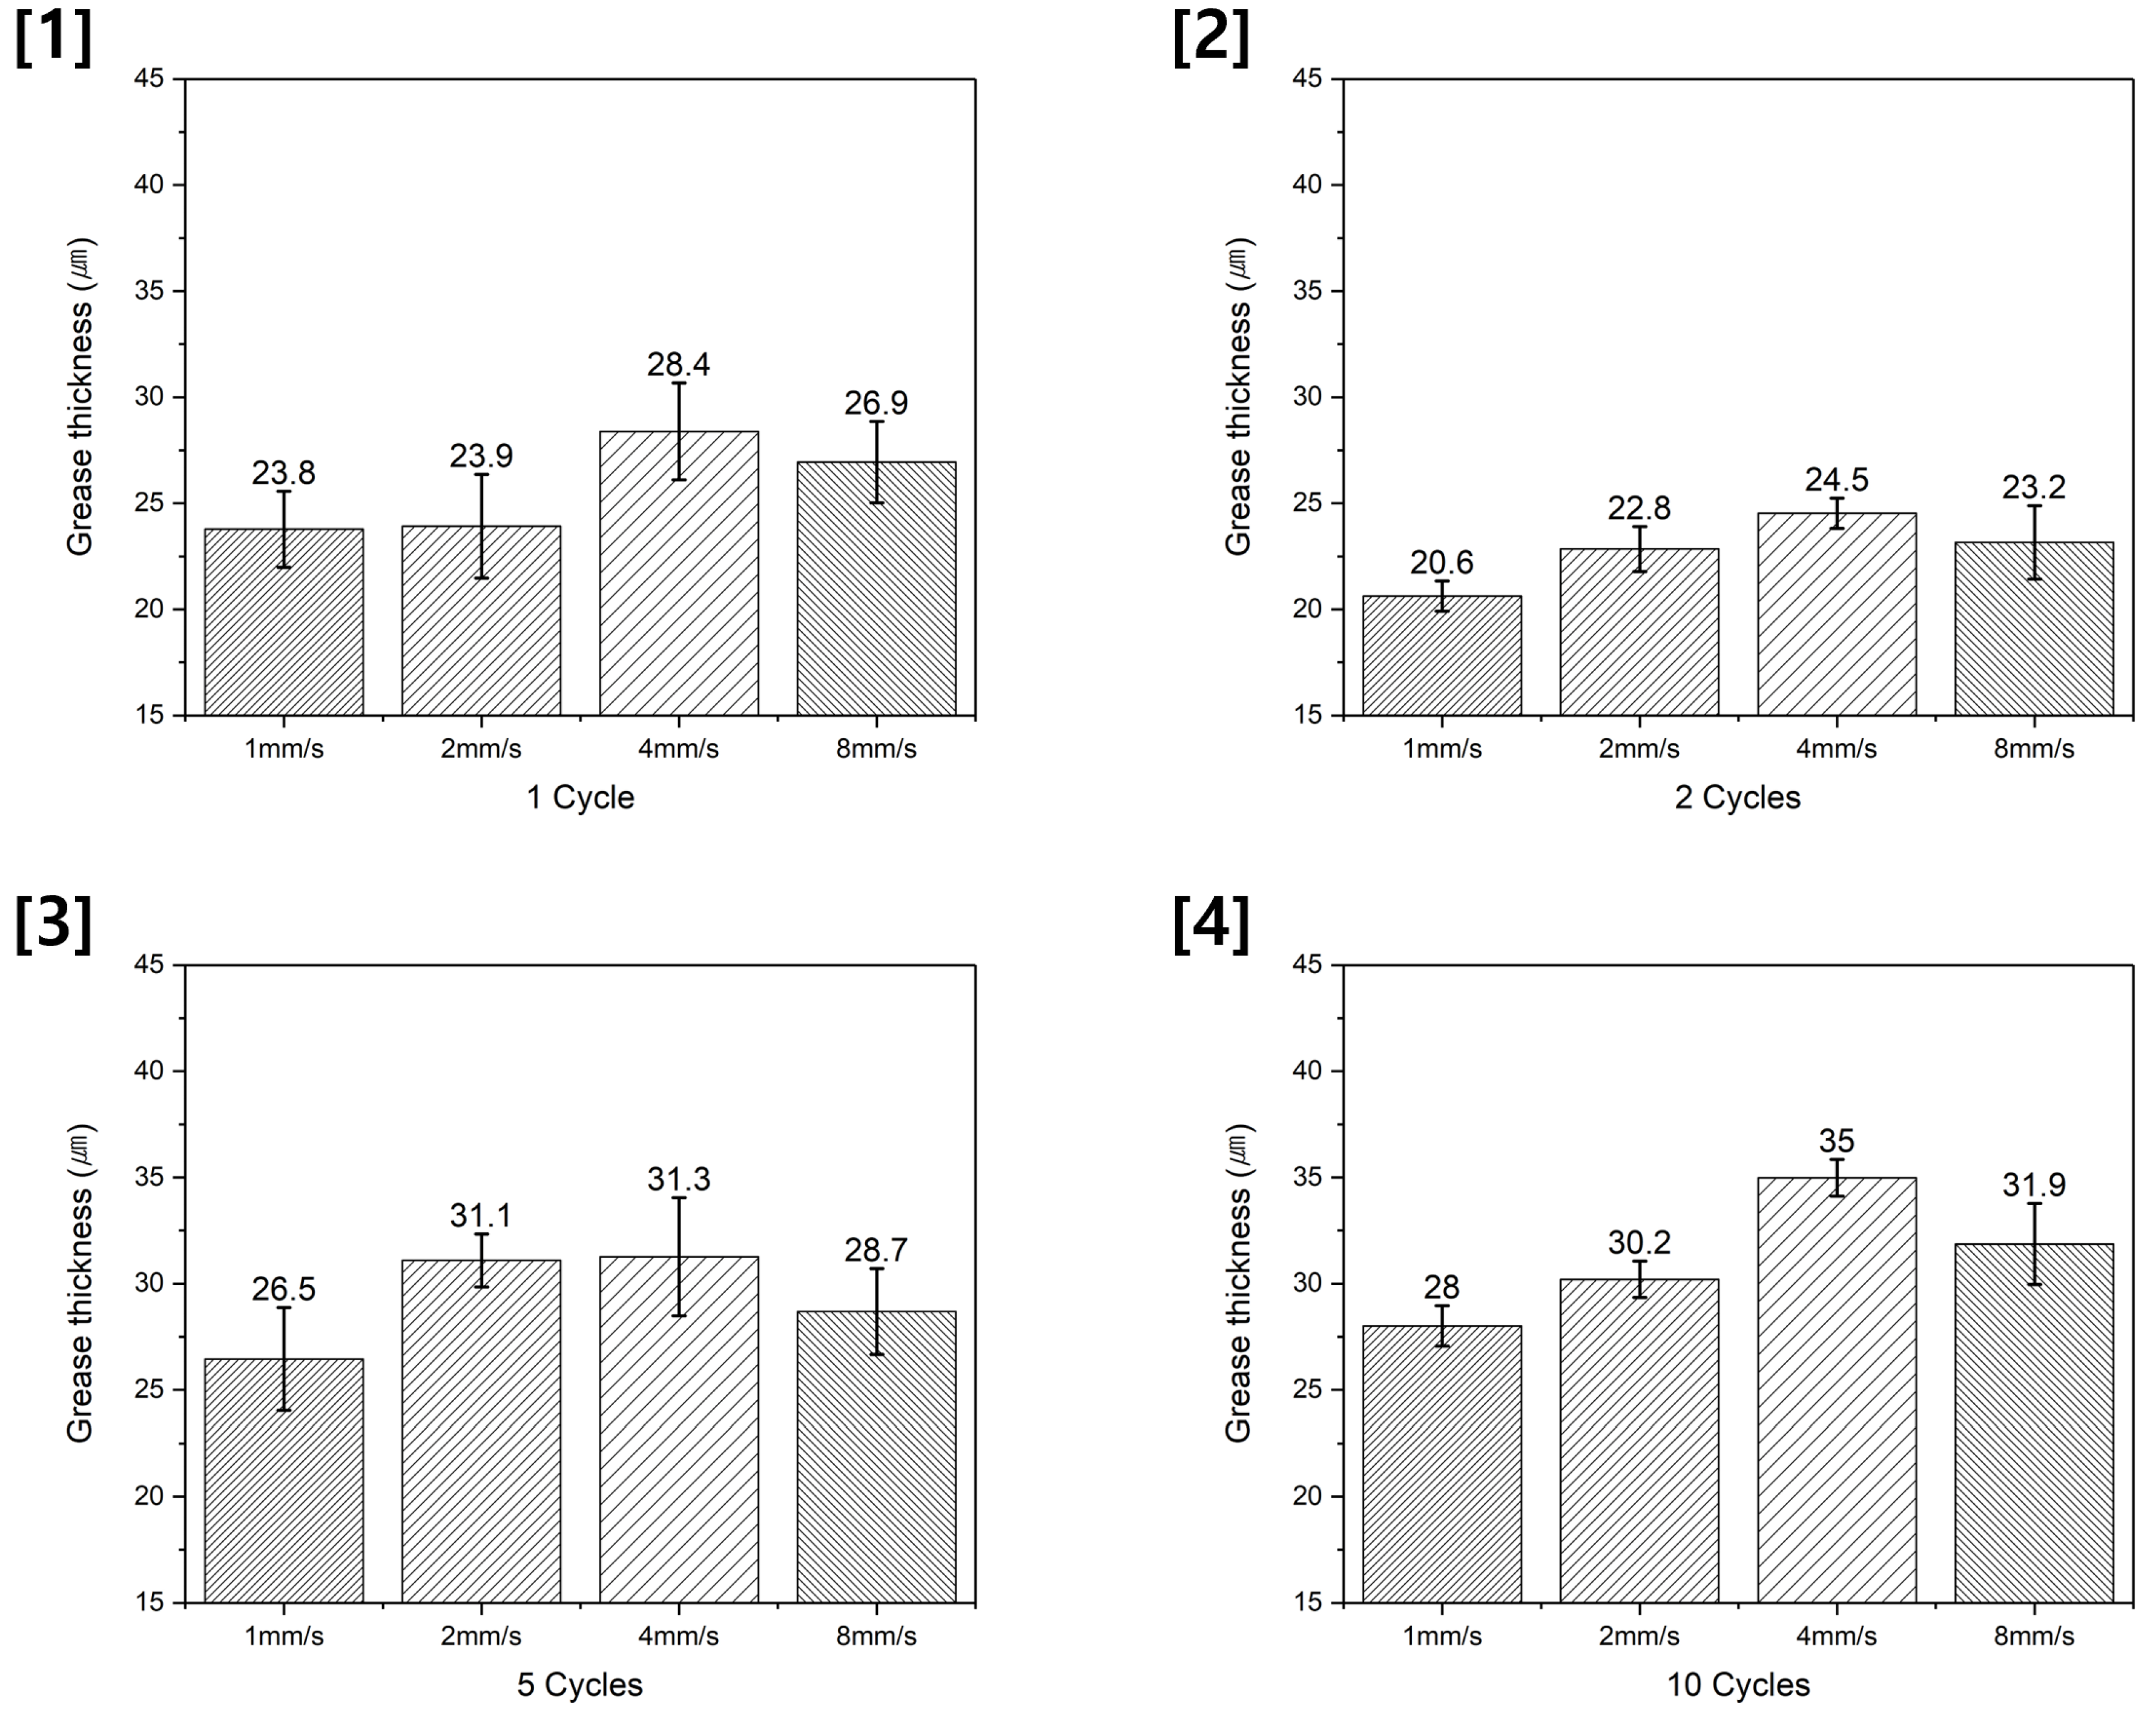
Figure 9 displays the results of measuring the grease thickness in the central contact. As mentioned in Section 3.1, the thickness of the grease in the central contact decreases after one cycle and two cycles. However, after 5 cycles and 10 cycles, the grease thickness in the central contact is larger than that measured after 1 cycle and 2 cycles, even surpassing the initially applied grease thickness in some experimental conditions.
3.3. Analysis of Grease Thickness in the Non-Central Contact Area
Figure 10 presents the results of measuring the grease thickness in the non-central contact area after 5 cycles and 10 cycles. In five cycles, the largest grease thickness in the non-central contact area was observed at 1 mm/s. However, as the cycles were repeated, in 10 cycles, 1 mm/s exhibited the smallest grease thickness in the non-central contact area. For other speed conditions, a similar trend was observed in 5 cycles and 10 cycles.
4. Discussion
In all experimental results, the contours exhibit variations based on the number of cycles and speed but consistently reveal a distinctive wake shape at the rear of the contact area. A meniscus-shaped formation is evident from the endpoint to the start point, and this meniscus has the potential to induce the replenishment of grease along the track. In the inlet region of the ball, both inward and outward features are observed with respect to the contact center of the ball and grease. The inward feature is associated with grease being displaced away from the area, potentially leading to a starvation condition, while the outward feature may induce the replenishment of the grease [21,22].
Consistent with the experimental results in Section 3, it is observed that due to the resistance to flow, displaced grease at the endpoint does not return to the friction track and forms the highest grease height at the endpoint. After one cycle at 1 mm/s, 2 mm/s, 4 mm/s, and 8 mm/s, a relatively uniform grease distribution is evident. However, at 4 mm/s and 8 mm/s, localized areas with higher grease accumulation are observed, particularly in the central contact region. This phenomenon becomes more pronounced after two cycles. After five cycles, unlike the preceding one cycle and two cycles, the grease distribution is characterized by an overall higher level in the central contact area, rather than localized regions higher than the surroundings. In certain experimental conditions, this height is observed to exceed the height of the applied grease. The same trend persists after 10 cycles, as well.
As the speed increases, the properties of grease required to maintain its shape undergo changes, indicating variations in resistance to flow. In a particular study, the resistance of grease to flow, specifically the pull-off force, was investigated with respect to the retraction speed. The study observed an increase in pull-off force with the escalating retraction speed. In other words, a higher speed serves as a factor leading to the increased resistance of the grease to flow, consequently requiring a higher pull-off force for deformation. This phenomenon is attributed to the viscous damping effect arising from the viscosity of the grease, where changes in viscosity, influenced by the variable speed, contribute to alterations in the grease’s flow resistance and, consequently, the separation energy required for shape deformation [23].
Viscosity is influenced by various factors, such as the contact area, speed, and other variables of frictional motion [24,25,26]. Numerous studies and models exist regarding these influences. Among them, the pressure–viscosity coefficient is a crucial parameter used to evaluate viscosity changes under pressure. The equation expressing one of the models related to this concept is as follows [25]:
is the film center’s thickness, is the equivalent curvature radius, U is the speed parameter, is the viscosity, G is the geometry parameter, W is the load parameter, is the ellipticity influence, is the ball speed, is the plate speed, is the equivalent Young’s modulus, is the Poisson’s ratio, is the normal force, and is the pressure–viscosity coefficient.
Various models related to the pressure–viscosity coefficient exist [27,28,29,30,31]. The pressure-viscosity coefficient is determined based on experimental data obtained from film thickness, encompassing system variables, such as experimental conditions like speed and load, and environmental conditions like temperature and humidity. Consequently, each model represents diverse equations depending on these variables. However, a common aspect among them is the exponential increase in the pressure–viscosity coefficient with the rise in speed, as demonstrated by the speed parameter (U) in the equation above.
The speed parameter U increases exponentially with the retraction speed (). Consequently, the pressure–viscosity coefficient also increases with the rise in retraction speed. When using this model for calculations, the pressure–viscosity coefficient at 8 mm/s is more than 4 times higher than that at 1 mm/s. In other words, at high speeds, such as 8 mm/s, the grease viscosity increases exponentially with speed compared to that at 1 mm/s. This leads to the behavior of the grease and ball, as depicted in Figure 11. During the contact between the ball and the grease, the grease is displaced in the direction of the friction motion. The displaced grease creates greater resistance against the movement of the ball, and this resistance increases with speed. This phenomenon is a cause of the uneven distribution of grease observed after one cycle and two cycles, as mentioned in Section 3.1.
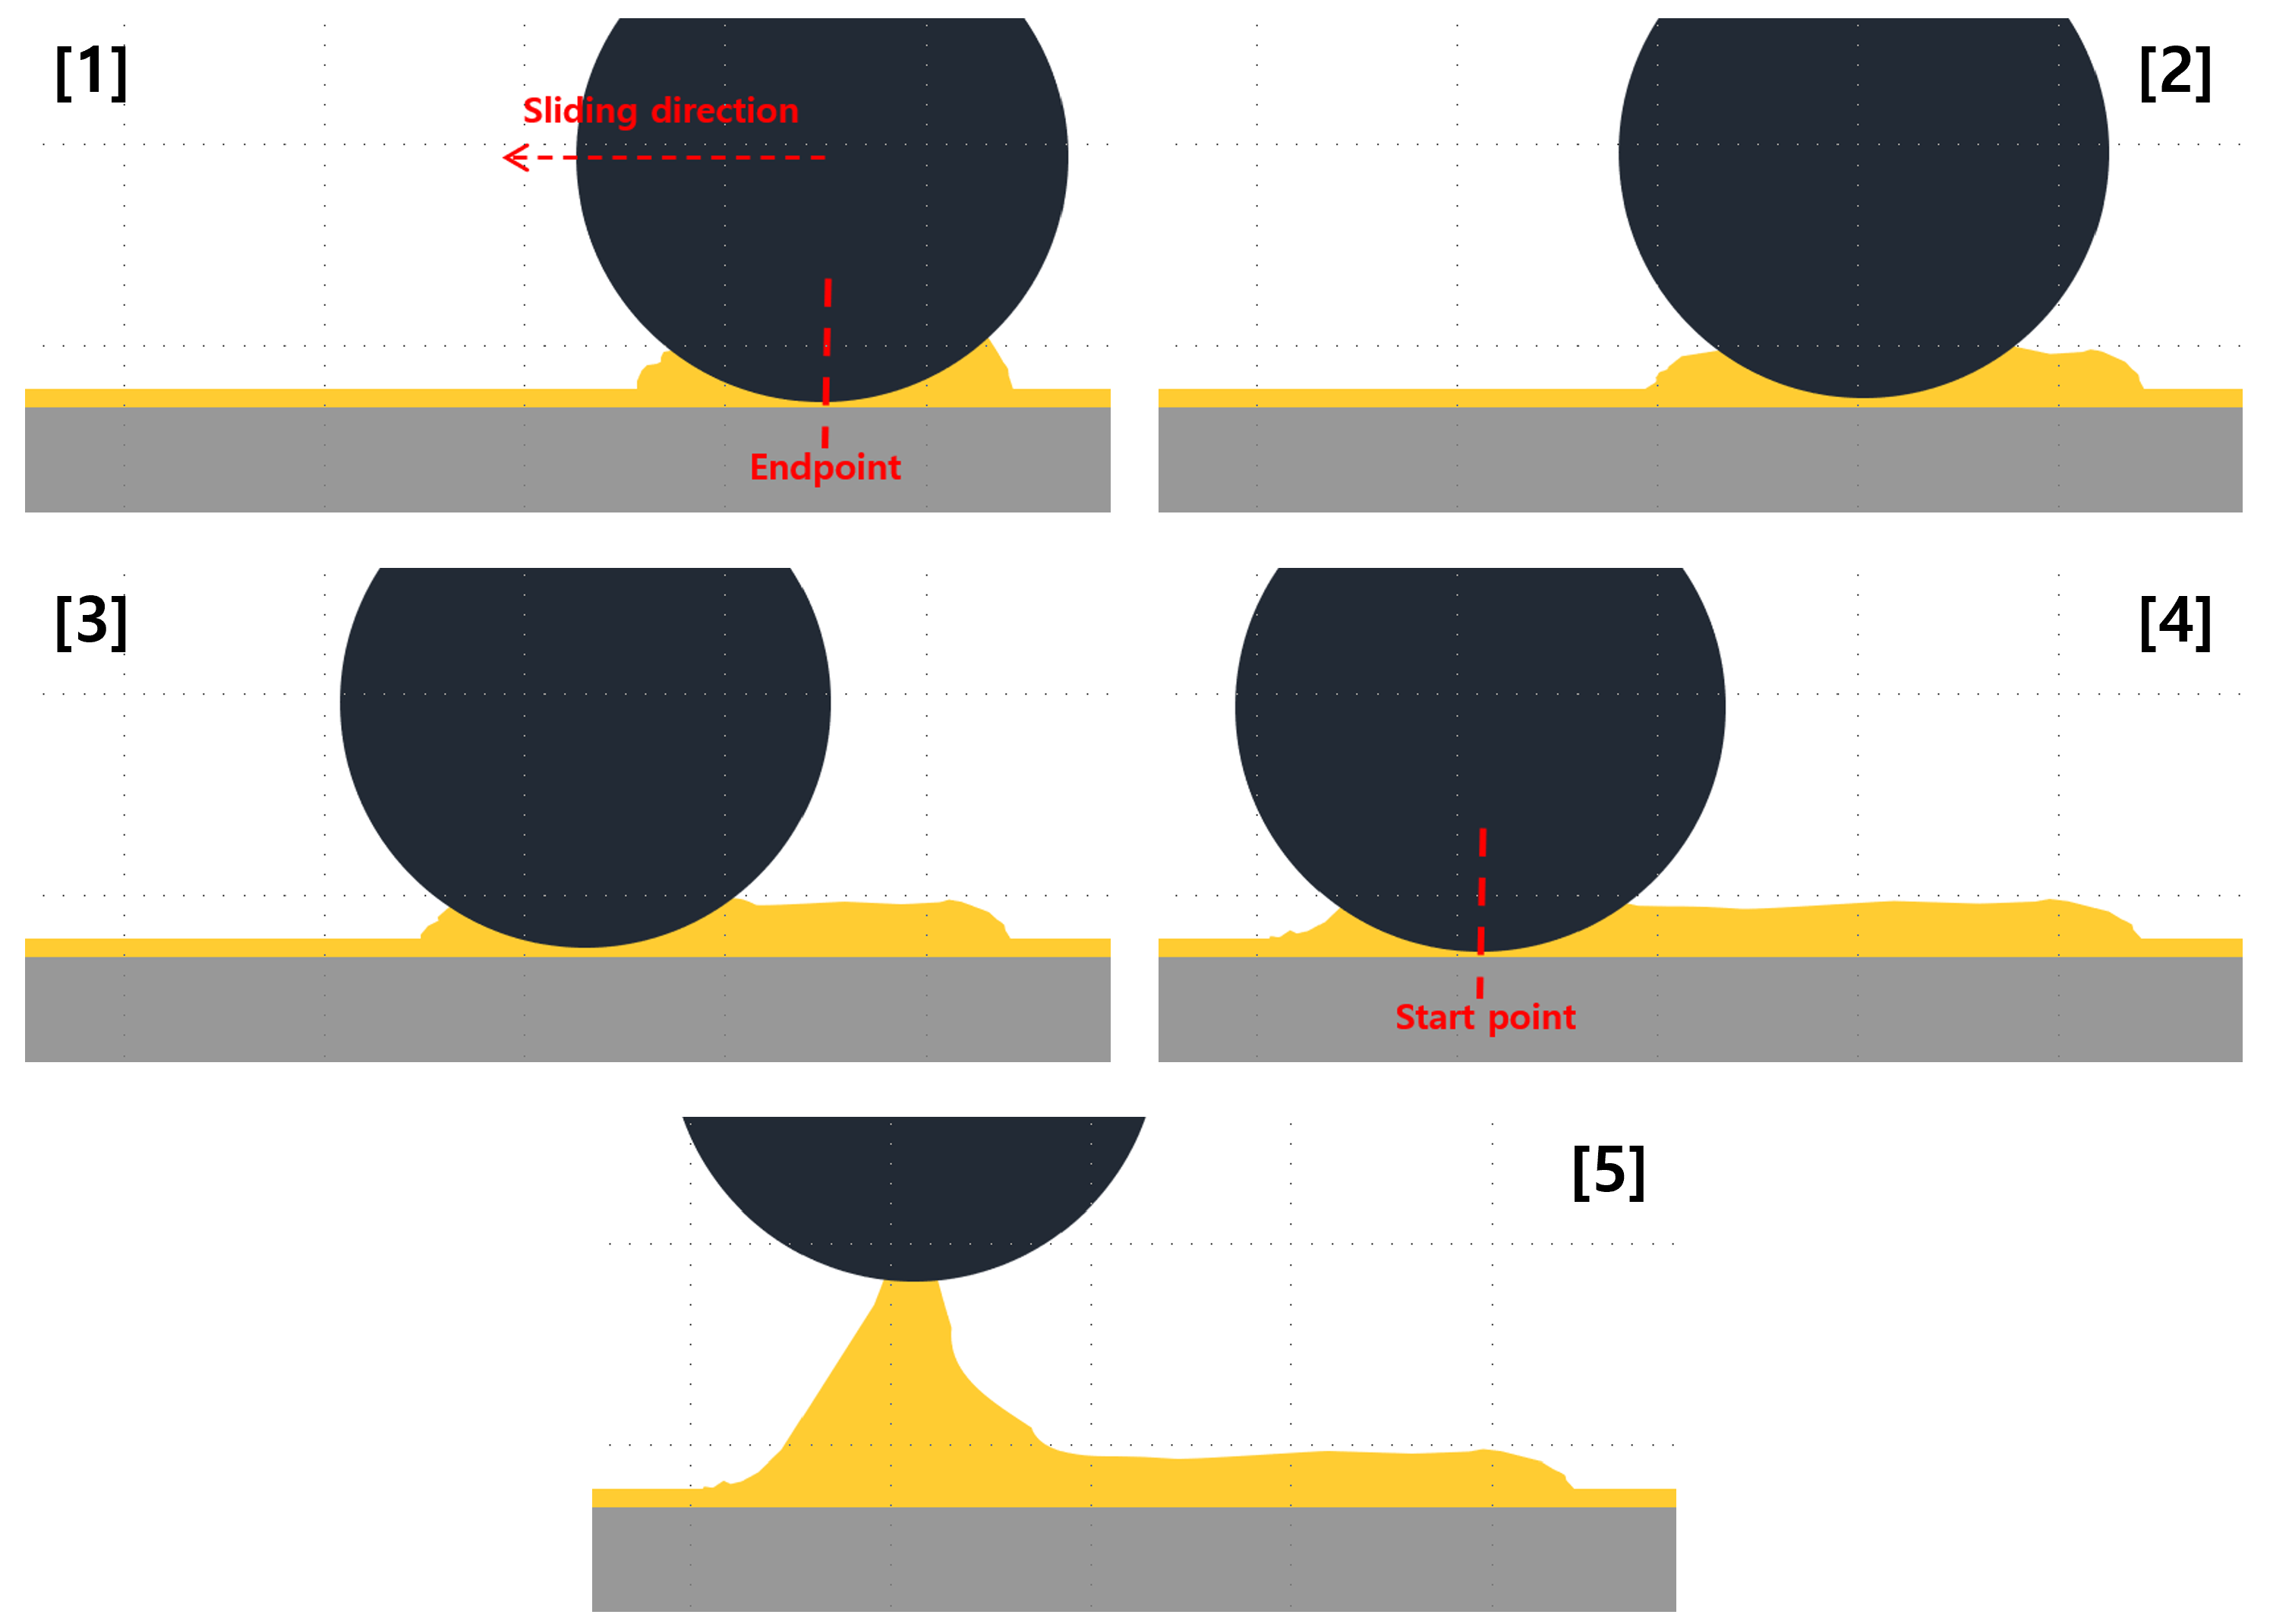
However, as the number of cycles increases, the grease is ultimately pushed back and forth. At the start and endpoints, the speed becomes zero, and the two surfaces (ball and plate) come closer when changing the direction of motion. Consequently, some of the displaced grease is reintroduced into the track by the ball moving in the opposite direction, as shown in Figure 12. This behavior can be observed in the 3D shapes at 4 mm/s and 8 mm/s for 10 cycles (Figure 8). The fan-shaped appearance of the grease at the endpoint suggests that as the grease moves from the endpoint to the start point, it is pulled back into the track by the adhesive force on the sides and rear of the ball. The increased viscosity at higher speeds causes the grease to exhibit more significant resistance to flow, leading to the thicker grease layer in non-central contact areas at higher speeds.
This behavior of the grease is presumed to repeat until a steady state is reached. As indicated earlier, some of the displaced grease appears to be reintroduced into the track, as evidenced by the fact that a larger film thickness in the central contact is observed after 5 cycles and 10 cycles compared to 1 cycle and 2 cycles. However, as observed in the thickness results for non-central contact, ultimately, the grease is displaced, and it is predicted to reach a steady state with an increase in cycles. It has been confirmed that the film formation behavior of grease exhibits differences under sliding conditions depending on the speed variable.
Typically, film formation behavior in grease is elucidated through thickness measurements using interferometry, often conducted until reaching a steady state after numerous cycles [14,15]. In this study, as the focus was on the relatively early cycles, i.e., up to 10, applying and validating various models becomes challenging. Additionally, the influence of plate roughness cannot be disregarded, and errors may be present in the analysis after a certain duration in the experiment.
Various models exist to predict grease film thickness based on different parameters. However, it is essential to acknowledge the limitations associated with the load parameter in this study. The experiments were conducted with a relatively small load of 50 gf utilizing deadweight equipment. Consequently, the application of a relatively small load might lead to substantial deviations compared to experiments with larger loads. Many previous studies aiming to calculate the pressure–viscosity coefficient and determine the film thickness often employed large-sized balls and larger loads than 50 gf to achieve a similar level of contact pressure. It is important to consider the substantial deviation in load associated with the experimental setup used in this study compared to those employing larger loads. Furthermore, many studies have investigated grease lubrication film formation using greases with higher viscosity, such as NLGI Grade 2 [32,33,34]. A higher viscosity provides a clearer understanding of the wall effect observed at boundaries in the grease’s contours. However, in this study, we used a relatively low-viscosity NLGI Grade 1 grease. As a result, it is challenging to provide a clear image of the grease lubrication film formation process through contours when compared to NLGI Grade 2. Nevertheless, understanding the film formation behavior of grease under sliding-motion conditions is deemed beneficial, and future research should address these limitations for more in-depth investigations.
5. Conclusions
This study investigated the film formation behavior of fluorine-based grease in the early cycles (1 cycle, 2 cycles, 5 cycles, and 10 cycles) of a ball-on-reciprocating-type friction test at different sliding speeds (1 mm/s, 2 mm/s, 4 mm/s, and 8 mm/s). After the friction test, the 3D profiles of the grease were observed using a 3D laser confocal microscope, and the thickness of the grease in both central and non-central contact areas was measured.
- The results underscore the significant impact of the sliding speed on the film formation behavior of grease. At lower speeds (1 mm/s and 2 mm/s), the grease exhibits a relatively uniform distribution on the track after one cycle. Conversely, at higher speeds (4 mm/s and 8 mm/s), the grease distribution becomes uneven, with localized areas displaying thicker grease layers compared to the surroundings. This non-uniformity becomes more pronounced after two cycles. The rationale behind this observation is attributed to the increase in grease viscosity with speed, resulting in heightened resistance to flow and consequently leading to a non-uniform distribution.
- Concerning the thickness of the grease in the central contact area, there is an initial decrease in thickness during the early cycles (one cycle and two cycles) across all speeds. However, in subsequent cycles (5 cycles and 10 cycles), there is an increase in thickness, indicating the replenishment of grease in the central contact area.
- This phenomenon can be understood by considering the inherent viscosity of grease, which imparts resistance to flow. Consequently, grease displaced to the endpoint is unable to flow back into the track, leading to a reduction in grease thickness in the central contact area after one cycle and two cycles.
- However, within repetitive cycle processes, such as those in 5 cycles and 10 cycles, there emerges a distinctive configuration based on the changes in pressure–viscosity coefficient associated with variations in speed, setting it apart from the characteristics observed during one cycle and two cycles. The pressure–viscosity coefficient exponentially increases with the rise in speed. At the endpoint, the direction of motion changes, causing an instantaneous drop in speed to zero. This allows the ball to penetrate deeper regions of the grease. Consequently, a portion of the displaced grease is momentarily replenished back into the track. Furthermore, the formation of a fan-shaped configuration indicates that replenishment of grease occurs not only in the central contact but also in the non-central contact areas. This phenomenon is attributed to the adhesive forces among the grease and the adhesive forces between the ball and the grease.
- Further investigation is required to delve into the intricate interactions between the grease, ball, and plate under various sliding conditions and to develop comprehensive models capable of predicting the film formation behavior of grease. To construct models for sliding motion, the selection of experimental conditions with stable parameters becomes crucial. Moreover, extensive research efforts are needed to explore the differences in film formation behavior based on grease components, such as the base oil, thickeners, and additives, and various environmental conditions. This study makes a valuable contribution to understanding the early-stage film formation behavior of grease in sliding motion.
Author Contributions
Conceptualization, J.-B.C. and H.-J.M.; methodology, J.-B.C. and H.-J.M.; software, J.-B.C.; validation, J.-B.C., H.-J.M. and D.-E.K.; formal analysis, J.-B.C.; investigation, J.-B.C.; resources, G.-S.L. and J.-H.P.; data curation, J.-B.C.; writing—original draft preparation, J.-B.C.; writing—review and editing, D.-E.K.; visualization, J.-B.C.; supervision, D.-E.K.; project administration, D.-E.K.; All authors have read and agreed to the published version of the manuscript.
Funding
This research received no external funding.
Data Availability Statement
The data presented in this study are available on request from the corresponding author. The data are not publicly available due to privacy or ethical restrictions.
Conflicts of Interest
The authors declare no conflicts of interest.
References
- UNEP. Available online: https://www.unep.org/resources/assessment/environmental-rule-law-first-global-report (accessed on 3 November 2023).
- Holmberg, K.; Erdemir, A. Influence of tribology on global energy consumption, costs and emissions. Friction 2017, 5, 263–284. [Google Scholar] [CrossRef]
- Yoo, S.S.; Kim, D.E. Minimum lubrication technique using silicone oil for friction reduction of stainless steel. Int. J. Precis. Eng. Manuf. 2013, 14, 875–880. [Google Scholar] [CrossRef]
- Penkov, O.V.; Pukha, V.E.; Zubarev, E.N.; Yoo, S.S.; Kim, D.E. Tribological properties of nanostructured DLC coatings deposited by C60 ion beam. Tribol. Int. 2013, 60, 127–135. [Google Scholar] [CrossRef]
- Lin, L.Y.; Kim, D.E. Effect of elevated annealing temperature on the microstructure and nano-hardness of ZnO films deposited by the sol-gel process. Int. J. Precis. Eng. Manuf. 2012, 13, 2005–2009. [Google Scholar] [CrossRef]
- Khadem, M.; Kang, W.B.; Kim, D.E. Green Tribology: A Review of Biodegradable Lubricants—Properties, Current Status, and Future Improvement Trends. Int. J. Precis. Eng. Manuf.-Green Technol. 2023, 1–19. [Google Scholar] [CrossRef]
- Kunishima, T.; Nagai, Y.; Bouvard, G.; Abry, J.C.; Fridrici, V.; Kapsa, P. Comparison of the tribological properties of carbon/glass fiber reinforced PA66-based composites in contact with steel, with and without grease lubrication. Wear 2021, 477, 203899. [Google Scholar] [CrossRef]
- Kunishima, T.; Nagai, Y.; Kurokawa, T.; Bouvard, G.; Abry, J.C.; Fridrici, V.; Kapsa, P. Tribological behavior of glass fiber reinforced-PA66 in contact with carbon steel under high contact pressure, sliding and grease lubricated conditions. Wear 2020, 456, 203383. [Google Scholar] [CrossRef]
- Kunishima, T.; Nagai, Y.; Nagai, S.; Kurokawa, T.; Bouvard, G.; Abry, J.C.; Fridrici, V.; Kapsa, P. Effects of glass fiber properties and polymer molecular mass on the mechanical and tribological properties of a polyamide-66-based composite in contact with carbon steel under grease lubrication. Wear 2020, 462, 203500. [Google Scholar] [CrossRef]
- Biazon, L.; Ferrer, B.P.; Toro, A.; Cousseau, T. Correlations between rail grease formulation and friction, wear and RCF of a wheel/rail tribological pair. Tribol. Int. 2021, 153, 106566. [Google Scholar] [CrossRef]
- Sun, L.; Ma, R.; Zhao, Q.; Zhao, G.; Wang, X. The Impact of Water on the Tribological Behavior of Lubricating Grease Based on Calcium Carbonate Polymorphs. Lubricants 2022, 10, 188. [Google Scholar] [CrossRef]
- Wang, D.Y.; Yoo, S.S.; Kim, S.S.; Kim, D.E. Effect of water content on tribological characteristics of grease. J. Korean Soc. Precis. Eng. 2016, 33, 37–43. [Google Scholar] [CrossRef]
- Lugt, P.M. A review on grease lubrication in rolling bearings. Tribol. Trans. 2009, 52, 470–480. [Google Scholar] [CrossRef]
- Fischer, D.; Jacobs, G.; Stratmann, A.; Burghardt, G. Effect of base oil type in grease composition on the lubricating film formation in EHD contacts. Lubricants 2018, 6, 32. [Google Scholar] [CrossRef]
- Fischer, D.; Mues, H.; Jacobs, G.; Stratmann, A. Effect of over rolling frequency on the film formation in grease lubricated EHD contacts under starved conditions. Lubricants 2019, 7, 19. [Google Scholar] [CrossRef]
- Kauzlarich, J.J.; Greenwood, J.A. Inlet shear heating in elastohydrodynamic lubrication. Trans. ASME J. Lubr. Technol. 1973, 95, 417–426. [Google Scholar]
- Karthikeyan, B.K.; Teodorescu, M.; Rahnejat, H.; Rothberg, S.J. Thermoelastohydrodynamics of grease-lubricated concentrated point contacts. Proc. Inst. Mech. Eng. Part C J. Mech. Eng. Sci. 2010, 224, 683–695. [Google Scholar] [CrossRef]
- Kim, H.; Kim, R.U.; Chung, K.H.; An, J.H.; Jeon, H.G.; Kim, B.J. Effect of test parameters on degradation of polyurethane elastomer for accelerated life testing. Polym. Test. 2014, 40, 13–23. [Google Scholar] [CrossRef]
- Escobar, L.A.; Meeker, W.Q. A review of accelerated test models. Stat. Sci. 2006, 21, 552–577. [Google Scholar] [CrossRef]
- Makino, T.; Kato, T.; Hirakawa, K. The effect of slip ratio on the rolling contact fatigue property of railway wheel steel. Int. J. Fatigue 2012, 36, 68–79. [Google Scholar] [CrossRef]
- Mohammadpour, M.; Johns-Rahnejat, P.M.; Rahnejat, H.; Gohar, R. Boundary conditions for elastohydrodynamics of circular point contacts. Tribol. Lett. 2014, 53, 107–118. [Google Scholar] [CrossRef]
- Johns-Rahnejat, P.M.; Gohar, R. Measuring contact pressure distributions under elastohydrodynamic point contacts. Tribotest 1994, 1, 33–53. [Google Scholar] [CrossRef]
- Georgiou, E.P.; Drees, D.; De Bilde, M.; Anderson, M. Can we put a value on the adhesion and tackiness of greases? Tribol. Lett. 2018, 66, 60. [Google Scholar] [CrossRef]
- Morales-Espejel, G.E.; Lugt, P.M.; Pasaribu, H.R.; Cen, H. Film thickness in grease lubricated slow rotating rolling bearings. Tribol. Int. 2014, 74, 7–19. [Google Scholar] [CrossRef]
- Cousseau, T.; Björling, M.; Graça, B.; Campos, A.; Seabra, J.; Larsson, R. Film thickness in a ball-on-disc contact lubricated with greases, bleed oils and base oils. Tribol. Int. 2012, 53, 53–60. [Google Scholar] [CrossRef]
- Ohno, N.; Rahman, Z.; Syusukeyamada; Komiya, H. Effect of Perfluoropolyether Fluids on Life of Thrust Ball Bearings. Tribol. Trans. 2009, 52, 492–500. [Google Scholar] [CrossRef]
- Pensado, A.S.; Comunas, M.J.P.; Fernández, J. The pressure-viscosity coefficient of several ionic liquids. Tribol. Lett. 2008, 31, 107–118. [Google Scholar] [CrossRef]
- Gold, P.W.; Schmidt, A.; Dicke, H.; Loos, J.; Assmann, C. Viscosity-pressure-temperature behaviour of mineral and synthetic oils. J. Synth. Lubric. 2001, 18, 51–79. [Google Scholar] [CrossRef]
- van Leeuwen, H. The determination of the pressure—viscosity coefficient of a lubricant through an accurate film thickness formula and accurate film thickness measurements. Proc. Inst. Mech. Eng. Part J J. Eng. Tribol. 2009, 223, 1143–1163. [Google Scholar] [CrossRef]
- van Leeuwen, H. The determination of the pressure–viscosity coefficient of a lubricant through an accurate film thickness formula and accurate film thickness measurements. Part 2: High L values. Proc. Inst. Mech. Eng. Part J J. Eng. Tribol. 2011, 225, 449–464. [Google Scholar] [CrossRef]
- Bair, S. A critical evaluation of film thickness-derived pressure-viscosity coefficients. Lubr. Sci. 2015, 27, 337–346. [Google Scholar] [CrossRef]
- Vengudusamy, B.; Enekes, C.; Spallek, R. On the film forming and friction behaviour of greases in rolling/sliding contacts. Tribol. Int. 2019, 129, 323–337. [Google Scholar] [CrossRef]
- Muller, D.; Matta, C.; Thijssen, R.; Bin Yusof, M.N.; Van Eijk, M.C.P.; Chatra, S. Novel polymer grease microstructure and its proposed lubrication mechanism in rolling/sliding contacts. Tribol. Int. 2017, 110, 278–290. [Google Scholar] [CrossRef]
- Gonçalves, D.; Graça, B.; Campos, A.V.; Seabra, J.; Leckner, J.; Westbroek, R. On the film thickness behaviour of polymer greases at low and high speeds. Tribol. Int. 2015, 90, 435–444. [Google Scholar] [CrossRef]
Figure 1.
Schematic of the grease application process.

Figure 2.
Example of grease thickness and Ra value measurements. Reference average height measurements of polymer plates (red-bordered square). Mean height measurements in grease (blue-bordered squares).
Figure 2.
Example of grease thickness and Ra value measurements. Reference average height measurements of polymer plates (red-bordered square). Mean height measurements in grease (blue-bordered squares).

Figure 3.
Experimental setup (ball on reciprocating type).
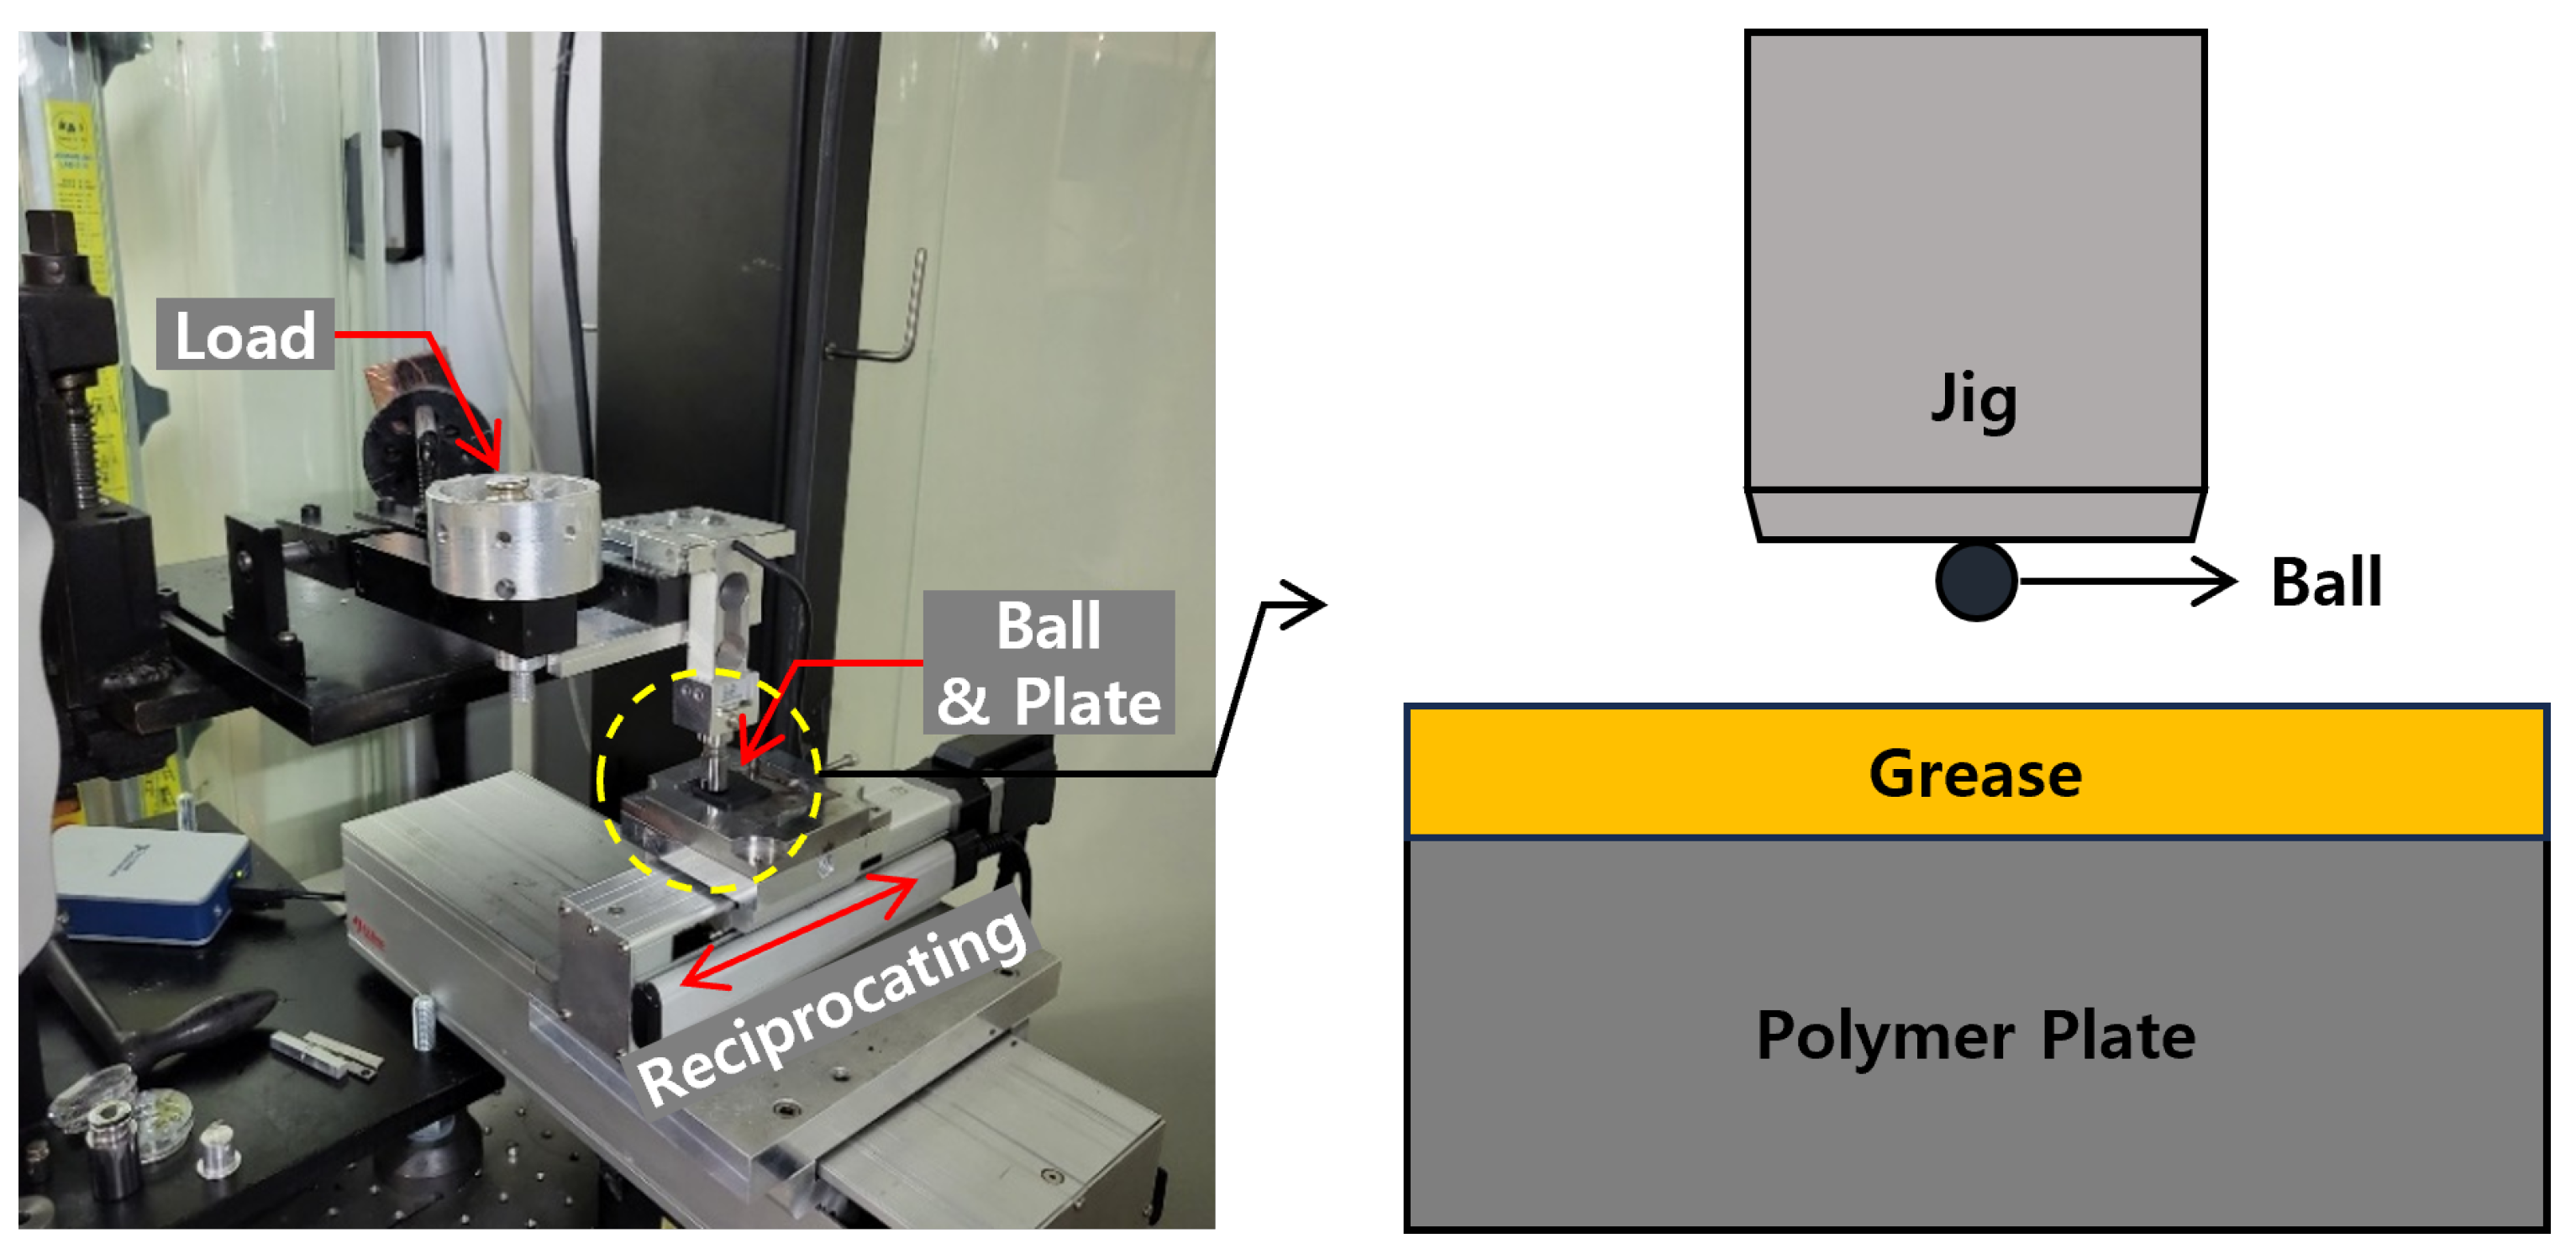
Figure 4.
Schematic for grease thickness measurement at the central contact area.
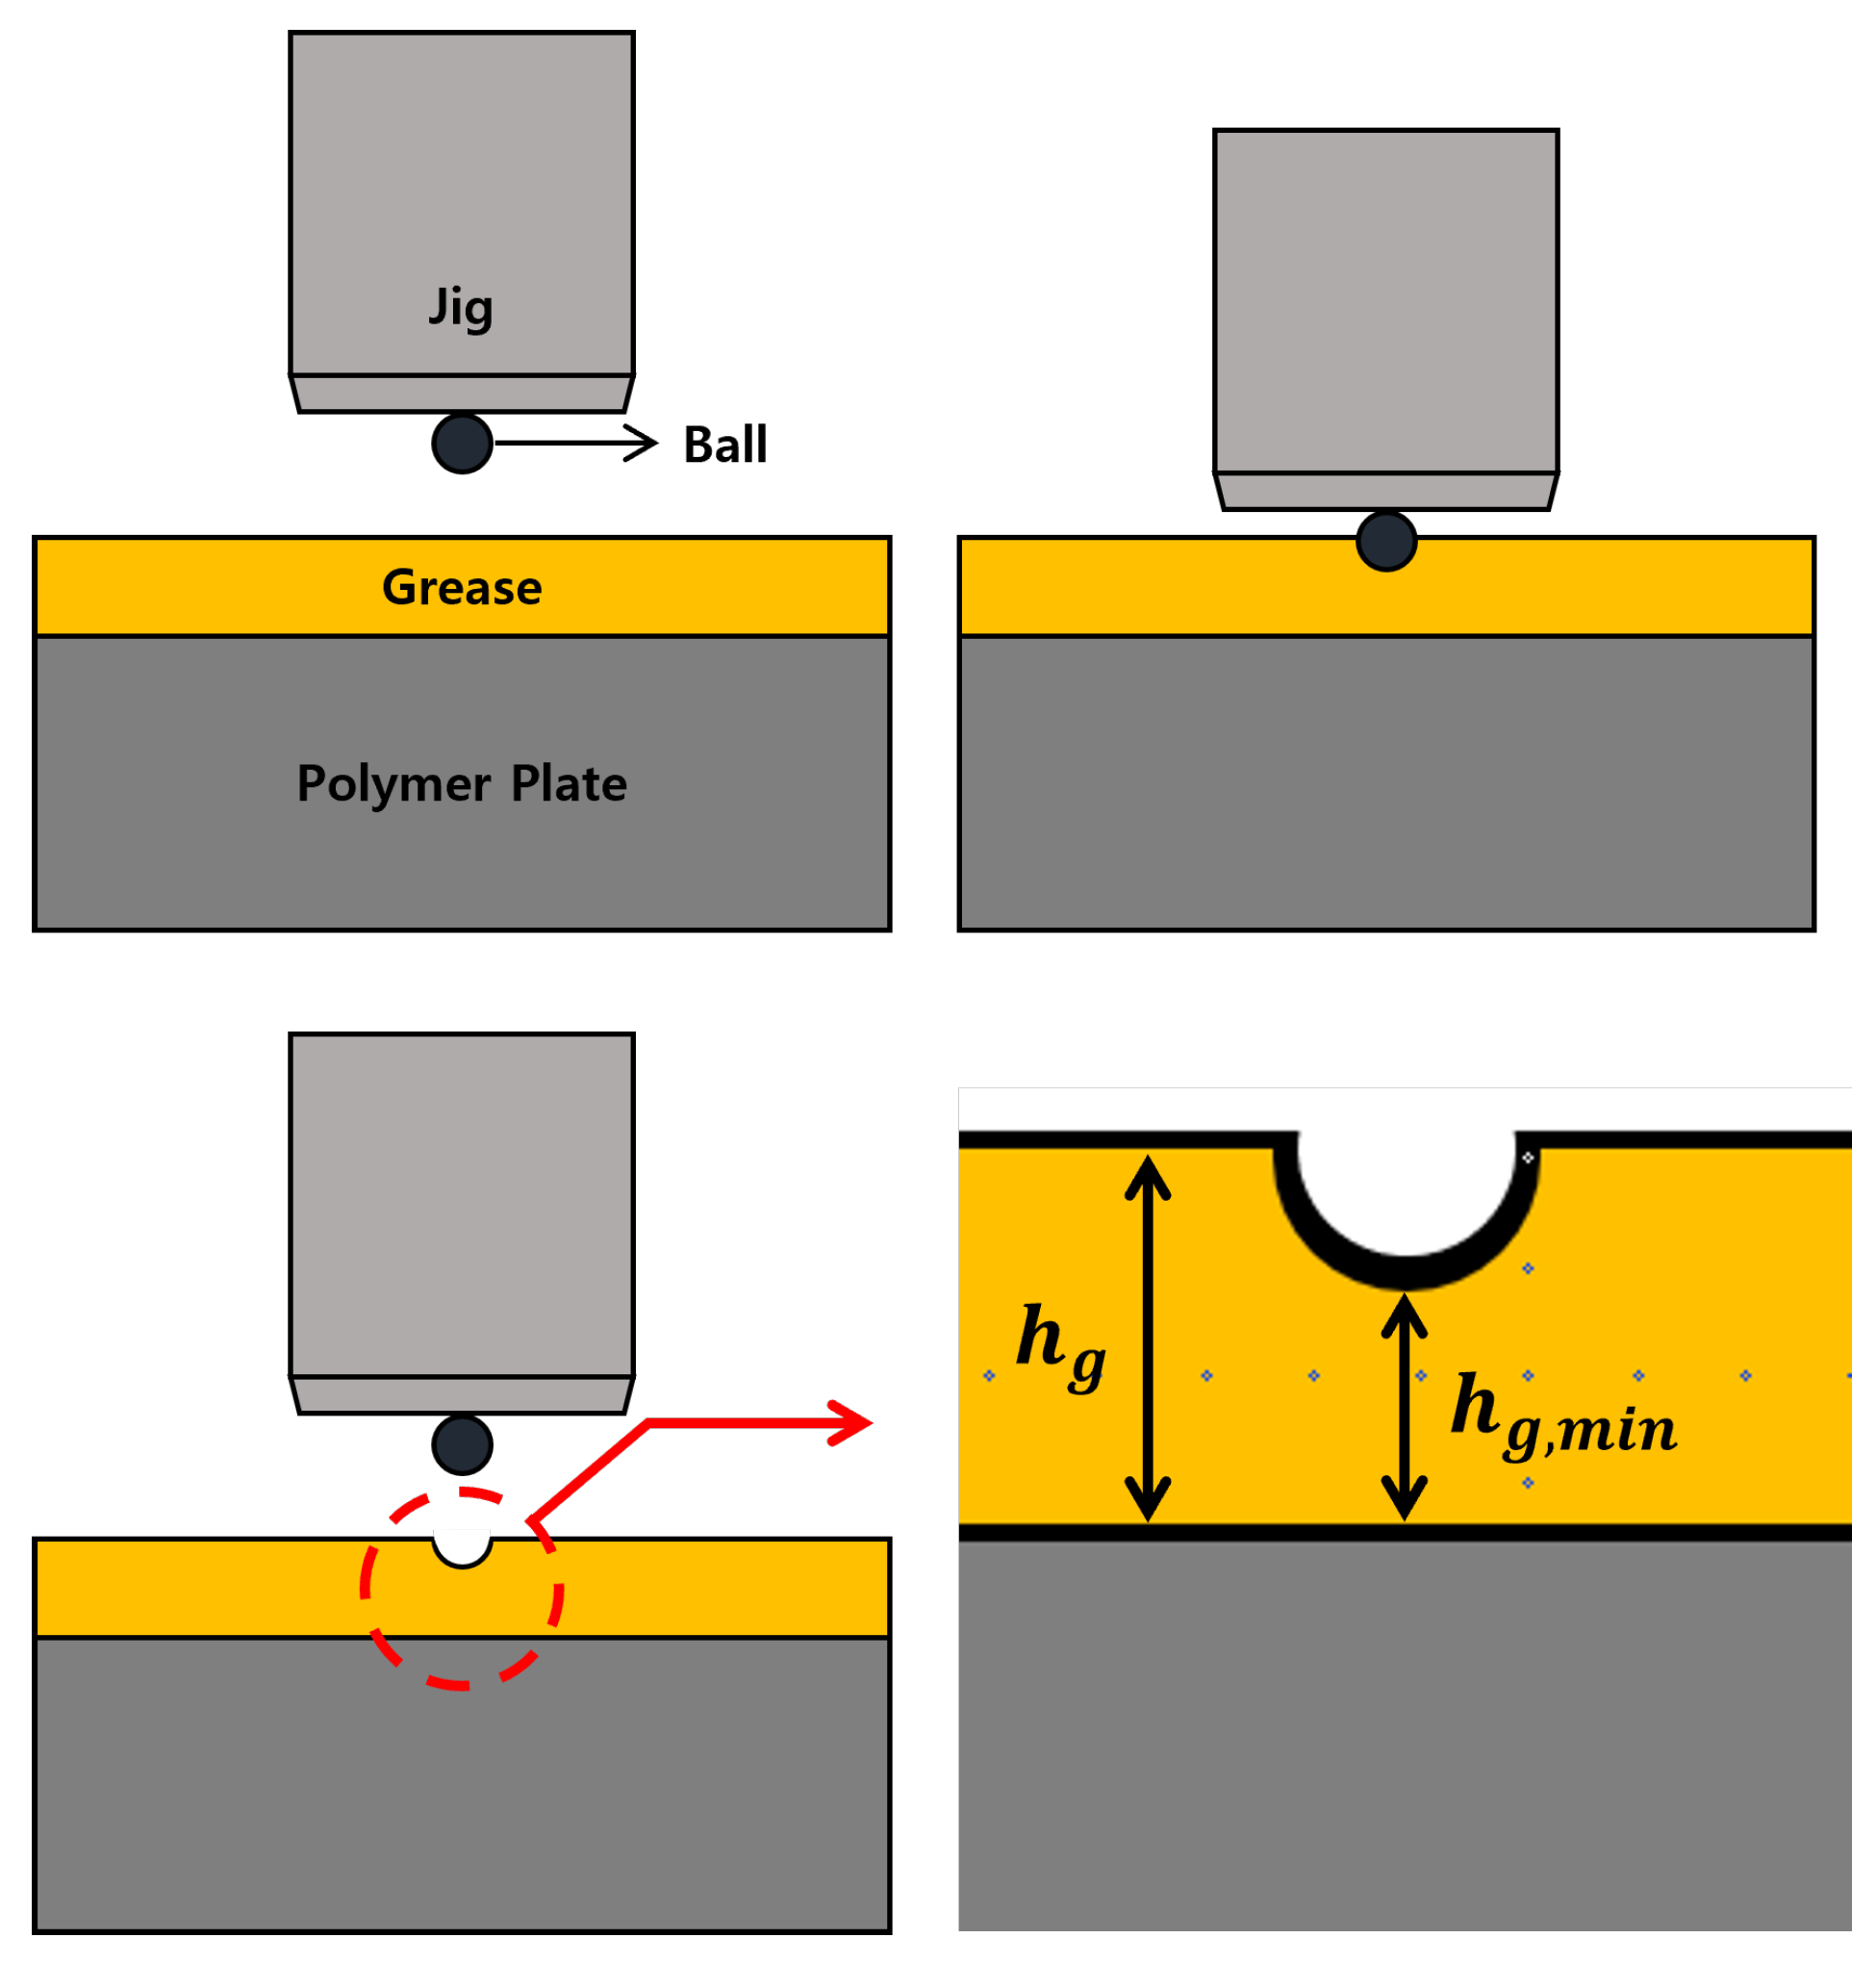
Figure 5.
Images of 3D profiles of grease after 1 cycle at [1] 1 mm/s, [2] 2 mm/s, [3] 4 mm/s, [4] 8 mm/s.
Figure 5.
Images of 3D profiles of grease after 1 cycle at [1] 1 mm/s, [2] 2 mm/s, [3] 4 mm/s, [4] 8 mm/s.

Figure 6.
Images of 3D profiles of grease after 2 cycles at [1] 1 mm/s, [2] 2 mm/s, [3] 4 mm/s, [4] 8 mm/s.
Figure 6.
Images of 3D profiles of grease after 2 cycles at [1] 1 mm/s, [2] 2 mm/s, [3] 4 mm/s, [4] 8 mm/s.

Figure 7.
Images of 3D profiles of grease after 5 cycles. at [1] 1 mm/s, [2] 2 mm/s, [3] 4 mm/s, [4] 8 mm/s.
Figure 7.
Images of 3D profiles of grease after 5 cycles. at [1] 1 mm/s, [2] 2 mm/s, [3] 4 mm/s, [4] 8 mm/s.

Figure 8.
Images of 3D profiles of grease after 10 cycles at [1] 1 mm/s, [2] 2 mm/s, [3] 4 mm/s, [4] 8 mm/s.
Figure 8.
Images of 3D profiles of grease after 10 cycles at [1] 1 mm/s, [2] 2 mm/s, [3] 4 mm/s, [4] 8 mm/s.
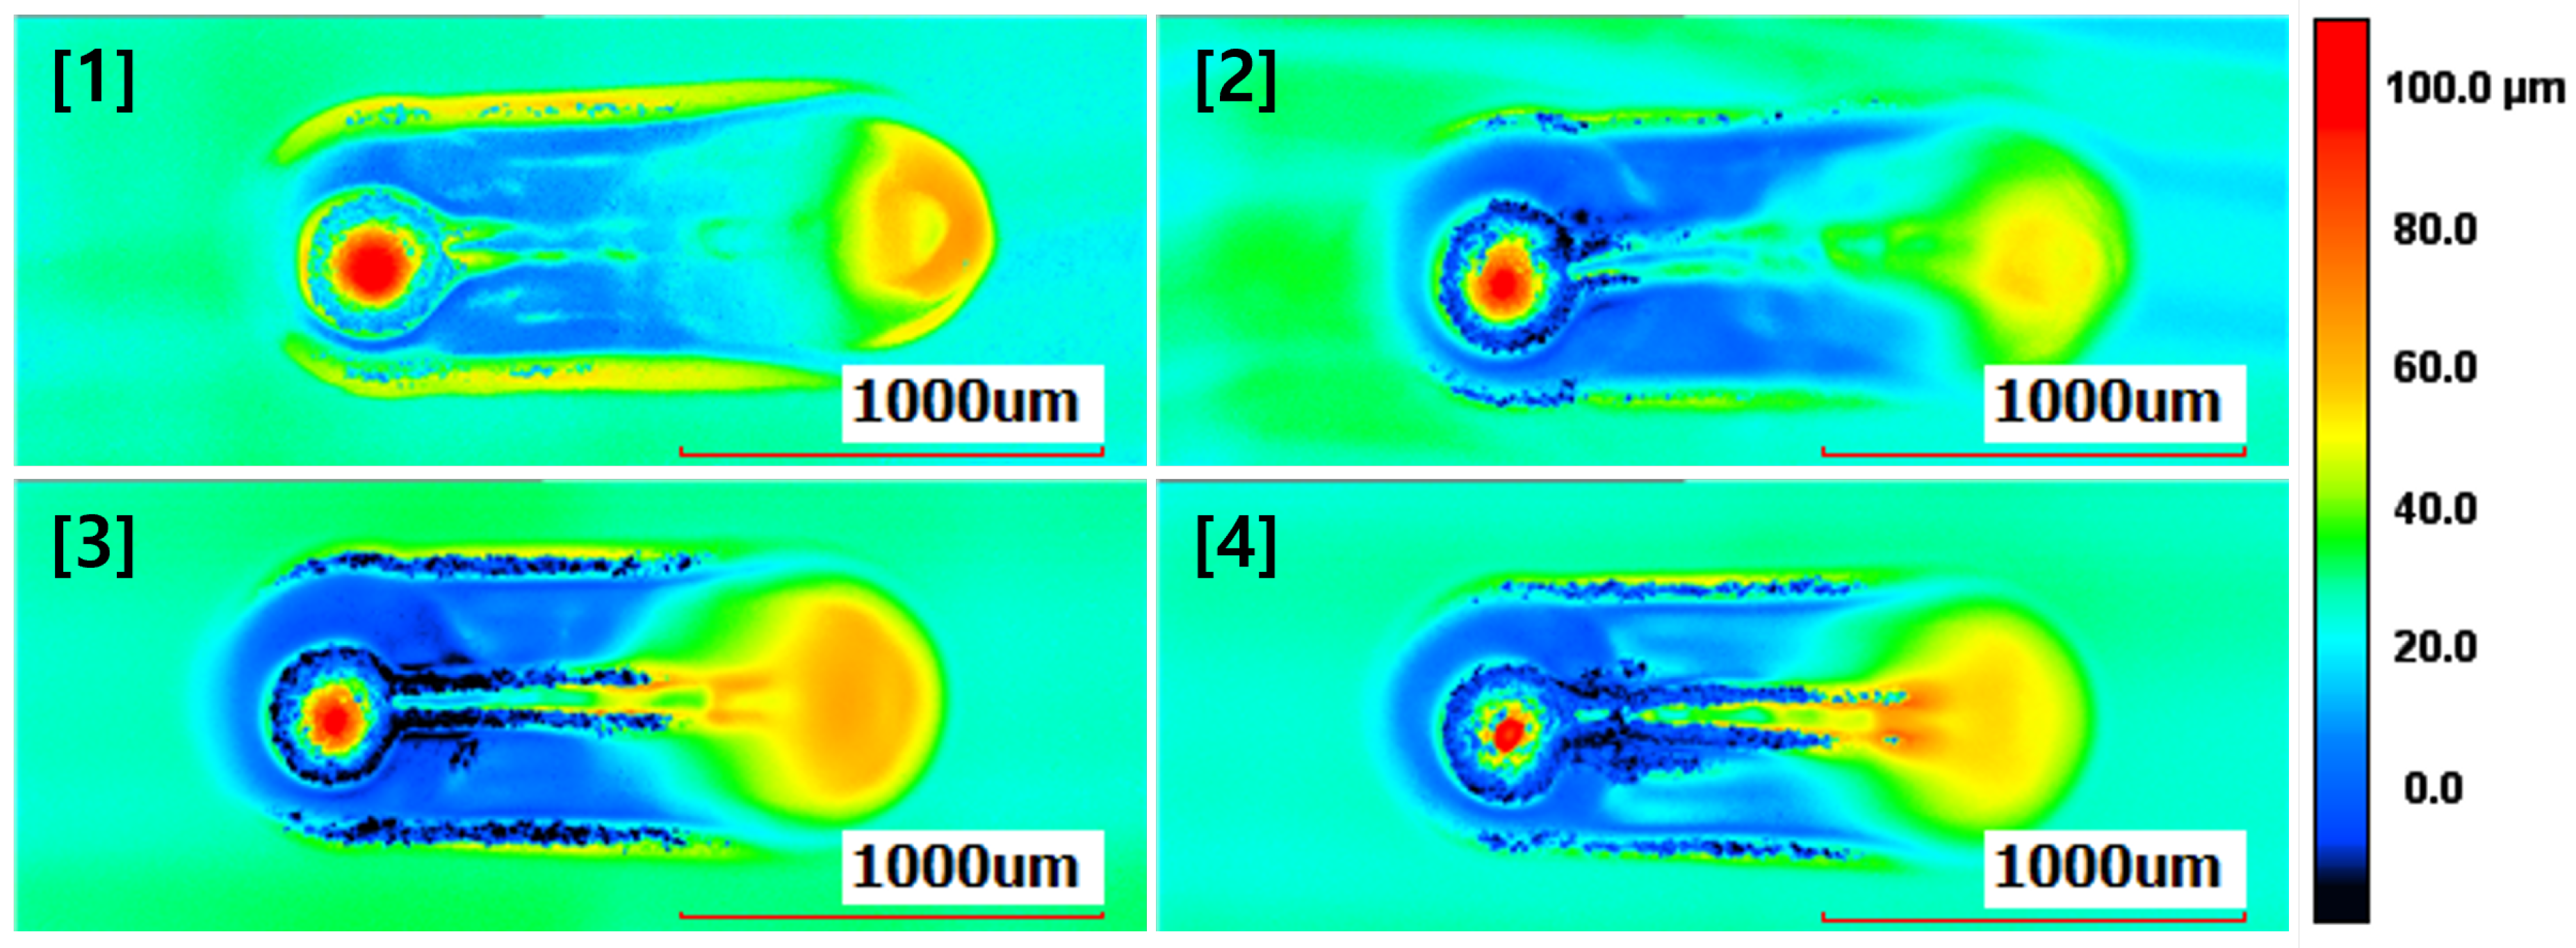
Figure 9.
Results of grease thickness measurement at the central contact area. [1] The grease thickness at the central contact after 1 cycle. [2] The grease thickness at the central contact after 2 cycles. [3] The grease thickness at the central contact after 5 cycles. [4] The grease thickness at the central contact after 10 cycles.

Figure 10.
Results of grease thickness measurement at the non-central contact area.
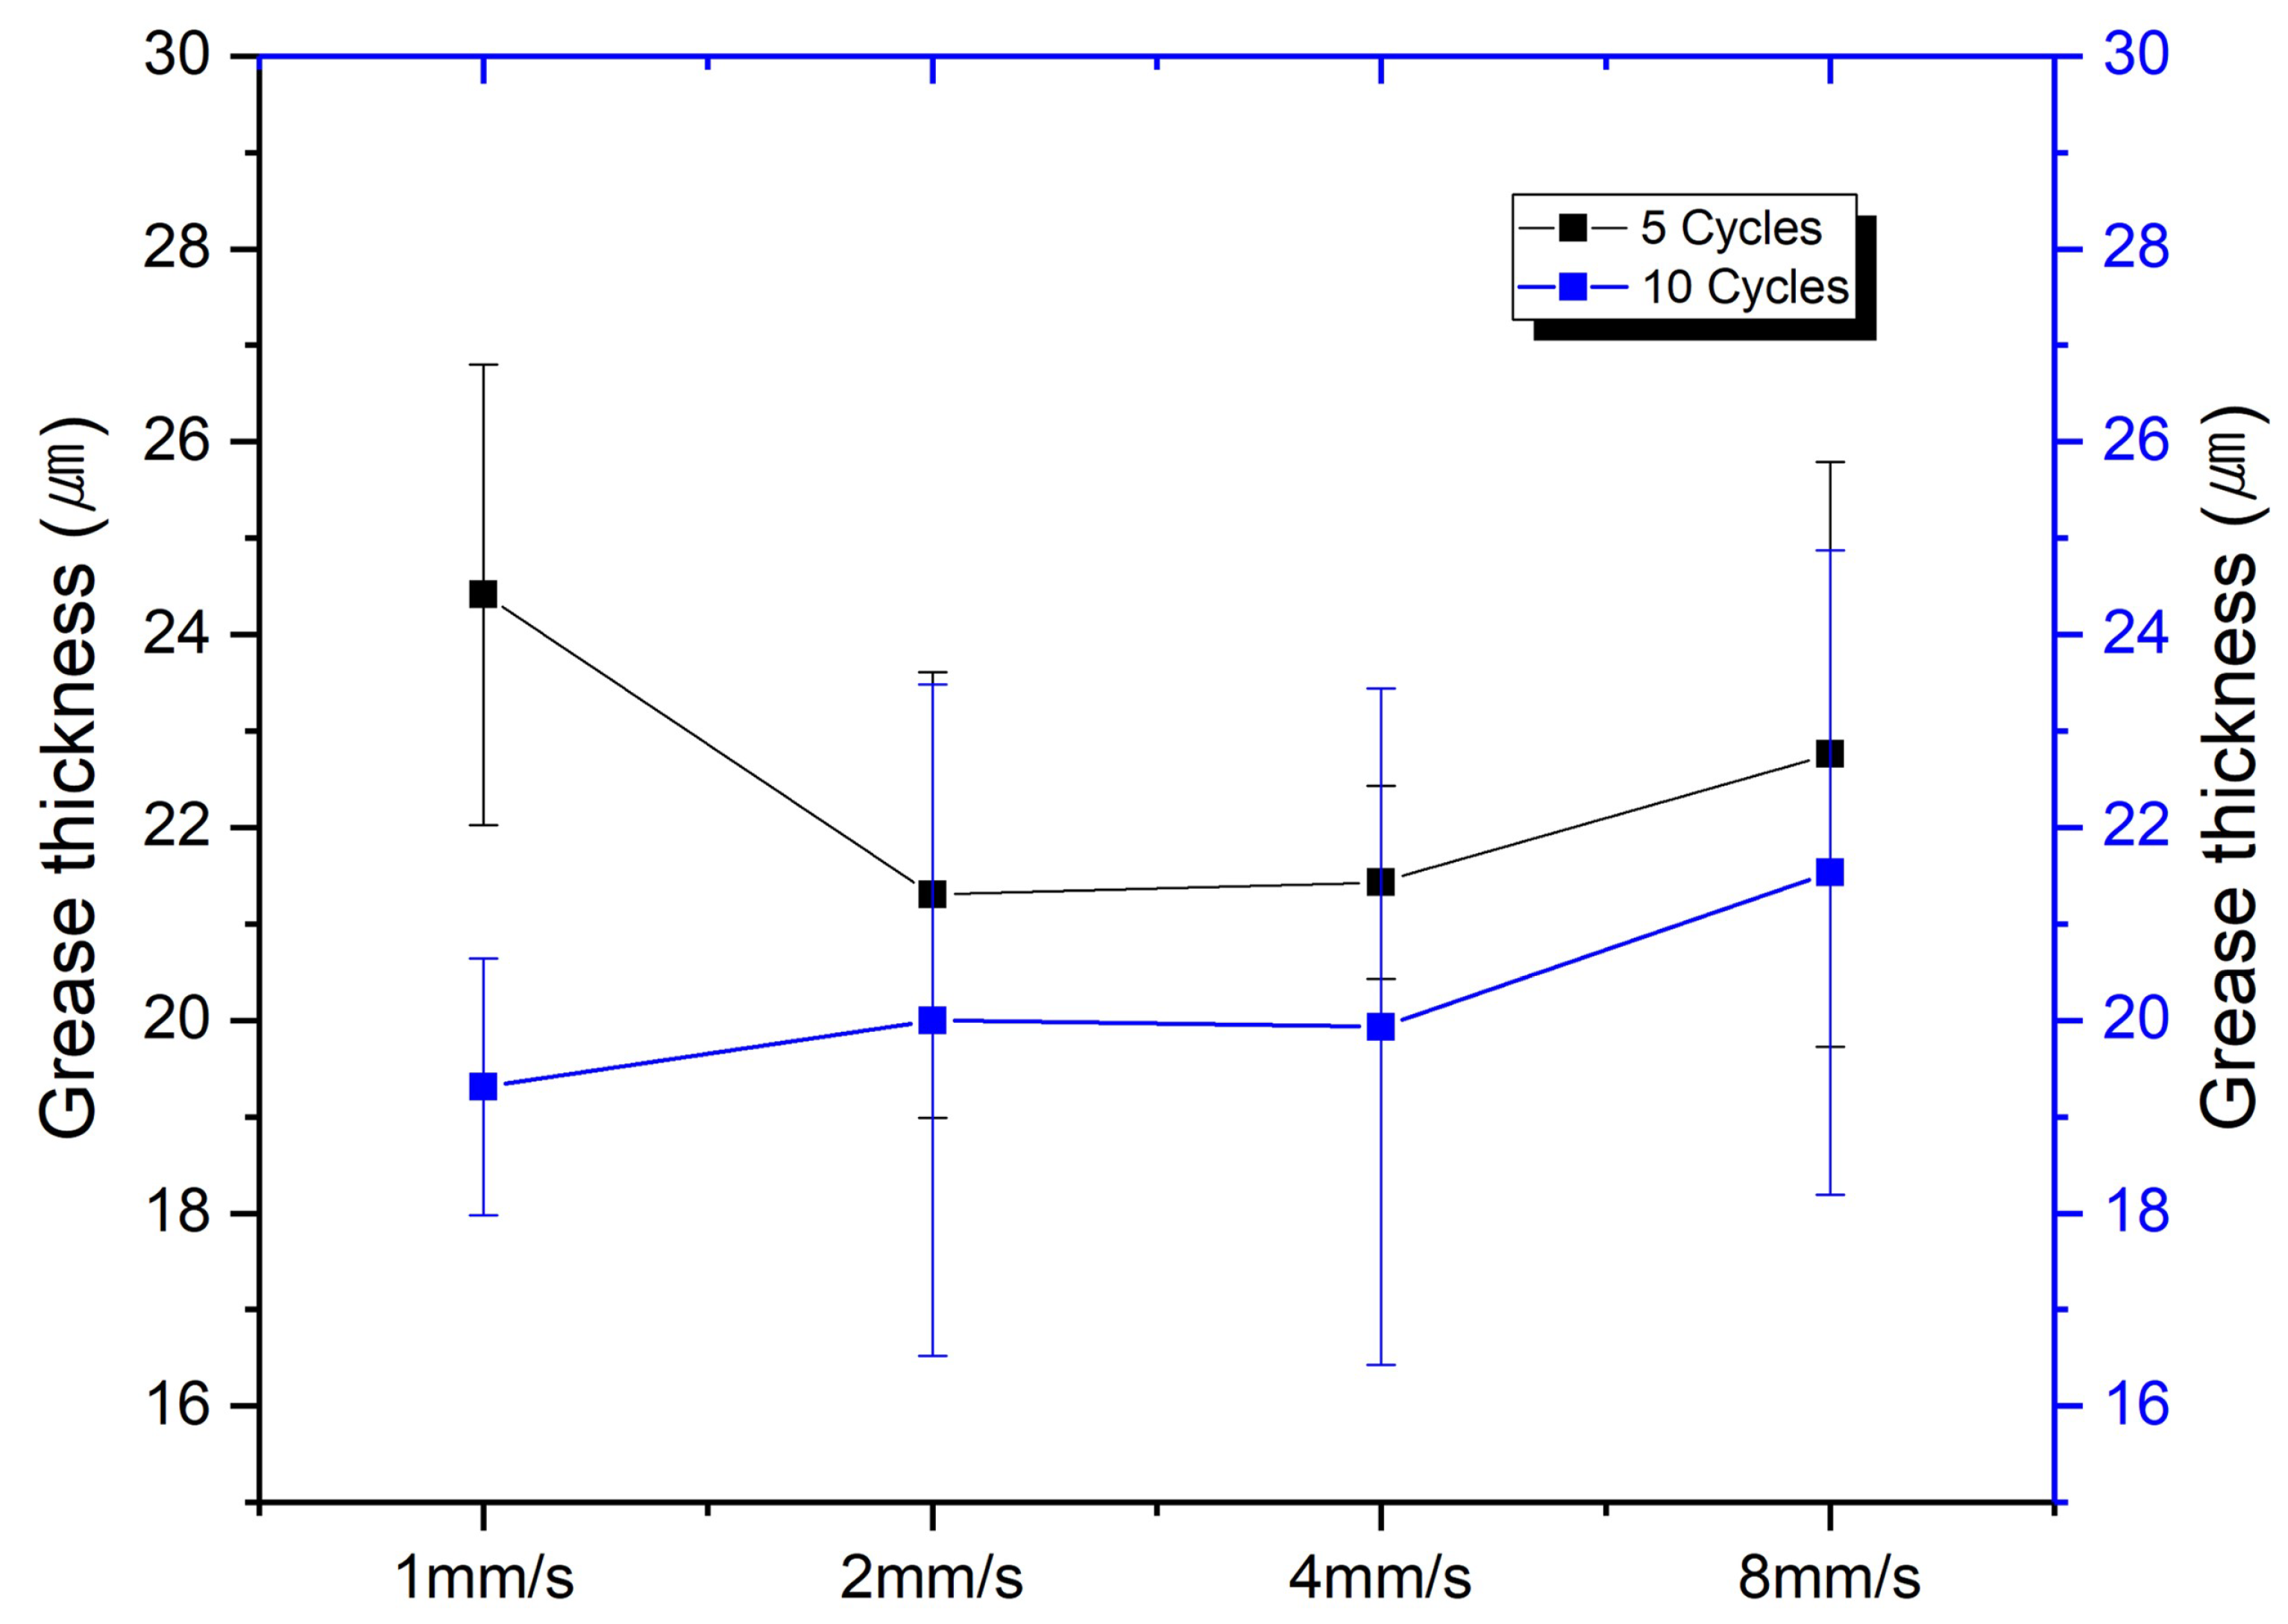
Figure 11.
Schematic of the initial cycle. [1] Upon initial ball contact, [2] displacement of grease due to sliding, [3] changes in effective viscosity, [4–6] repetition of 1, 2, and 3.
Figure 11.
Schematic of the initial cycle. [1] Upon initial ball contact, [2] displacement of grease due to sliding, [3] changes in effective viscosity, [4–6] repetition of 1, 2, and 3.
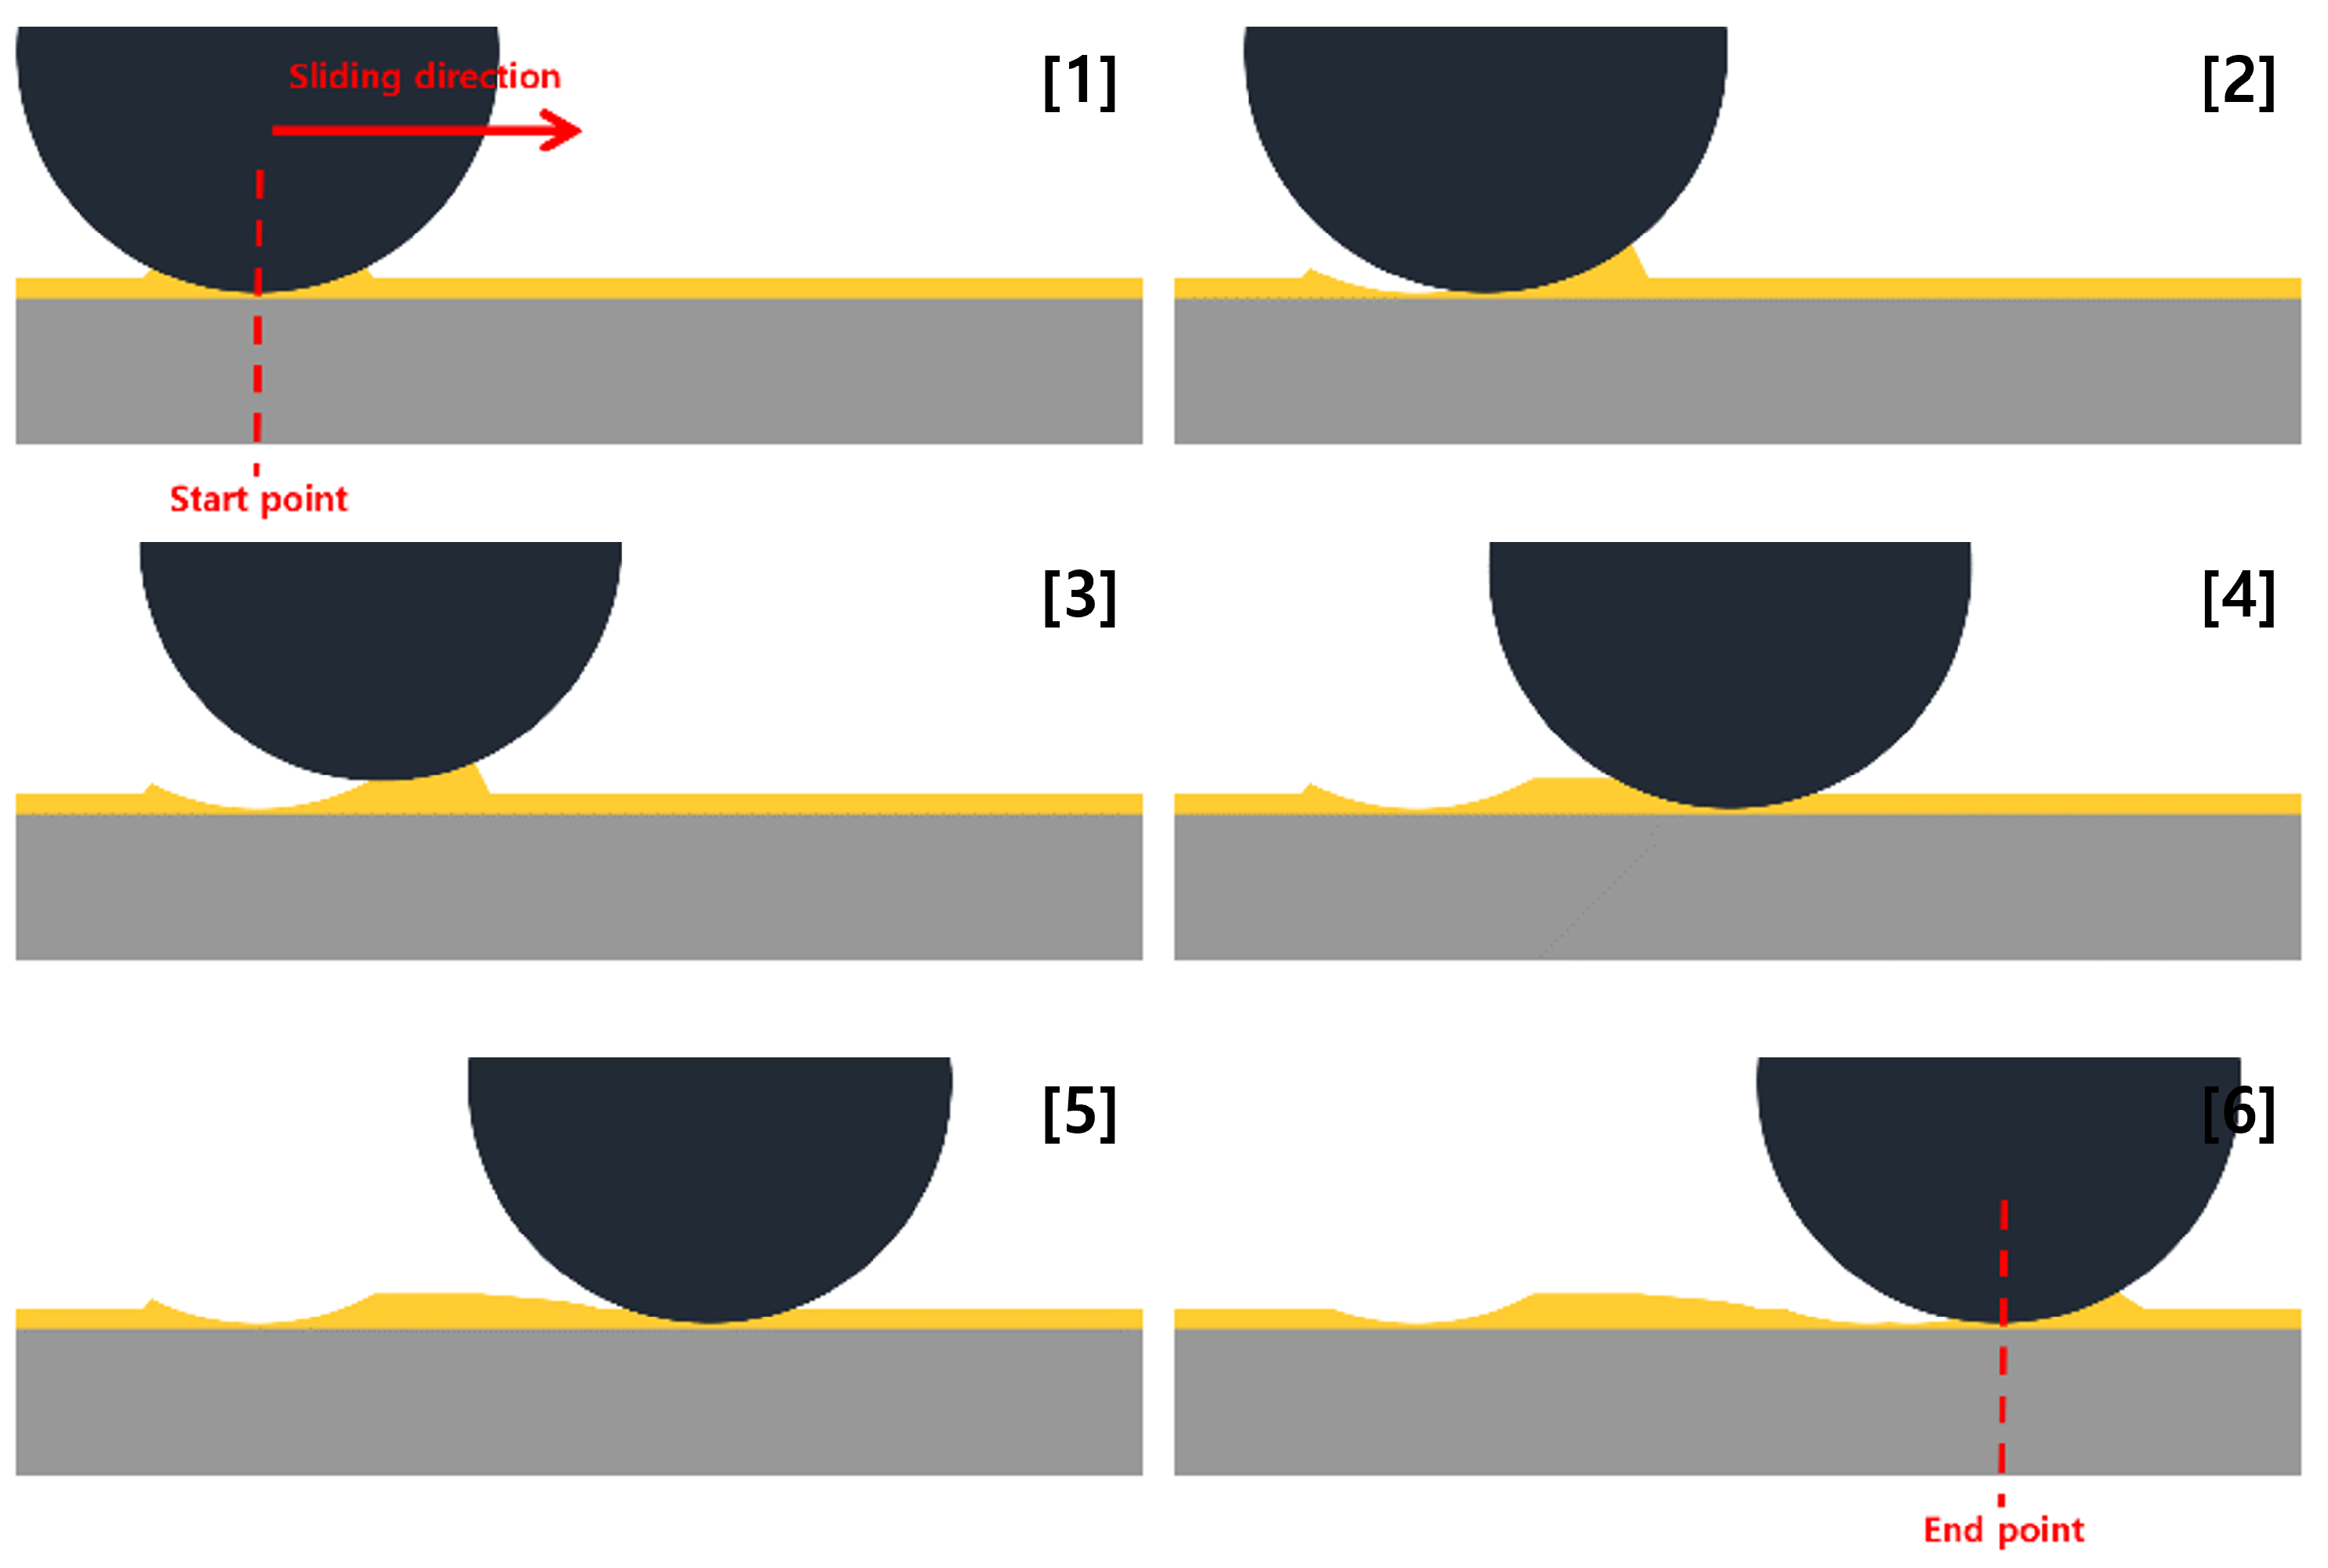
Figure 12.
Schematic of the final cycle. [1] Displaced by the ball and initiated motion at the endpoint with the accompanying distribution of displaced grease. [2–4] Some of the greases stick to the back of the ball and flow back into the track. [5] Removal of the ball after the motion ends.
Figure 12.
Schematic of the final cycle. [1] Displaced by the ball and initiated motion at the endpoint with the accompanying distribution of displaced grease. [2–4] Some of the greases stick to the back of the ball and flow back into the track. [5] Removal of the ball after the motion ends.

Table 1.
Experimental conditions.
| Experimental Condition | Value |
|---|---|
| Load (gf) | 50 |
| Cycle | 1, 2, 5, 10 |
| Sliding Speed (mm/s) | 1, 2, 4, 8 |
| Stroke (mm) | 1 |
Disclaimer/Publisher’s Note: The statements, opinions and data contained in all publications are solely those of the individual author(s) and contributor(s) and not of MDPI and/or the editor(s). MDPI and/or the editor(s) disclaim responsibility for any injury to people or property resulting from any ideas, methods, instructions or products referred to in the content. |
© 2024 by the authors. Licensee MDPI, Basel, Switzerland. This article is an open access article distributed under the terms and conditions of the Creative Commons Attribution (CC BY) license (https://creativecommons.org/licenses/by/4.0/).
Share and Cite
MDPI and ACS Style
Chi, J.-B.; Ma, H.-J.; Lee, G.-S.; Park, J.-H.; Kim, D.-E. Effect of Speed and Number of Sliding Cycles on the Film Formation Behavior of Fluorine-Based Grease. Lubricants 2024, 12, 26. https://doi.org/10.3390/lubricants12010026
AMA Style
Chi J-B, Ma H-J, Lee G-S, Park J-H, Kim D-E. Effect of Speed and Number of Sliding Cycles on the Film Formation Behavior of Fluorine-Based Grease. Lubricants. 2024; 12(1):26. https://doi.org/10.3390/lubricants12010026
Chicago/Turabian StyleChi, Jeong-Bin, Hyuk-Jae Ma, Gyu-Sun Lee, Ju-Ho Park, and Dae-Eun Kim. 2024. "Effect of Speed and Number of Sliding Cycles on the Film Formation Behavior of Fluorine-Based Grease" Lubricants 12, no. 1: 26. https://doi.org/10.3390/lubricants12010026
Note that from the first issue of 2016, this journal uses article numbers instead of page numbers. See further details here.