Abstract
Thermoplastics show great potential due to their lightweight design, low-noise operation, and cost-effective manufacturing. Oil lubrication allows for their usage in high-power-transmission applications, such as gears. The current design guidelines for thermoplastic gears lack reliable estimates for the coefficient of friction of oil-lubricated rolling–sliding contacts. This work characterizes the friction of elastohydrodynamic rolling–sliding contacts with technical and high-performance thermoplastics with oil lubrication. The influence of polyoxymethylene (POM), polyamide 46 (PA46), polyamide 12 (PA12), and polyetheretherketone (PEEK), as well as mineral oil (MIN), polyalphaolefin (PAO), and water-containing polyalkylene glycol (PAGW), was studied. Experiments were carried out on a ball-on-disk tribometer, considering different loads, speeds, temperatures, and surface roughness. The results show that, for fluid film lubrication, there is very low friction in the superlubricity regime, with a coefficient of friction lower than 0.01. Both sliding and rolling friction account for a significant portion of the total friction, depending on the contact configuration and operating conditions. In the mixed to boundary lubrication regime, the sliding friction depends on the thermoplastic and rises sharply, thus increasing the total friction.
1. Introduction
The use of technical and high-performance polymers for machine element applications confers several advantages, including the ability to achieve low noise emissions through damping, the potential for lightweight design, and cost-effective manufacturing. Moreover, in oil-lubricated contacts, very low friction is possible [1,2,3]. The research into oil-lubricated rolling–sliding contacts in steel gears is extensive. However, for thermoplastic gears made of technical or high-performance polymers, significant gaps remain in the understanding of the influence of strongly dependent material properties and the relevant origins of friction. The standard VDI 2736 [4] for thermoplastic gears provides an estimated value for the coefficient of friction of oil lubrication of for gear pairings, but no detailed calculation equations are included. As frictional power losses lead to bulk temperature increases and, consequently, a reduction in the load-carrying capacity, a detailed understanding of the friction in oil-lubricated thermoplastic gear contacts is essential for the development of advanced designs.
In general, oil lubrication is employed in the tribological contact of machine elements for oil film formation and cooling, facilitating low friction and wear. Elastohydrodynamically lubricated (EHL) contacts were classified by Johnson [5] using an elasticity and viscosity parameter. Consequently, any EHL contact can be classified into one of four distinct lubrication regimes, contingent upon the significance of pressure-induced viscosity increases and elastic deformation of the surfaces. Polymers are characterized by their high elasticity, which allows them to be classified in EHL contacts as either elastic isoviscous (IE) or elastic variable viscous (VE) [6,7]. The IE regime typically refers to soft or compliant EHL contacts [1,2,7,8,9,10,11]. Elastomers are typically classified within the IE regime, while thermoplastics, including technical and high-performance thermoplastics, can be classified within a transition regime (TR) between the IE and VE regime. The phenomenon was initially investigated in detail by Hooke [12], who developed an analytical calculation equation for the film thickness of highly loaded elastic contacts in the TR. Subsequently, Myers et al. [6] proposed that the TR should be regarded as an additional lubrication regime. The TR necessitates the consideration of pressure-dependent viscosity in the context of highly deformed contacts [13] in EHL contacts. Myers et al. [6] used a semi-analytical approach to derive an analytical equation for oil film thickness in the TR. Maier et al. [14] conducted numerical calculations of a thermoplastic EHL contact with polyoxymethylene (POM). They found good agreement with the analytical model of Myers et al. [6], with a maximum deviation of 5%. Ziegltrum et al. [15] performed thermal EHL simulations of oil-lubricated technical polymer contacts with polymethyl methacrylate (PMMA). It was observed that, when a polymer was paired with steel, local conformity in the contact occurred due to the significant difference in stiffness between the two bodies. Consequently, the thermoplastic body was subjected to a significantly greater degree of deformation than the steel material. This resulted in a curved contact area [14].
Besides strongly thermal-dependent and non-linear elasticity behaviors, polymers can exhibit a viscoelastic material behavior, which is characterized by a combination of viscous and elastic properties when deformed under a load. The first theoretical investigations of the rolling friction of dry soft contacts were performed by Hunter [16]. He demonstrated that rolling friction originates from an asymmetric pressure distribution, which is a consequence of viscoelastic material properties. Hooke and Huang [17] performed numerical calculations to investigate the impact of viscoelasticity on EHL contacts. They showed that viscoelasticity can influence the pressure distribution and oil film formation significantly. The pressure distribution shifted towards the contact inlet and showed a strong asymmetric distribution. The presence of viscoelastic behavior can be assessed using the Deborah number. This characteristic number indicates that the viscoelastic behavior is dependent not only on the material but also on the load frequency and is, therefore, dependent on the operating condition. Numerical and experimental investigations of the visco-EHL (VEHL) contact were carried out for PMMA by Putignano and Dini [18], Zhao et al. [19,20], and Krupka et al. [20]. They were able to measure the viscoelastic influence of the material on the oil film formation for the given experimental operating conditions.
An experimental analysis of the coefficient of friction of a soft EHL contact with an elastomer and non-technical liquids was performed by de Vicente et al. [1] for different lubrication regimes. Based on the measurements, they derived a calculation equation for the coefficient of friction of soft EHL contacts with ideal smooth surfaces. Furthermore, they performed numerical EHL simulations and evaluated the Couette as well as the Poiseuille friction portions. Subsequently, Vicente et al. [2] conducted experiments to measure the rolling and sliding friction of a lubricated elastomer contact using a ball-on-disk tribometer. Their findings indicated that, under fluid film lubrication, sliding friction originated from the shearing of the oil (Couette friction), while, in boundary lubrication, it mainly arose from the adhesion of the contacting asperities. Conversely, rolling friction could be attributed to the asymmetric contact pressure distribution (Poiseuille friction), and the hysteresis within the bulk material. Subsequently to this, Myant et al. [8] performed experimental investigations of a soft EHL contact with elastomers, employing a ball-on-disk tribometer. They investigated the influence of load and elasticity on rolling and sliding friction with non-technical liquids. In comparison to the analytical calculation equation of de Vicente et al. [1], they found, overall, a good accordance of the coefficient of friction for sliding and rolling. To investigate the viscoelastic friction of soft EHL contacts, Putignano et al. [21,22] carried out experimental investigations using a ball-on-disk tribometer under dry conditions. The measured rolling friction was evaluated as viscoelastic friction, while the sliding friction was considered to be Coulomb friction. This approach yielded good accordance with the developed model for viscoelastic friction proposed by Carbone and Putignano [23]. They later measured the temperature in the rolling contact, which they found to be in good accordance with their model. Numerical and experimental investigations on the rolling and sliding fluid friction in an EHL contact with thermoplastic POM was performed by Maier et al. [14]. They found that rolling and sliding fluid friction are of a comparable magnitude for the investigated conditions. The local conformity in the contact of steel/thermoplastic pairing results in a curved contact area, which can affect the friction evaluation for soft and hard contacts [16,24]. As a ball-on-disk tribometer considers contact with different body geometries, the influence of the contact configuration can be studied. For rubber elastomers, Sadowski and Stupkiewicz [25] found that the contact configuration does not affect the measured friction. Quinn et al. [26] also carried out experimental investigations on the influence of contact configuration for the low-stiffness polymer polydimethylsiloxane (PDMS). They found that the soft-disk/hard-ball configuration resulted in a higher friction than the hard-disk/soft-ball combination. This discrepancy was attributed to the differing hysteresis behaviors exhibited by the two configurations. Reitschuster et al. [3] performed experimental studies on the friction of oil-lubricated thermoplastics using a twin-disk tribometer. They examined the total friction for various rolling–sliding conditions when PEEK and polyamide 66 (PA66) were in contact with steel. They measured very low interfacial friction in the range of superlubricity for a high, relative film thickness. Friction by hysteresis losses was recognized through the temperature increase in the bulk material and was noticeably higher for polyamide 66 (PA66) than PEEK.
The above literature review shows that the tribological contact with polymers is a strong focus of research. EHL contacts with thermoplastics, including technical and high-performance polymers, are classified by the transition lubrication regime. When a polymer is paired with steel, local conformity in the contact occurs. Viscoelastic effects can strongly influence the pressure and film thickness distribution. Friction in polymer EHL contacts is shown to be influenced by interfacial friction due to rolling and sliding fractions and by hysteresis losses, mainly due to viscoelastic effects. However, many results are based on the analysis of soft contacts with elastomers. A systematic analysis of the friction in EHL contacts with technical and high-performance thermoplastics is lacking.
The objective of this study is to characterize the friction of EHL contacts with technical and high-performance thermoplastics under oil lubrication. The influence of the contact configuration, thermoplastic material, lubricant, load, oil temperature, and surface roughness are systematically investigated under rolling–sliding conditions on a ball-on-disk tribometer. Focus is put on the rolling and sliding friction portion. The results improve the understanding of friction in oil-lubricated rolling–sliding contacts, similar to those in cylindrical polymer gears. This work is an extended version of the conference abstract [27] that was originally presented at the 64th German Tribology Conference 2023.
2. Materials and Methods
In order to analyze the influences on the friction in thermoplastic EHL contacts under oil lubrication, different thermoplastics with different oils in various configuration conditions were investigated.
2.1. Experimental Configuration
The experiments were performed on an MTM2 ball-on-disk tribometer. Figure 1 shows the mechanical layout of the test chamber, wherein the ball and the disk are mounted on a rotating shaft each, which can be driven independently to adjust for any rolling–sliding conditions. Over a load arm, both specimens can be put into contact and enforced via a load spring.
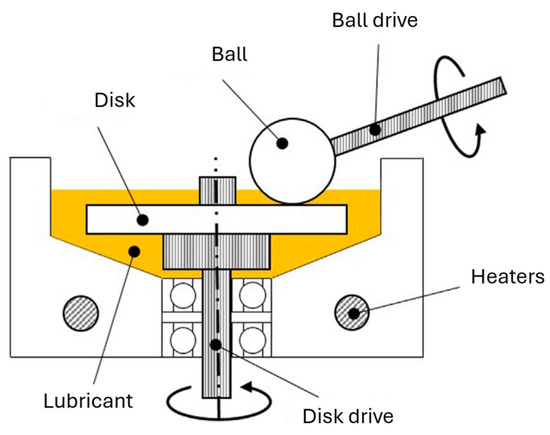
Figure 1.
Schematic representation of the mechanical layout of the MTM2 test chamber from Hofmann et al. [28].
The surface speed of the ball is designated with and that of the disk with , respectively. The mean velocity , also referred to as rolling speed , is defined as follows:
The sliding speed is defined as follows:
The slide-to-roll ratio in the contact is then defined as follows:
The friction force and the normal force are measured each with a load cell at the load arm so that a coefficient of friction can be evaluated, as given in Equation (4). The measured total friction force is composed of different friction portions and can, therefore, be divided according to Vicente et al. [2] into the rolling friction and the sliding friction . The total coefficient of friction is the sum of the rolling coefficient of friction and the sliding coefficient of friction .
In order to differentiate between rolling and sliding friction, negative and positive s were imposed on the MTM2. In both cases, the sliding friction differed in its direction, but the rolling friction direction remained the same. By measuring the friction force in both situations, the rolling and sliding friction could be evaluated afterward. For details of this procedure in MTM2, considering the elimination of the offset of the load cell, one can refer to Vicente et al. [2].
2.2. Thermoplastics
Jain and Patil [29] provide an overview of the range of polymers used in gear applications. In this study, four different technical and high-performance thermoplastics were considered, as shown in Table 1. Polyoxymethylene (POM) and polyamides PA12 and PA46 are typical materials for plastic gears [14,30,31,32,33]. The high-performance thermoplastic polyether ether ketone (PEEK) is becoming increasingly popular for use in gears that require the highest power density [31,34,35,36]. The investigated thermoplastics exhibit differences in stiffness and in the glass transition temperature , which primarily influences the impact of mechanical material properties, such as stiffness and viscoelasticity. All thermoplastics were non-reinforced, unfilled, and commercially available. The PEEK material used was Vestakeep 5000G (Evonik, Essen, Germany), the PA12 material was Vestamid L1940 (Evonik), the PA46 was Stanyl TW441 (Envalior, Dusseldorf, Germany), and the POM material used was Delrin 100 NC010 (DuPont, Wilmington, DE, USA). For POM, a homopolymer polyoxymethylene (POM-H) was used.

Table 1.
Technical and high-performance thermoplastics considered according to [37].
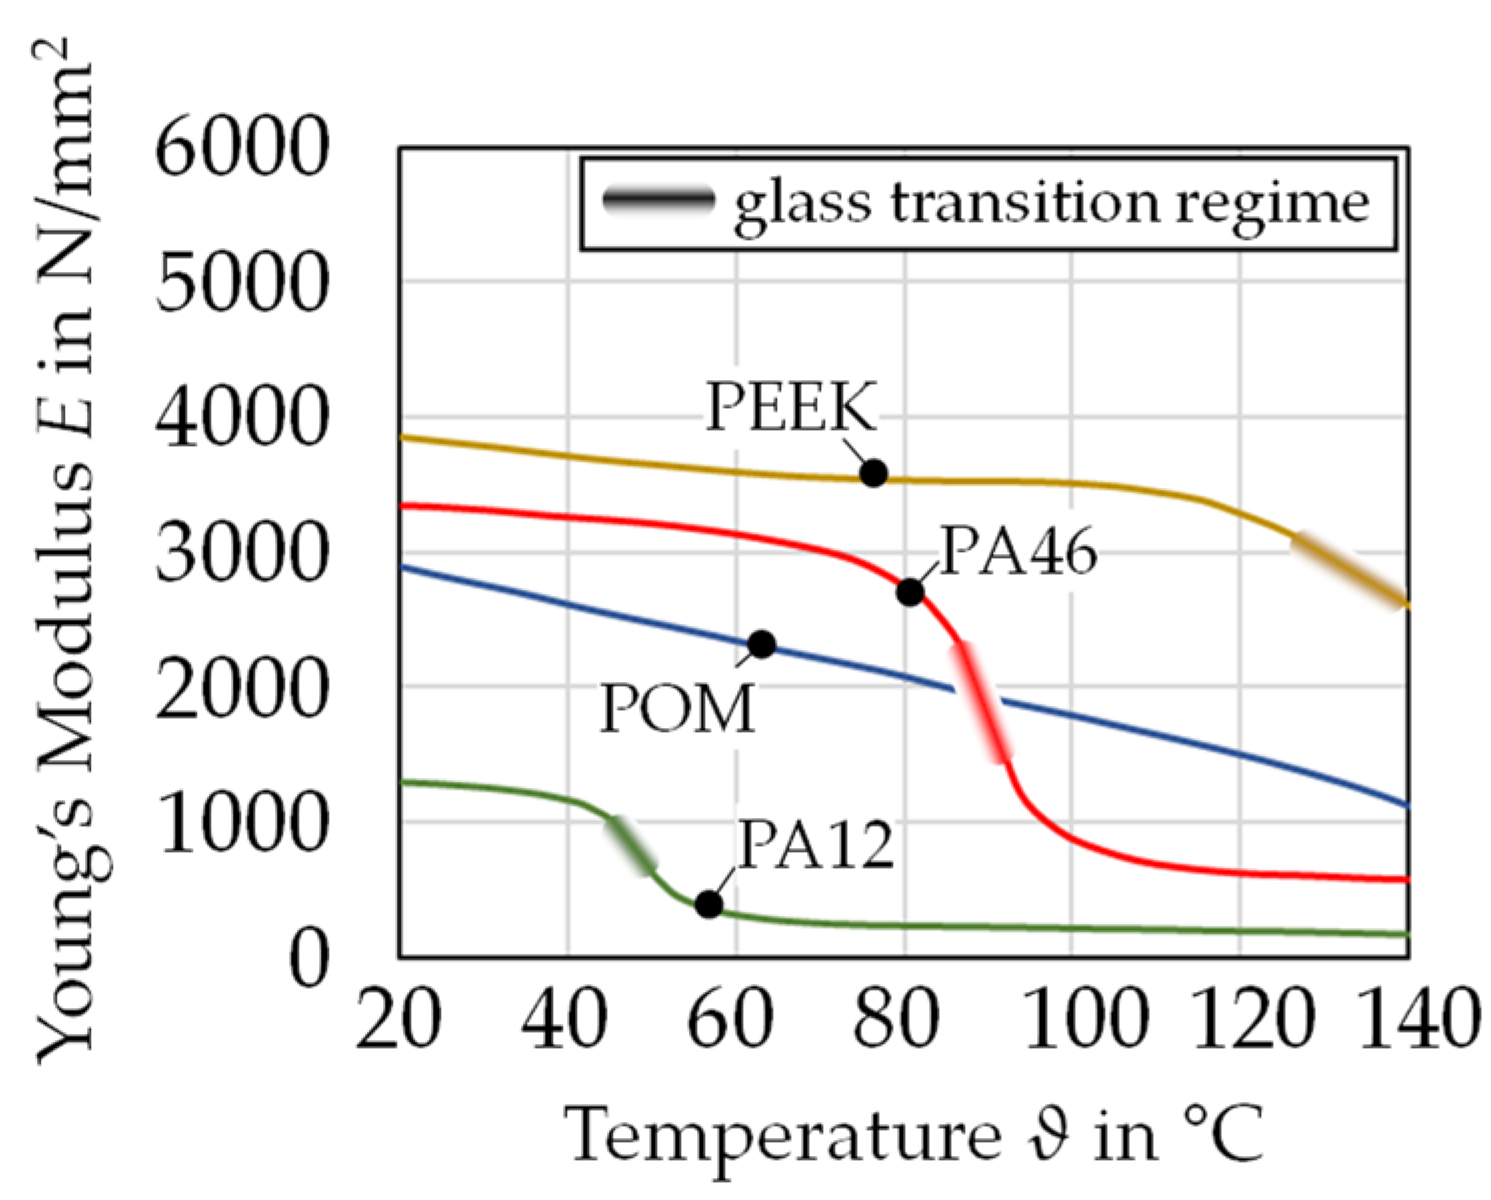
Figure 2 illustrates the dependence of Young’s modulus of the thermoplastics studied on the temperature for the dry state, as depicted in the VDI 2736 [37] standard, except for Poisson’s ratio of PA12, which is assumed to be identical to that of PA46, since no value is given. It is a characteristic of thermoplastics that their stiffness decreases at elevated temperatures. The glass transition regimes are also indicated. In the glass transition regimes, there is a significant reduction in stiffness. As the glass transition temperature for POM is approximately at −60 °C, it can be seen that there is no visible step in the temperature decrease but rather a strong and nearly linear decrease over the indicated temperature range. Among the considered thermoplastics, PEEK has the highest thermal stability. It should be noted that polyamides change their stiffness and glass transition temperature behaviors with changing humidity. For details, see [37,38].
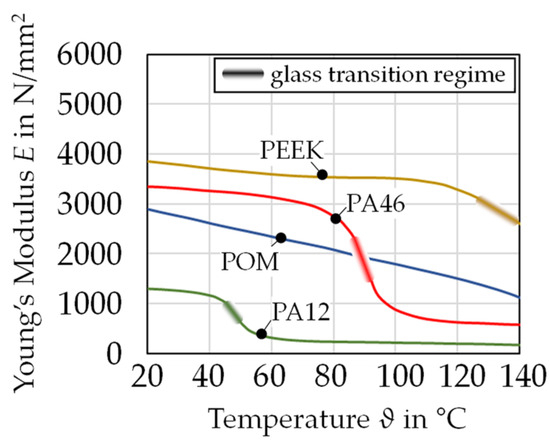
Figure 2.
Temperature dependence of Young’s modulus of the studied thermoplastics according to VDI 2736 [37] for a dry state.
2.3. Test Specimens
The ball of the MTM2 tribometer had a diameter of 19.05 mm. The disks had a diameter of 46 mm and a thickness of 6 mm at the running track surface. The thermoplastic disks were mounted on a carrier plate made of steel with a thickness of 2 mm. The tribological surfaces of the tested disks and balls were machined from semi-finished products, ground, and polished isotropically. The arithmetic mean roughness of the polished surfaces was . In order to investigate the influence of the surface roughness of the thermoplastic material, quasi-isotopically ground PEEK disks with arithmetic mean roughness values of approx. and were considered. The roughness values were obtained from tactile measurement radially on the disk’s running track with a measurement length of 4 mm and a cut-off wavelength of 0.08 mm (for and (for and ).
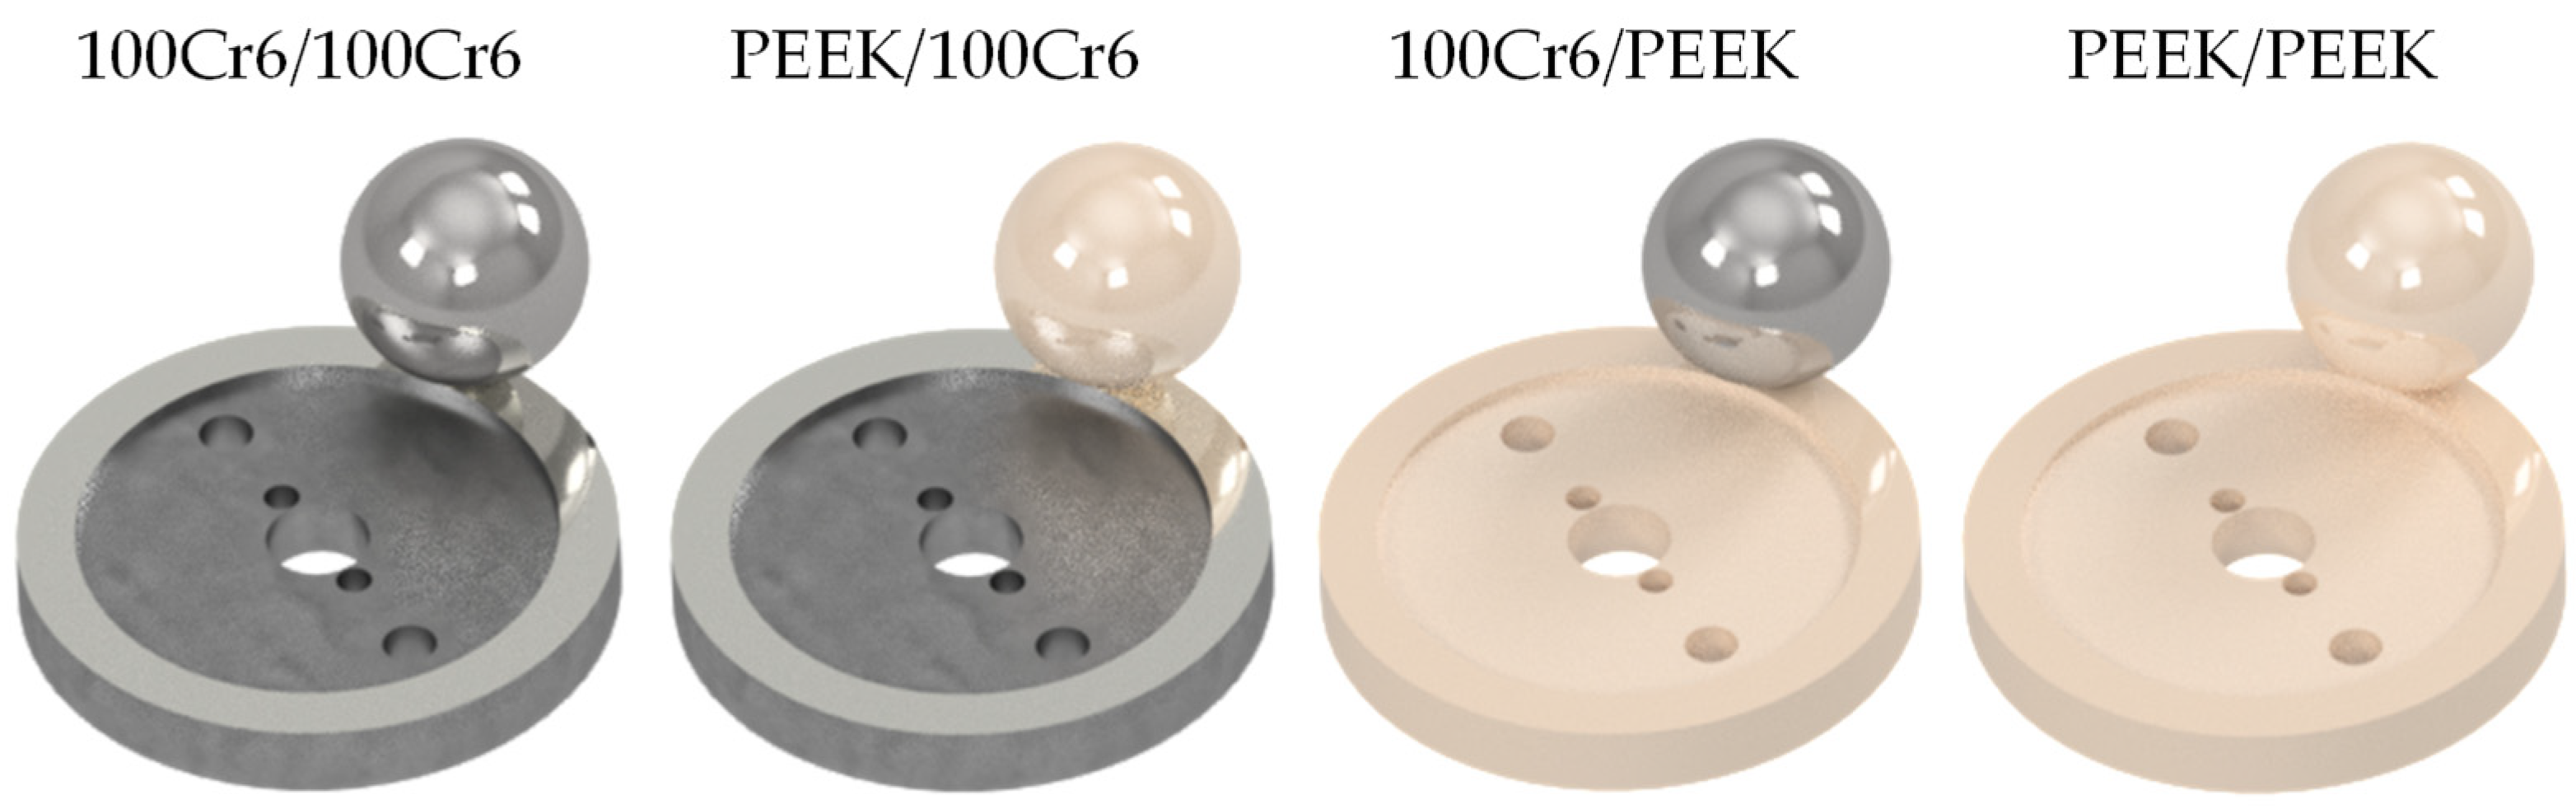
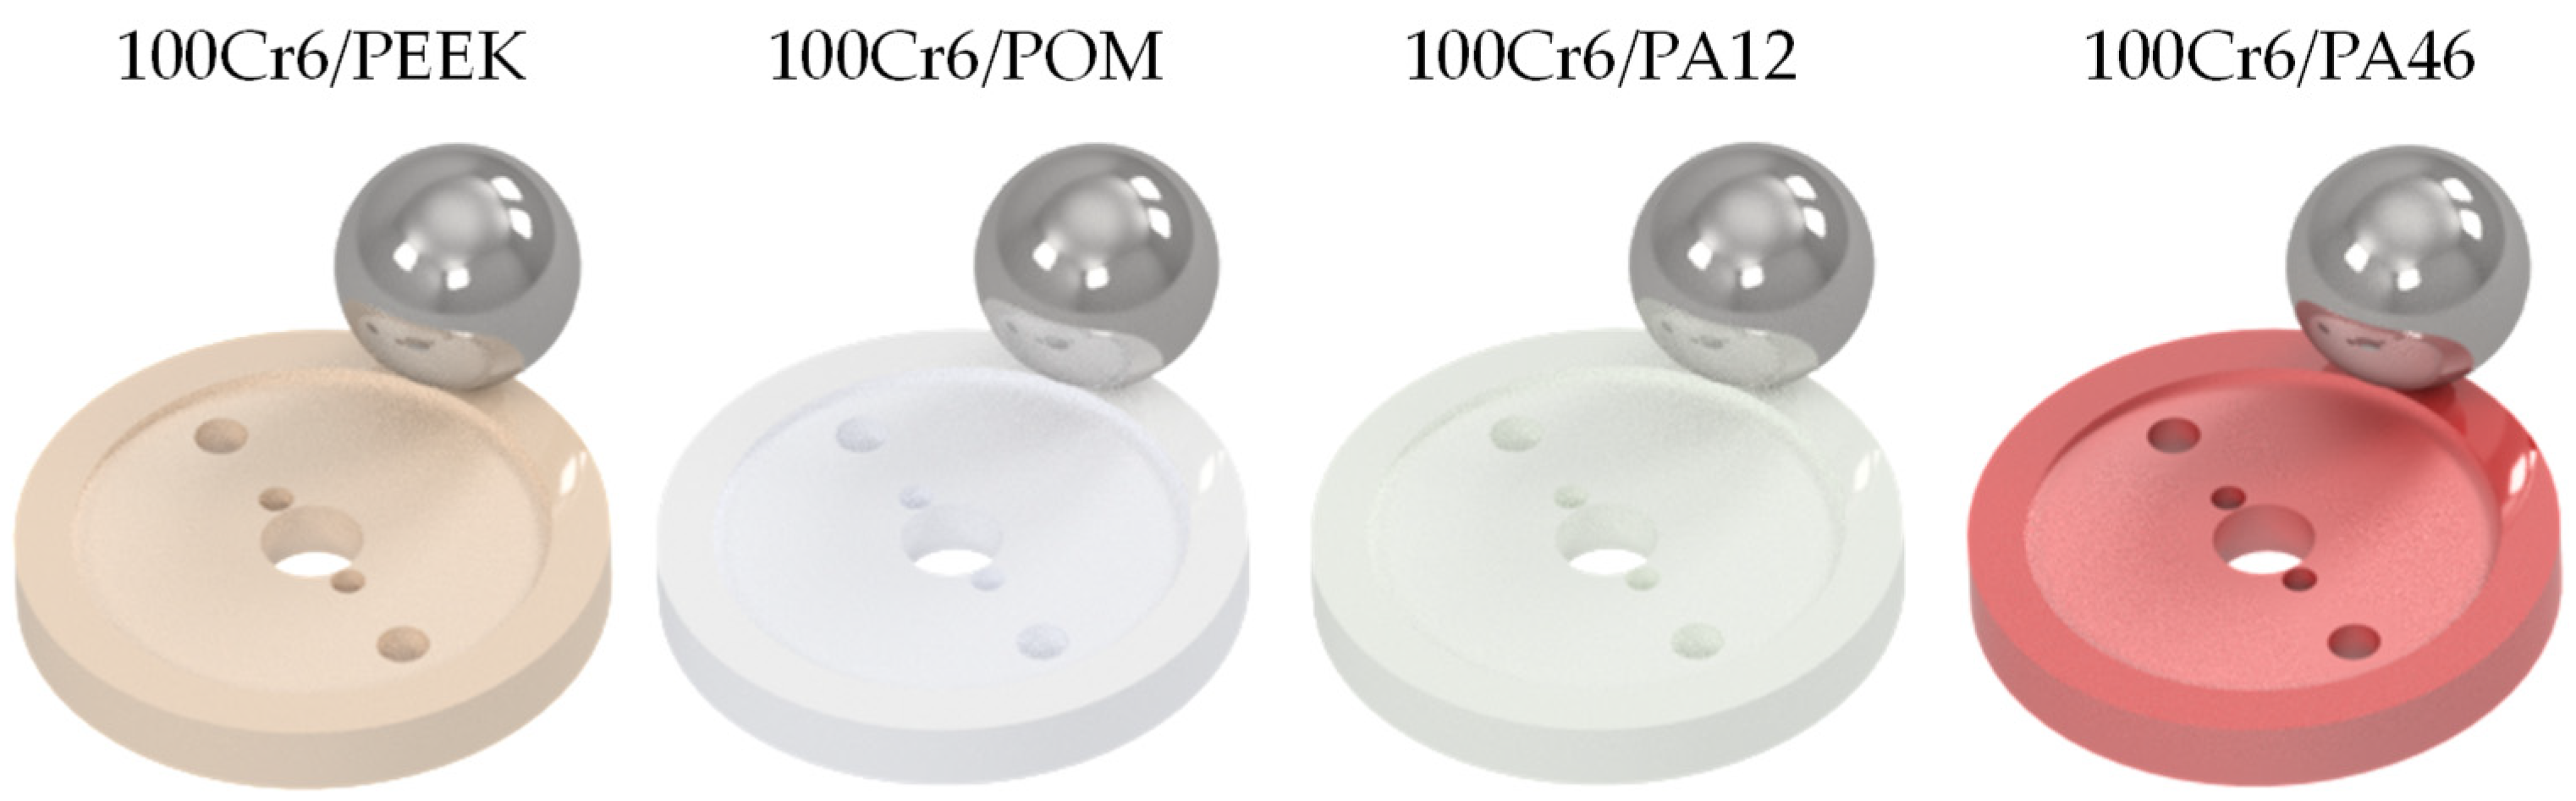
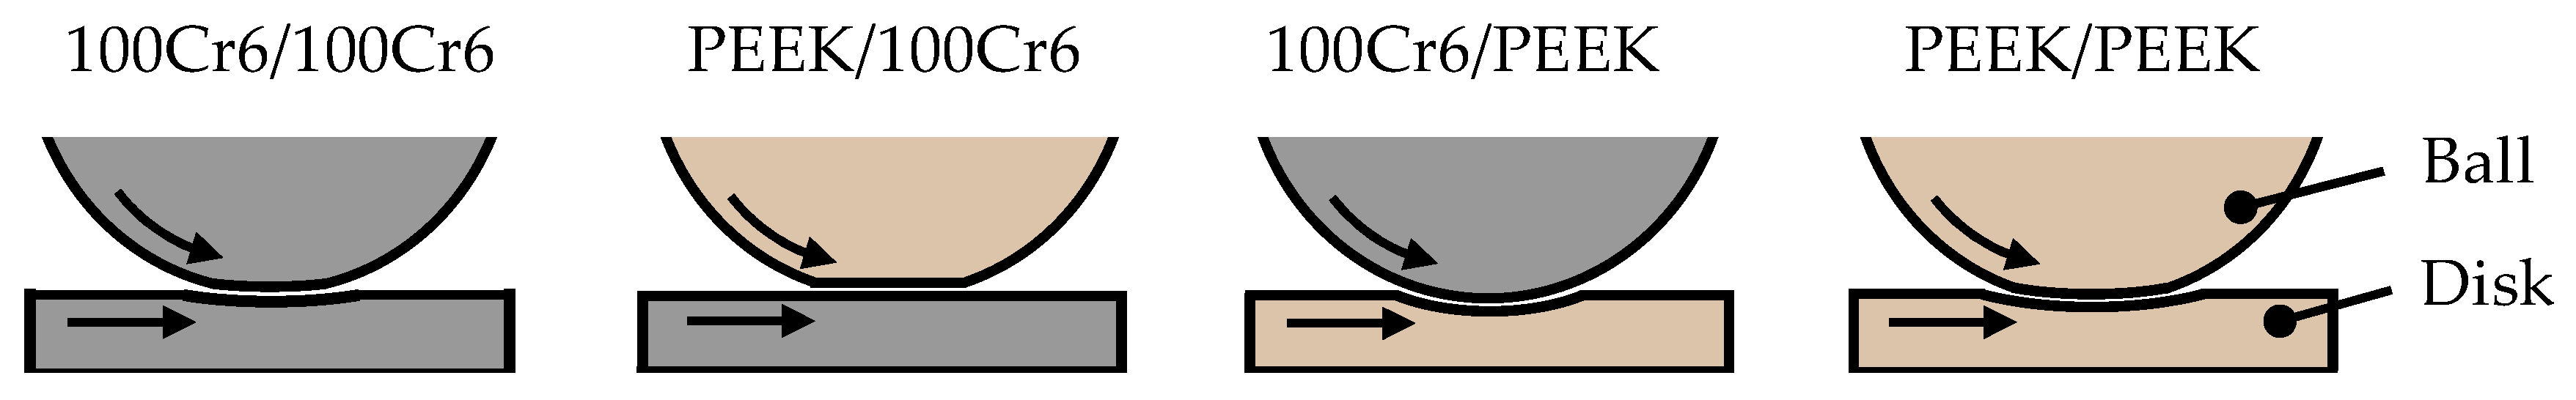
It is common practice to pair thermoplastic gears with steel gears, thereby creating a hybrid contact between the two materials. In order to investigate the influence of different contact configurations, polished PEEK and 100Cr6 specimens were paired in a combination of ball/disk configurations, including PEEK/PEEK, PEEK/100Cr6, 100Cr6/PEEK, and 100Cr6/100Cr6. The considered contact configurations are shown in Figure 3. In order to investigate the influence of thermoplastic materials, polished steel balls were paired with polished disks made from PEEK, POM, PA12, and PA46, as illustrated in Figure 4.

Figure 3.
Considered contact configurations at the MTM2.

Figure 4.
Considered thermoplastic disk materials for the contact configuration 100Cr6/thermoplastic at the MTM2.
2.4. Lubricants
The principal properties of the considered lubricants are presented in Table 2. The mineral oil MIN100, the polyalphaolefin PAO100, and the polyalkylene glycol PAGW100 with 20 wt.% water (see [28]) were of ISO viscosity grade (VG) 100. Additionally, a mineral oil MIN32 of ISO VG 32 was investigated. All oils were fully formulated with additives such as extreme pressure and anti-wear, foam-inhibiting, anti-freeze, and corrosion protection properties.
Table 2.
Considered lubricants.
2.5. Operating Conditions
Rolling–sliding conditions, such as in gears, were considered. On the one hand, friction curves with varying slide-to-roll ratios were measured at a constant rolling speed of . This resulted in the regime of fluid film lubrication with separated surfaces for all polished surfaces. On the other hand, Stribeck-like curves with varying rolling speeds were measured at a constant slide-to-roll ratio of . Depending on the surface roughness, the lubrication regime changed from fluid film to mixed to boundary lubrication with a decreasing . Given the significant impact of temperature on the thermoplastic and lubricant behavior (see Figure 2), a range of temperatures around °C was selected. The rolling–sliding contacts were loaded with normal forces of . Assuming the applicability of the Hertzian theory and using Young’s modulus at 40 °C (see Table 1), this resulted in Hertzian pressures between 34.0 and 106.5 depending on the contact configuration and thermoplastics (see Table 3).
Table 3.
Hertzian pressures for the contact configurations 100Cr6/thermoplastic at at the MTM2 at °C.
In addition to the contact configurations 100Cr6/thermoplastic, further configurations were investigated. For the configuration 100Cr6/100Cr6, the calculated Hertzian pressure at was . For PEEK/100Cr6 and 100Cr6/PEEK, the calculated Hertzian pressure at and °C was , while, for PEEK/PEEK, it was .
Prior to the start of testing, a ten-minute run-in procedure with , , , and an oil temperature of °C oil was performed for all configurations and tests. All measurements were repeated once and then averaged. In Appendix A, the relative change from the first to the second measurement is given, where the measurement value is averaged over the friction and Stribeck-like curves, respectively. An average deviation of 5.7% was found for all measurements.
3. Results
This Section presents the results of the measurements. In Section 3.1 and Section 3.2, the results of the friction and Stribeck-like curves are presented in detail, while Section 3.3, Section 3.4, Section 3.5 and Section 3.6 focus on important aspects of the investigated influences. To illustrate the results of the friction measurements, the contact configuration 100Cr6/PEEK with a polished specimen and MIN100 is used as a reference to show the effects of varying configuration and contact conditions. Based on this reference, Section 3.7 provides a summarized overview with the mean coefficients of friction for the influences shown in Section 3.1, Section 3.2, Section 3.3, Section 3.4, Section 3.5 and Section 3.6.
3.1. Influence of Contact Configuration
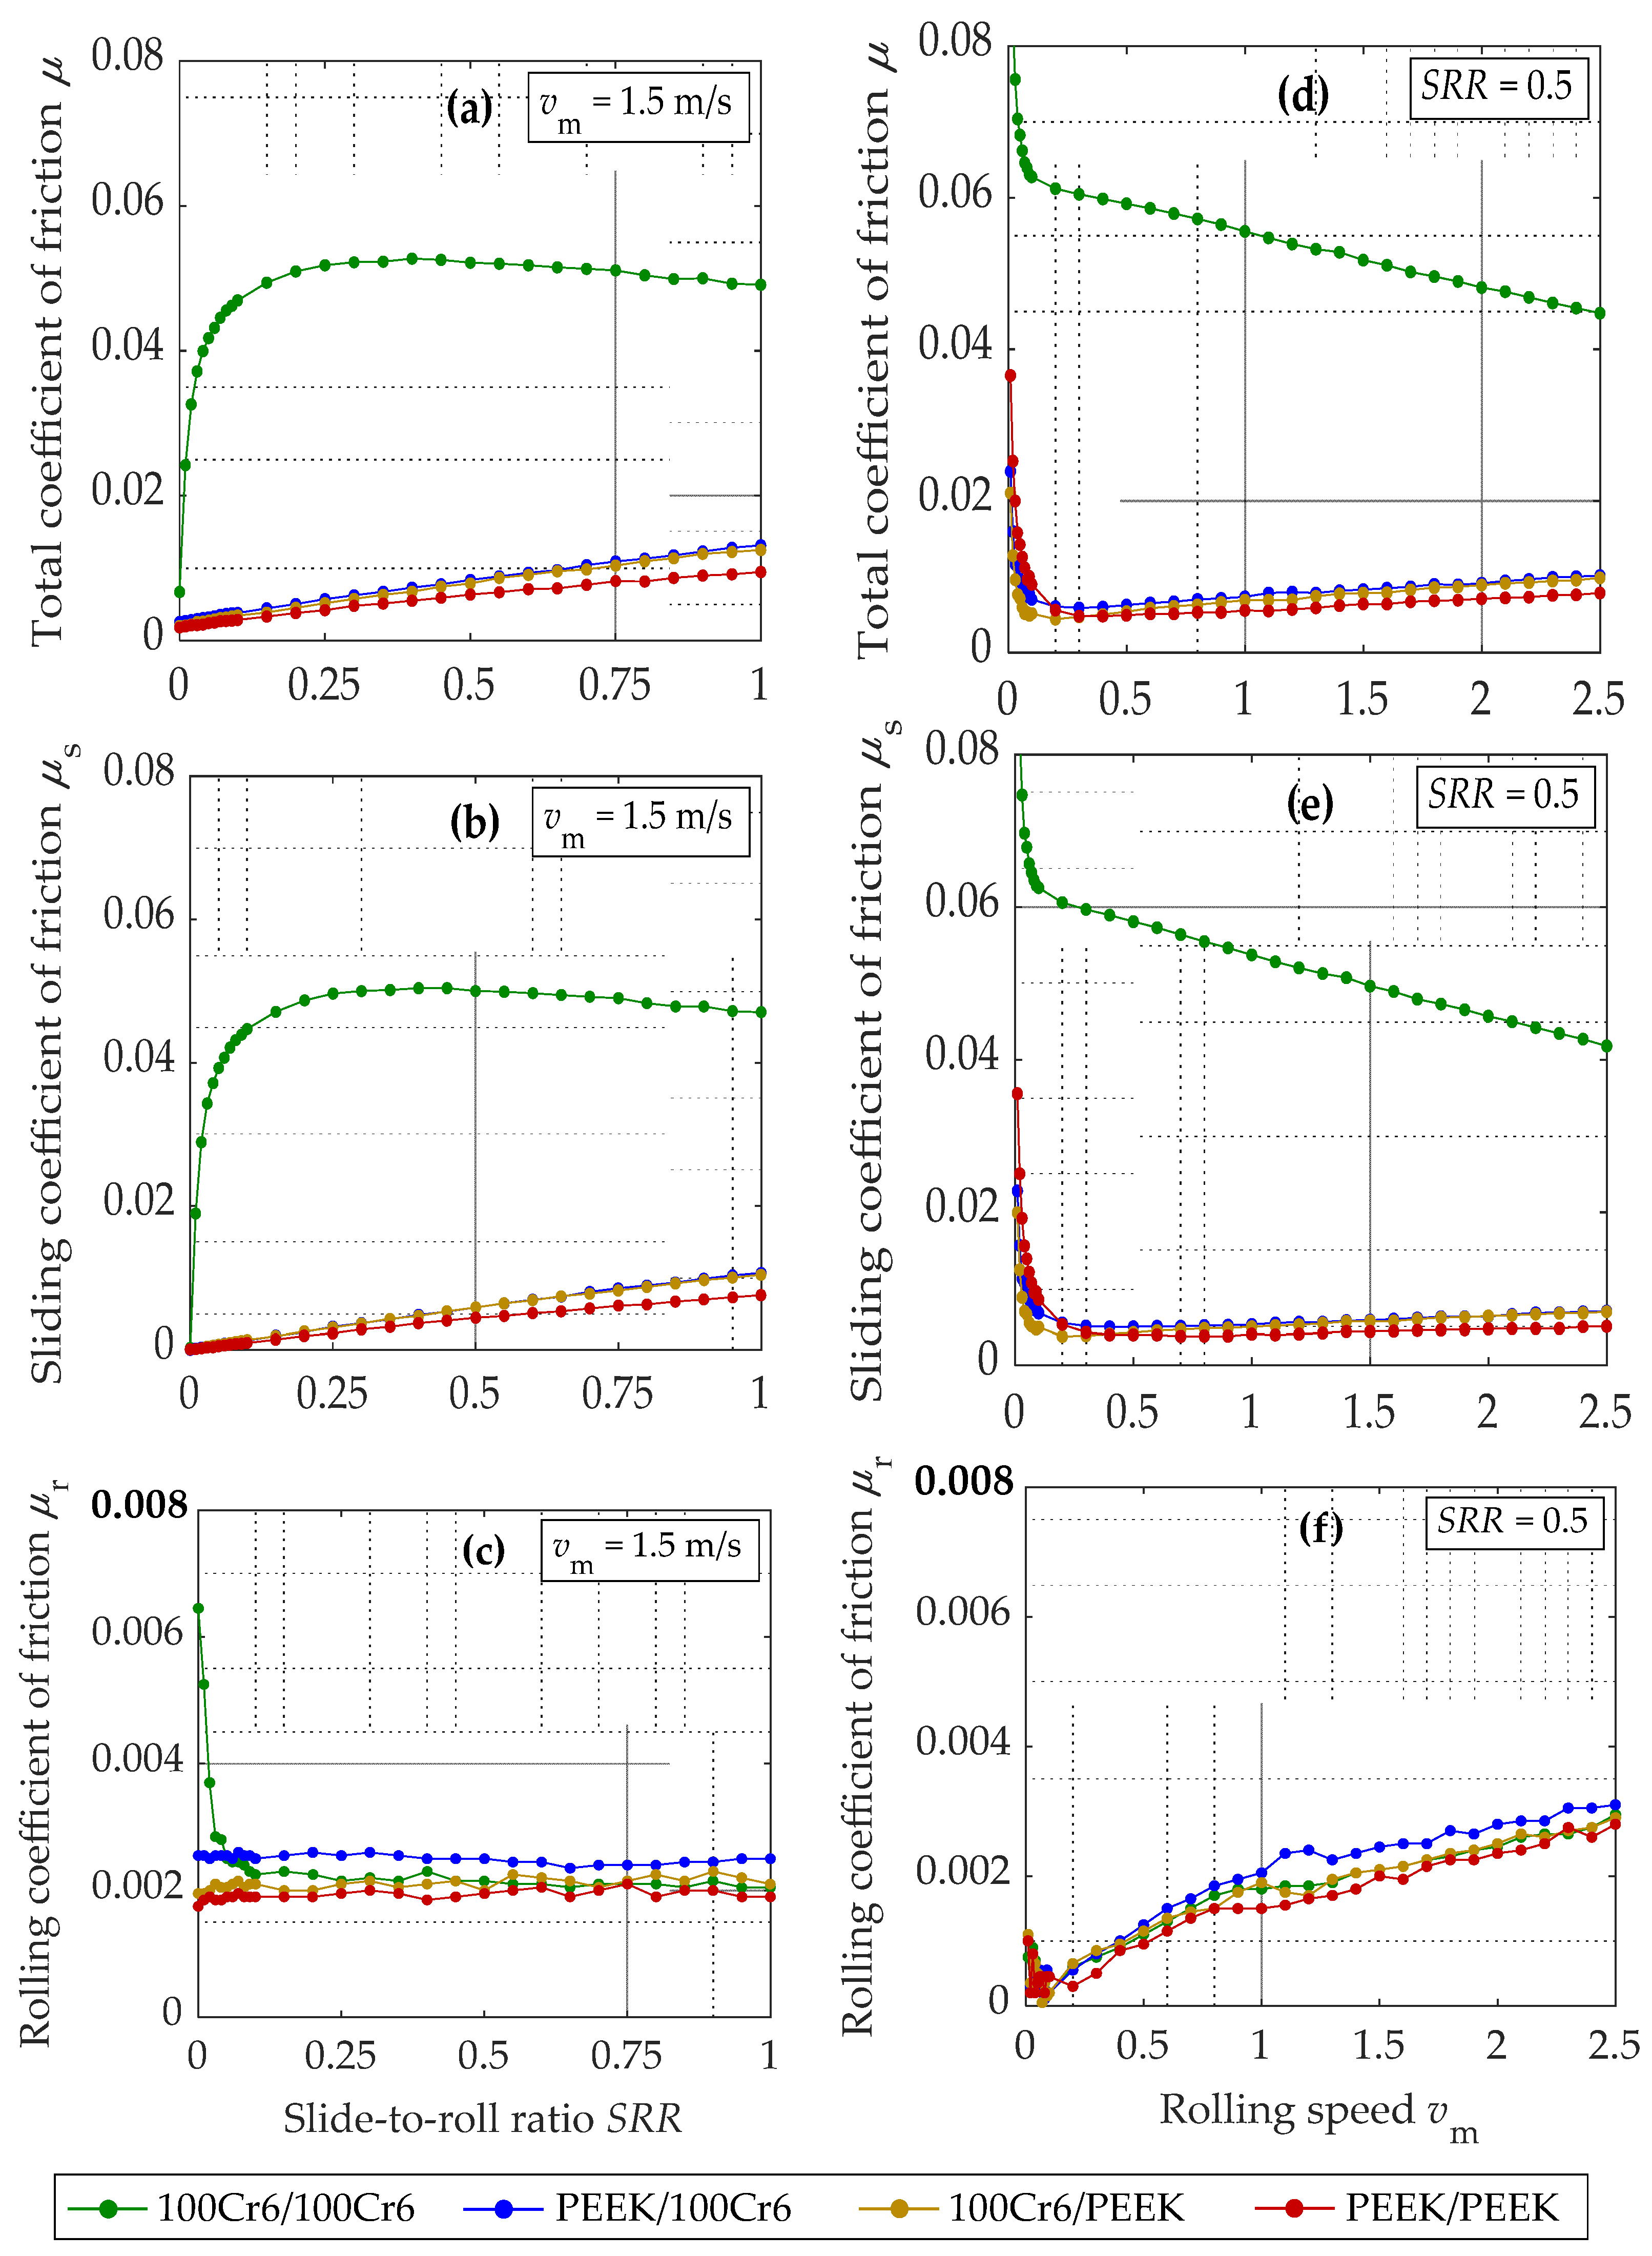
Figure 5 shows the total , sliding and rolling coefficients of friction over the slide-to-roll ratio (Figure 5a–c) and rolling speed (Figure 5a,d–f) for the contact configurations 100Cr6/100Cr6, PEEK/100Cr6, 100Cr6/PEEK, and PEEK/PEEK at a normal force and oil temperature = 40 °C for MIN100.
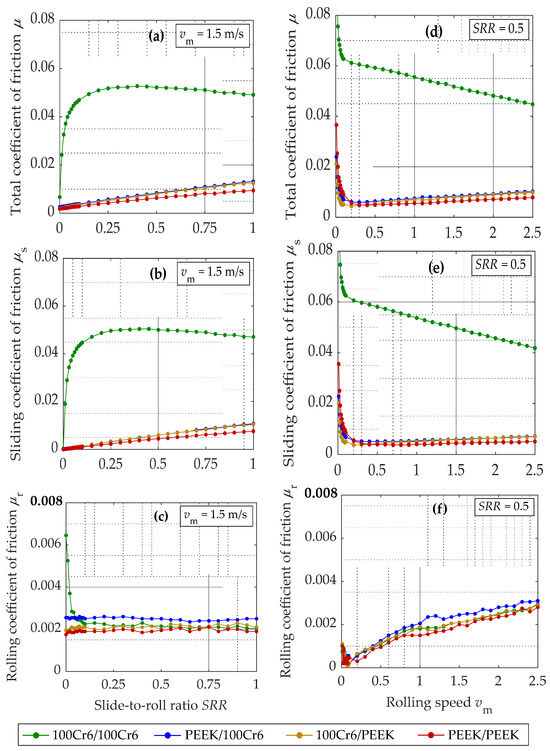
Figure 5.
Total , sliding , and rolling coefficients of friction over the slide-to-roll ratio (a–c) and rolling speed (d–f) with polished disks for the contact configurations 100Cr6/100Cr6, PEEK/100Cr6, 100Cr6/PEEK, and PEEK/PEEK at and for MIN100.
The contact configuration 100Cr6/100Cr6 shows the highest total coefficient of friction in Figure 5a,d, whereas the contact configuration PEEK/PEEK shows the lowest friction. In between, there are contact configurations PEEK/100Cr6 and 100Cr6/PEEK with a very similar coefficient of friction . The friction levels are in alignment with the calculated contact pressures (see Table 3) and assume an increase in contact viscosity. All contact configurations with PEEK show a nearly linear increase in over , whereas the contact configuration 100Cr6/100Cr6 shows linear, non-linear, and thermal regimes, as typically known from friction curves with steel EHL contacts [39]. The total friction at is not zero, since rolling friction is also considered in this study. With decreasing rolling speeds , the coefficient of friction for 100Cr6/100Cr6 is steadily increasing, while it has a minimum for the contact configurations with PEEK. Their behavior is similar to typical Stribeck-like curves.
Focusing on the coefficient of sliding friction in Figure 5b,e shows very similar trends to the total coefficient of friction . As the increases, assumes a dominant role in . In contrast, as the rolling speed increases, the coefficient of sliding friction declines for the contact configuration 100Cr6/100Cr6 and increases for the contact configurations with PEEK.
The rolling coefficient of friction in Figure 5c,f is approximately one magnitude smaller than and almost identical for all contact configurations for relevant SRR. This indicates that the relative share of in is higher for contact configurations with PEEK than for the contact configuration 100Cr6/100Cr6. Over , a nearly constant rolling coefficient of friction is present. It should be noted that a pronounced increase in rolling friction is observed for the contact configuration 100Cr6/100Cr6 at a low-to-zero SRR, while, for increasing rolling speeds the rolling coefficient of friction increases.
3.2. Influence of Thermoplastic Material
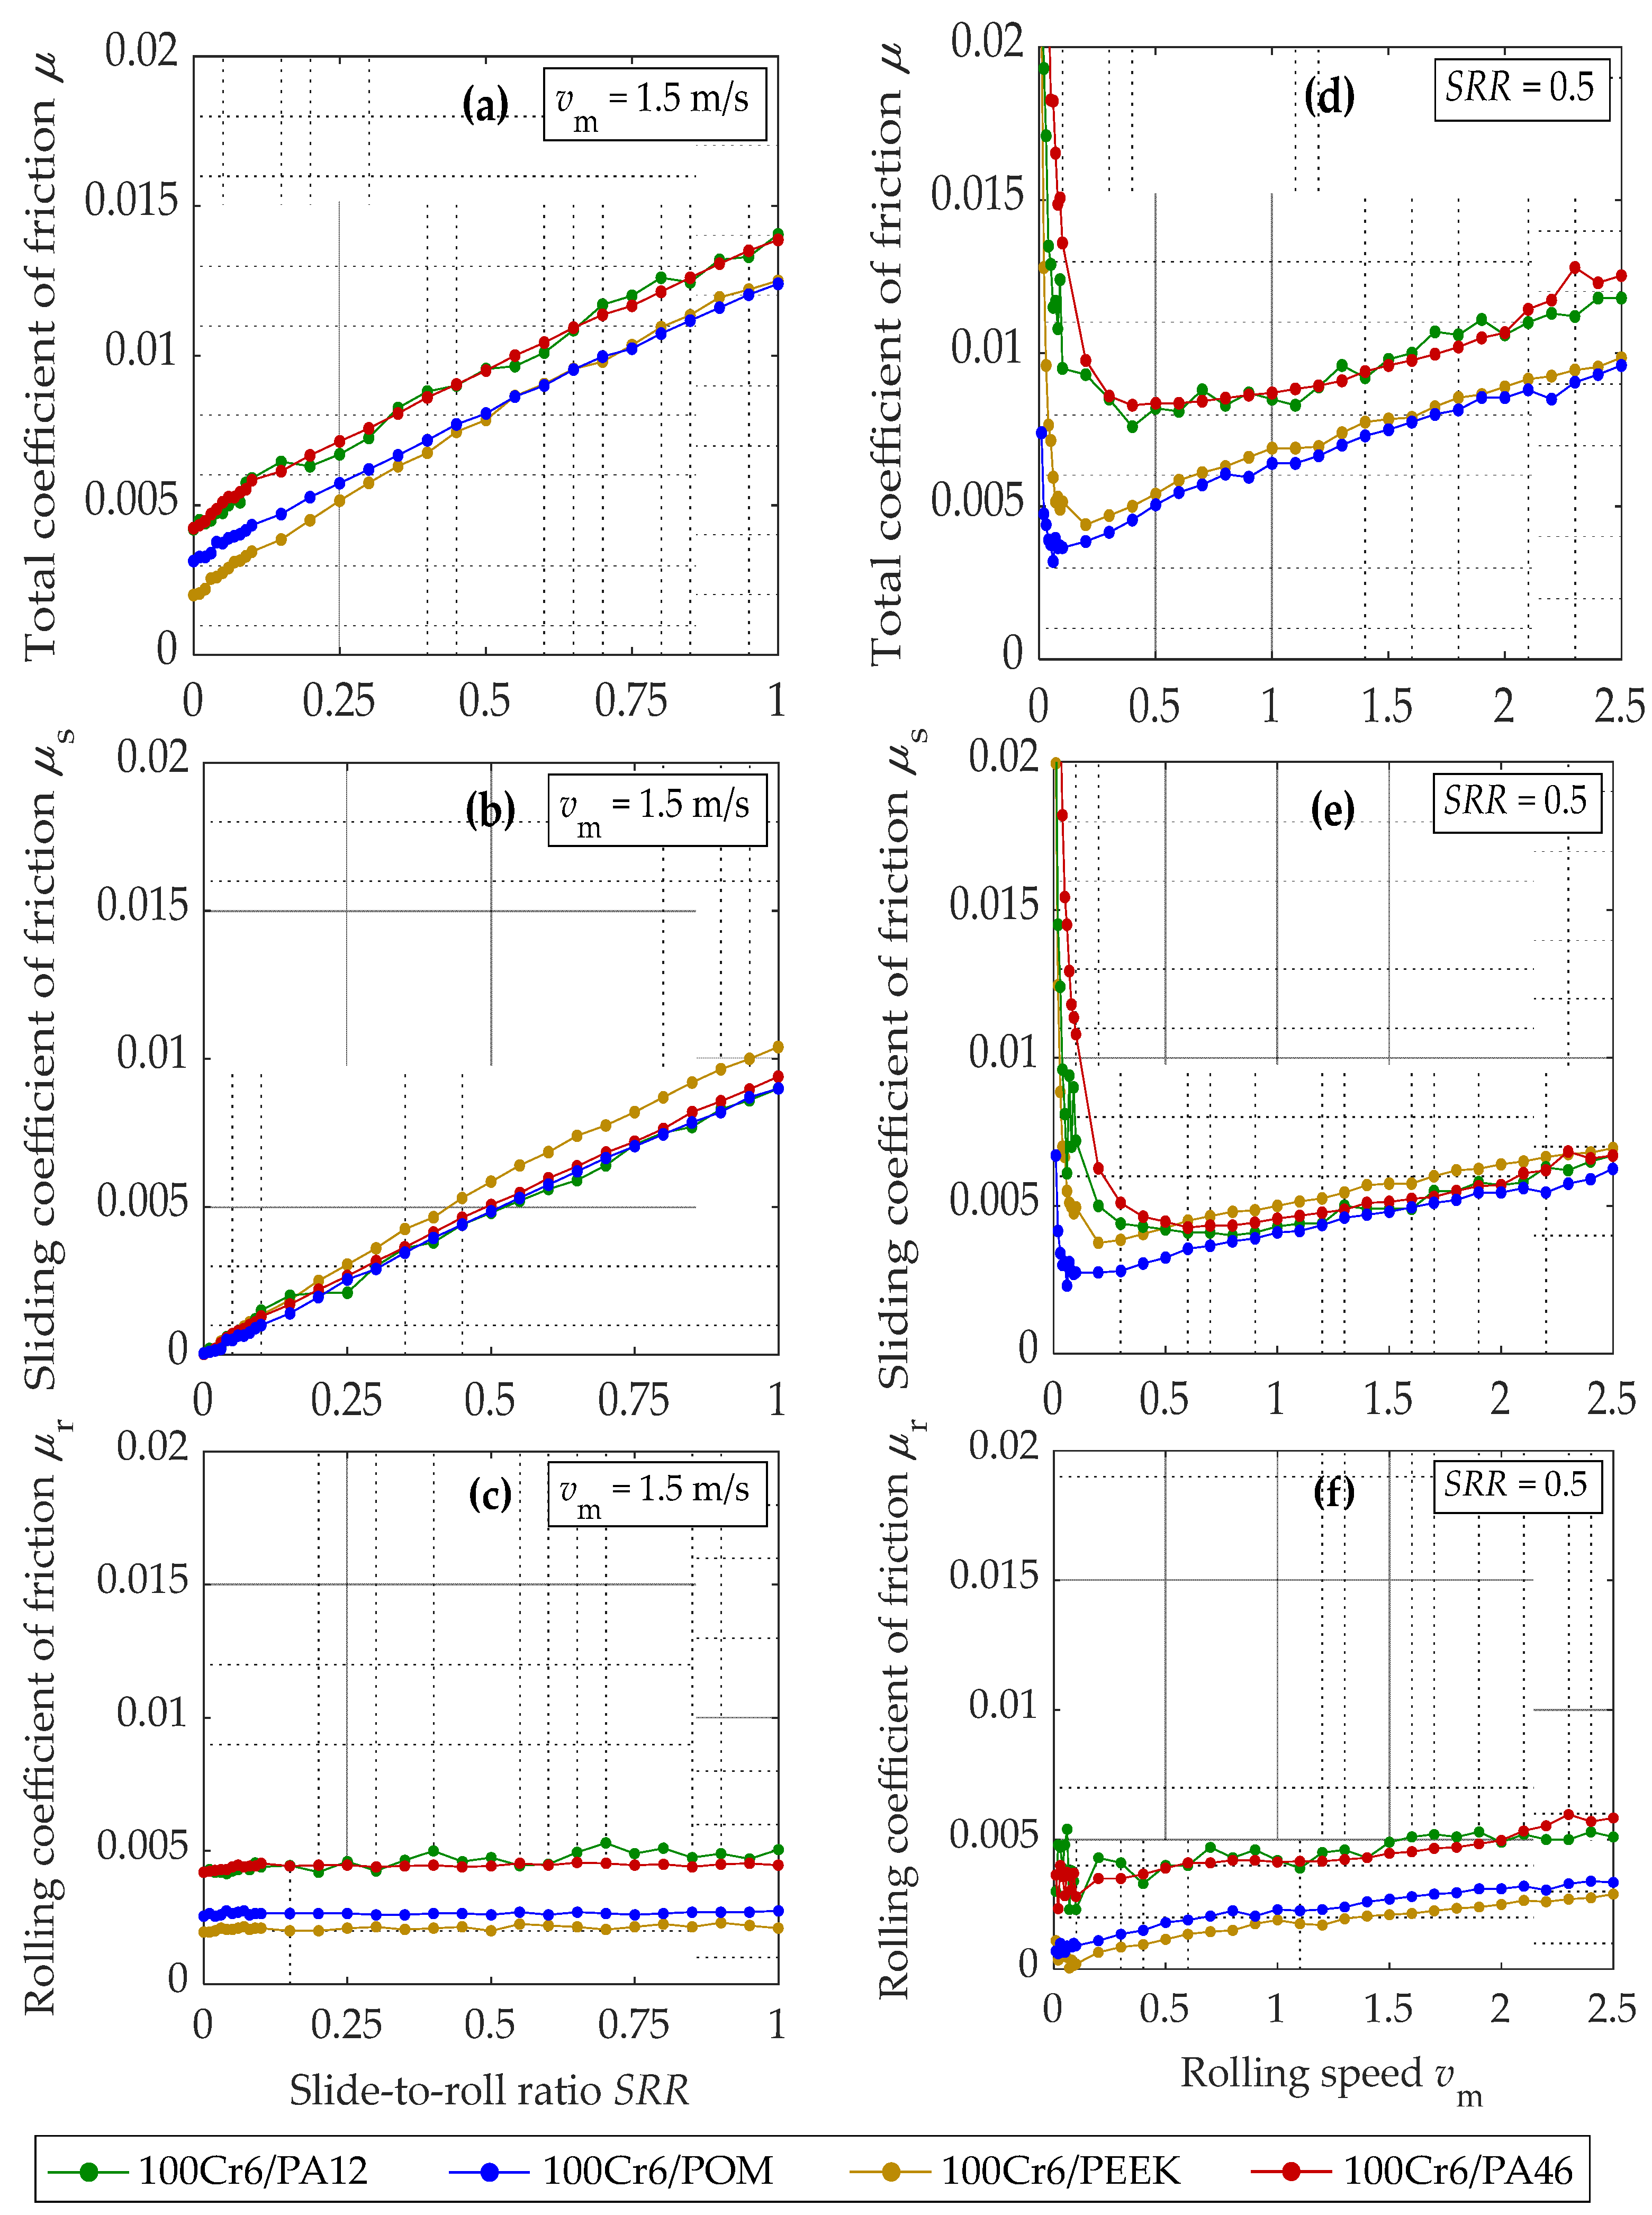
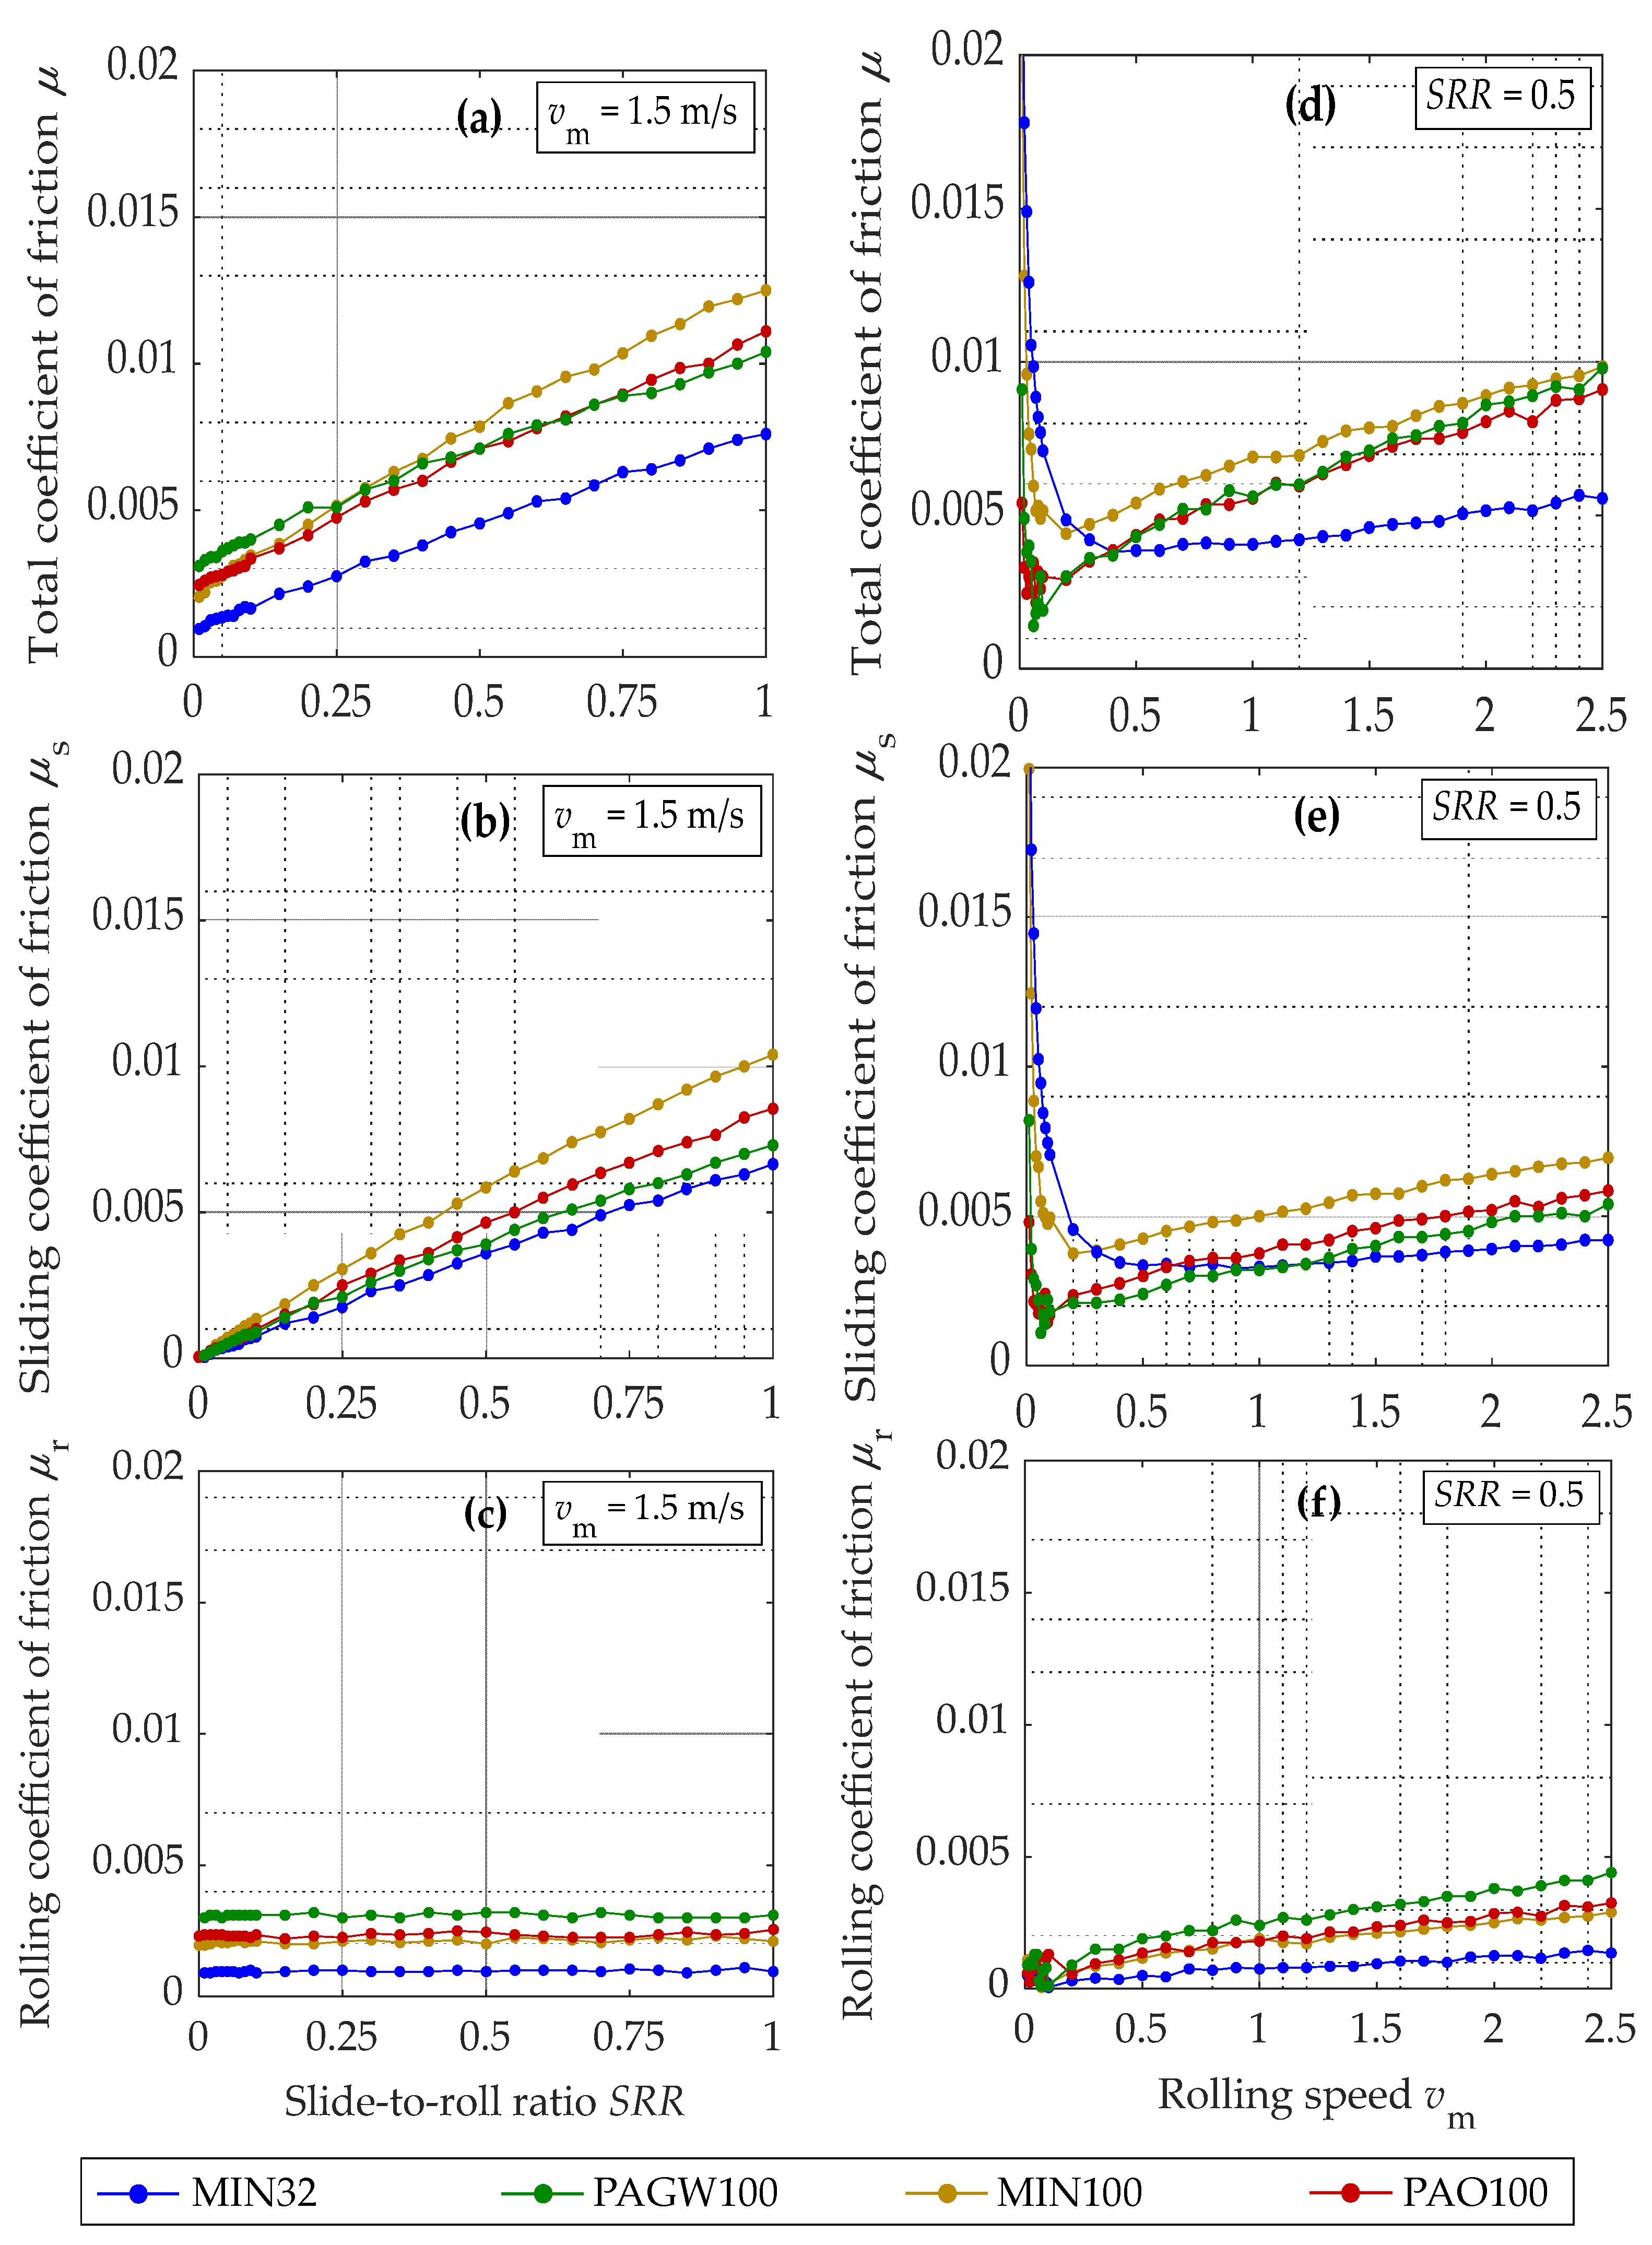
Figure 6 shows the total , sliding and rolling coefficients of friction over the slide-to-roll ratio SRR (a, b, c) and rolling speed (d, e, f) for the contact configurations 100Cr6/PEEK, 100Cr6/POM, 100Cr6/PA12, and 100Cr6/PA46 at a normal force and oil temperature °C for MIN100.
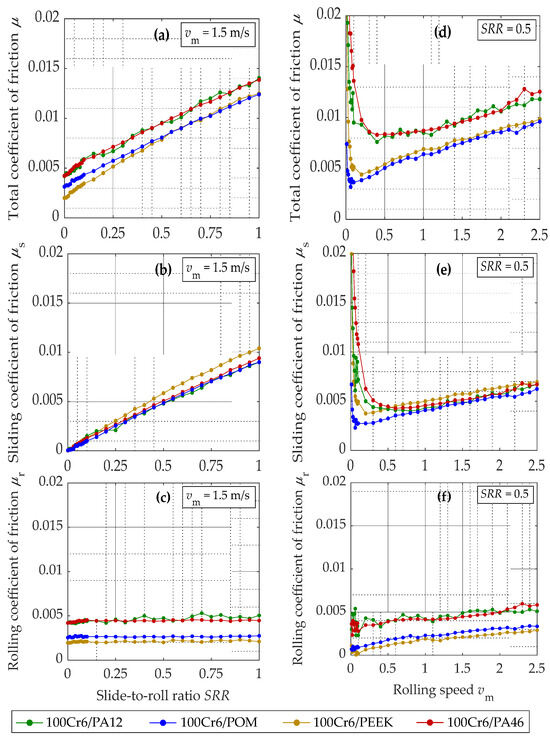
Figure 6.
Total , sliding and rolling coefficients of friction over the slide-to-roll ratio (a–c) and rolling speed (d–f) with polished disks for the contact configurations 100Cr6/PEEK, 100Cr6/POM, 100Cr6/PA12, and 100Cr6/PA46 at and for MIN100.
The contact configurations with PA12 and PA46 show the highest total coefficient of friction in Figure 6a,d at a similar level. The contact configurations with POM and PEEK have an overall lower but also on a nearly identical level.
The sliding coefficient of friction in Figure 6b shows a nearly linear increase over the SRR. Thereby, the contact configuration with PEEK shows the highest sliding coefficient of friction , which correlates with the highest contact pressure (see Table 3) and an assumed increase in contact viscosity. POM and PA46, which exhibit similar Young’s moduli and contact pressures, show almost the same sliding coefficient of friction . The rolling coefficient of friction in Figure 6c is constant over the for all thermoplastics. It can be observed that the contact configurations with POM and PEEK and those with PA12 and PA46 each have a similar . Thereby, the level of contact configurations with PA12 and PA46 is about two times higher. In the case of a low SRR, plays a dominant role. Conversely, for a high SRR, sliding friction is observed to exceed that of rolling friction. Overall, the rolling friction is a relevant portion of the total friction for the contact configurations with thermoplastics and leads to a higher total friction for contact configurations with polyamides.
Figure 6d shows the total coefficient of friction as a function of the rolling speed . For very low rolling speeds and, consequently, mixed to boundary lubrication, the sliding coefficient of friction in Figure 6e is very high. With increasing rolling speed and fluid film lubrication, shows a nearly linear increase. Hence, a Stribeck-like behavior is observed. The rolling coefficient of friction in Figure 6f increases continuously with increasing rolling speeds . Note that, for very low rolling speeds the rolling coefficient of friction of the contact configurations with POM and PEEK tends towards zero, while , of the contact configurations with PA12 and PA46, shows a minimal value larger than zero.
3.3. Influence of Lubricant
Figure 7 shows the influence of different oils on the total , sliding and rolling coefficients of friction over the slide-to-roll ratio SRR (Figure 7a–c) and rolling speed (Figure 7d–f) for the contact configuration 100Cr6/PEEK at a normal force and oil temperature °C.
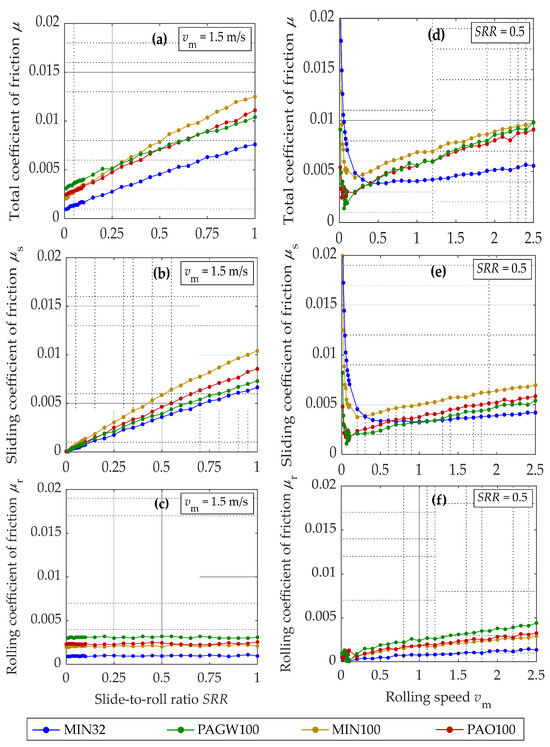
Figure 7.
Total , sliding and rolling coefficients of friction over the slide-to-roll ratio (a–c) and rolling speed (d–f) with polished disks for the configuration 100Cr6/PEEK lubricated with MIN100, PAGW100, PAO100, and MIN32 at and .
The total coefficient of friction over the SRR is depicted in Figure 7a, with MIN32 exhibiting a significantly lower level than MIN100, PAO100, and PAGW100. The sliding coefficient of friction is shown in Figure 7b. Although MIN32 also shows the lowest , a relevant portion of the lowest compared to the other lubricants is coming from the lowest rolling coefficient of friction in Figure 7c. Note that, out of the ISO VG100 oils MIN100, PAO100, and PAGW100, MIN100 shows the highest but the lowest . Contrary to this, PAGW100 shows the lowest sliding friction and the highest rolling friction.
Figure 7d–f show , and over the rolling speed . For the high rolling speed , the comparison between the oils is overall similar to the relation between the oils in Figure 7a–c. However, it is noticeable that is strongly increasing at low rolling speeds for both mineral oils MIN100 and MIN32. This mainly comes from the sliding coefficient of friction , as can be seen in Figure 7e. For higher rolling speeds, the difference regarding the total coefficient of friction between the mineral oil MIN32 and the three ISO VG100 oils MIN100, PAGW100, and PAO100 increases. Considering the friction portions, this comes from both and , which show the lowest increase for MIN32.
3.4. Influence of Load
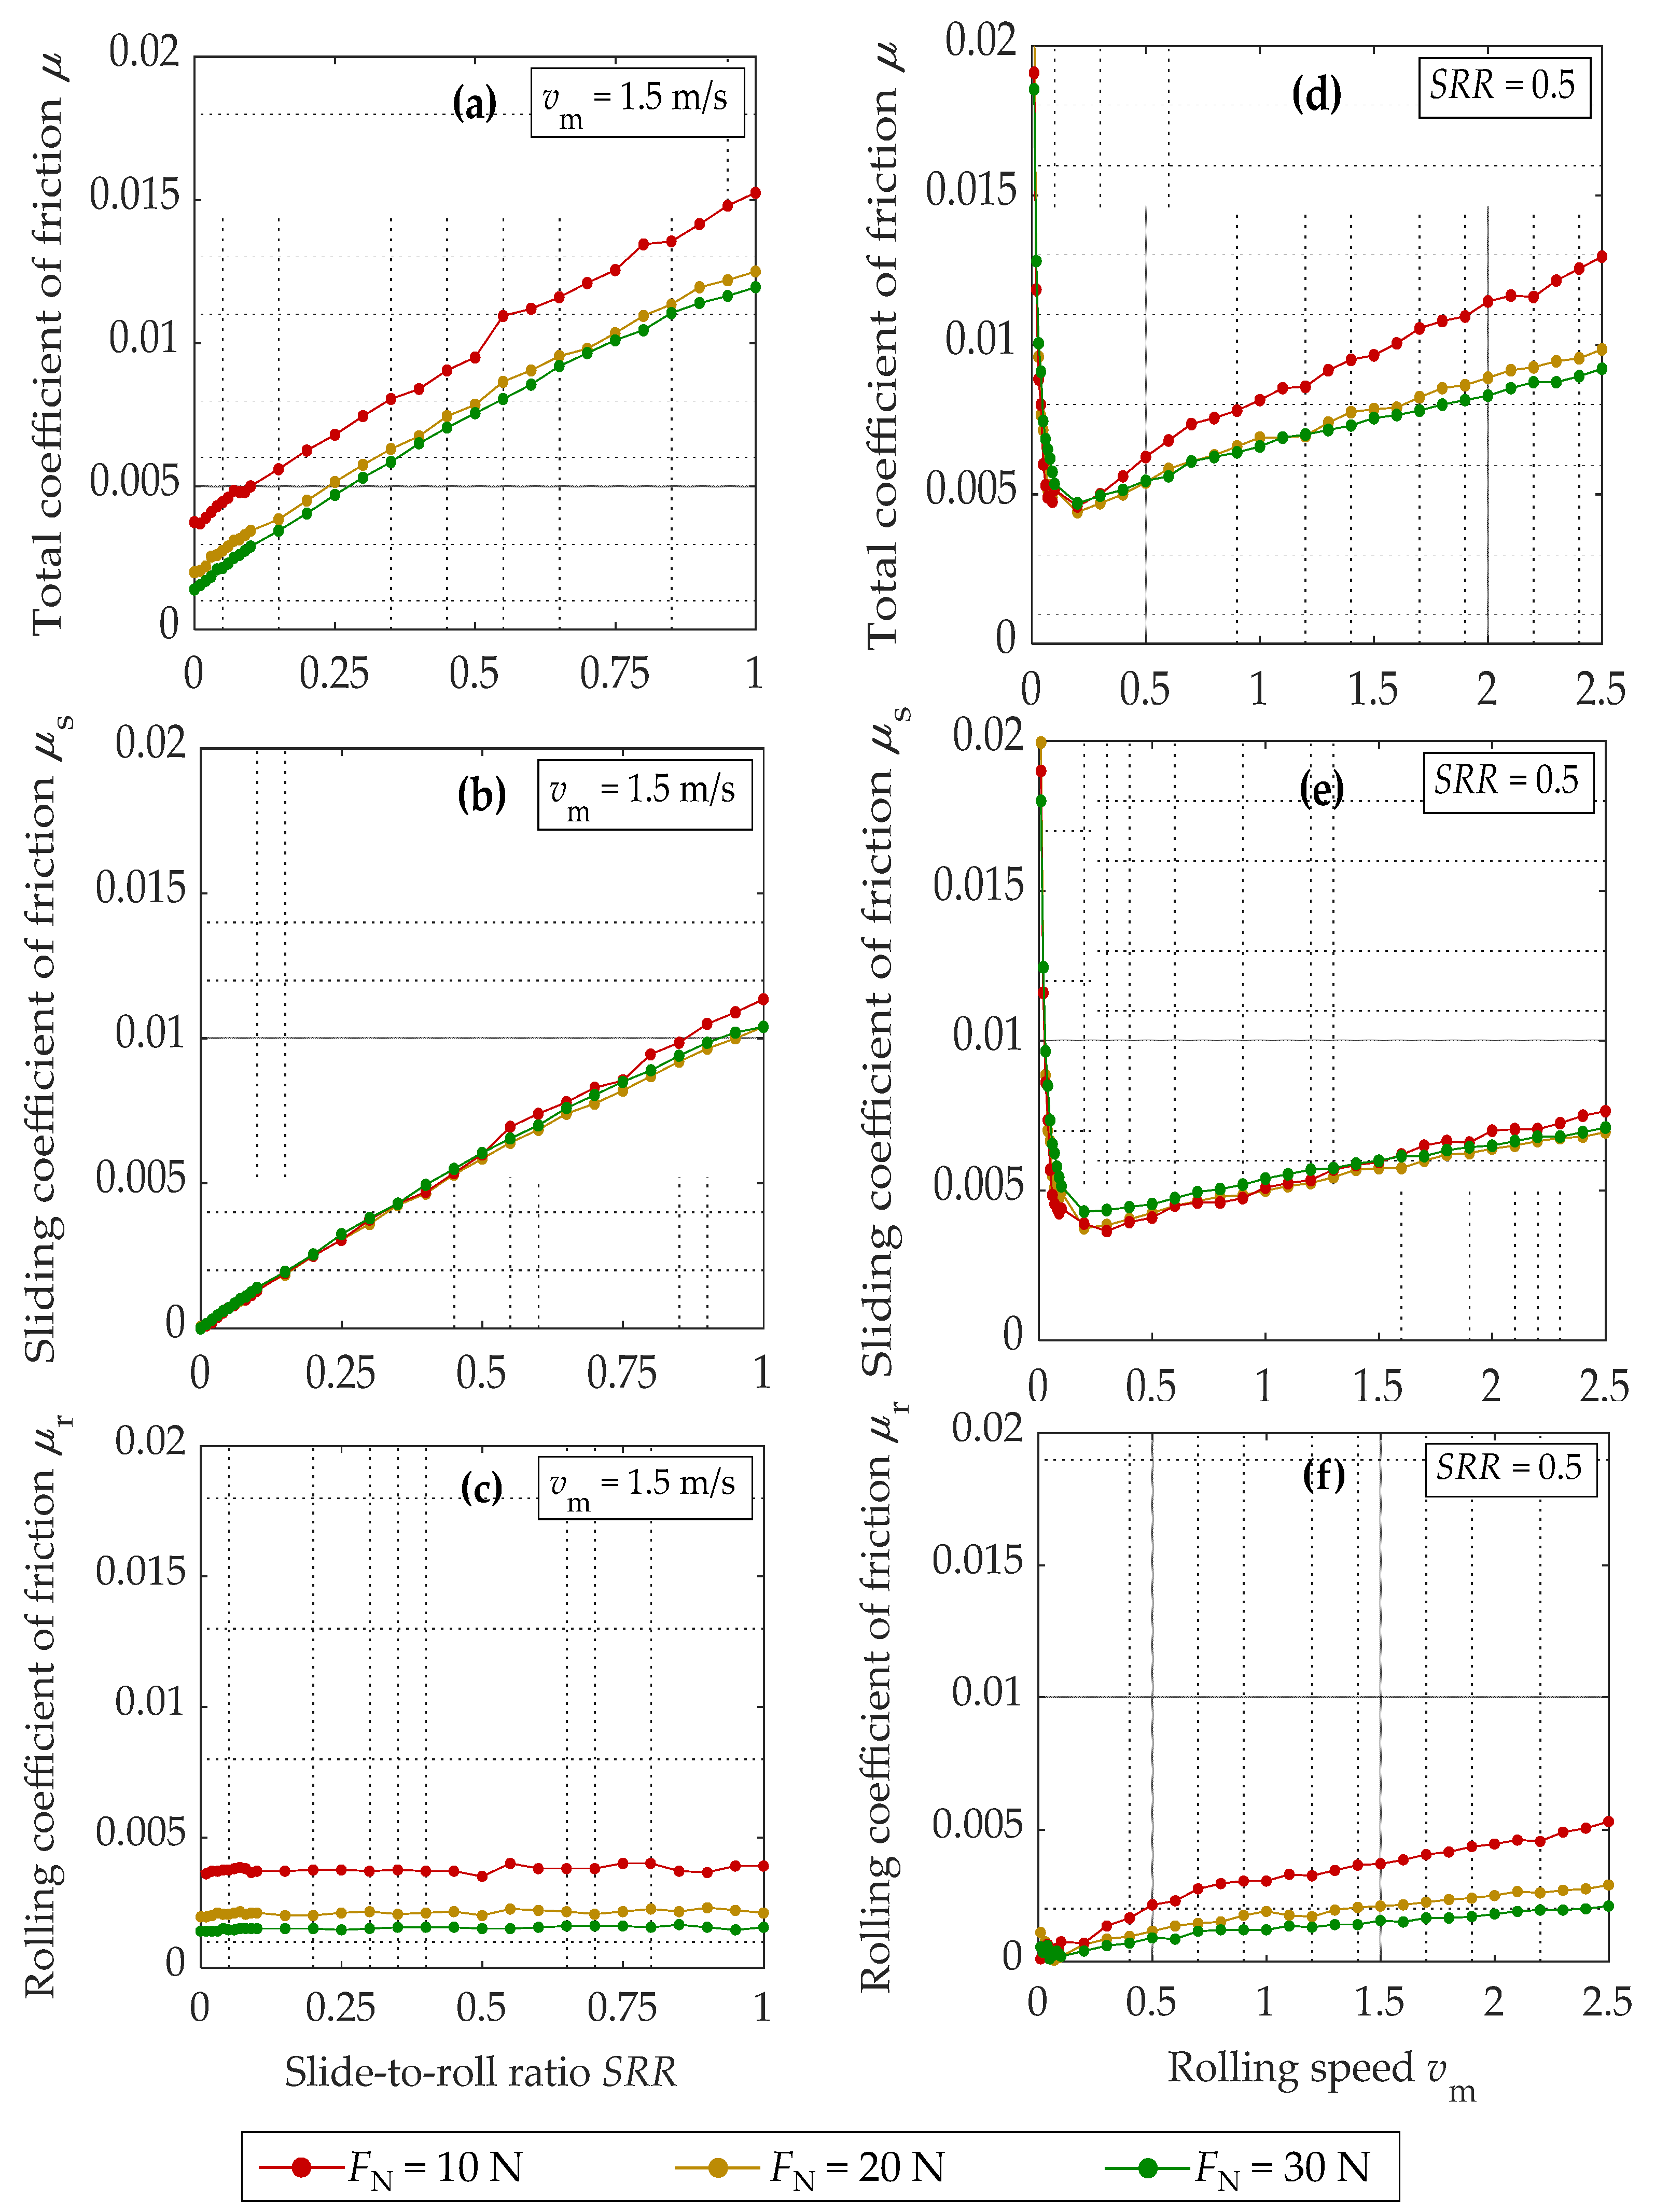
The influence of the normal force on the total , sliding and rolling coefficients of friction over the slide-to-roll ratio SRR (Figure 8a–c) and rolling speed (Figure 8d–f) is illustrated in Figure 8 for the contact configuration 100Cr6/PEEK and an oil temperature °C for MIN100. Three different loads and, therefore, contact pressures (see Table 3) are compared.

Figure 8.
Total , sliding and rolling coefficients of friction over the slide-to-roll ratio (a–c) and rolling speed (d–f) with polished disks for the configuration 100Cr6/PEEK at and for MIN100.
3.5. Influence of Oil Temperature
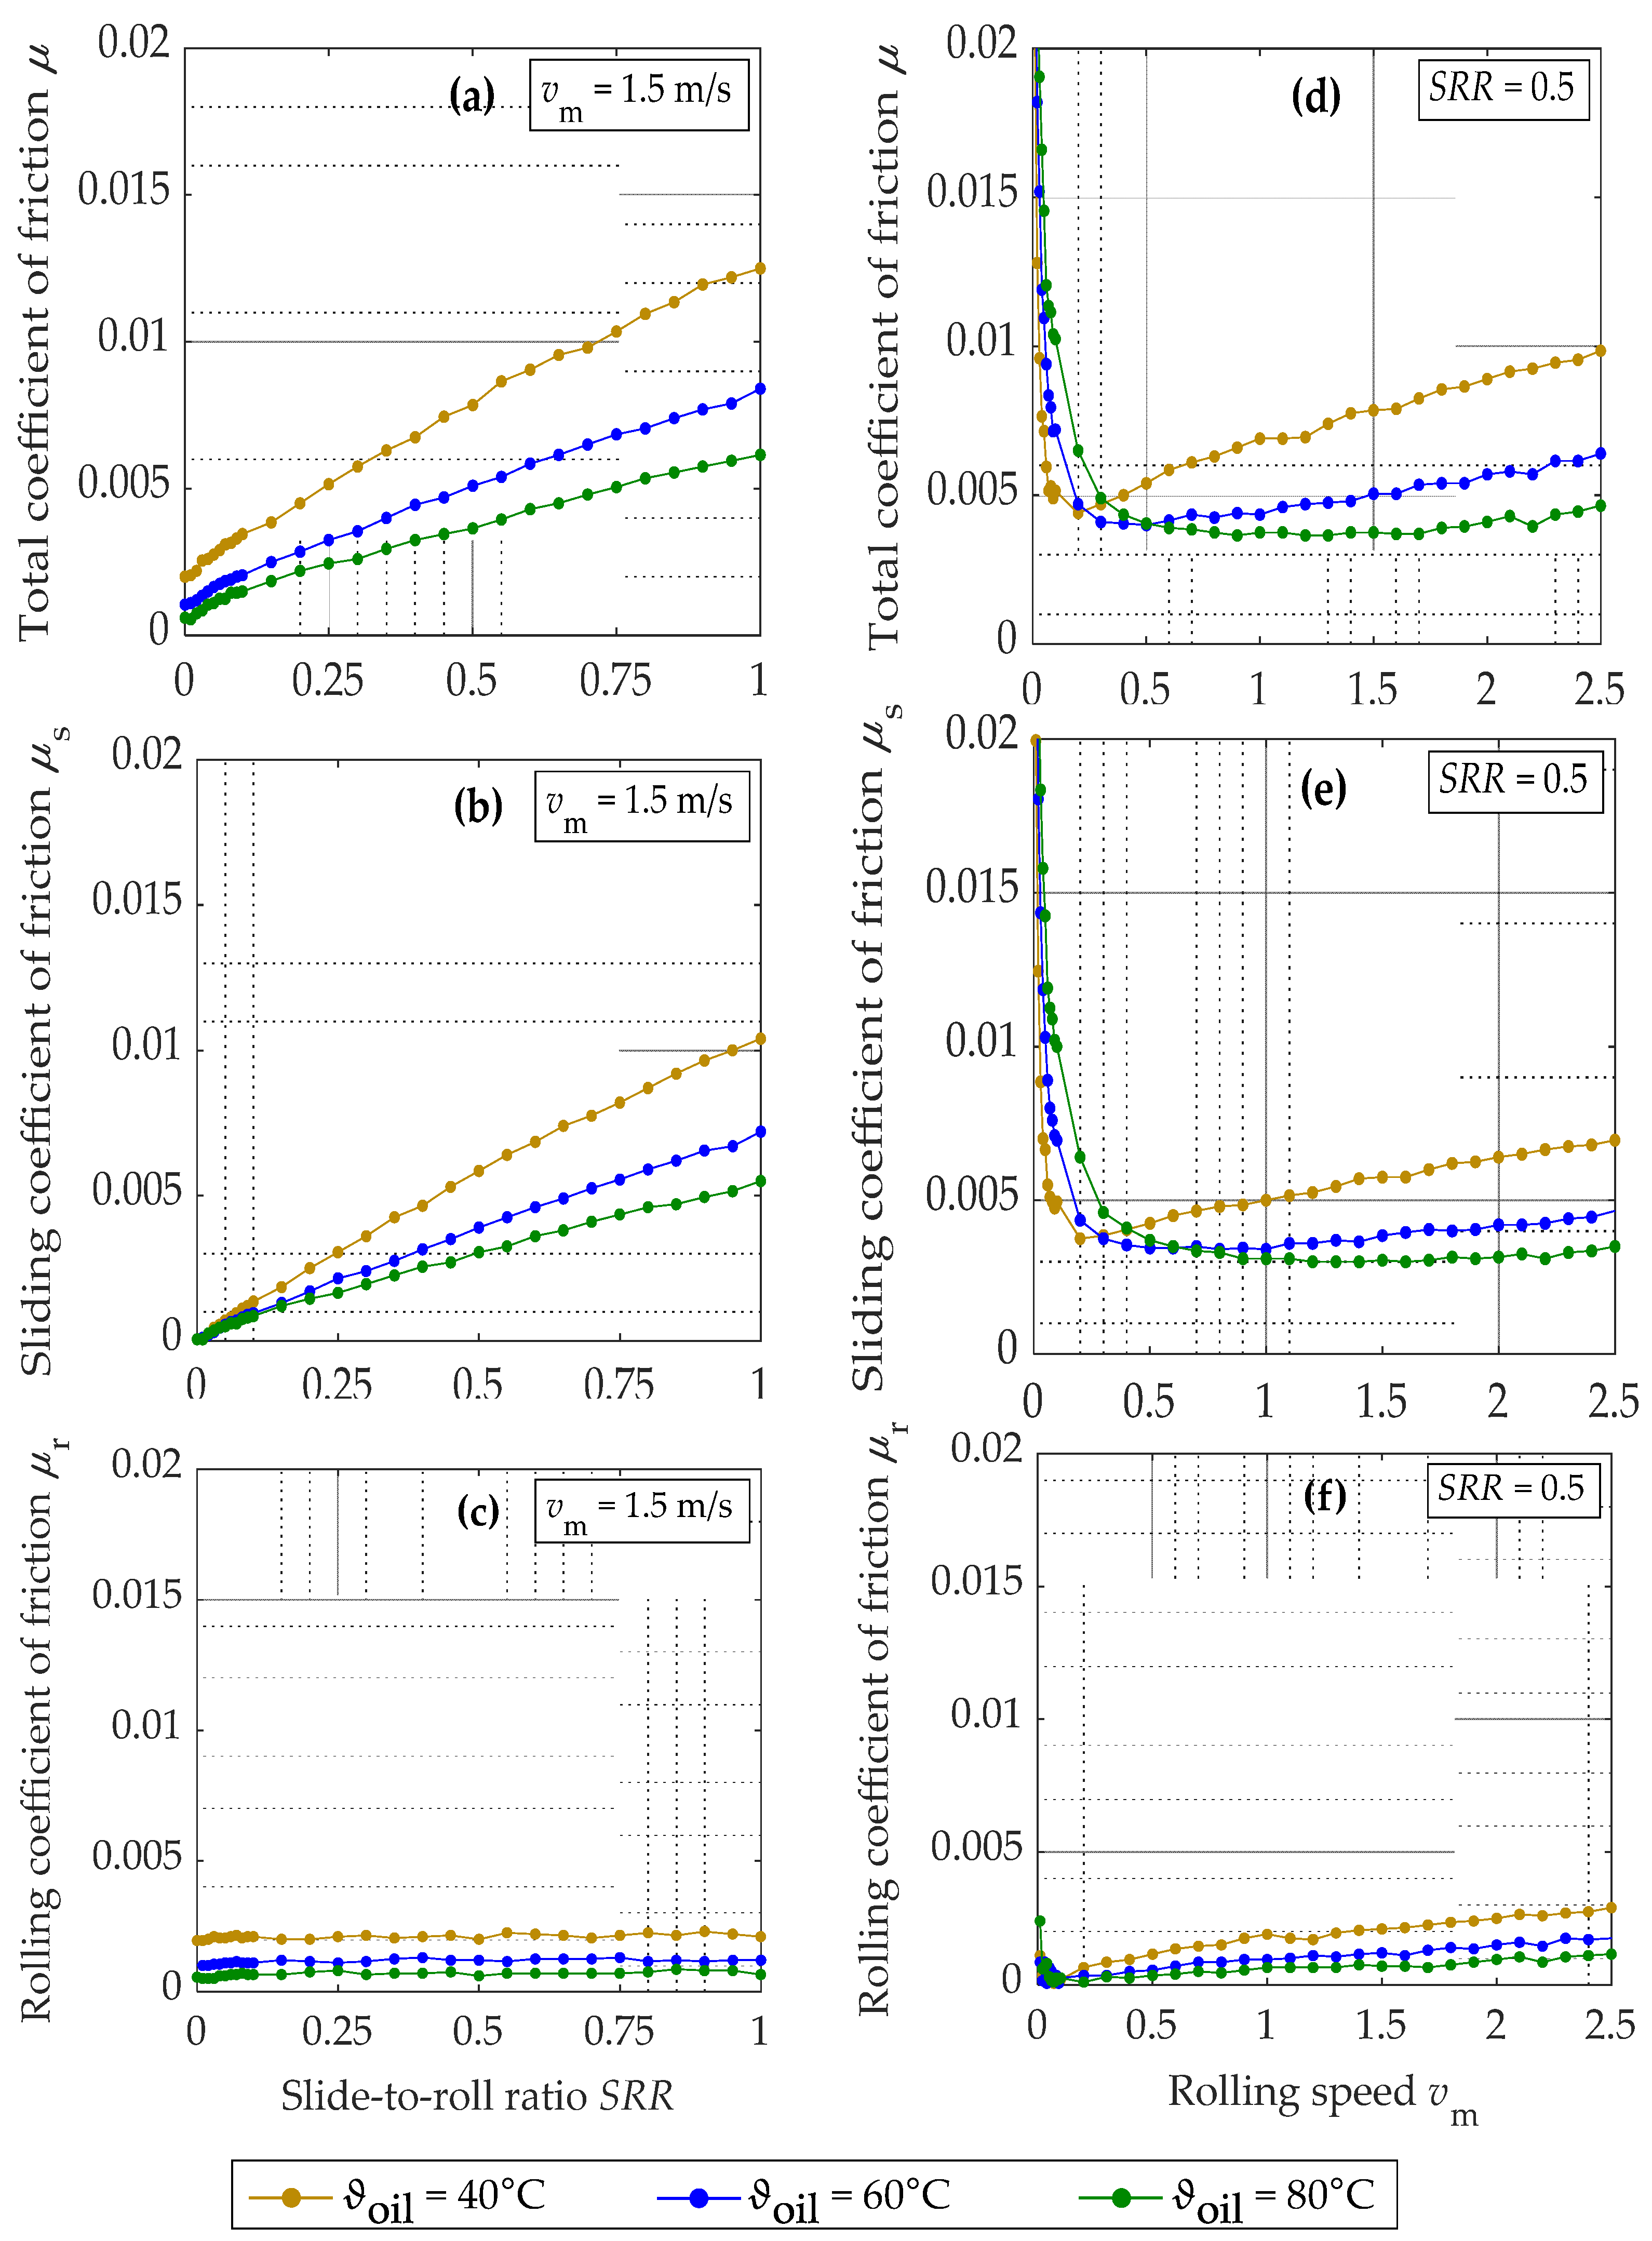
Figure 9 illustrates the influence of the oil temperature on the total , sliding and rolling coefficients of friction over the slide-to-roll ratio SRR (Figure 9a–c) and rolling speed (Figure 9d–f) for the contact configuration 100Cr6/PEEK at a normal force for MIN100.
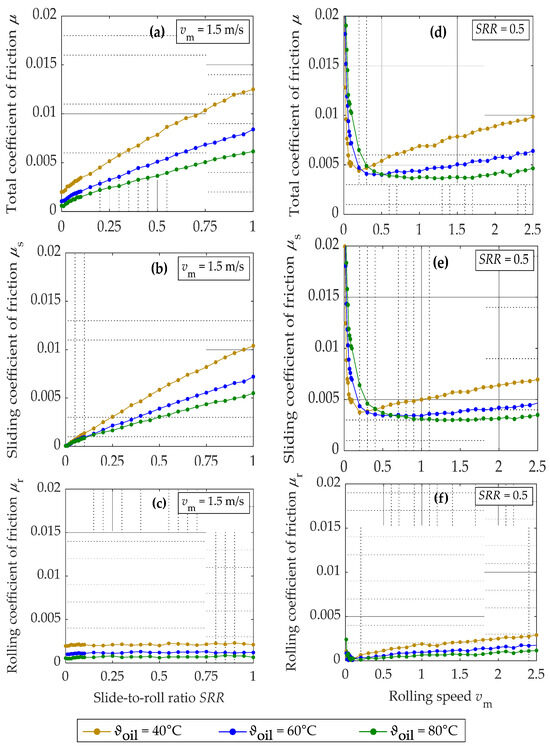
Figure 9.
Total , sliding , and rolling coefficients of friction over the slide-to-roll ratio (a–c) and rolling speed (d–f) with polished disks for the configuration 100Cr6/PEEK at and for MIN100.
Figure 9a shows that the total coefficient of friction over the SRR strongly decreases with increasing oil temperature . This is a result of the decrease in both the sliding and rolling coefficient of friction in Figure 9b,c. Thereby, the sliding coefficient of friction shows a linear increase over the SRR for all three oil temperatures but can be distinguished by the gradients.
The coefficients of friction over in Figure 9d–f confirm this trend for higher rolling speed . For a low with mixed-to-boundary lubrication, the influence of is reversed. Thereby, the sliding coefficient of friction in Figure 9e exhibits, for a low an increasing trend with increasing and dominates the total coefficient of friction. The increase in the rolling coefficient of friction over is smaller for higher oil temperatures (Figure 9f).
3.6. Influence of Surface Roughness
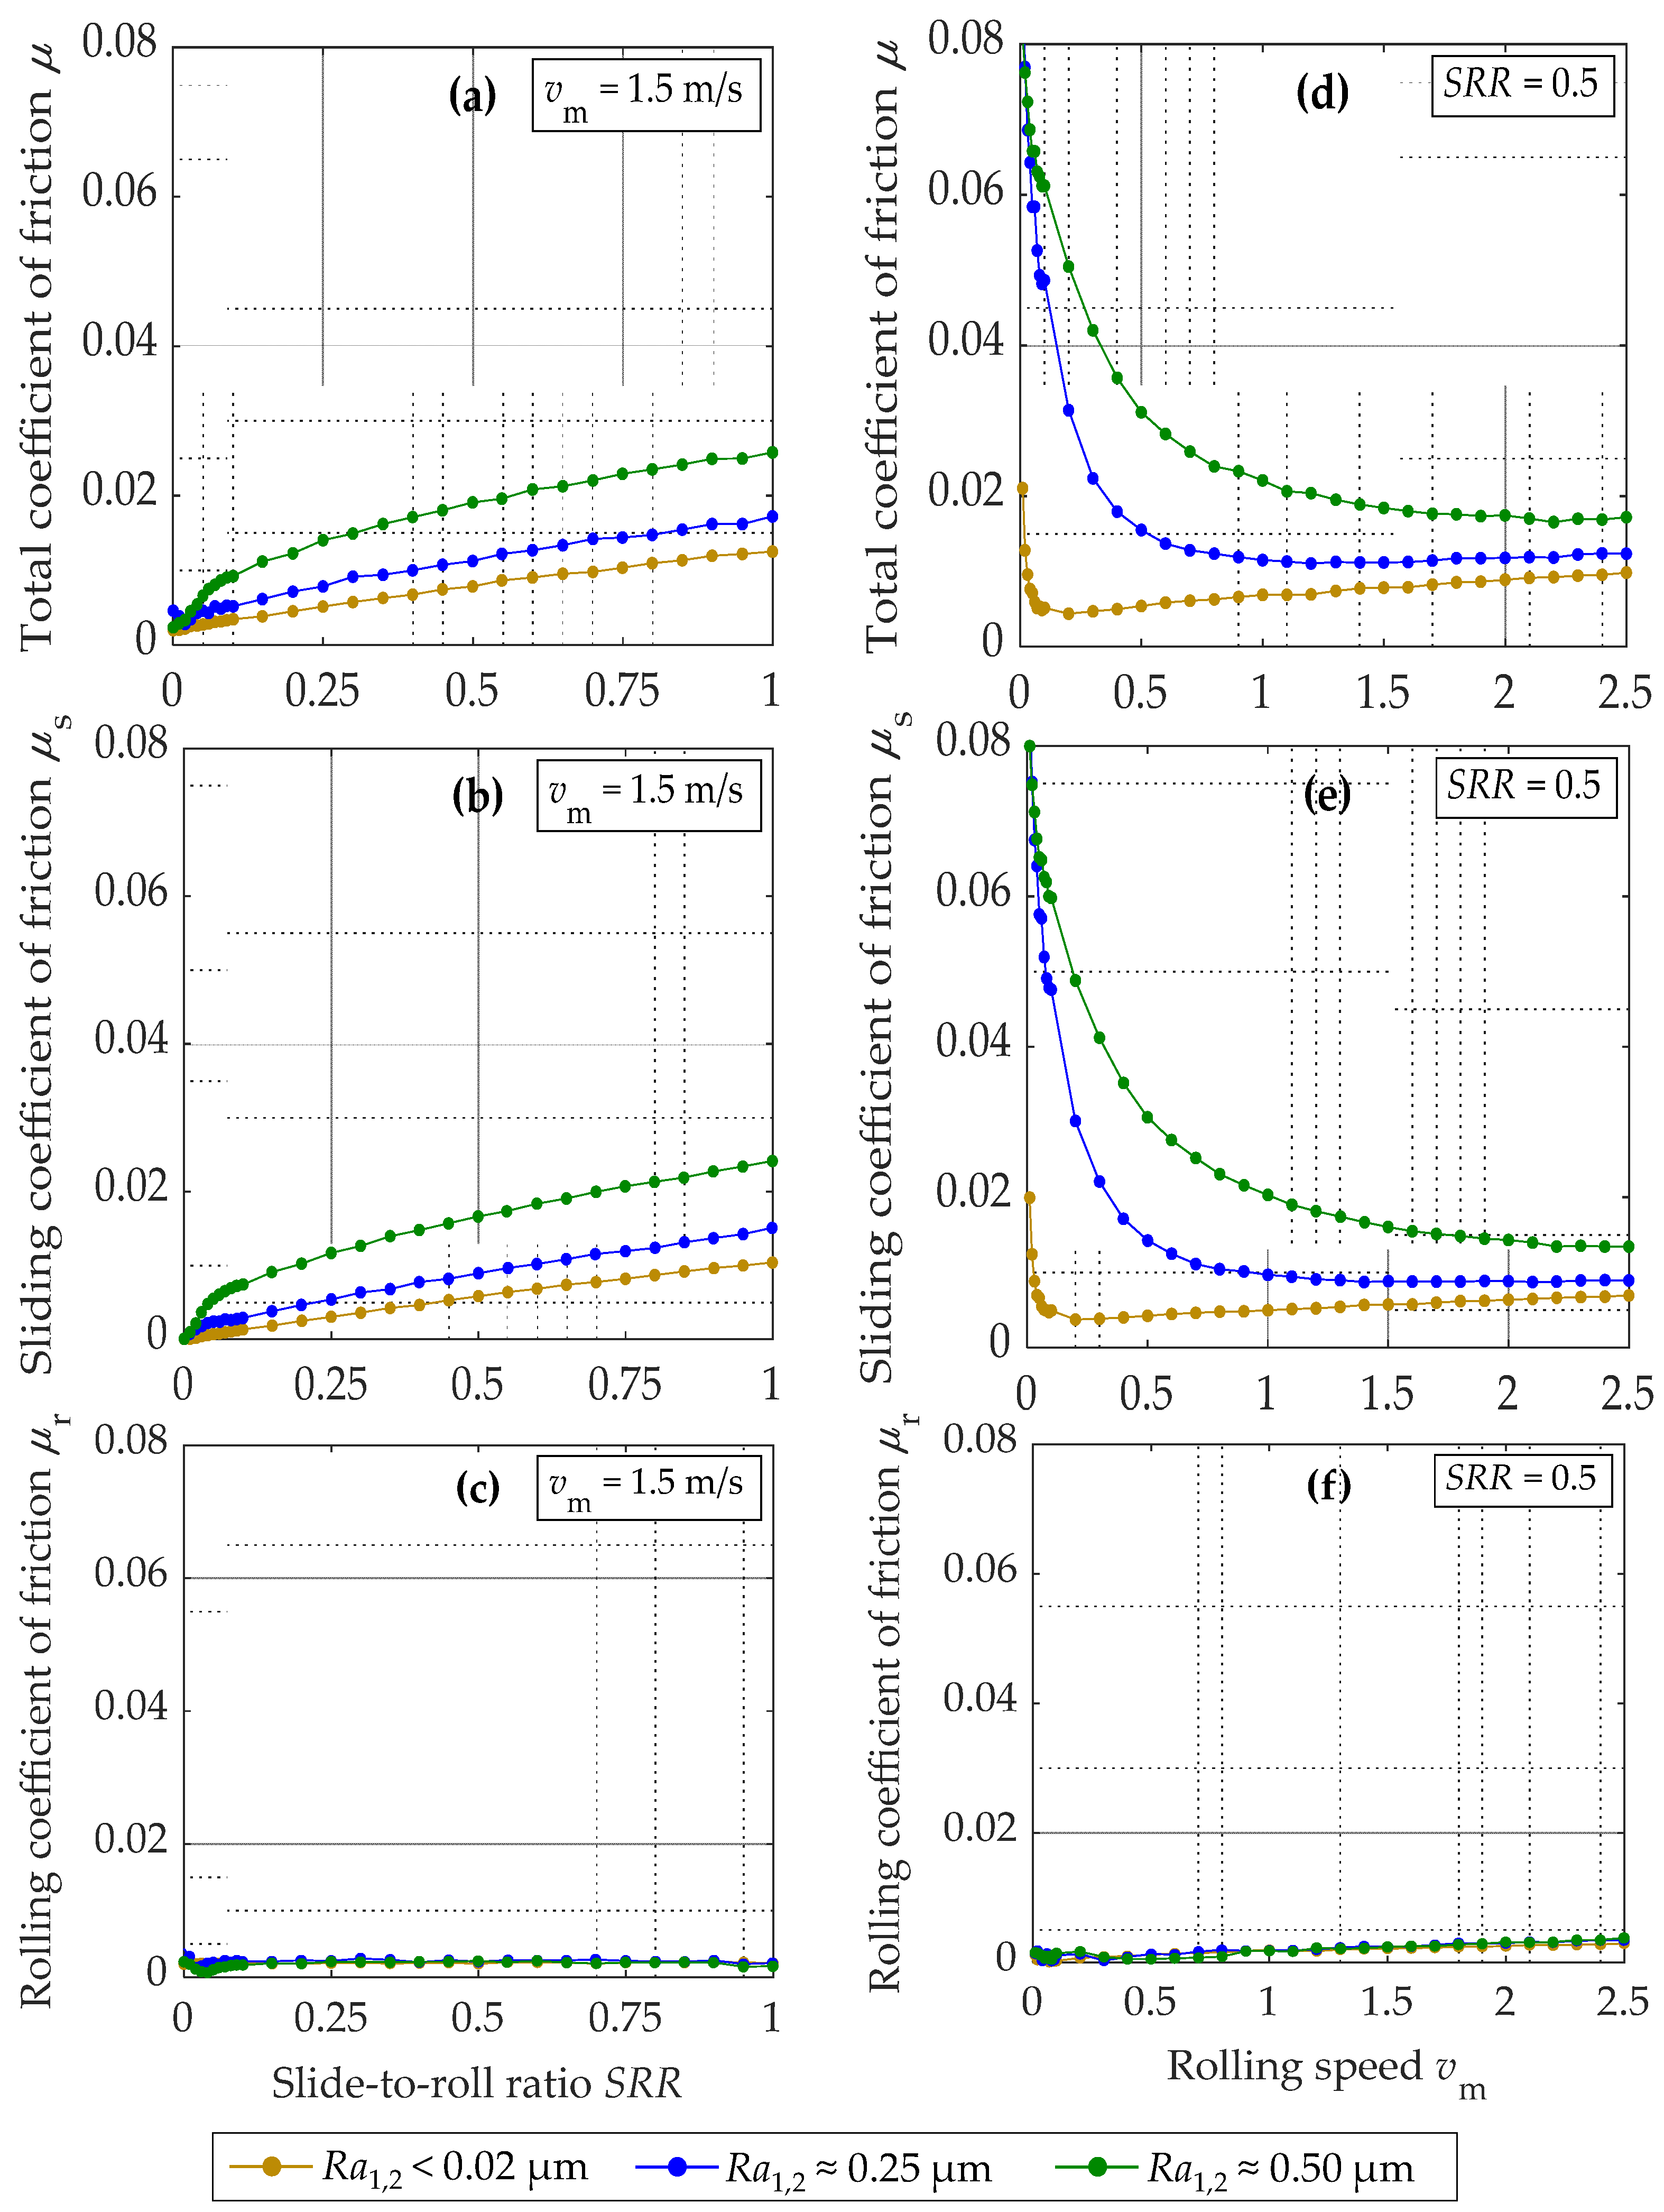
Figure 10 shows the influence of the surface roughness on the total sliding , sliding , and rolling coefficients of friction over the slide-to-roll ratio SRR (Figure 10a–c) and rolling speed (Figure 10d–f) for the contact configuration 100Cr6/PEEK at a normal force and oil temperature °C for MIN100.
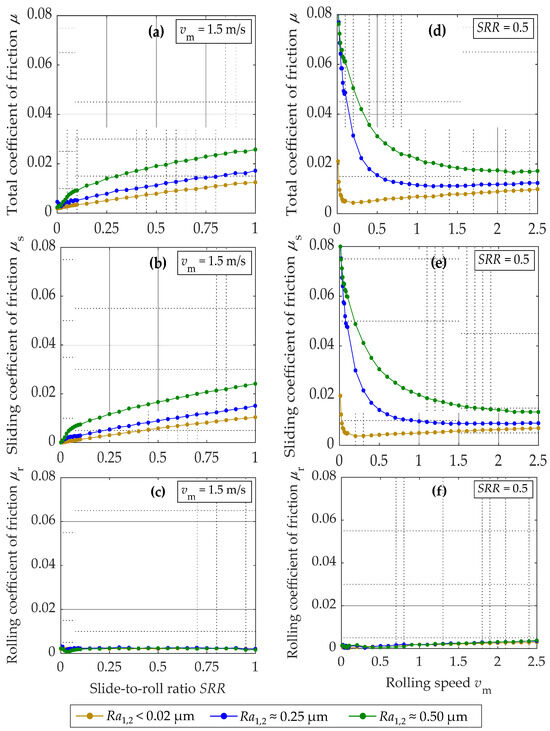
Figure 10.
Total , sliding and rolling coefficients of friction over the slide-to-roll ratio (a–c) and rolling speed (d–f) for the configuration 100Cr6/PEEK with surface roughness , , and at and for MIN100.
A higher surface roughness results in a higher total coefficient of friction in Figure 10a,d. While the rolling coefficient of friction in Figure 10c,f is barely affected by the surface roughness, the sliding coefficient of friction in Figure 10b,e increases drastically with a higher surface roughness. The dependency of on the SRR in Figure 10b shows, for ground surfaces with , approximately three times higher values than those observed with polished surfaces with for most of the considered SRRs.
The dependency of the sliding coefficient of friction on in Figure 10e shows, for decreasing rolling speed , that increases strongly for a higher surface roughness with an increasing severity of mixed friction.
3.7. Summary of Results
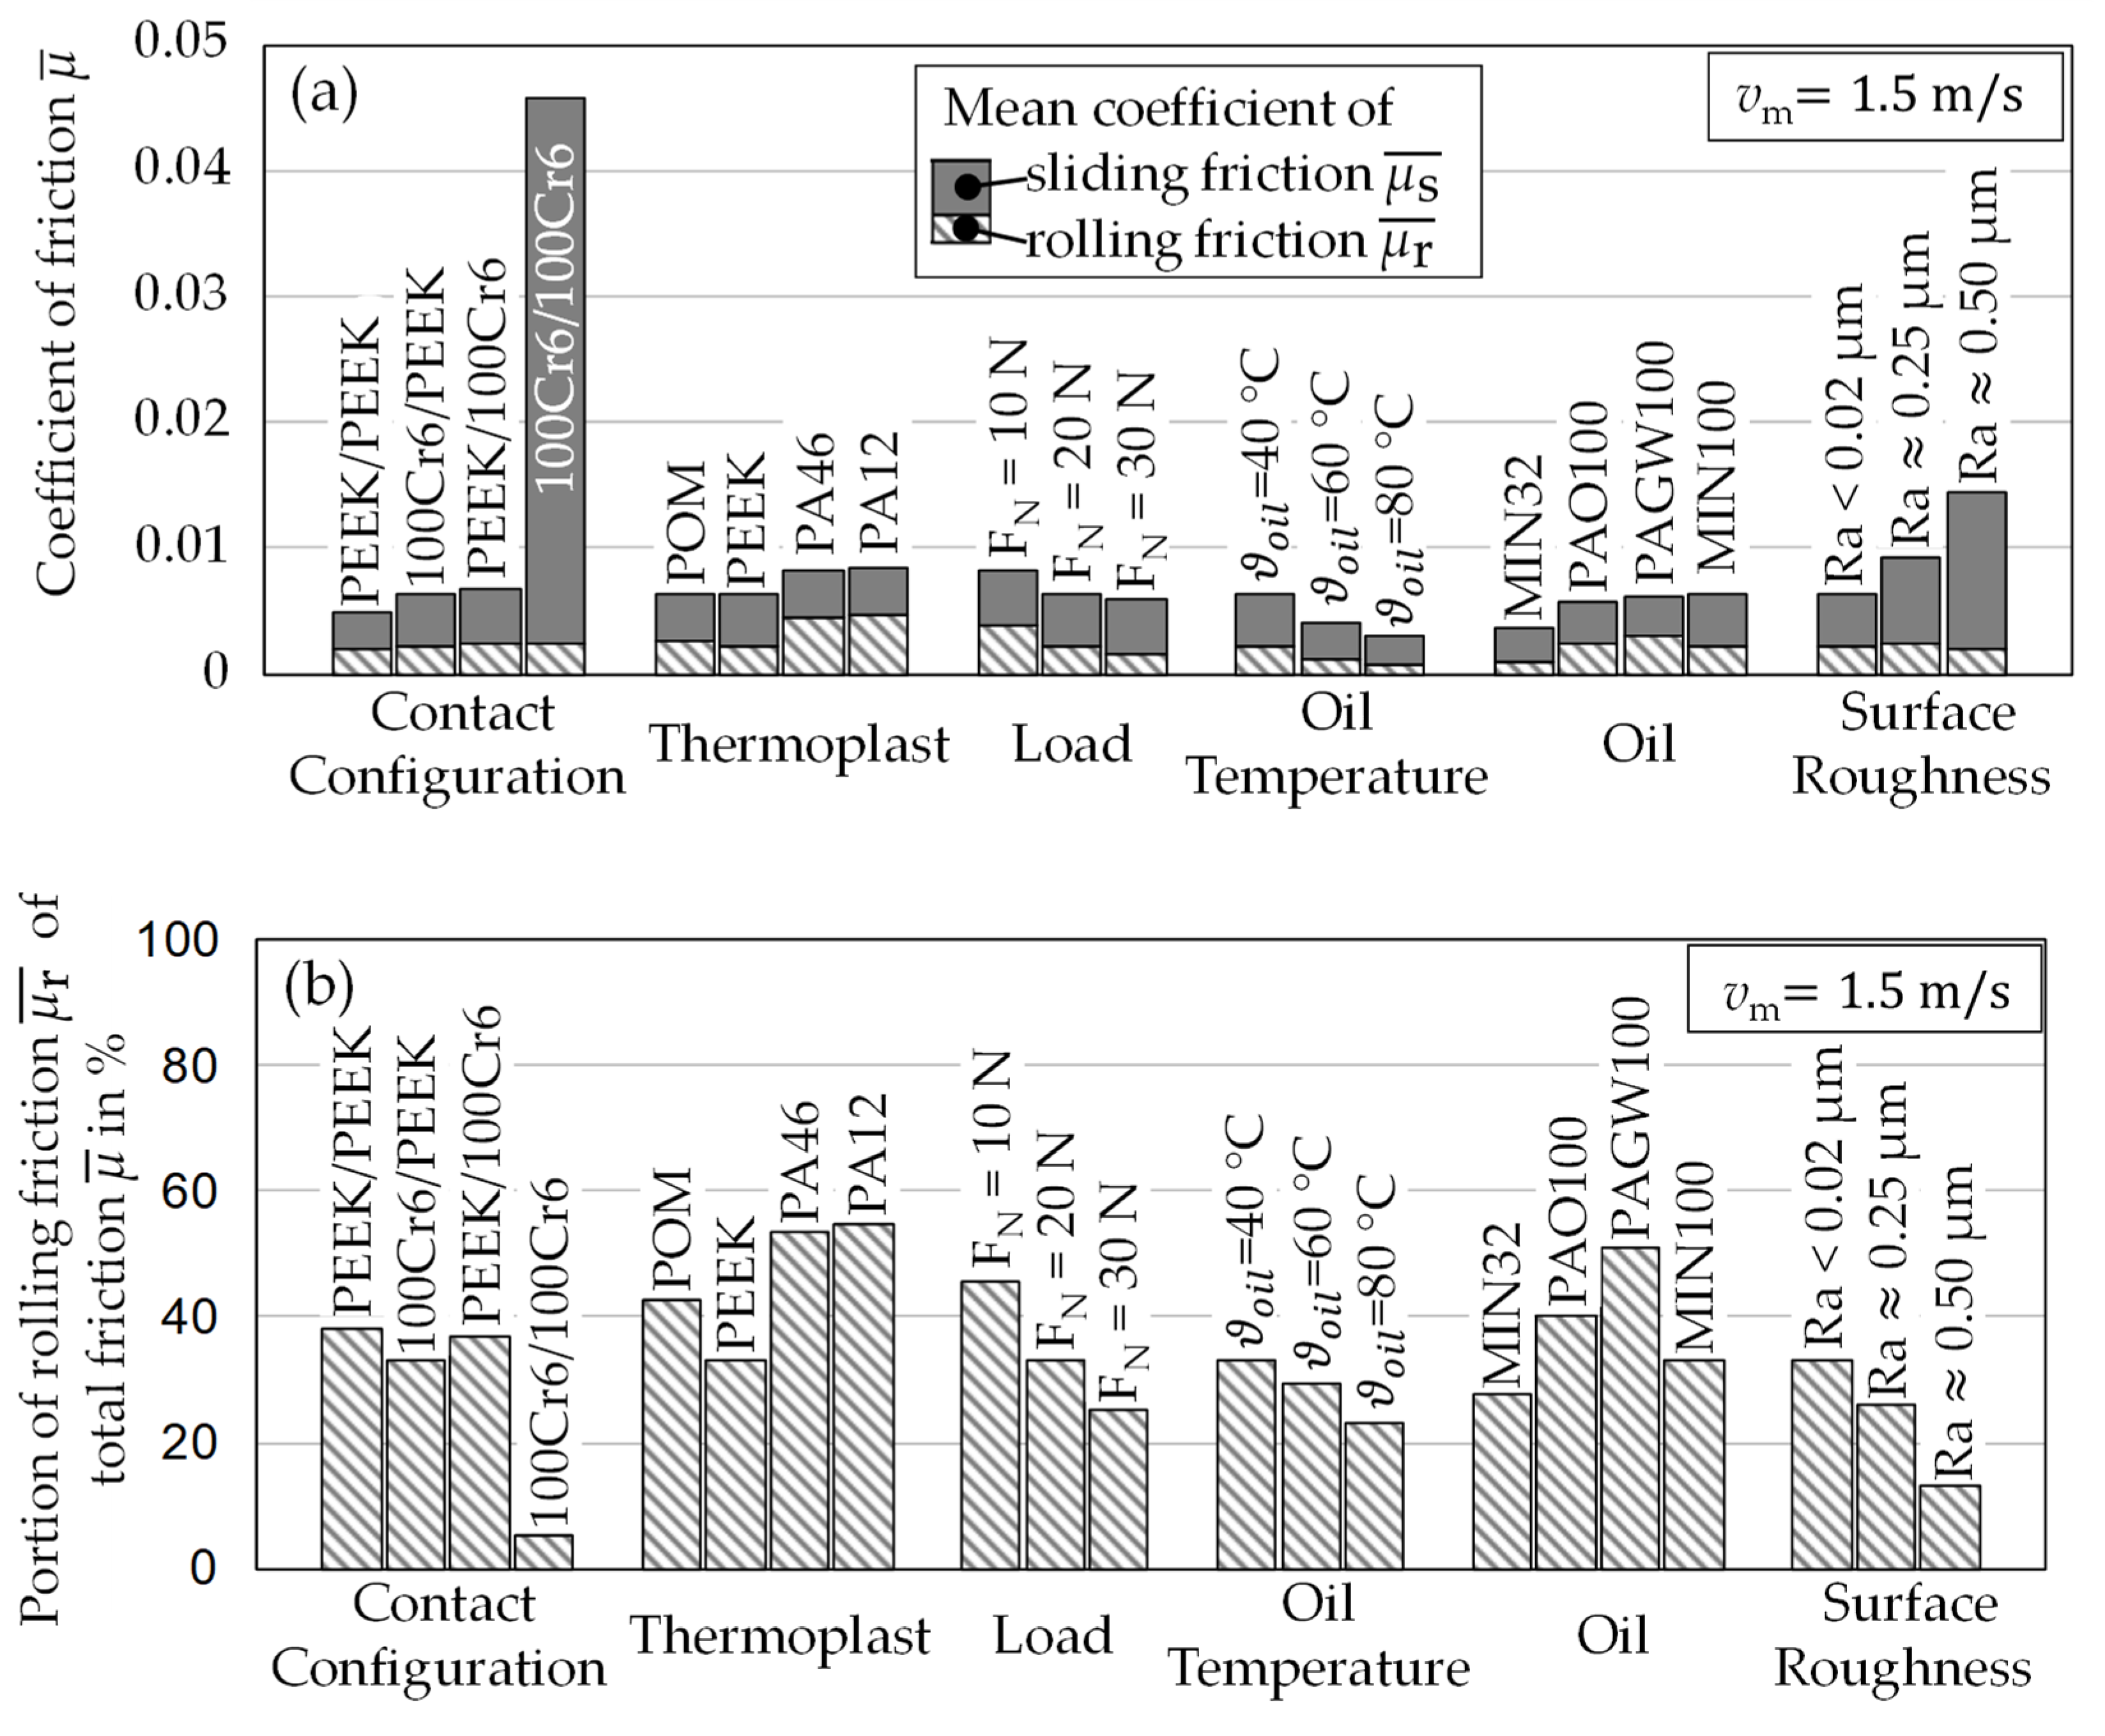
Figure 11 gives an overview of the investigated influences on the coefficient of friction presented in Section 3.1, Section 3.2, Section 3.3, Section 3.4, Section 3.5 and Section 3.6. The mean values and of the coefficient of sliding and rolling friction represent an average over the SRR at a constant rolling speed for each influence:

Figure 11.
Mean coefficient of sliding friction and rolling friction (a) and relative portion of mean rolling friction to the mean total coefficient of friction in % (b) for the investigated influences.
The mean value of the total coefficient of friction is determined by the following:
The mean total coefficient of friction in Figure 11a is observed to decrease with increasing load , increasing oil temperature and decreasing surface roughness Ra. The oil viscosity exerts a stronger influence than the type of oil. No obvious trend regarding Young’s modulus of the thermoplastic materials is observed. However, the thermoplastic material exerts an influence on the total friction due to the presence of different rolling friction components. With regard to the contact configuration, PEEK/PEEK shows a lower friction compared to 100Cr6/100Cr6 or 100Cr6/PEEK. It can be observed that, for all contact configurations involving a thermoplastic body and polished surfaces, superlubricity is achieved, with a mean coefficient of friction smaller than 0.01. However, for contact configurations involving a ground surface with , exceeds 0.01.
Figure 11b shows that a portion of over 50% of the total friction can be attributed to rolling friction. As the load , oil temperature , and surface roughness Ra increase, the portion of rolling friction decreases. With regard to the influence of the lubricant, the mineral oils MIN32 and MIN100 have, despite their different viscosity classes, a similar and lower portion of rolling friction than PAO100 and PAGW100. Considering the thermoplastic materials, the portion of rolling friction of the polyamides PA46 and PA12 is found to be similar and the highest, while that of PEEK is the lowest and that of POM is ranked as intermediate. Regarding the contact configuration, PEEK/PEEK and PEEK/100Cr6 seem to have a similar portion of rolling friction, while 100Cr6/PEEK has a slightly lower portion and 100Cr6/100Cr6 a distinctly lower one. A detailed analysis of the hybrid contacts, PEEK/100Cr6, and 100Cr6/PEEK reveals that the observed differences in the total coefficient of friction can be attributed to the rolling friction. While the coefficient of sliding friction is only 0.26% higher, the coefficient of rolling friction is 15.5% higher for PEEK/100Cr6 compared to 100Cr6/PEEK. In total, is about 8% higher for PEEK/100Cr6 contact compared to 100Cr6/PEEK contact.
4. Discussion
The results in Section 3 are discussed with respect to the influence of the contact configuration, thermoplastic material, lubricant, load, oil temperature, and surface roughness.
4.1. Influence of Contact Configuration
The contact configurations PEEK/100Cr6 and 100Cr6/PEEK showed no noticeable difference in the friction behavior, as illustrated in Figure 5. As demonstrated by Ziegltrum et al. [15], elastic deformation in a contact configuration with steel and a polymer occurs primarily at the polymer body. Accordingly, the contact geometry differs between the configurations PEEK/100Cr6 and 100Cr6/PEEK at the ball-on–disk tribometer. A schematic illustration of the deformed EHL contact geometry is provided in Figure 12, which is based on numerical calculations of Ziegltrum et al. [15].

Figure 12.
Schematic representation of the contact geometry (deformation) depending on the contact configurations 100Cr6/100Cr6, PEEK /100Cr6, 100Cr6/ PEEK, and PEEK/PEEK.
In the contact configuration PEEK/100Cr6 with the deformed PEEK ball, it is assumed that the contact area is nearly even. In the contact configuration 100Cr6/PEEK with the deformed PEEK disk, a curved contact area is observed. As the friction force is always measured at the ball specimen in the MTM2 tribometer (see Section 2.1), its impact on the friction measurement is not necessarily negligible. This is shown in Figure 11 and Section 3.7, where an 8% difference in is observed, with the higher friction being measured for the contact configuration PEEK/100Cr6. An influence of configuration was also found by Quinn et al. [26]’s investigation of PDMS. Their results indicated that the contact configuration steel ball and PDMS disk exhibited higher friction than the contact configuration featuring a PDMS ball and a steel disk. The authors proposed that the observed difference in hysteresis behavior might have been a potential explanation for this. In this study with PEEK, it is proposed that the difference between the contact configurations originates mainly from the rolling friction portion. To gain a comprehensive understanding, numerical modeling and calculation could be conducted, as exemplified by Schmid et al. [24] for hard conformal contacts or Stupkiewicz et al. [9] for low-stiffness polymer contacts. For the configurations in this study containing PEEK, the EHL contact pressure distribution was expected to be almost symmetrical, as shown by Hofmann et al. [13]. They also did not find effects attributed to viscoelasticity or loading frequency for PEEK, which is supported by this study. Hence, it can be concluded that the main portion of rolling friction has its origin in the EHL oil film, related to Poiseuille friction, and the influence of the hysteresis behavior tends to be small. Moreover, it should be noted that the scale of the y-axis for rolling friction in Figure 5c,f in Section 3.1 is very low, which results in the overall values being very low. Therefore, the differences between the contact configurations are seen to be relatively small.
The increase in rolling friction for the contact configuration 100Cr6/100Cr6 at low SRR values (see Figure 5c) can be attributed to a micro-slip resulting from the difference in contact radii. This phenomenon was first observed by Heathcote [40] and discussed in detail by Schmid et al. [24]. In this study and in accordance with the evaluation of Vicente et al. [2], the additional friction portion due to micro-slip was evaluated as part of the rolling speed at MTM2, as it is a consequence of rolling and dependent on the rolling direction.
The contact configuration PEEK/PEEK exhibited an even lower coefficient of friction than PEEK/100Cr6 and 100Cr6/PEEK. This was due to a larger elastically flattened area, which resulted in a higher EHL contact temperature. This phenomenon was also shown by Schmid et al. [24] for different contact radii, resulting in different elastically flattened area sizes. Further, this was amplified by a lower thermal effusivity e of PEEK (e) compared to steel (e), resulting in a high thermal insulation effect for the PEEK/PEEK configuration.
4.2. Influence of Thermoplastic Material
The sliding friction of EHL contacts with technical and high-performance thermoplastics in a fluid film lubrication regime is dominated by Newtonian fluid behaviors, a consequence of the low contact pressures involved and in accordance with the results by Vicente et al. [1,2]. This can be seen in the linearly increasing friction curves illustrated in Figure 6b. In a comparison of the contact configurations in Section 3.2, the sliding coefficient of friction was largely consistent across the investigated thermoplastics, with the exception of 100Cr6/PEEK. When comparing the calculated Hertzian contact pressures in Table 3, all contact configurations in Section 3.2 exhibited similar values, with the exception of PA12. Hence, the frictional differences can be attributed to either a damping behavior with an increasing stiffness behavior for PA12 at the investigated conditions or to differences in Young’s modulus regarding tensile or compressive forces, being, thus, a loading frequency-dependent behavior. Further, surface interactions between the oil and the thermoplastic material, such as sorption, can influence the thermoplastic material’s mechanical properties, like its stiffness [38]. According to the results of Vicente et al. [1], the overall correlation between and follows a bathtub curve according to their calculation regression. This means a decreasing coefficient of friction for very low stiffness values and an increasing coefficient of friction for a higher stiffness. It should be noted, however, that Vicente et al. [1] did not vary Young’s modulus itself in their investigations. According to Myant et al. [8], the sliding friction decreases with an increasing stiffness. Assuming a higher stiffness for PEEK than POM (see Table 1), the results in this study show contrary results. However, it should be noted that Myant et al. [8] only focused on polymers with very low stiffness values, while this study focused on technical and high-performance thermoplastics with a higher stiffness, resulting in different areas of the bathtub curve. Also, the surface roughness of the polymers they studied was varied. The stiffness behavior of thermoplastics is complex and particularly dependent on temperature and load frequency.
For very low rolling speeds , the highest sliding coefficient of friction was observed for the contact configurations with polyamides PA12 and PA46 (see Figure 6e). This phenomenon was attributed to the molecular structures of the interacting material surfaces in mixed and boundary lubrication.
Rolling friction depends on both the fluid flow behavior and the material behavior. Overall, the pressure distribution is decisive for the rolling friction. A high pressure (and therefore load) portion towards the contact inlet results in a higher rolling friction. This can be due to viscoelasticity or fluid flow characteristics. For the fluid flow characteristics, the Poiseuille flow indicates the amount of rolling friction. The pressure distribution is crucial and becomes more Hertzian as the stiffness increases and, therefore, more symmetrical, resulting in a lower rolling friction. The rolling friction is not only influenced by the lubricant but also by viscoelastic material behavior, which also influences the pressure distribution and shifts the pressure portions towards the contact inlet, as shown by Putignano and Dini [18], resulting in a higher rolling friction. The rolling coefficient of friction of the considered contact configurations with thermoplastics can be divided into two distinct categories. The contact configurations 100Cr6/POM and 100Cr6/PEEK show the identical rolling coefficient of friction , which is very similar to the rolling friction of 100Cr6/100Cr6. This suggests that, for these three contact configurations, the rolling friction in the EHL contacts originates mainly from the fluid and its pressure distribution, which is referred to as Poiseuille friction. This is supported by the observation of nearly zero rolling friction at very low rolling speeds , given in Figure 6f. Given a minimal lubricant fluid film, the rolling friction of the fluid itself is also minimal for PEEK and POM. It should be noted that, for the considered operating conditions, PEEK operates clearly under and POM clearly above the glass transition temperature , depicted in Figure 2. Compared to 100Cr6/PEEK and 100Cr6/POM, the contact configurations 100Cr6/PA12 and 100Cr6/PA46 showed a higher rolling friction, even at very small rolling speeds . This can be due to higher hysteresis friction within the polyamides. As the polyamides operate close to the glass transition temperature, where higher material damping occurs, an effect of on can be assumed.
Following the results of Vicente et al. [1], the rolling friction increases with increasing stiffness. Assuming a higher stiffness for PEEK than POM, the results in this study were contrasting. However, it should be noted that Vicente et al. did not vary Young’s modulus in their investigations. Following the results of Myant et al. [8], the results of this study are in agreement regarding the influence of stiffness on rolling friction.
4.3. Influence of Lubricant
In the context of fluid film lubrication, friction in the EHL contact is typically dominated by the shearing of lubricant under a high pressure. As illustrated in Figure 7b, PAGW100 did not show the lowest sliding friction, which is typically observed for steel contacts with maximal contact pressures in the order of 1 GPa [41]. Thus, the high-pressure behavior of a lubricant showed little influence on EHL friction with technical and high-performance thermoplastics. Also, shear-thinning did not show a significant influence, as all sliding friction curves showed a nearly linear trend over the (see Figure 7b). It could, therefore, be concluded that the influence of shear-thinning behaviors on friction in oil-lubricated thermoplastic rolling–sliding EHL contacts was small for the investigated lubricants. Rather than the lubricants’ high-pressure and shear-thinning behaviors, it was the nominal viscosity to be of great consequence.
For mixed and boundary lubrication at a small rolling speed , as shown in Figure 7d, the measured friction of the two mineral oils, MIN32 and MIN100, was predominantly higher in comparison to PAO100 and PAGW100. For MIN32, the transition from mixed to fluid film lubrication was observed at higher rolling speeds (see Figure 7e). This was attributed to the lower viscosity of MIN32. Both mineral oils showed higher coefficients of friction in the mixed and boundary lubrication regimes. This could be related to high pressure and viscosity increases at micro-EHL contacts at surface asperities [42,43] or interactions and tribo-induced surface changes [38]. A difference in the rolling friction for the different oils can be observed (see Figure 7f). This shows that the rolling friction can strongly be driven by the lubricant itself and not only by the thermoplastic material.
4.4. Influence of Load and Oil Temperature
The sliding coefficient of friction did not change significantly when the load varied, as seen in Figure 8b,e. This can be understood by considering the estimated contact pressures in Table 3. The calculated Hertzian pressures are low, and neither the pressure-related increase in contact viscosity nor the influence of contact temperature increases introduce significant differences or effects that cancel out for the considered contact configuration. Contrary, rolling friction decreased with higher loads. Hence, a higher contact pressure resulted in a lower rolling friction (see Figure 8c,f), which was in accordance with the findings of Vicente et al. [1], Myant et al. [8], and Lates et al. [44].
As discussed in Section 4.3, the viscosity at ambient conditions exerts a dominant influence on frictional behavior in EHL contacts with technical and high-performance thermoplastics. This is confirmed by the influence of oil temperature , as friction decreases with increasing (see Figure 9b), without a notable impact on the trend in the friction curves. Note that Hofmann et al. [13] have shown very small contact temperatures for EHL contacts with PEEK. The rolling friction was observed to decrease with a higher oil temperature and increase with the rolling speed (see Figure 9c,f). This finding is consistent with the results reported by Vicente et al. [1]. Given the test procedure and configuration of the MTM2 testing chamber (see Figure 1), it is reasonable to assume that the specimens have temperatures similar to those of oil. Therefore, an increase in oil temperature results in an increase in the thermoplastic bulk temperature and, consequently, a decrease in stiffness and contact pressures (see Figure 2). Lower contact pressures mainly increase the rolling friction (see Figure 8b,c), a contrary effect to the overall decrease in rolling friction with higher temperatures which was observed. For the investigated oil temperature range and the thermoplastic PEEK, with only a low stiffness reduction in this range, it could be concluded that the lubricant’s behavior was the main influencing factor.
The viscosity of the oil is of great consequence with respect to the oil film thickness in EHL contacts. Consequently, at elevated oil temperatures , the onset of the mixed lubrication regime shifted towards higher rolling speeds (see Figure 9d).
4.5. Influence of Surface Roughness
In the case of mixed and boundary lubrication, it is essential to take into account the impact of roughness when assessing friction. The starting influence of this regime gives rise to the formation of local narrowing phenomena between roughness asperities at micro-EHL contacts [42,43]. In addition, the surface interaction and adhesive forces play a significant role [38,45]. The experimental results revealed that the coefficient of friction could increase significantly for the contact configurations with PEEK and 100Cr6 under boundary lubrication. A coefficient of friction exceeding was observed, which was markedly higher than that recognized in the fluid film lubrication regime (see Figure 10d). It could be observed that the increase in friction was primarily attributable to sliding friction rather than rolling friction (see Figure 10e,f). Given that mixed and boundary lubrication are also accompanied by surface alteration and wear over time, the presented short-term measurements are quasi-stationary snapshots. Although a run-in procedure was conducted prior to the measurements, long-term testing is required to draw further conclusions.
5. Conclusions
In this study, different influence parameters on friction in oil-lubricated rolling–sliding EHL contacts with technical and high-performance thermoplastics were studied based on a phenomenological methodology using a ball-on-disk tribometer. The effects and relevance of the influence parameters were discussed. The general conclusions can be summarized as follows:
- In thermoplastic EHL contacts, both sliding and rolling friction contributed significantly to the total friction, contrasting plain steel contact configurations, in which sliding friction dominated.
- The sliding friction was low for all contact configurations with thermoplastics compared to the plain steel contact configuration at the same normal load, thus showing the potential frictional advantages of using thermoplastic materials.
- For the operating conditions studied, the rolling friction for the contact configurations with PA12 and PA46 was approximately twice that of the contact configurations with PEEK and POM.
- Despite the different contact geometries, the difference in sliding and rolling friction was small between the contact configurations of steel/PEEK and PEEK/steel.
For fluid film lubrication, the following conclusions can be drawn:
- The sliding friction is only a little influenced by the oil type, load, and thermoplastic material. A lower sliding friction is achieved by a lower Young modulus and a lower oil viscosity.
- The rolling friction is highly dependent on the thermoplastic material, oil type, oil viscosity, and load. A lower rolling friction is achieved by a higher normal load and a lower oil viscosity.
- Friction in oil-lubricated thermoplastic EHL contacts shows the potential for superlubricity with a coefficient of friction less than 0.01.
For mixed and boundary lubrication, the following conclusions can be drawn:
- The total friction increases drastically compared to fluid film lubrication.
- The rolling friction is only slightly influenced, but the sliding friction is strongly increased. This is attributed to the high solid friction caused by surface interactions.
- POM and PEEK have the lowest friction, and PA12 and PA46 have the highest friction in mixed and boundary lubrication.
In order to exploit the low-friction potential in machine elements with technical and high-performance thermoplastics, one should enhance the fluid film lubrication regime. This can be achieved with a low surface roughness or, in general, using oils that form a high oil film thickness. Nevertheless, mixed and boundary lubrication cannot be avoided for full operating maps. The interactions between surfaces and between surfaces and lubricants are complex and can be coupled by changing surface conditions with tribofilms and wear. This also affects the friction and can be the subject of further studies with regard to long-term behaviors.
Author Contributions
Conceptualization, F.S. and T.L.; methodology, F.S. and T.L.; experiments, F.S.; validation, F.S.; formal analysis, T.L.; writing—original draft preparation, F.S.; writing—review and editing, T.L. and K.S.; supervision, T.L. and K.S.; project administration, T.L. and K.S.; funding acquisition, K.S. All authors have read and agreed to the published version of the manuscript.
Funding
This research was funded by the research project CHEPHREN (03EN4005A), focusing on chemical and physical possibilities for friction reduction, and it is supported by the Federal Ministry for Economic Affairs and Climate Action (BMWK) and supervised by Project Management Jülich (PtJ).
Data Availability Statement
The raw data supporting the conclusions of this article will be made available by the authors upon request.
Acknowledgments
The authors are grateful for the sponsorship and support received from BMWK and PtJ.
Conflicts of Interest
The authors declare no conflicts of interest.
Nomenclature
| Young’s modulus in N/m2 | |
| Normal force in N | |
| Friction force in N | |
| Slide-to-roll ratio | |
| Rolling speed in m/s | |
| Sliding velocity in m/s | |
| Surface velocity of solid body in m/s | |
| Arithmetic average height of body in μm | |
| Thermal effusivity in J/(K·m2·s1/2) | |
| Specific thermal capacity in J/(kg·K) | |
| Viscosity index | |
| Hertzian pressure in N/mm2 | |
| Greek symbols | |
| Thermal conductivity in W/(m·K) | |
| Coefficient of friction | |
| Poisson’s ratio|kinematic viscosity in mm/s2 | |
| Temperature in °C | |
| Glass transition regime in °C | |
| Density in g/cm³ | |
| Oil temperature in °C | |
| Mean coefficient of friction | |
| Relative change in test run 2 with respect to test run 1 | |
| Indices | |
| Test run 1 | |
| Test run 2 (repetition) | |
| r | Rolling |
| s | Sliding |
| oil | Oil |
Appendix A
In the following section, the repeatability of the measurements is evaluated. For this, the relative change of the second run compared to the first run is evaluated for every measurement and then averaged for each curve after Equation (A1).
Table A1.
Relative change in the second test run with respect to the first test run, averaged over each friction and Stribeck-like curve.
Table A1.
Relative change in the second test run with respect to the first test run, averaged over each friction and Stribeck-like curve.
| Figure 5a | Figure 5b | Figure 5c | Figure 5d | Figure 5e | Figure 5f | |
| 100Cr6/100Cr6 | 3.8% | 7.9% | −14.9% | 5.3% | 5.9% | −10.5% |
| PEEK/100Cr6 | −1.9% | 8.7% | −9.8% | 0.0% | 4.1% | −12.9% |
| 100Cr6/PEEK | −4.4% | −0.5% | −10.9% | 0.2% | 3.5% | −10.1% |
| PEEK/PEEK | 0.7% | 1.9% | −4.9% | 14.5% | 21.5% | −10.5% |
| Figure 6a | Figure 6b | Figure 6c | Figure 6d | Figure 6e | Figure 6f | |
| 100Cr6/PEEK | −4.4% | −0.5% | −10.9% | 0.2% | 3.5% | −10.1% |
| 100Cr6/PA12 | 2.8% | 8.6% | 3.9% | 3.7% | −0.6% | 9.4% |
| 100Cr6/PA46 | −9.5% | −3.8% | −13.5% | −10.3% | −5.9% | −14.6% |
| 100Cr6/POM | 1.8% | −2.4% | 2.9% | 5.1% | 6.6% | 1.9% |
| Figure 7a | Figure 7b | Figure 7c | Figure 7d | Figure 7e | Figure 7f | |
| MIN100 | −4.4% | −0.5% | −10.9% | 0.2% | 3.5% | −10.1% |
| MIN32 | 0.6% | 8.1% | −9.5% | 22.9% | 28.5% | −8.5% |
| PAO100 | −6.5% | −2.4% | −10.8% | −5.2% | −3.7% | −8.0% |
| PAGW100 | −5.6% | −2.2% | −6.9% | −3.9% | −3.7% | 17.4% |
| Figure 8a | Figure 8b | Figure 8c | Figure 8d | Figure 8e | Figure 8f | |
| = 10 N | −6.5% | 2.2% | −12.2% | −1.8% | 1.8% | −9.4% |
| = 20 N | −4.4% | −0.5% | −10.9% | 0.2%% | 3.5% | −10.1% |
| = 30 N | −2.1% | 3.6% | −9.9% | 5.5%% | 7.6% | 1.8% |
| Figure 9a | Figure 9b | Figure 9c | Figure 9d | Figure 9e | Figure 9f | |
| −4.4% | −0.5% | −10.9% | 1.5% | 3.5% | −10.1% | |
| −4.8% | 3.9% | −15.7% | 7.8% | 13.1% | −10.4% | |
| 7.9% | 19.7% | −7.2% | 26.4% | 30.4% | 1.5% | |
| Figure 10a | Figure 10b | Figure 10c | Figure 10d | Figure 10e | Figure 10f | |
| Ra < 0.02 μm | −4.4% | −0.5% | −10.9% | 0.2% | 3.5% | −10.1% |
| Ra ≈ 0.25 μm | −15.1% | −24.6% | 0.6% | −3.7% | −3.5% | −0.6% |
| Ra ≈ 0.50 μm | −24.8% | −24.8% | 38.9% | −4.1% | −4.7% | 35.8% |
References
- de Vicente, J.; Stokes, J.R.; Spikes, H.A. The Frictional Properties of Newtonian Fluids in Rolling–Sliding soft-EHL Contact. Tribol. Lett. 2005, 20, 273–286. [Google Scholar] [CrossRef]
- de Vicente, J.; Stokes, J.R.; Spikes, H.A. Rolling and sliding friction in compliant, lubricated contact. Proc. Inst. Mech. Eng. Part J J. Eng. Tribol. 2006, 220, 55–63. [Google Scholar] [CrossRef]
- Reitschuster, S.; Maier, E.; Lohner, T.; Stahl, K. Friction and Temperature Behavior of Lubricated Thermoplastic Polymer Contacts. Lubricants 2020, 8, 67. [Google Scholar] [CrossRef]
- VDI 2736 Blatt 2:2014-06; Thermoplastische Zahnräder. Stirnradgetriebe. Tragfähigkeitsberechnung. Verein Deutscher Ingenieure: Düsseldorf, Germany, 2014.
- Johnson, K.L. Regimes of Elastohydrodynamic Lubrication. J. Mech. Eng. Sci. 1970, 12, 9–16. [Google Scholar] [CrossRef]
- Myers, T.G.; Hall, R.W.; Savage, M.D.; Gaskell, P.H. The transition region of elastohydrodynamic lubrication. Proc. R. Soc. Lond. A 1991, 432, 467–479. [Google Scholar] [CrossRef]
- Marx, N.; Guegan, J.; Spikes, H.A. Elastohydrodynamic film thickness of soft EHL contacts using optical interferometry. Tribol. Int. 2016, 99, 267–277. [Google Scholar] [CrossRef]
- Myant, C.; Spikes, H.A.; Stokes, J.R. Influence of load and elastic properties on the rolling and sliding friction of lubricated compliant contacts. Tribol. Int. 2010, 43, 55–63. [Google Scholar] [CrossRef]
- Stupkiewicz, S.; Lengiewicz, J.; Sadowski, P.; Kucharski, S. Finite deformation effects in soft elastohydrodynamic lubrication problems. Tribol. Int. 2016, 93, 511–522. [Google Scholar] [CrossRef]
- Hooke, C.J.; O’Donoghue, J.P. Elastohydrodynamic Lubrication of Soft, Highly Deformed Contacts. J. Mech. Eng. Sci. 1972, 14, 34–48. [Google Scholar] [CrossRef]
- Esfahanian, M.; Hamrock, B.J. Fluid-Film Lubrication Regimes Revisited. Tribol. Trans. 1991, 34, 628–632. [Google Scholar] [CrossRef]
- Hooke, C.J. The Elastohydrodynamic Lubrication of Heavily Loaded Contacts. J. Mech. Eng. Sci. 1977, 19, 149–156. [Google Scholar] [CrossRef]
- Hofmann, S.; Maier, E.; Lohner, T. In Situ Contact Analysis of Polyetheretherketone under Elastohydrodynamic Lubrication. Polymers 2022, 14, 4398. [Google Scholar] [CrossRef] [PubMed]
- Maier, E.; Ziegltrum, A.; Lohner, T.; Stahl, K. Characterization of TEHL contacts of thermoplastic gears. Forsch. Ingenieurwes. 2017, 81, 317–324. [Google Scholar] [CrossRef]
- Ziegltrum, A.; Maier, E.; Lohner, T.; Stahl, K. A Numerical Study on Thermal Elastohydrodynamic Lubrication of Coated Polymers. Tribol. Lett. 2020, 68, 71. [Google Scholar] [CrossRef]
- Hunter, S.C. The Rolling Contact of a Rigid Cylinder with a Viscoelastic Half Space. J. Appl. Mech. 1961, 28, 611–617. [Google Scholar] [CrossRef]
- Hooke, C.J.; Huang, P. Elastohydrodynamic lubrication of soft viscoelastic materials in line contact. Proc. Inst. Mech. Eng. Part J J. Eng. Tribol. 1997, 211, 185–194. [Google Scholar] [CrossRef]
- Putignano, C.; Dini, D. Soft Matter Lubrication: Does Solid Viscoelasticity Matter? ACS Appl. Mater. Interfaces 2017, 9, 42287–42295. [Google Scholar] [CrossRef] [PubMed]
- Zhao, Y.; Liu, H.C.; Morales-Espejel, G.E.; Venner, C.H. Effects of solid viscoelasticity on elastohydrodynamic lubrication of point contacts. Tribol. Int. 2022, 171, 107562. [Google Scholar] [CrossRef]
- Krupka, J.; Dockal, K.; Krupka, I.; Hartl, M. Elastohydrodynamic Lubrication of Compliant Circular Contacts near Glass-Transition Temperature. Lubricants 2022, 10, 155. [Google Scholar] [CrossRef]
- Putignano, C.; Reddyhoff, T.; Carbone, G.; Dini, D. Experimental Investigation of Viscoelastic Rolling Contacts: A Comparison with Theory. Tribol. Lett. 2013, 51, 105–113. [Google Scholar] [CrossRef]
- Putignano, C.; Reddyhoff, T.; Dini, D. The influence of temperature on viscoelastic friction properties. Tribol. Int. 2016, 100, 338–343. [Google Scholar] [CrossRef]
- Carbone, G.; Putignano, C. A novel methodology to predict sliding and rolling friction of viscoelastic materials: Theory and experiments. J. Mech. Phys. Solids 2013, 61, 1822–1834. [Google Scholar] [CrossRef]
- Schmid, F.; Paschold, C.; Lohner, T.; Stahl, K. Characteristics in hard conformal EHL line contacts. Issues Lang. Teach. (ILT) 2023, 75, 730–740. [Google Scholar] [CrossRef]
- Sadowski, P.; Stupkiewicz, S. Friction in lubricated soft-on-hard, hard-on-soft and soft-on-soft sliding contacts. Tribol. Int. 2019, 129, 246–256. [Google Scholar] [CrossRef]
- Quinn, C.; Nečas, D.; Šperka, P.; Marian, M.; Vrbka, M.; Křupka, I.; Hartl, M. Experimental investigation of friction in compliant contact: The effect of configuration, viscoelasticity and operating conditions. Tribol. Int. 2022, 165, 107340. [Google Scholar] [CrossRef]
- Schmid, F.; Maier, E.; Lohner, T.; Stahl, K. Friction in Oil-lubricated Rolling-Sliding Contacts with Technical Thermoplastics: 64. In Proceedings of the Tribologie-Fachtagung 2023, Reibung, Schmierung und Verschleiß, Göttingen, Germany, 25–27 September 2023. [Google Scholar]
- Hofmann, S.; Lohner, T.; Stahl, K. Influence of water content on elastohydrodynamic friction and film thickness of water-containing polyalkylene glycols. Front. Mech. Eng. 2023, 9, 1128447. [Google Scholar] [CrossRef]
- Jain, M.; Patil, S. A review on materials and performance characteristics of polymer gears. Proc. Inst. Mech. Eng. Part C J. Mech. Eng. Sci. 2023, 237, 2762–2790. [Google Scholar] [CrossRef]
- Zhong, B.; Song, H.; Liu, H.; Wei, P.; Lu, Z. Loading capacity of POM gear under oil lubrication. J. Adv. Mech. Des. Syst. Manuf. 2022, 16, JAMDSM0006. [Google Scholar] [CrossRef]
- Hriberšek, M.; Kulovec, S. Thermal and durability characterization of polyacetal and polyamide gear pairs. J. Mech. Sci. Technol. 2021, 35, 3389–3394. [Google Scholar] [CrossRef]
- Md Ghazali, W.; Daing Idris, D.M.N.; Sofian, A.H.; Siregar, J.P.; Abdul Aziz, I.A. A review on failure characteristics of polymer gear. MATEC Web Conf. 2017, 90, 1029. [Google Scholar] [CrossRef]
- Kalin, M.; Kupec, A. The dominant effect of temperature on the fatigue behaviour of polymer gears. Wear 2017, 376–377 Pt B, 1339–1346. [Google Scholar] [CrossRef]
- Lagier, F.; Freund, N.; Bause, K.; Ott, S.; Albers, A. Simulation-based evaluation of high-speed PEEK gears in automotive powertrains and design of a validation environment for high-speed gears. In Dritev, Proceedings of the 22nd International VDI Congress, Baden, Germany, 6–7 July 2022; VDI Verlag: Düsseldorf, Germany, 2022; pp. 223–240. ISBN 9783181024010. [Google Scholar]
- Zorko, D.; Kulovec, S.; Duhovnik, J.; Tavčar, J. Durability and design parameters of a Steel/PEEK gear pair. Mech. Mach. Theory 2019, 140, 825–846. [Google Scholar] [CrossRef]
- Hoskins, T.J.; Dearn, K.D.; Chen, Y.K.; Kukureka, S.N. The wear of PEEK in rolling–sliding contact—Simulation of polymer gear applications. Wear 2014, 309, 35–42. [Google Scholar] [CrossRef]
- VDI 2736 Blatt 1:2016-07; VDI-Richtlinie 2736—Blatt 1: Thermoplastische Zahnräder. Werkstoffe, Werkstoffauswahl, Herstellverfahren, Herstellgenauigkeit, Gestalten. Verein Deutscher Ingenieure: Düsseldorf, Germany, 2016.
- Koplin, C.; Oehler, H.; Praß, O.; Schlüter, B.; Alig, I.; Jaeger, R. Wear and the Transition from Static to Mixed Lubricated Friction of Sorption or Spreading Dominated Metal-Thermoplastic Contacts. Lubricants 2022, 10, 93. [Google Scholar] [CrossRef]
- Brandão, J.A.; Meheux, M.; Seabra, J.H.O.; Ville, F.; Castro, M.J.D. Traction curves and rheological parameters of fully formulated gear oils. Proc. Inst. Mech. Eng. Part J J. Eng. Tribol. 2011, 225, 577–593. [Google Scholar] [CrossRef]
- Heathcote, H.L., Ed.; The Ball Bearing: In the Making, Under Test and on Service. Proc. Inst. Automob. Eng. 1920, 15, 569–702. [Google Scholar]
- Yilmaz, M.; Mirza, M.; Lohner, T.; Stahl, K. Superlubricity in EHL Contacts with Water-Containing Gear Fluids. Lubricants 2019, 7, 46. [Google Scholar] [CrossRef]
- Chang, L. A deterministic model for line-contact partial elastohydrodynamic lubrication. Tribol. Int. 1995, 28, 75–84. [Google Scholar] [CrossRef]
- Hultqvist, T. Transient Elastohydrodynamic Lubrication: Effects of Geometry, Surface Roughness, Temperature, and Plastic Deformation; Luleå University of Technology: Luleå, Sweden, 2020; ISBN 978-91-7790-604-9. [Google Scholar]
- Lates, M.T.; Velicu, R.; Gavrila, C.C. Temperature, Pressure, and Velocity Influence on the Tribological Properties of PA66 and PA46 Polyamides. Materials 2019, 12, 3452. [Google Scholar] [CrossRef]
- Jaeger, R.; Koplin, C.; Schluter, B. Lubricated polymer-steel-systems: Influence of the surface and interfacial energies of frictional partners on their tribological performance. In International Conference on Gears 2022; VDI Verlag: Düsseldorf, Germany, 2022; pp. 1223–1236. ISBN 9783181023891. [Google Scholar]

Disclaimer/Publisher’s Note: The statements, opinions and data contained in all publications are solely those of the individual author(s) and contributor(s) and not of MDPI and/or the editor(s). MDPI and/or the editor(s) disclaim responsibility for any injury to people or property resulting from any ideas, methods, instructions or products referred to in the content. |
© 2024 by the authors. Licensee MDPI, Basel, Switzerland. This article is an open access article distributed under the terms and conditions of the Creative Commons Attribution (CC BY) license (https://creativecommons.org/licenses/by/4.0/).