Article

Fault Diagnosis of Dry Gas Seal Operation Status Based on Acoustic Emission Monitoring

1
School of Petrochemical Engineering, Lanzhou University of Technology, Lanzhou 730050, China
2
Ningbo Key Laboratory of Advanced Seal Technology, NingboTech University, Ningbo 315010, China
*
Author to whom correspondence should be addressed.
Lubricants 2024, 12(2), 35; https://doi.org/10.3390/lubricants12020035
Submission received: 1 November 2023 / Revised: 13 January 2024 / Accepted: 24 January 2024 / Published: 26 January 2024
(This article belongs to the Special Issue Gas Lubrication and Dry Gas Seal)

Abstract

:
A dedicated test bench is employed to record acoustic emission signals from dry gas seals under various operating conditions. Time-domain and frequency-domain analysis methods are utilized to process and analyze the acoustic emission signals during start/stop, stable operation, and two common fault states (end-face defects and compensation spring failure). Furthermore, feature recognition research is conducted. A method for identifying the operational states of seals (low-speed friction, gradual detachment, stable operation) based on the root mean square (RMS) was established, with transition points at speeds of 100 and 1000 RPM, respectively. Additionally, spectral analysis is conducted using Fourier transform to determine the frequency band of acoustic emission signals (240–320 kHz) generated during contact wear of dry gas seals. Investigation into two typical faults of dry gas seals reveals that the RMS value of the acoustic emission signal gradually increases with the rotational speed during the operation of dry gas seal end-face defects. This is attributed to the insufficient dynamic pressure effect on the end face, resulting in long-term wear and tear. When the dry gas seal compensates for spring failure, the RMS value of the acoustic emission signal initially increases, then decreases, and finally increases again as the speed increases. It reaches the stable operating inflection point when the end-face speed is 800 r/min.

1. Introduction

Dry gas seals find extensive use in high-speed rotating equipment across various industries such as petroleum, chemical, pharmaceutical, food, metallurgy, and energy, owing to their low leakage and wear characteristics [1]. However, in practical applications, dry gas seals often encounter challenges in fault diagnosis and sudden failures [2]. To effectively address these issues and develop intelligent monitoring and fault diagnosis of dry gas seals, extensive research has been conducted, utilizing methods such as vibration analysis [3,4,5], eddy current [6,7], and ultrasonic testing [8] to monitor and diagnose the operational status of dry gas seals.
Acoustic emission (AE) testing, as an online nondestructive monitoring technology, has demonstrated high sensitivity to the tribological behavior of rotating machinery, including turbines [9,10,11], bearings [12,13,14,15], and dry gas seals [16,17]. Because AE sensors detect the actual mechanism of acoustic emission sources, AE technology is highly favored in the field of state monitoring and fault diagnosis of rotating machinery [18,19,20]. For instance, Huang’s team [21,22,23] studied AE signals during the start and stop stages of dry gas seals, analyzed AE signal characteristics during seal end-face contact, and found that AE technology can detect early failures of dry gas seals. Li et al. [24,25] used AE technology to measure the thickness of the end facial mask of the dry gas seal, studied the change in AE energy during seal startup, and demonstrated the effectiveness of AE technology in nondestructive detection of the end state of dry gas seals. Yin et al. [26] extracted AE features from time-domain waveforms and spectrum analysis of acoustic emission, demonstrating that AE signals can be used for condition monitoring and fault diagnosis of dry gas seals. Wang et al. [27] identified a strong relationship between the root mean square (RMS) value of acoustic emission signals, which serves as an indicator of acoustic emission energy strength, and various effects of acoustic emission source mechanisms in sliding contact. Towsyfyan et al. [28] developed a mathematical model based on the relationship between the RMS value of acoustic emission signals and friction coefficient, sliding velocity, and contact load, enabling the prediction of acoustic emission signal energy under different tribological states. These studies confirm that AE technology is highly sensitive to the contact of dry gas seal end faces and can effectively monitor abnormal end-face contact. However, the application of this technology in the fault diagnosis of dry gas seals has not yet been reported, and comprehensive fault detection for specific scenarios remains limited. Research on AE signal monitoring of different fault operating states of dry gas seals is still lacking, and the monitoring and fault diagnosis of dry gas seals lack substantial support from extensive seal operating state data.
Building upon the aforementioned research, this article establishes a dedicated dry gas seal test bench and utilizes high-frequency, highly sensitive acoustic emission instruments to record AE signals under various operating conditions and typical fault conditions of dry gas seals. It conducts comprehensive time-domain, frequency-domain, and time–frequency domain analyses of AE signals to extract AE features. The article investigates the correlation between the RMS of dry gas seal acoustic emission signals and the sliding contact of the sealing end face under different operating conditions. It evaluates the operating status of dry gas seals through acoustic emission measurements.

2. Dry Gas Sealing Test Bench and Measurement Method

2.1. Dry Gas Seal Signal Testing System

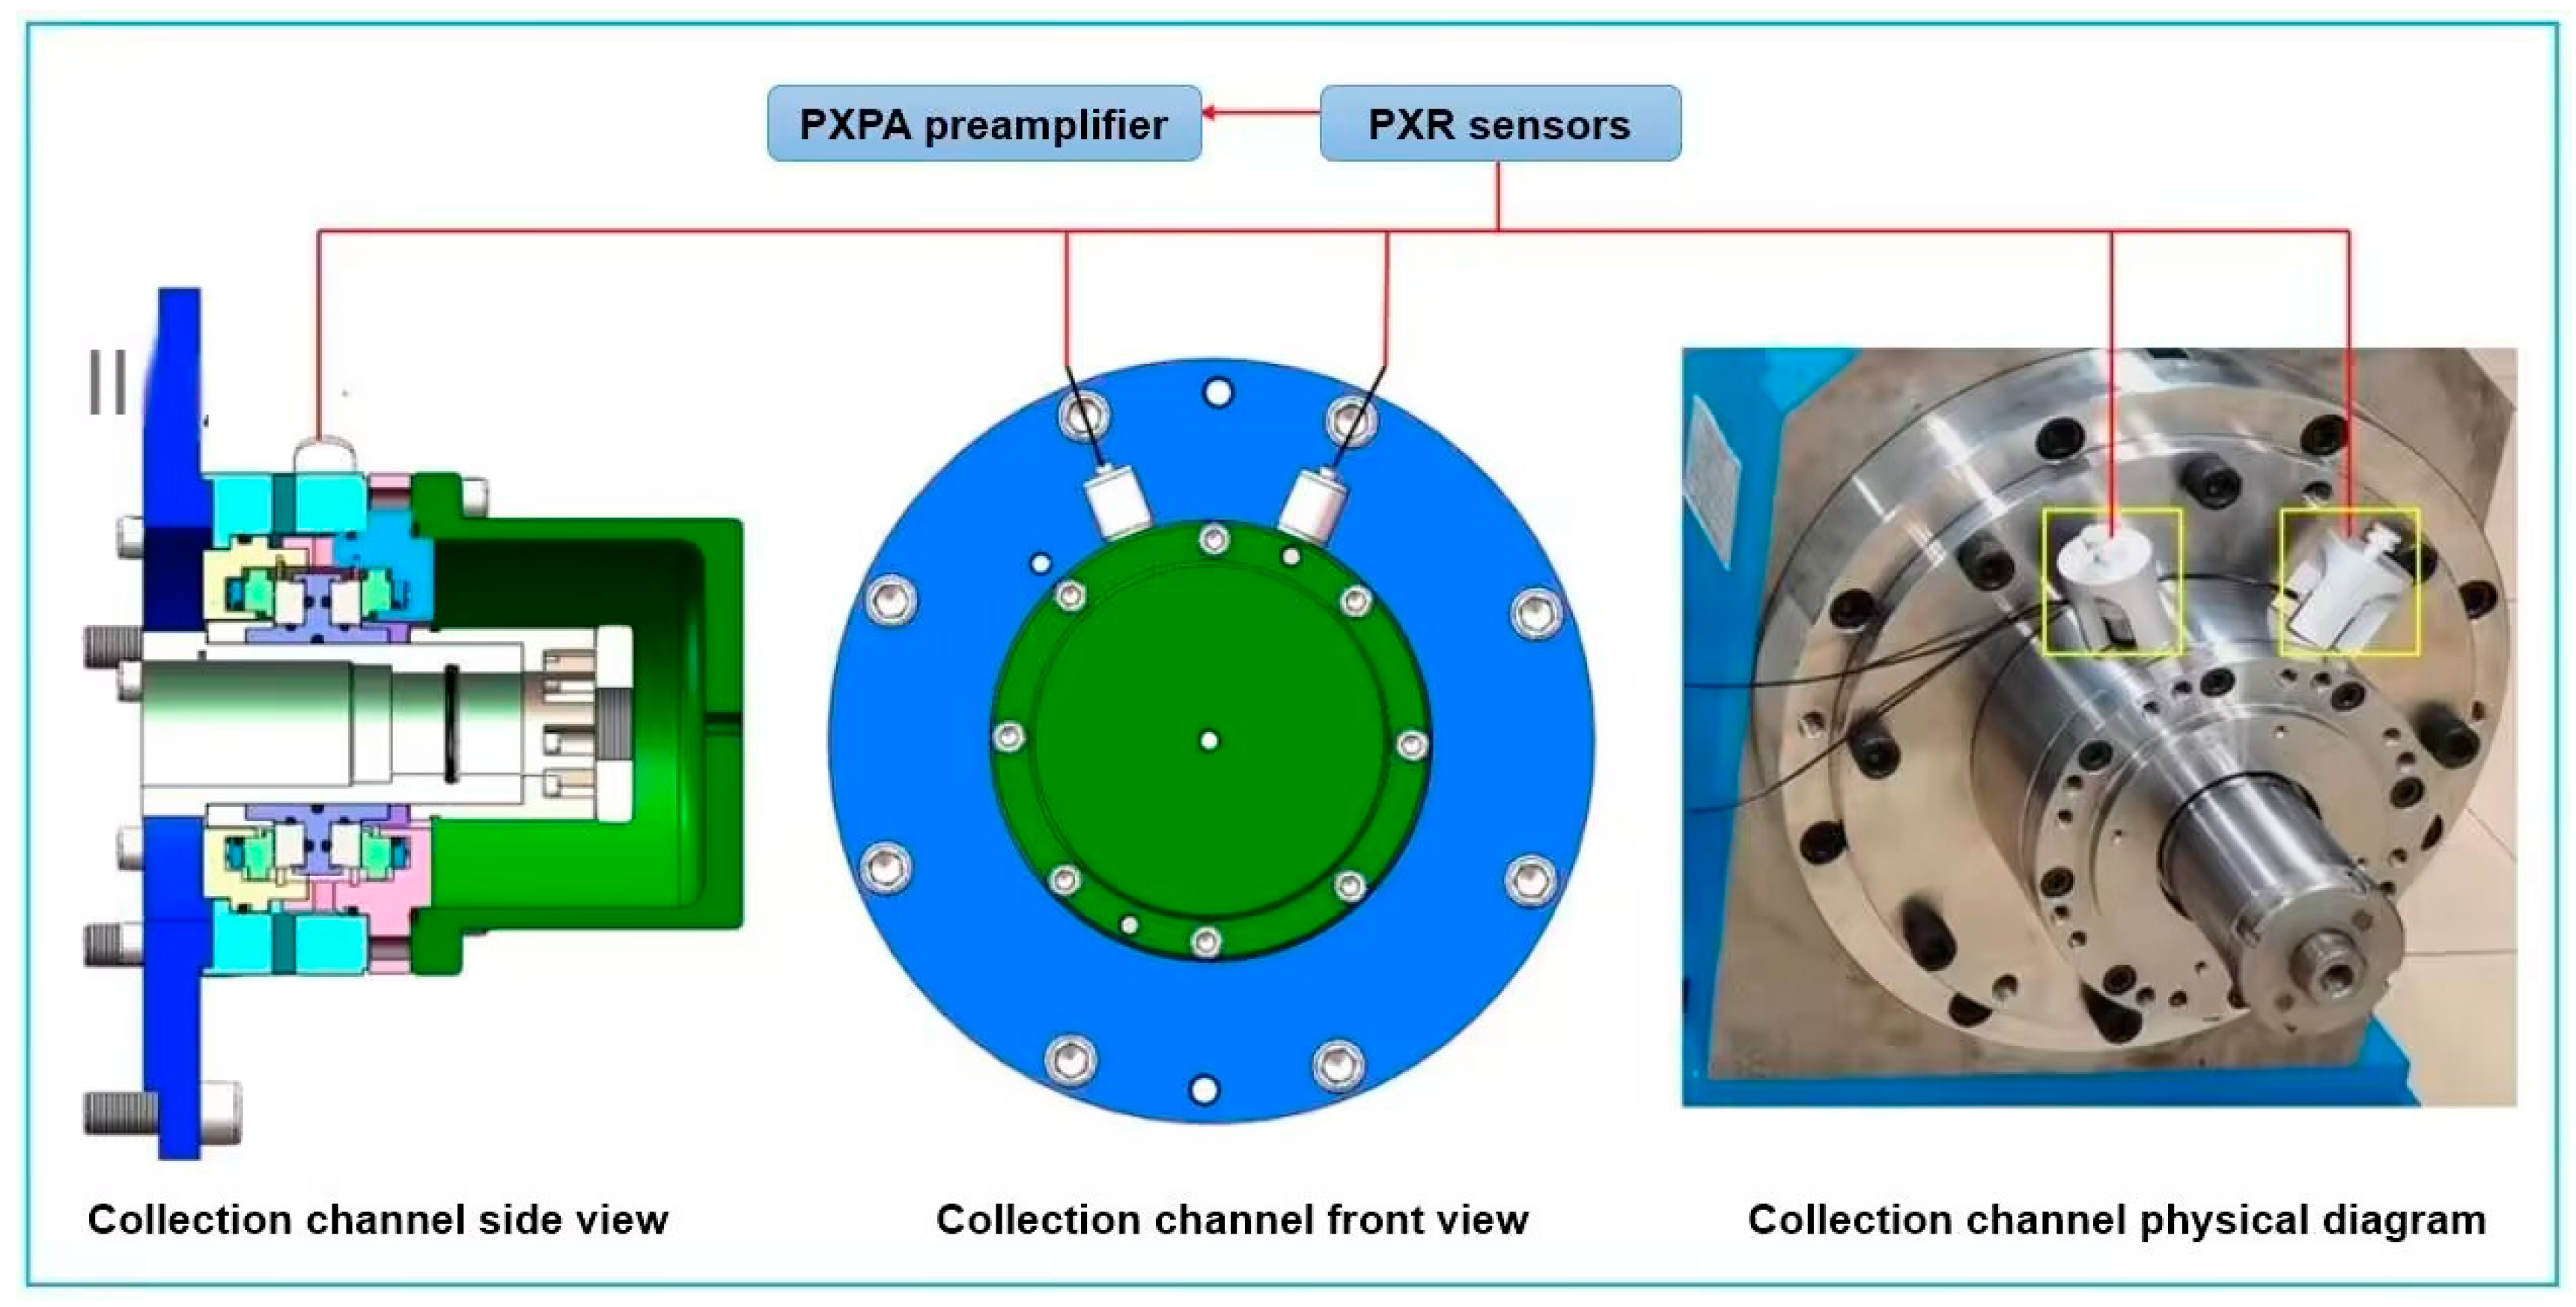
This experiment designs a dry gas seal AE signal monitoring test system using air as the medium. The experimental system, shown in Figure 1, installs a dual-face dry gas seal prototype at the high-torque, low-speed shaft end and employs high-frequency wide-domain and highly sensitive acoustic emission technology to monitor the AE signal of the dry gas seal. The test system comprises five components: the transmission system, gas supply system, control system, sealing system, and testing system. AE acquisition system crucial components: acoustic emission sensor, low noise signal line, preamplifier: coaxial cable, high precision full information. The sealing system employs a double-end dry gas seal, shaft diameter is 63 mm, rotational speed range: 0–3000 rpm, pressure range: 0–3 MPa, with the stationary ring and sealing gland (flange plate) of the sealing specimen fixed on the outer shell of the sealing chamber. The rotating ring is installed on the main shaft, with compensation force provided by a spring. The dynamic ring is made of silicon carbide (SiC), while the static ring is made of graphite. This experimental system enables real-time acquisition and data storage of AE signals under different dry gas sealing operating conditions. The names and models of the primary components used in the test system are detailed in Table 1.
The pressure range of the experiment is 0–2.0 MPa, and the test speed ranges from 0 to 2000 r/min. During this examination, the highest frequency reached was 500 kHz. To fulfill the requirements of the experiment, we selected a sensor possessing a sampling rate of 1250 kHz. This sample rate not only complied with the principles of Nyquist’s sampling law but also encompassed our desired operating frequency spectrum. Air is pressurized by the compressor, and the pressure of the seal chamber is controlled by the air circuit control system. The testing system in this experiment employs an online nondestructive monitoring method, eliminating the need to damage the dry gas sealing structure. The acoustic emission sensor probe is directly installed on the sealing element shell using a fixture to achieve online monitoring of the dry gas sealing AE signal.

2.2. Acoustic Emission Layout Method

The acoustic emission channel adopts a dual-channel layout at a 45-degree angle, as depicted in Figure 2. Due to the dual-end-face structure of the sealing element, the two AE sensor probes are arranged in a staggered manner to test the AE signals of different end faces, thus more accurately capturing the contact status of different end faces. This arrangement allows the AE testing probe to be as close as possible to the tested sealing ring, improving testing accuracy and reducing signal attenuation.

2.3. Test Implementation Plan and Process

Before starting the experiment, ensure that the acoustic emission sensor is functioning properly. Maintain a quiet laboratory environment and use the sampling threshold as the triggering signal condition. Record and analyze the level of ambient noise. Then, adjust the sampling threshold value in the acoustic emission data collection parameters to eliminate environmental noise, allowing the sensor to capture impact-driven signals and avoid collecting invalid data, ultimately enhancing the quality of signal data. The final set sampling threshold value for this experiment is 35 dB.
As shown in Table 2, the dry gas seal acoustic emission test was conducted at a pressure of 0.1 MPa, within a speed range of 0–2000 r/min. The test included seal normal operation testing, with a spiral groove selected for the sealing ring groove type. To eliminate interference from other factors, a comparison was made between unsealed idle and manual rotation tests. The unsealed test involved removing the rotating and stationary rings of the sealing component and installing the remaining parts into the outer cavity of the seal for operation. At this point, the acoustic emission signal primarily originated from the bearing.
The specific test process is divided into three parts: an unsealed test operation, a turning test, and a motor rotation test. Firstly, an unsealed running test is conducted by removing the seals, testing the AE signal of the motor during idle operation, and recording the test data. Following that, a turning test is performed, where the sealing sample is assembled and subjected to a turning test. Finally, a motor rotation test is conducted by starting the motor, adjusting the speed through a variable frequency controller, controlling the gas valve to adjust the sealing chamber pressure, and testing the AE signal during variable-speed operation under a dry gas seal at 0.1 MPa.

3. Analysis of AE Signal Detection Test Results

3.1. AE Signal Waveform and Spectrum Analysis

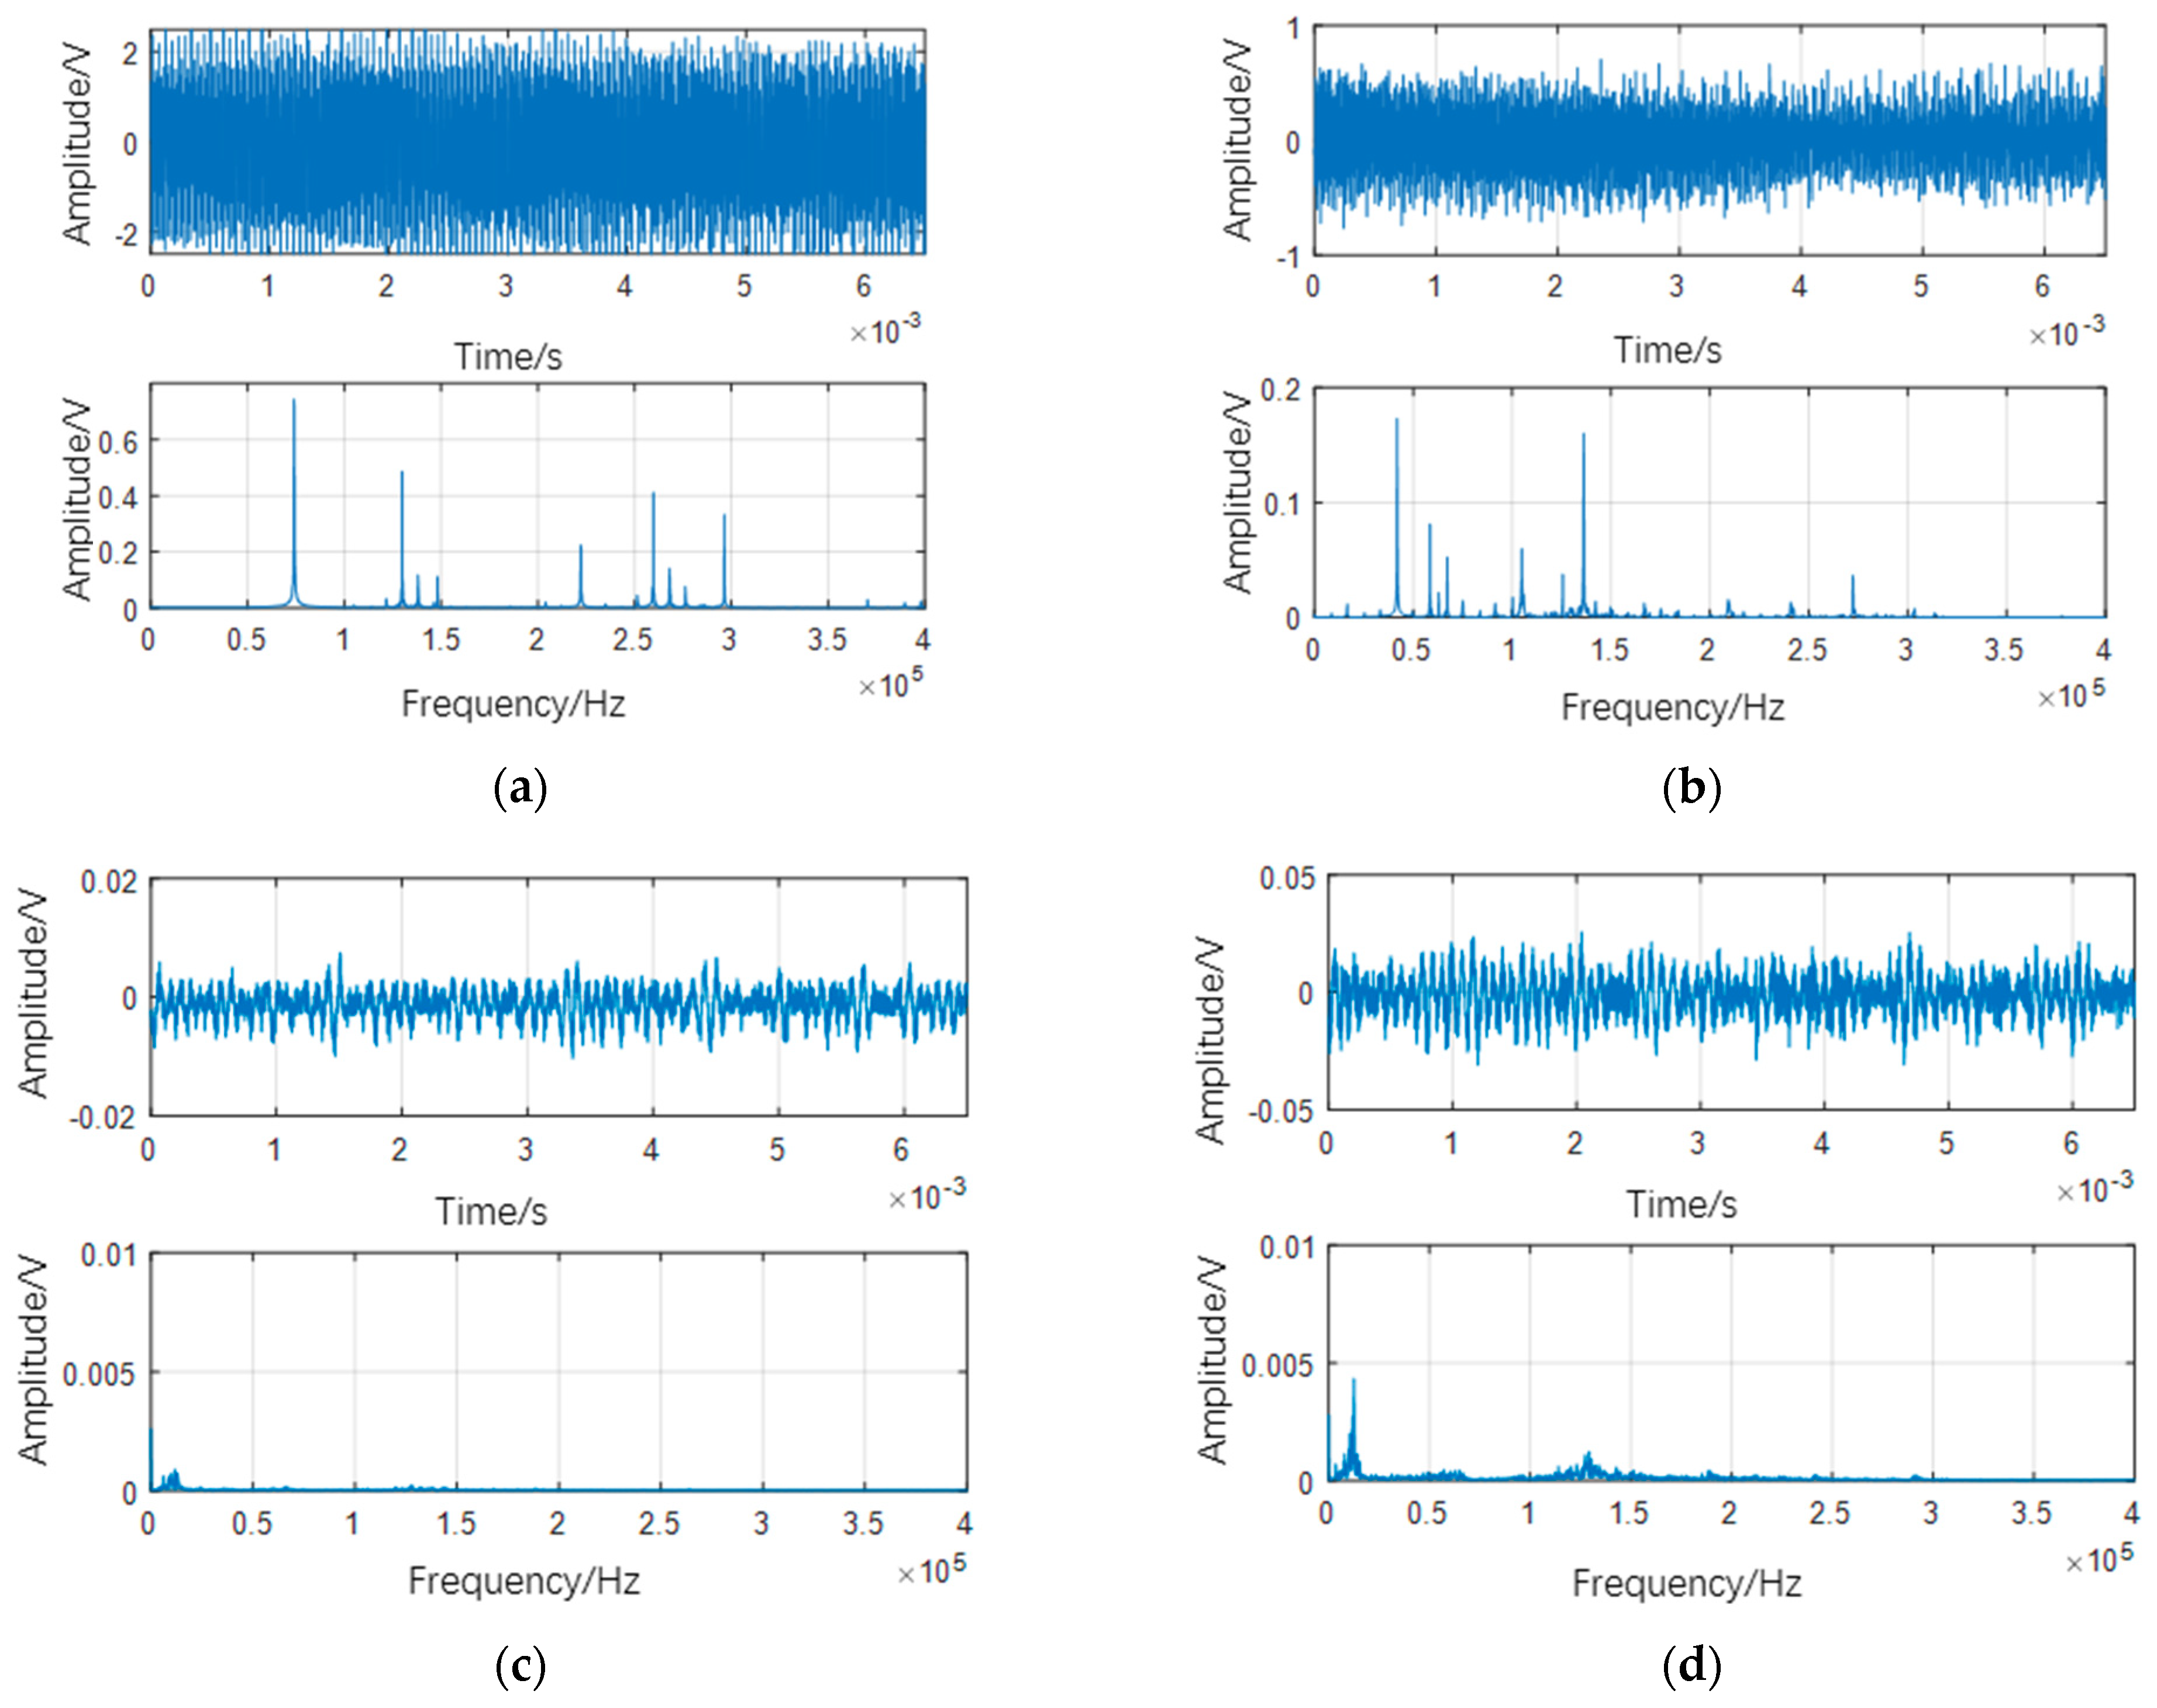
Figure 3 displays the AE signal waveform and spectrum of the dry gas seal at a constant pressure of 0.1 MPa and speeds of 100 r/min, 600 r/min, 1000 r/min, and 2000 r/min. From Figure 3a, it is evident that the highest amplitude of the original waveform is approximately 2 V when the sealing speed is 100 r/min, with the highest frequency in the spectrum reaching around 300 kHz. At a speed of 600 r/min, the amplitude of the original signal waveform is less than 1 V, and the highest frequency band in the spectrum ranges between 250 kHz and 300 kHz. As the sealing speed exceeds 1000 r/min, Figure 3c,d indicate that the waveform drops below 0.1, and the signal frequency band falls below 200 kHz. Notably, the AE signal waveform in Figure 3d exhibits a slight elevation compared to Figure 3c.
Analyzing the cause, Figure 3a displays the AE signal waveform spectrum of the dry gas seal at 100 r/min. Both the waveform and frequency are notably high at this speed, indicating relatively high AE signal energy. The reason behind this phenomenon is that the lower rotational speed results in an insufficient fluid dynamic pressure effect [29]. Consequently, the sealing end face has not fully separated, leading to substantial friction between the sealing dynamic and static ring end faces, thus generating strong signals. As the speed continues to increase, Figure 3b illustrates that both the AE signal waveform and frequency amplitude decrease, although they remain high. At this point, the sealing rotating and stationary ring end faces are in a partially detached state. It is only when the speed reaches 1000 r/min, as shown in Figure 3c,d, that the waveform and frequency amplitude become extremely small. This indicates an absence of rubbing on the sealing ring end face, with the rotating and stationary ring end faces completely detached, signifying stable sealing operation.

3.2. Identification of AE Signal for Sealing Face Friction

The energy range and frequency band of the acoustic emission waveform in the sealed contact state were initially determined from the original waveform and spectrum. To further validate the frequency band during dry gas seal friction, comparative verification was conducted during idle tests. During the idling process of the dry gas seal, the AE signal collects a mixture of rotor, bearing, seal, and other background noise.
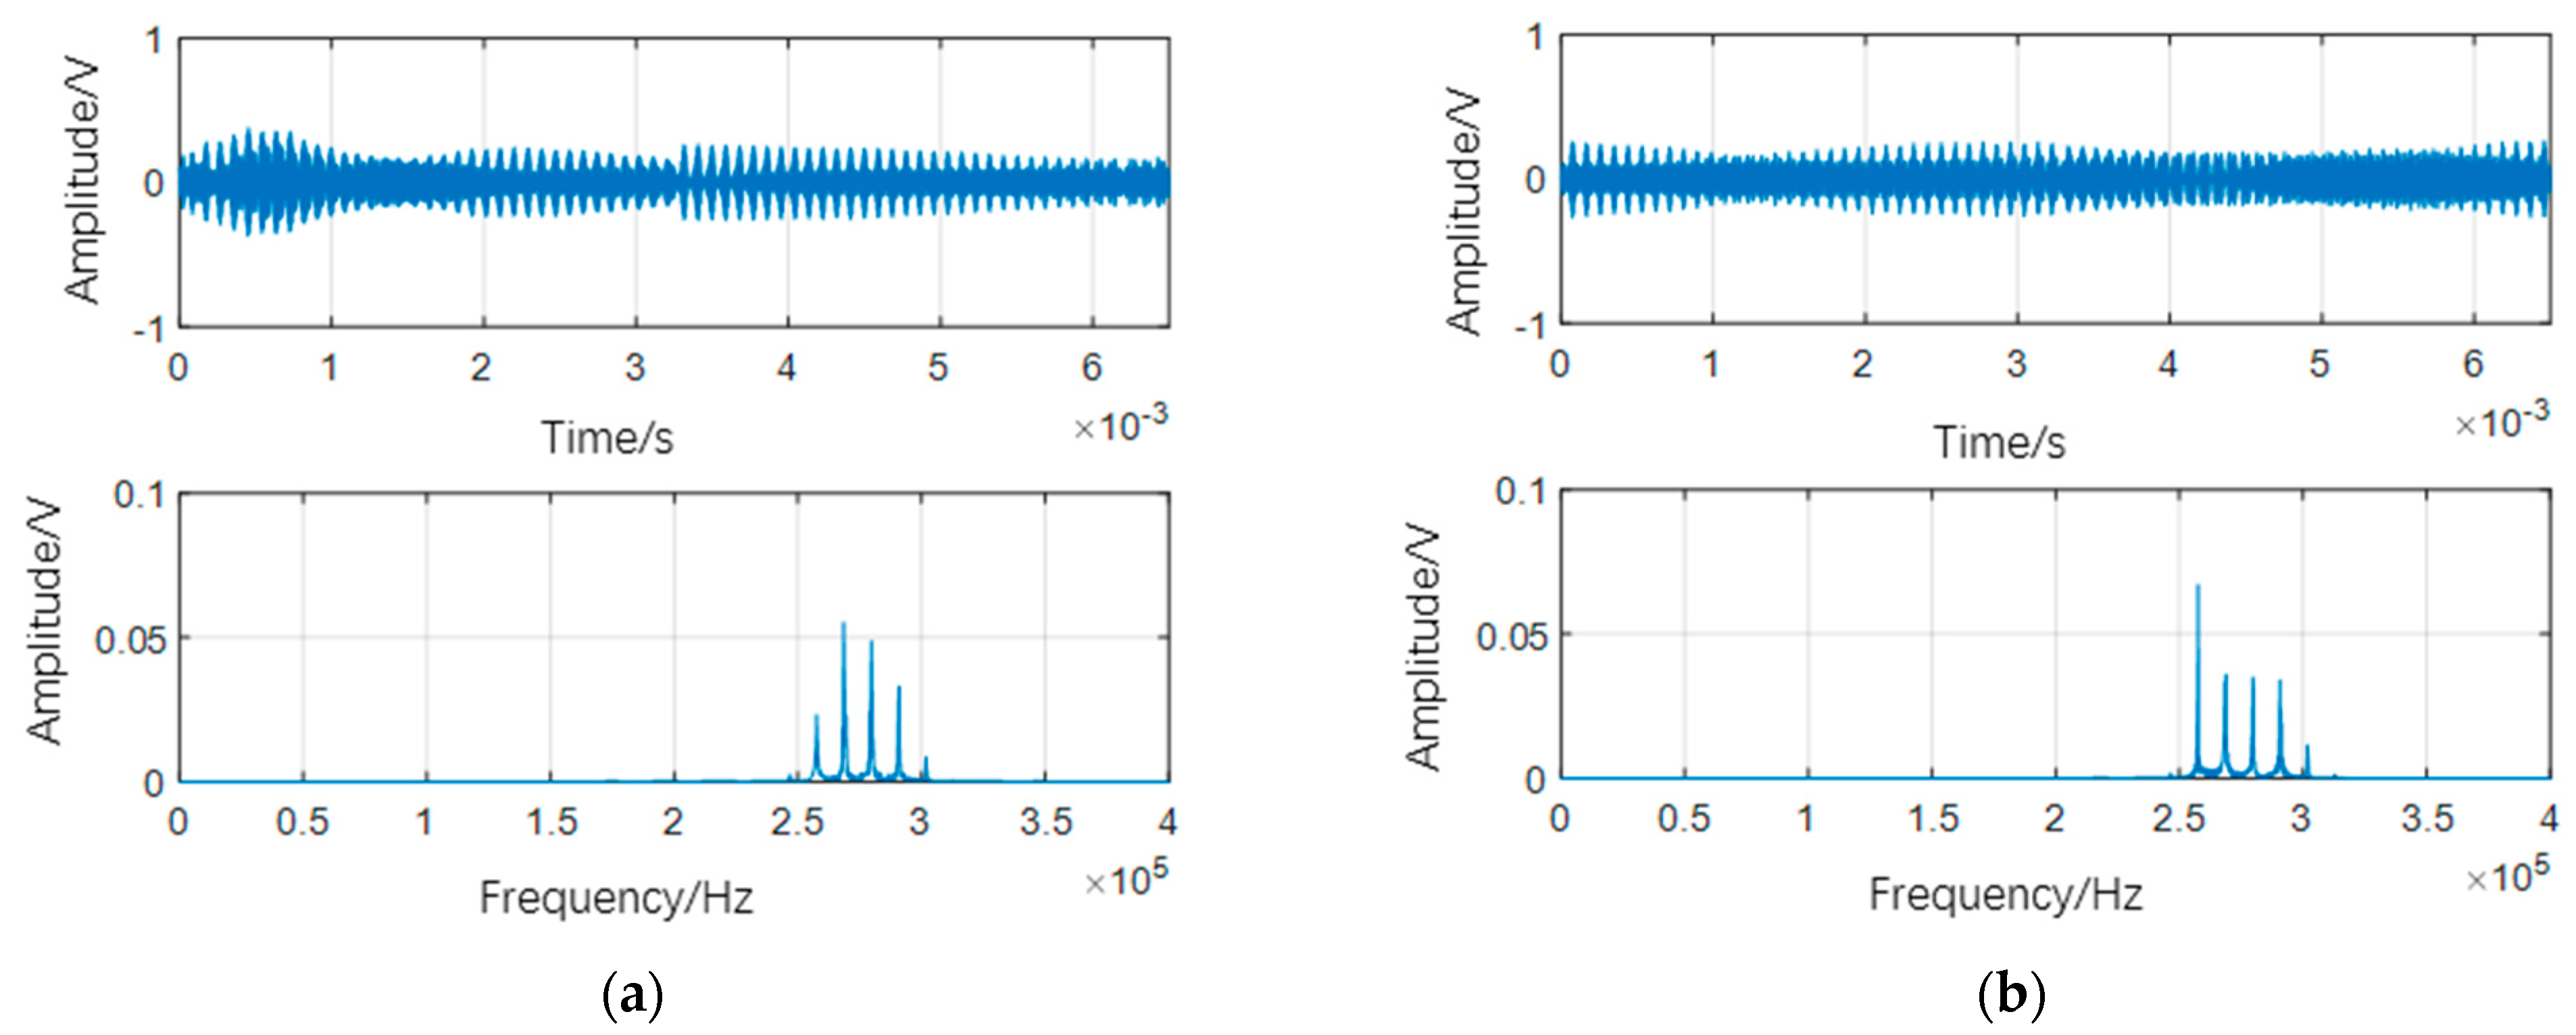
Figure 4a shows that during unsealed operation, AE energy primarily concentrates below 200 kHz. Conversely, Figure 4b reveals that the dry gas seal operates normally. Spectrum analysis indicates that, in addition to the low-frequency AE signal observed in the unsealed test, there are high-frequency signal bands exceeding 200 kHz. Consequently, it can be inferred that the operation of the dry gas seal, including contact and wear of the end face, generates high-frequency signals. Furthermore, the overall waveform amplitude in Figure 4b is significantly higher than in Figure 4a. This is attributed to the fact that the seal end faces remained in contact, resulting in intense end-face friction and, consequently, the generation of much stronger AE signals. Through a comparison of AE signal data at other sealing speeds, we conclude that the seal-end-face contact indeed generates high-frequency AE signals within a frequency range of 240–320 kHz.
Therefore, we developed a bandpass filter utilizing MATLAB software (R2022a), configured as shown in Table 3. This filter serves to eliminate extraneous data through filtration while preserving the critical waveform and frequency components necessary for illustrating the tribological behavior of the sealing process. Our determination of the frequency range of 240–320 kHz as being associated with the frictional AE signal generated by the contact of end faces during the operation of dry gas seals guided our decision to selectively retain the information within this specific frequency band.
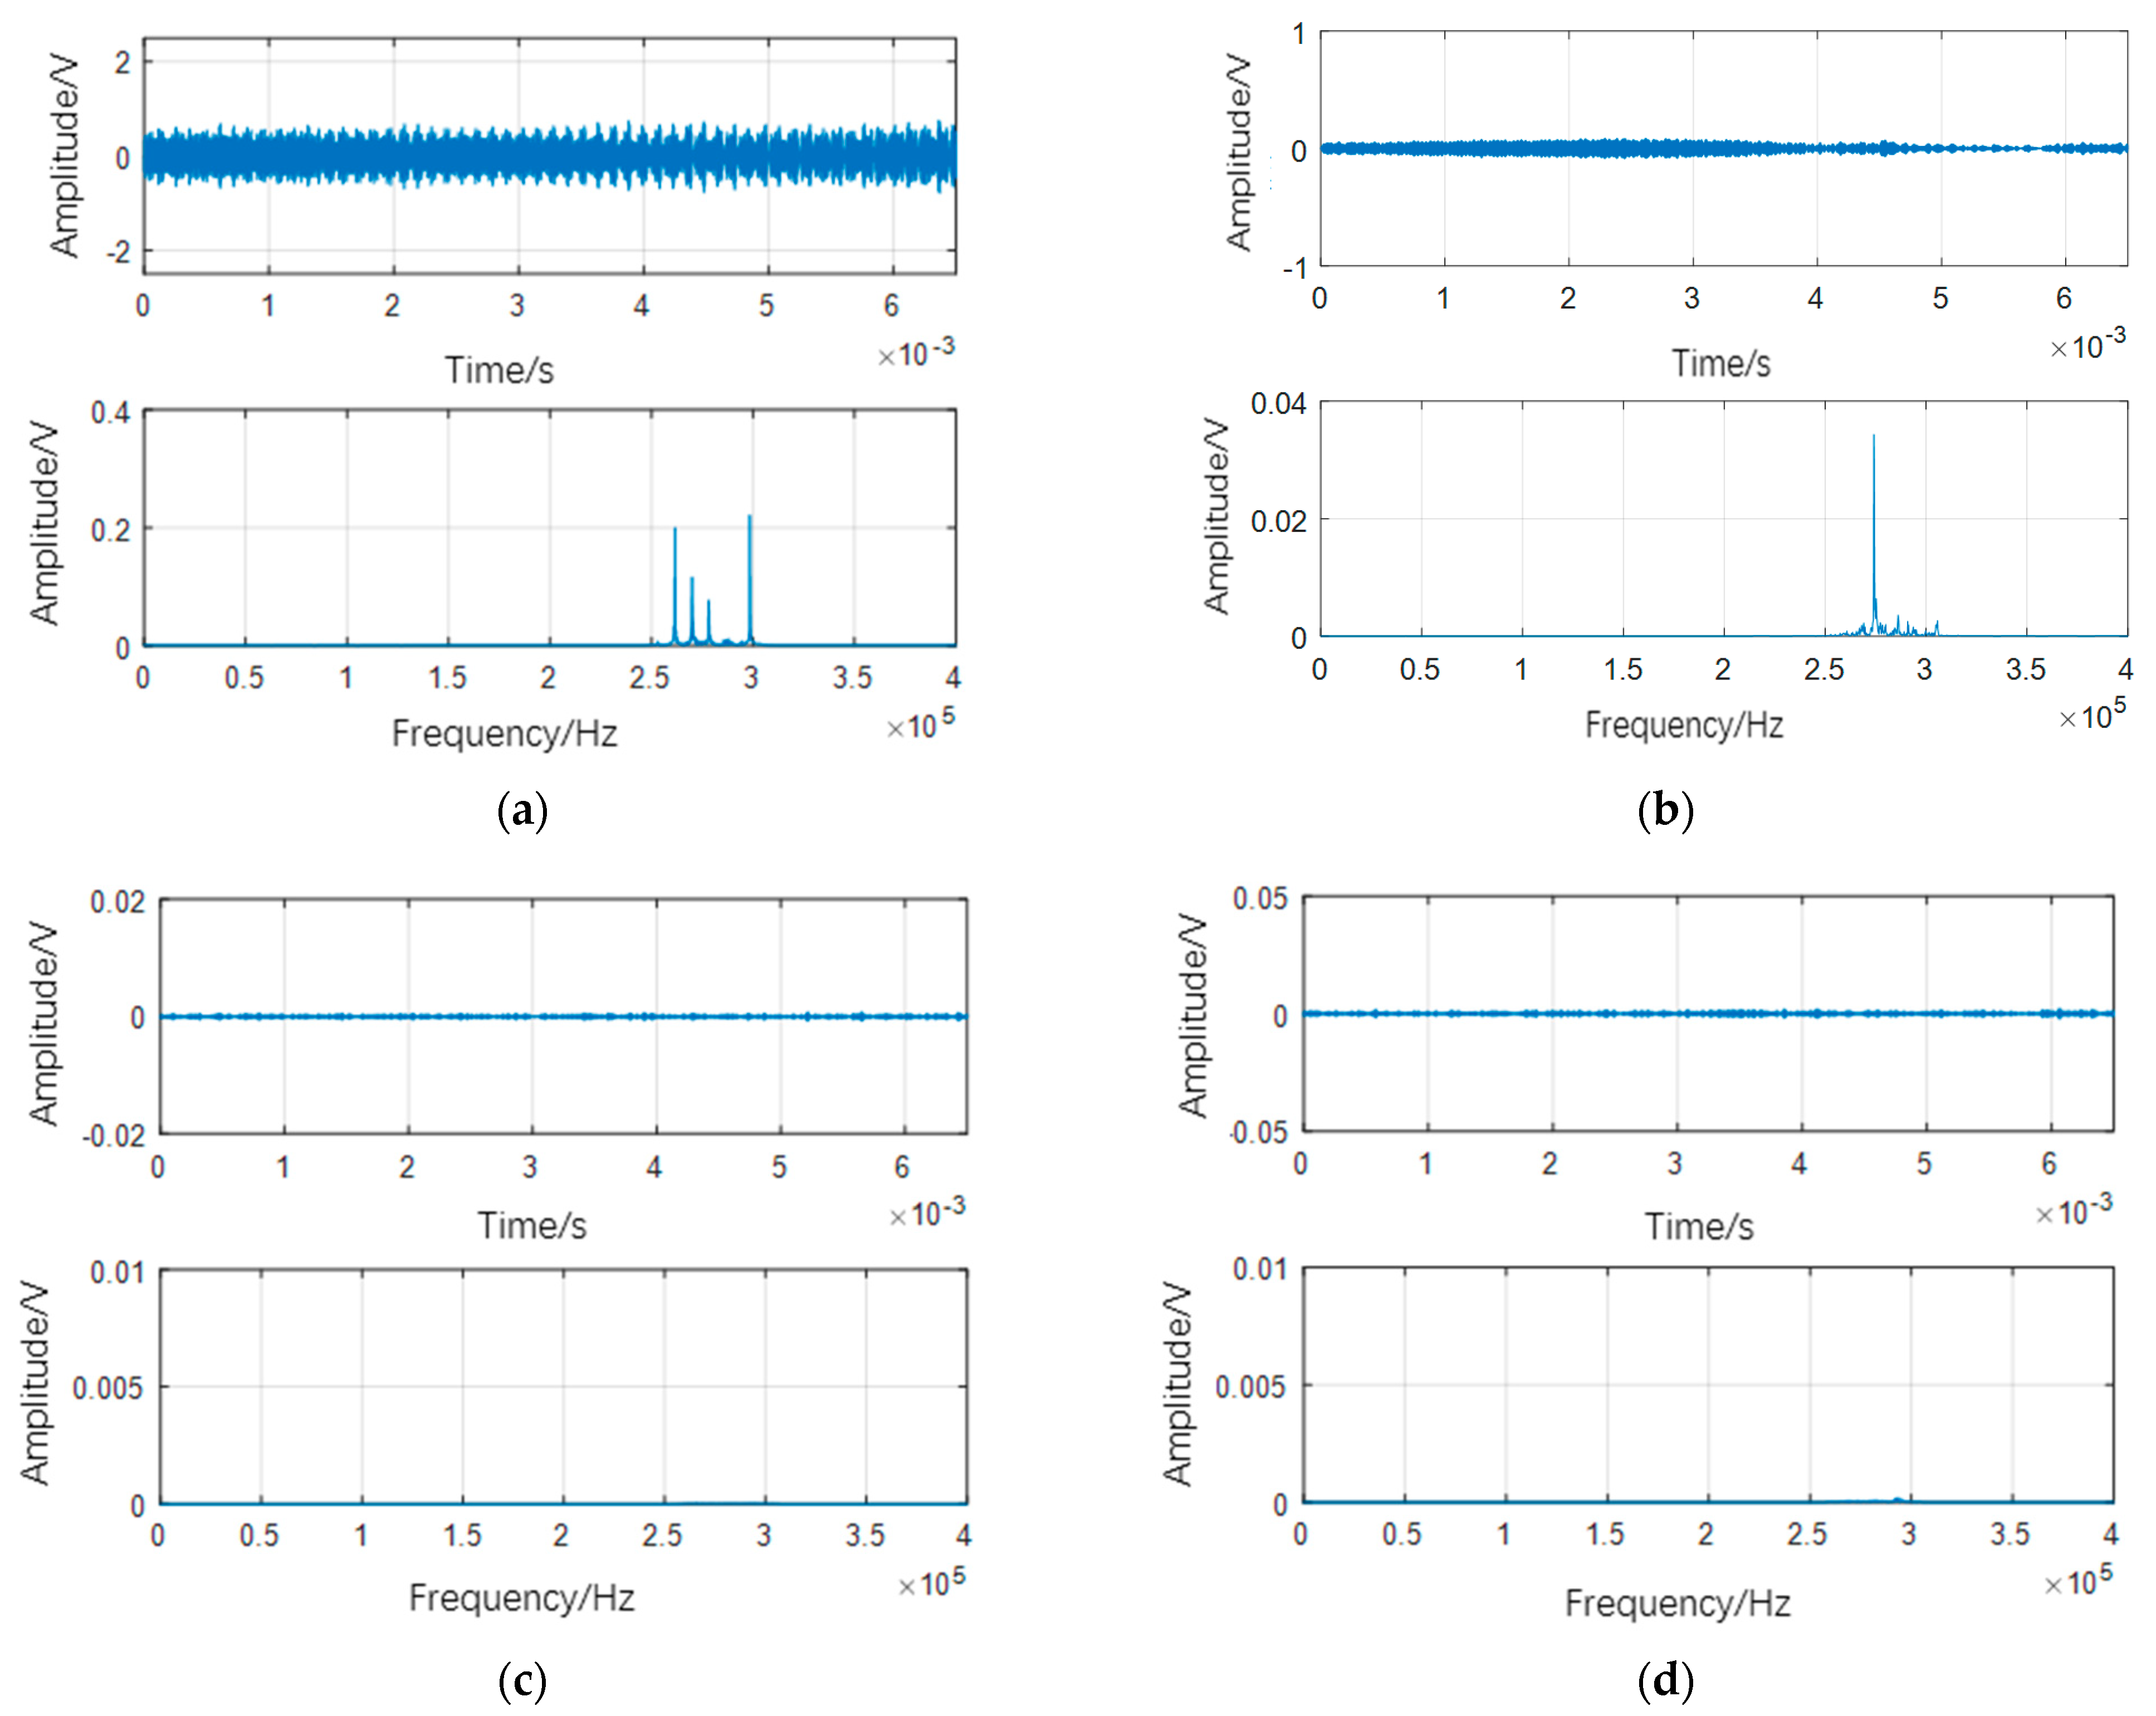
Since the frequencies relevant to the tribological behavior of seals fall within the range of 240–320 kHz, Figure 5a–d depict the filtered AE signal waveform and spectrum analysis specifically within the frequency range of 240–320 kHz. In Figure 5a, the filtered frequencies are primarily concentrated between 270 and 320 Hz, with the highest waveform amplitude exceeding 0.5 V. Figure 5b shows a smaller filtered AE waveform, approximately 0.1 V. However, the waveform and frequency amplitude obtained after filtering in Figure 5c,d are extremely small, suggesting an absence of effective AE signals within the frequency range of 240–320 kHz in this state. This is because, at low speeds, the seal end face has not fully separated, resulting in frictional behavior and the generation of high-frequency (240–320 kHz) AE signals. However, under medium and high-speed operation conditions exceeding 1000 r/min, the sealing end face operates in a state of fluid power lubrication, resulting in stable dry gas seal operation with fully separated end faces. Consequently, the signal amplitude is low, and there are no high-frequency AE signals.

3.3. Dry Gas Seal Face Contact Identification

The energy of acoustic emission can be expressed in terms of counting rate and root mean square (RMS). The counting rate is susceptible to various factors, including sample geometry, sensor characteristics, connection methods, and threshold voltage, especially for continuous acoustic emission signals. Furthermore, research indicates a strong relationship between the root mean square (RMS) values of acoustic emission signals and the multifaceted interactions of acoustic emission source mechanisms in sliding contacts. Therefore, RMS analysis was adopted for unfiltered continuous acoustic emission signals in this study [21,30].
R M S = 1 Δ T 0 Δ T V 2 ( τ ) d τ
In the formula: ΔT is the time constant, and V(τ) is the voltage of the signal.
To investigate the relationship between acoustic emission energy and the contact state of the dry gas seal end face, we utilized the root mean square of the signal as a substitute for acoustic emission energy. Figure 6 illustrates the corresponding relationship between the acoustic emission root mean square (RMS) and rotational speed under normal operation and idle states of the dry gas seal. From the figure, three trends in the root mean square of the signal become apparent as speed changes during normal operation at a pressure of 0.1 MPa. Firstly, at speeds below 100 r/min, the root mean square of the acoustic emission signal increases with speed. However, during the speed range of 100 r/min to 1000 r/min, the root mean square of the signal decreases with increasing speed. Beyond 1000 r/min, the root mean square begins to rise with speed, following a pattern consistent with the idle state. During idle testing without a seal, the root mean square of the AE signal consistently increases with speed.
The observed results can be attributed to the acoustic emission AE source mechanism. The RMS value of the AE signal significantly increases at the lowest speed due to insufficient dynamic pressure provided by the spiral groove on the dry gas seal end face. At low speeds, concave–convex collisions occur on the seal end face due to spring compensation force, leading to dry friction dominance. In this context, AE energy is more significantly influenced by sliding velocity, resulting in a linear increase in the root mean square of the acoustic emission signal with sliding velocity. As the speed increases to the highest point on the curve, the RMS value decreases due to improved lubrication conditions. With gradually increasing speed, there is a transition from dry friction to the gradual detachment of the sealing rotating and stationary ring end faces. Beyond 1000 r/min, the sealing end face completely disengages, making the RMS value of the dry gas seal similar to the value during idle, with a consistent trend. The RMS value increases again with the increase in speed.

4. Analysis of AE Signal of Typical Seal Fault State

4.1. Typical Fault Sources and Setting Methods for Sealing

The aforementioned primarily examines and investigates the non-fault sealing acoustic emission signals, while the subsequent analysis will entail a comparative study of both fault and non-fault signals. End-face defects are among the most common types of typical seal failures in dry gas seals. Abnormal seal operation can result in pits and scratches on the sealing rotating and stationary ring end faces. In practical engineering applications, dry gas seals often operate in extreme environments characterized by high temperatures and pressures. Under such complex working conditions, the end face of dry gas seals may suffer damage due to abrasion, corrosion, or thermal cracks.
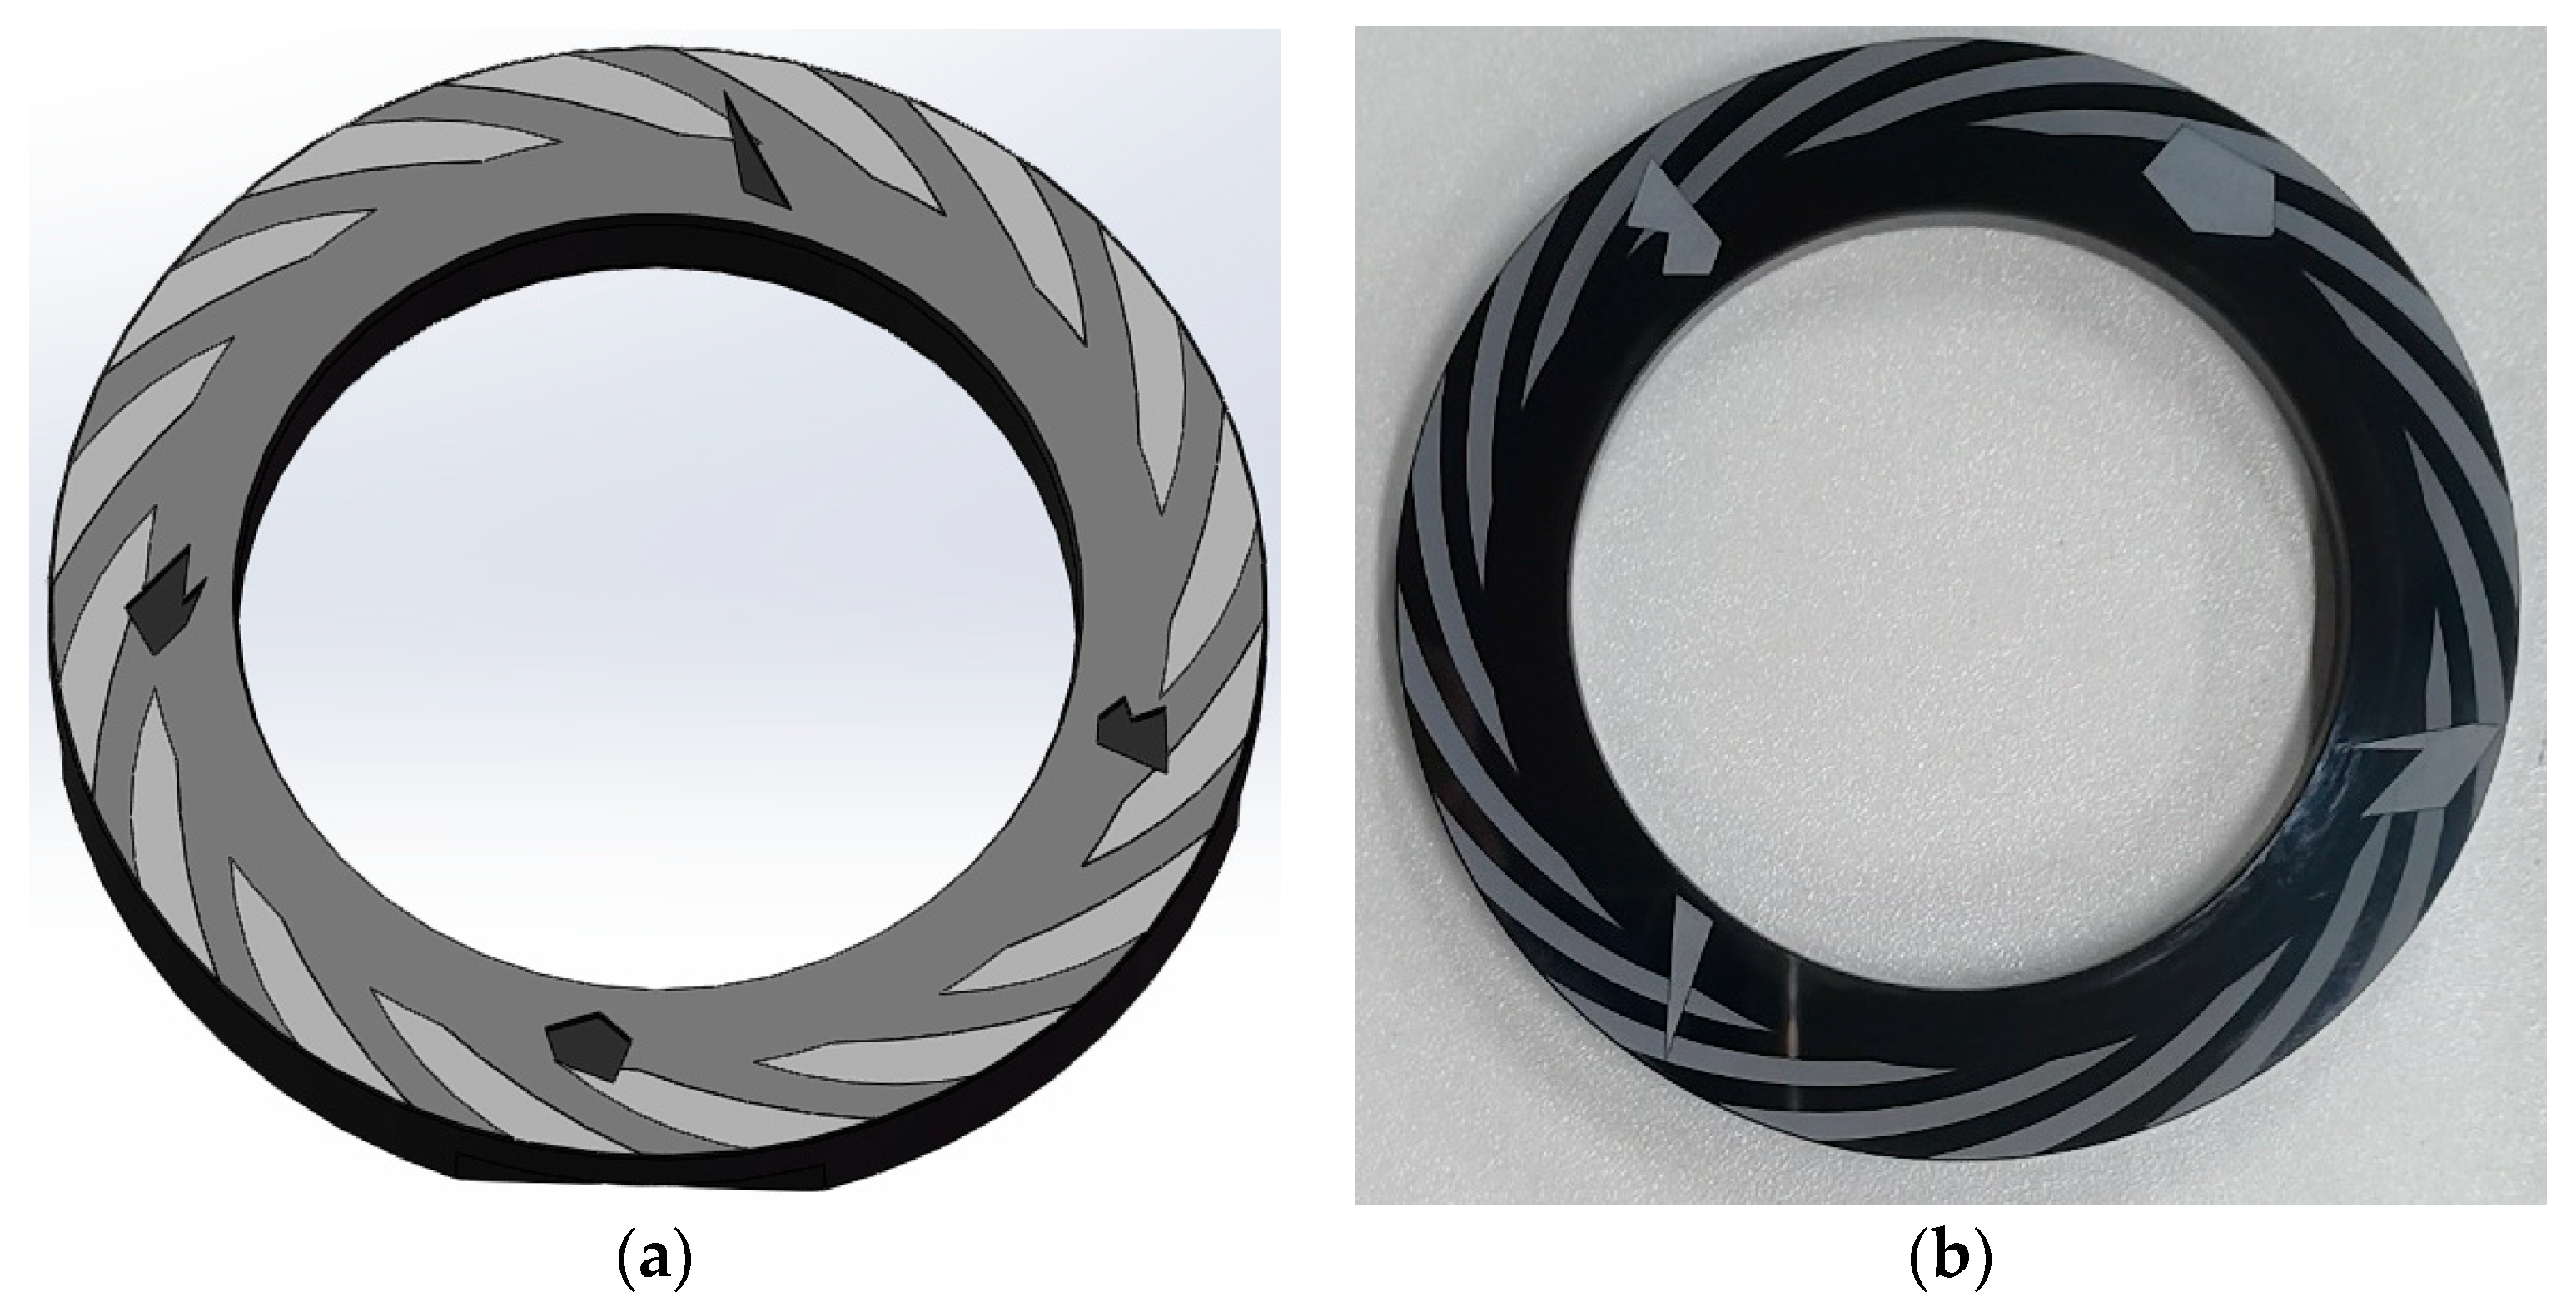
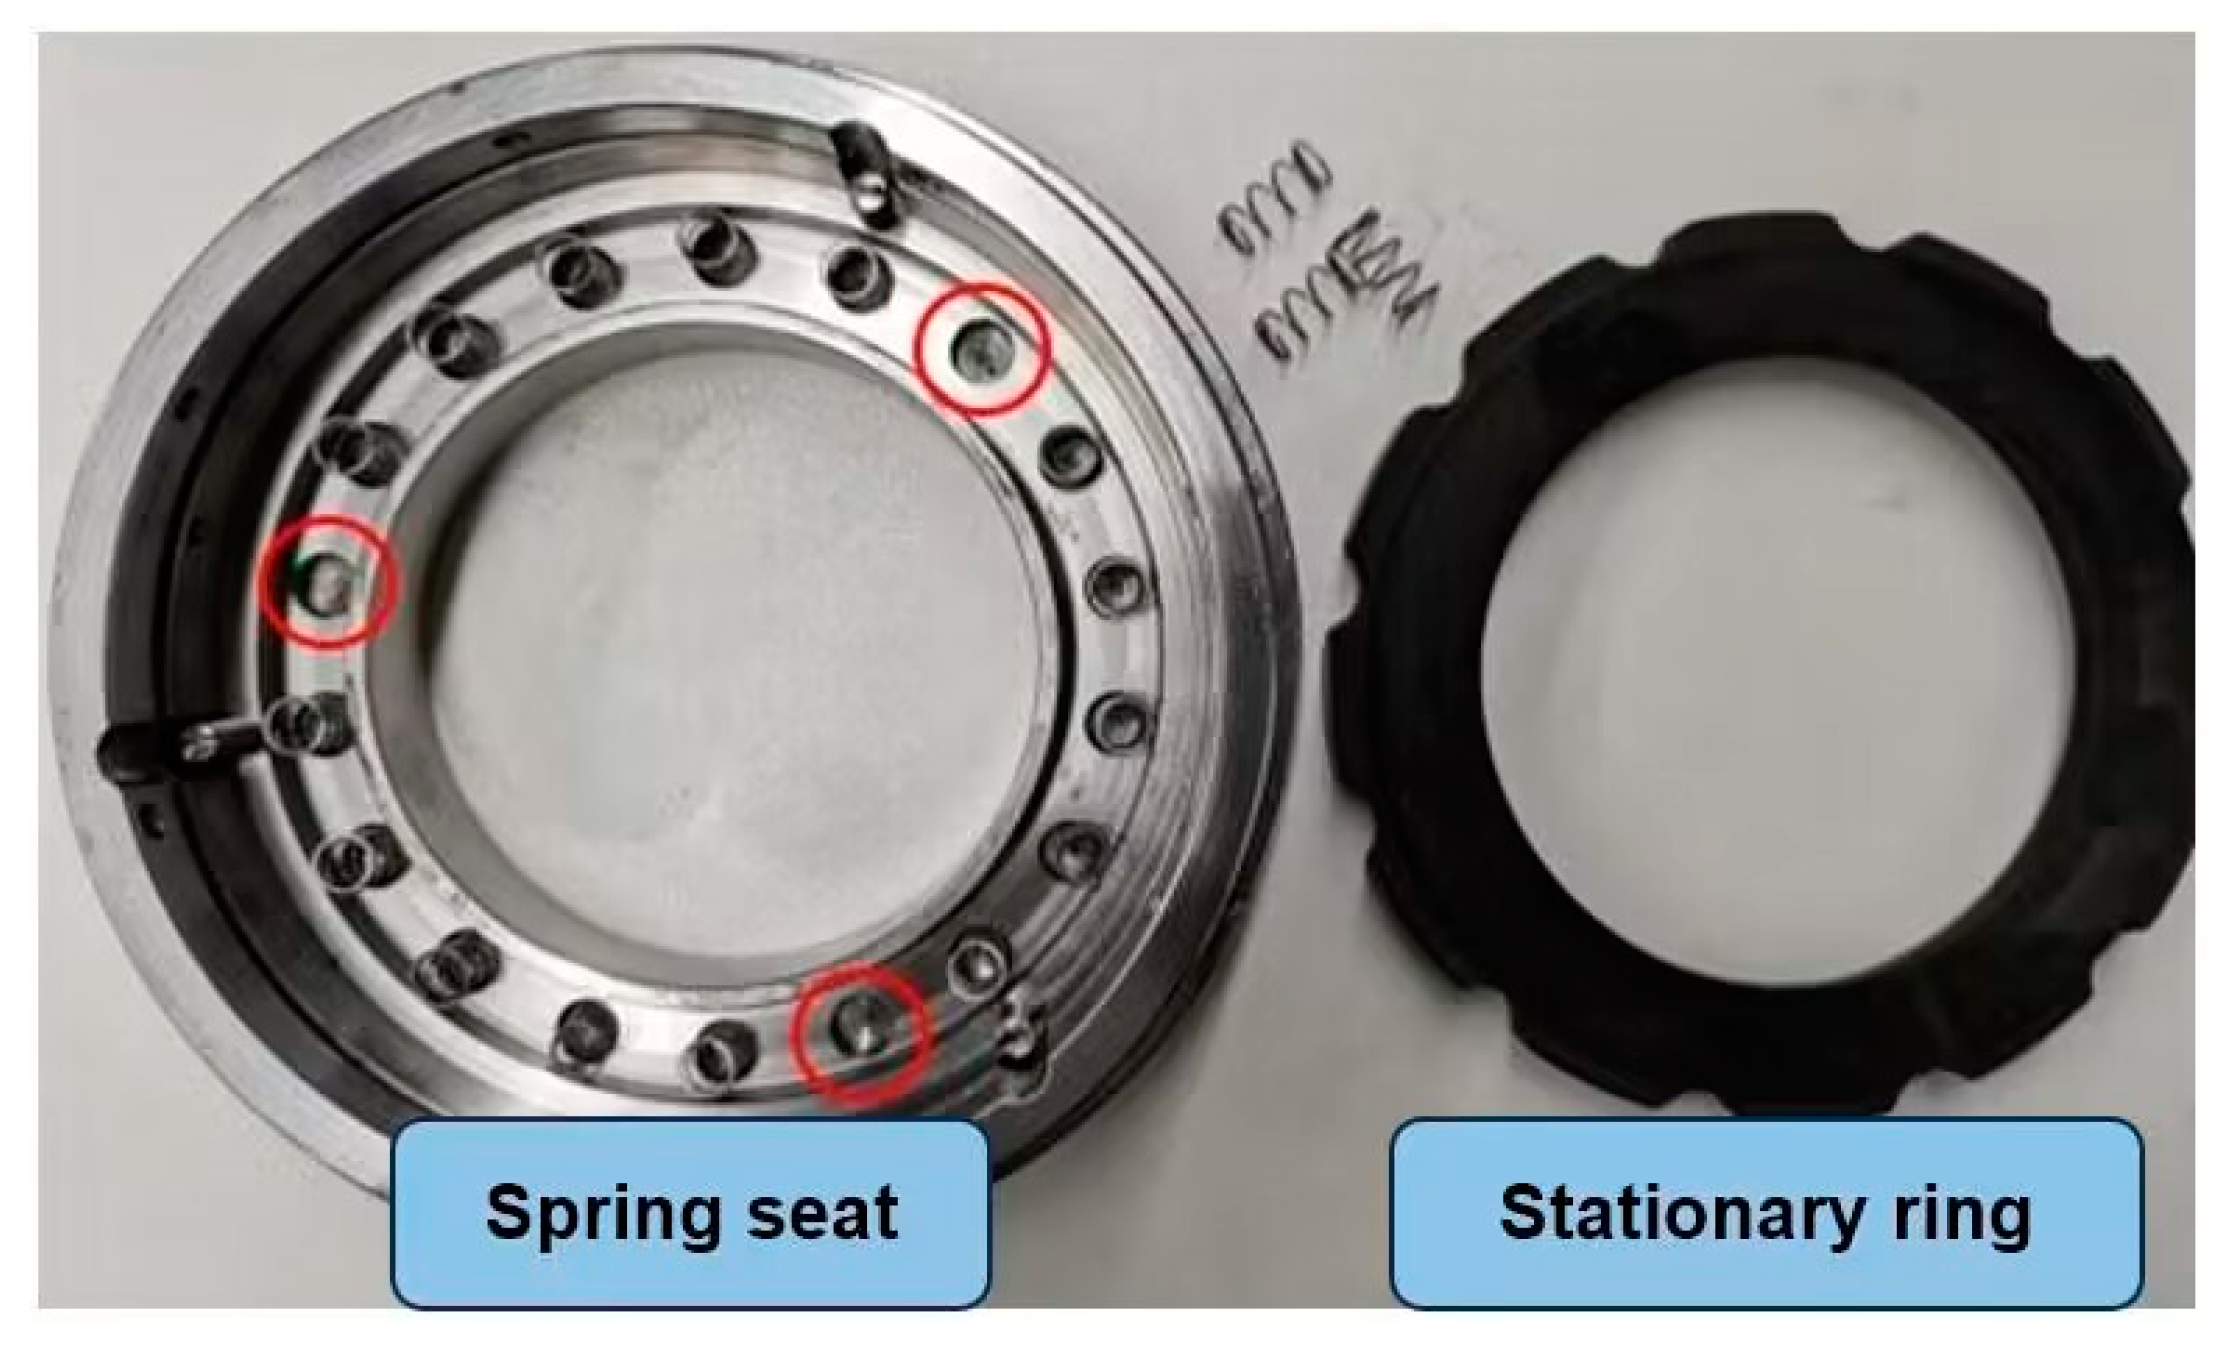
For the specific configuration method of sealing dynamic-ring-end-face defects, we adopted the manual setting method used by the Institute of Sound and Vibration at the University of Southampton in the UK, as referenced in [31]. Using diamond dressing tools, we manually created some end-face pits on the mating ring, as shown in Figure 7. The minimum defect size is approximately 5 mm × 6 mm, and the maximum defect size is approximately 7 mm × 8 mm. Defective sealing surfaces can result in reduced sealing performance of dry gas seals and may lead to higher leakage rates.
It is noteworthy that multiple studies on a large number of seal failures have shown that “miscellaneous” causes, including spring failures, account for 15% of all seal failures [31]. Springs, as an indispensable part of the sealing component, may not fulfill their expected functions due to failure forms such as fatigue and corrosion. Consequently, online monitoring of spring failure is crucial, and prompt detection of poor spring conditions and timely intervention are essential.
In this experiment, we aimed to explore the AE signal characteristics of sealing operation during spring failure in the dry gas sealing component and effectively extract the fault feature information. We conducted manual simulation tests by removing three springs from the sealing head assembly (the total number of springs in the dry gas seal of the YTCG802 centrifugal compressor is 18) to conduct AE signal testing under spring failure conditions. The actual test configuration is depicted in Figure 8.

4.2. AE Signal Feature Analysis of End-Face Defects

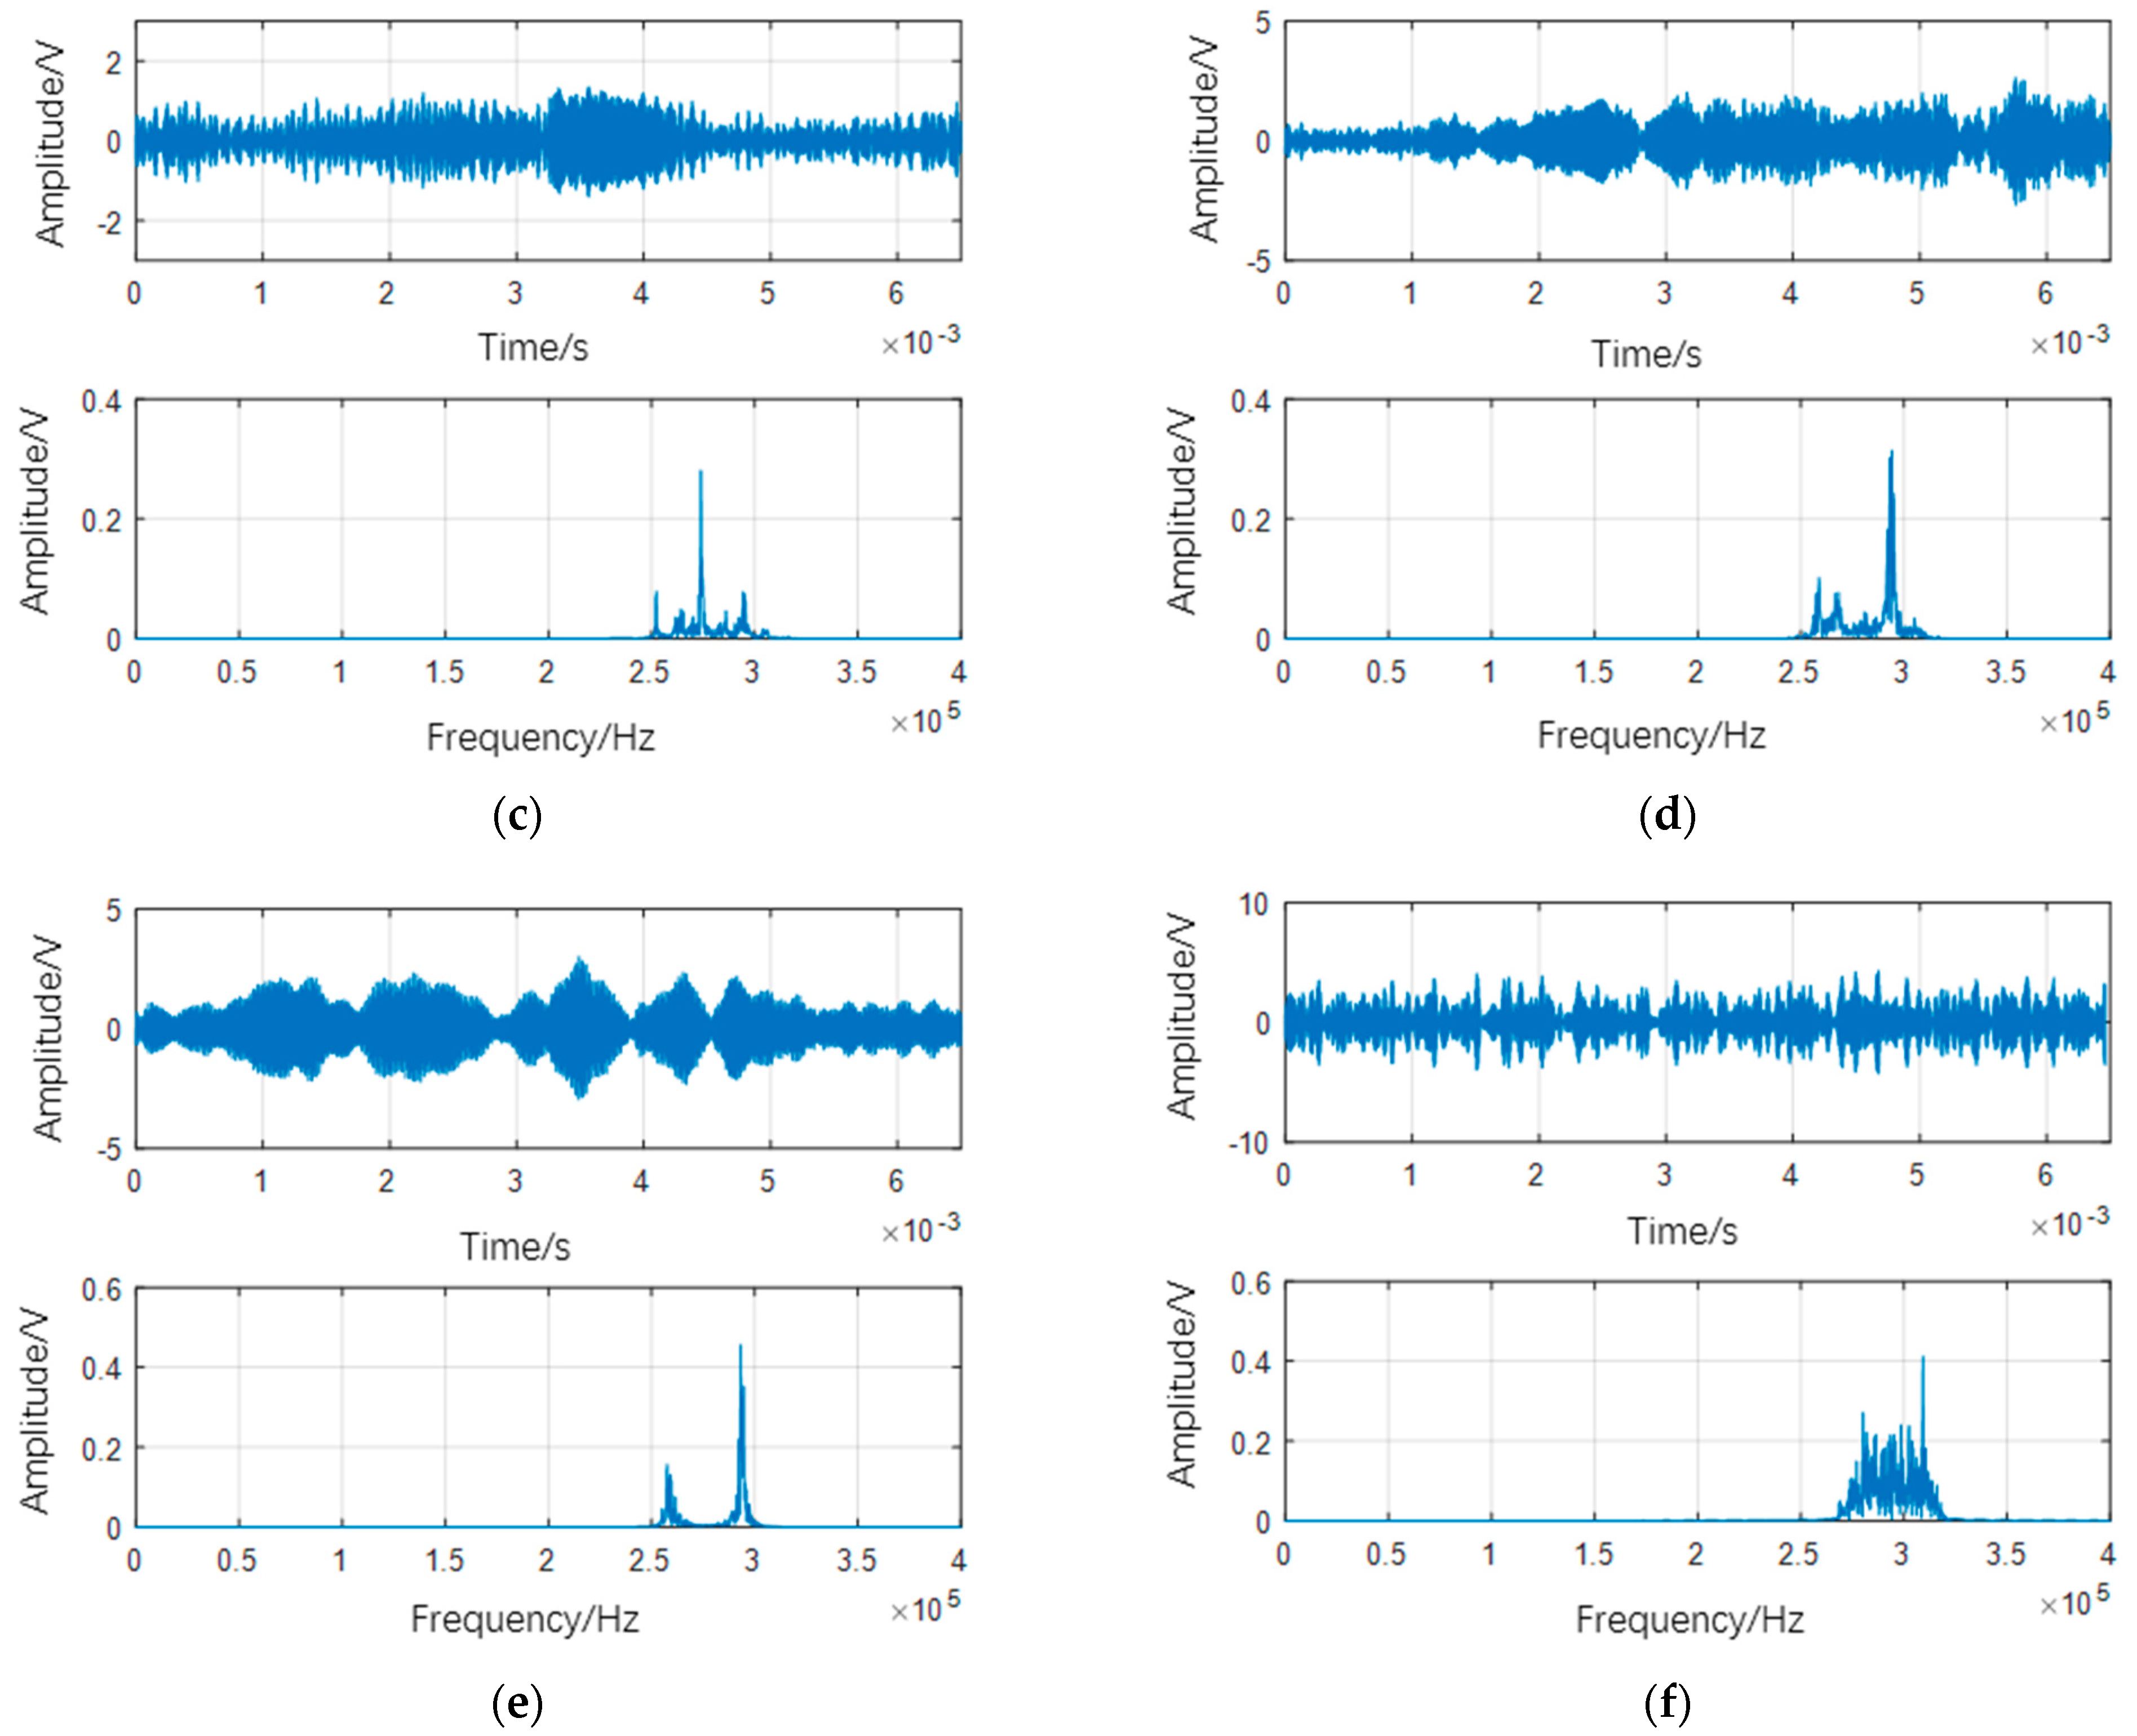
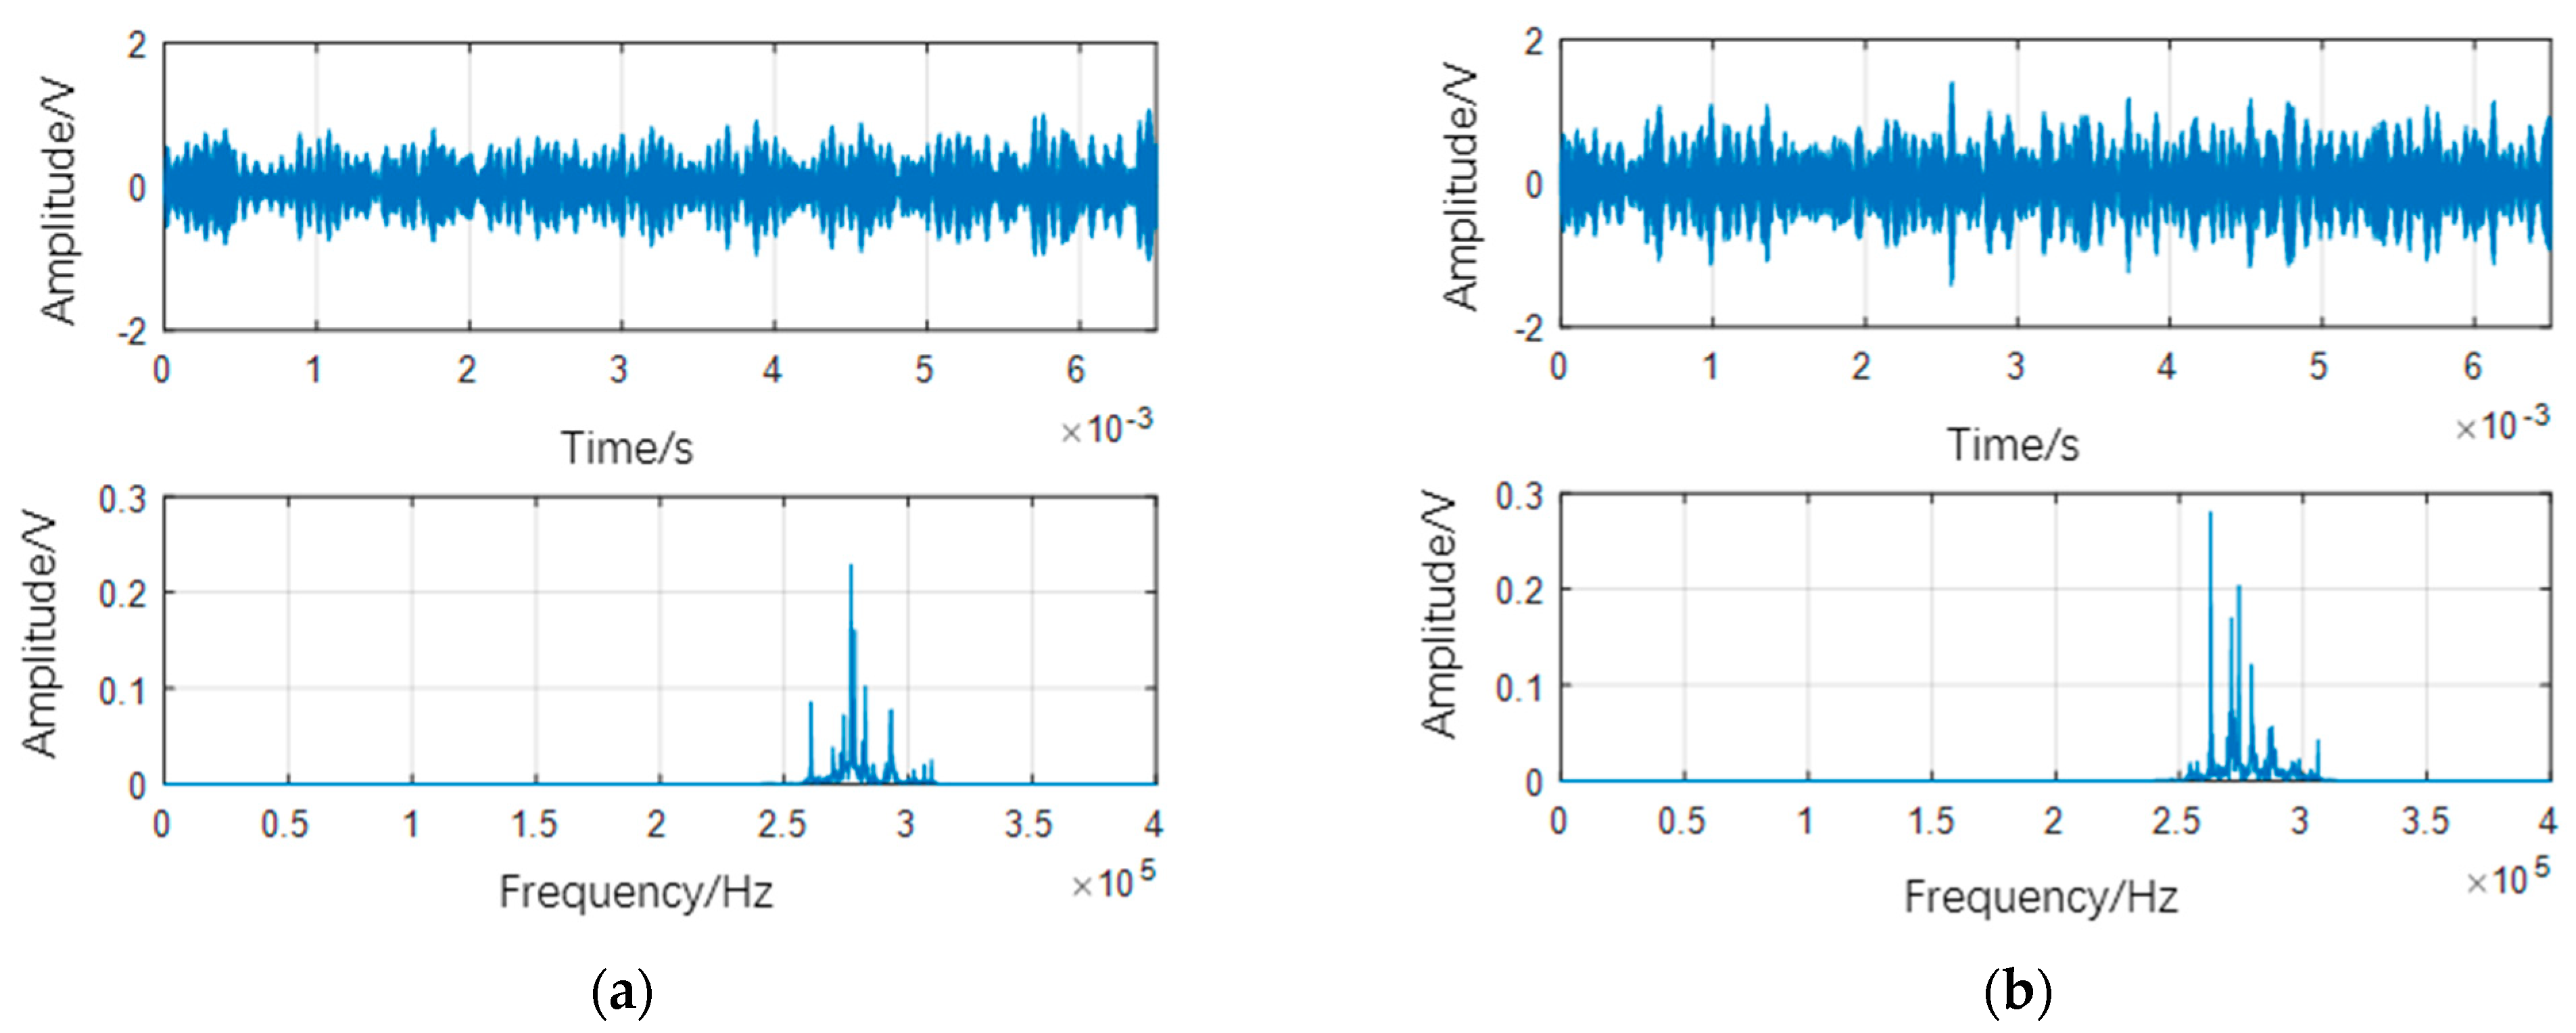
Figure 9 presents the time-domain and frequency-domain analysis of the AE signal during dry gas seal operation under the condition of end-face defects. From the graph, it is evident that when the seal operates with end-face defects, the amplitude of the AE signal waveform is relatively large. At a speed of 200 r/min, the highest amplitude is approximately 1 V; at 600 r/min, the highest amplitude reaches 2 V, and when the speed increases to 1000 r/min, the highest amplitude surges to 5 V. At 1800 r/min, the waveform amplitude exceeds 10 V.
Notably, AE signals generated during the end-face defect operation at various speeds consistently exhibit high-frequency frequency bands within the range of 240–320 Hz. As demonstrated in prior research, AE signals generated during dry gas seal end-face contact possess high-frequency frequency bands. This observation underscores that the dry gas seal end face is undergoing frictional contact during this period.
As shown in Figure 10, the waveform of the filtered AE signal is presented. It is evident that at various speeds, high-frequency AE signals are consistently present, with the highest waveform amplitude exceeding 0.3 V. A comparison of the AE signals before and after filtering reveals that some high-frequency signals are retained after filtering. Throughout the operation at different speeds, there are continuous high-frequency signal bands within the dry gas seal. This observation indicates that when operating with defects in the rotating ring end face of the dry gas seal, the fluid dynamic pressure effect is disrupted, resulting in contact friction between the rotating and stationary rings and unstable dry gas seal operation.
Figure 11 illustrates the change in AE signal energy with rotational speed during operation under the condition of defects on the end face of the dry gas seal dynamic ring. It is evident that the energy of the AE signal consistently increases during this period. This observation indicates that when the rotating ring end face has defects, the rotating and stationary ring end faces of the dry gas seal remain in contact and friction, without detachment. The primary reason for these findings is the presence of pits on the end face of the sealing rotating ring. These pits disrupt the dynamic pressure effect during sealing operation and prevent the formation of a stable gas film. Consequently, this leads to severe collisions and contact between the rotating and stationary rings. As the operating speed increases, the collision between the sealing end faces becomes more intense, resulting in higher AE signal energy.

4.3. Analysis of AE Signal Characteristics of Spring Failure

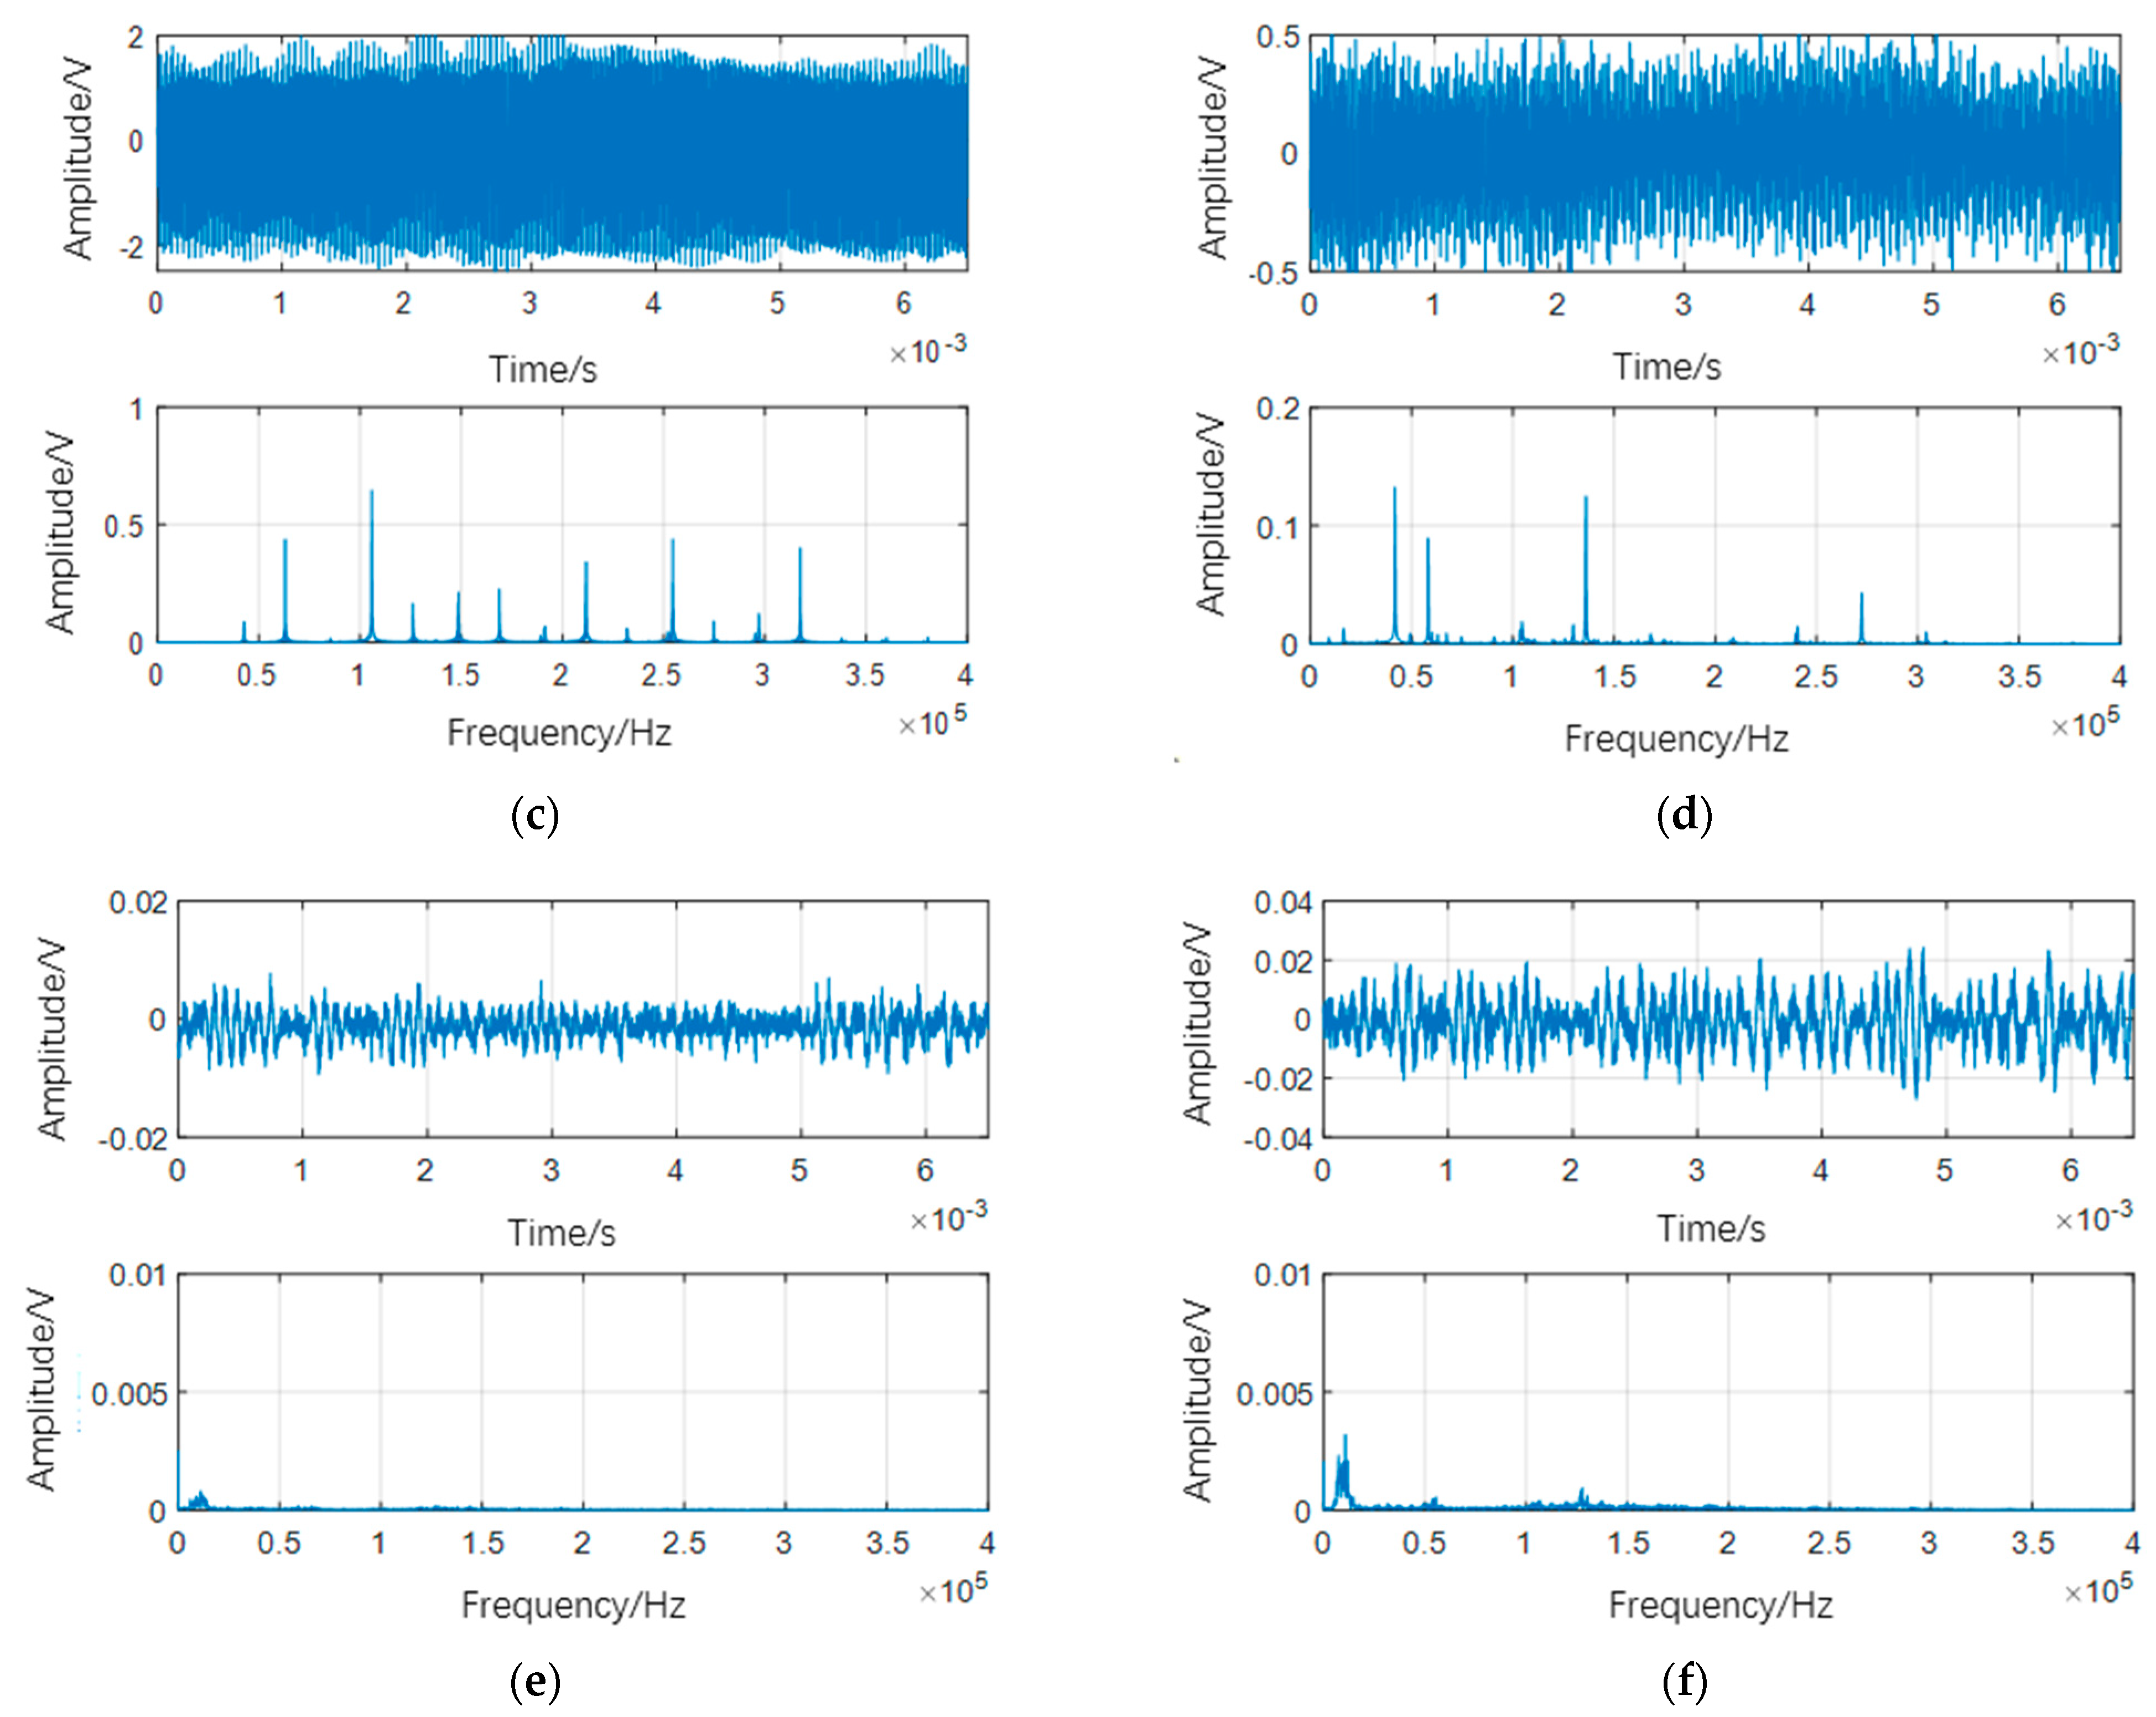
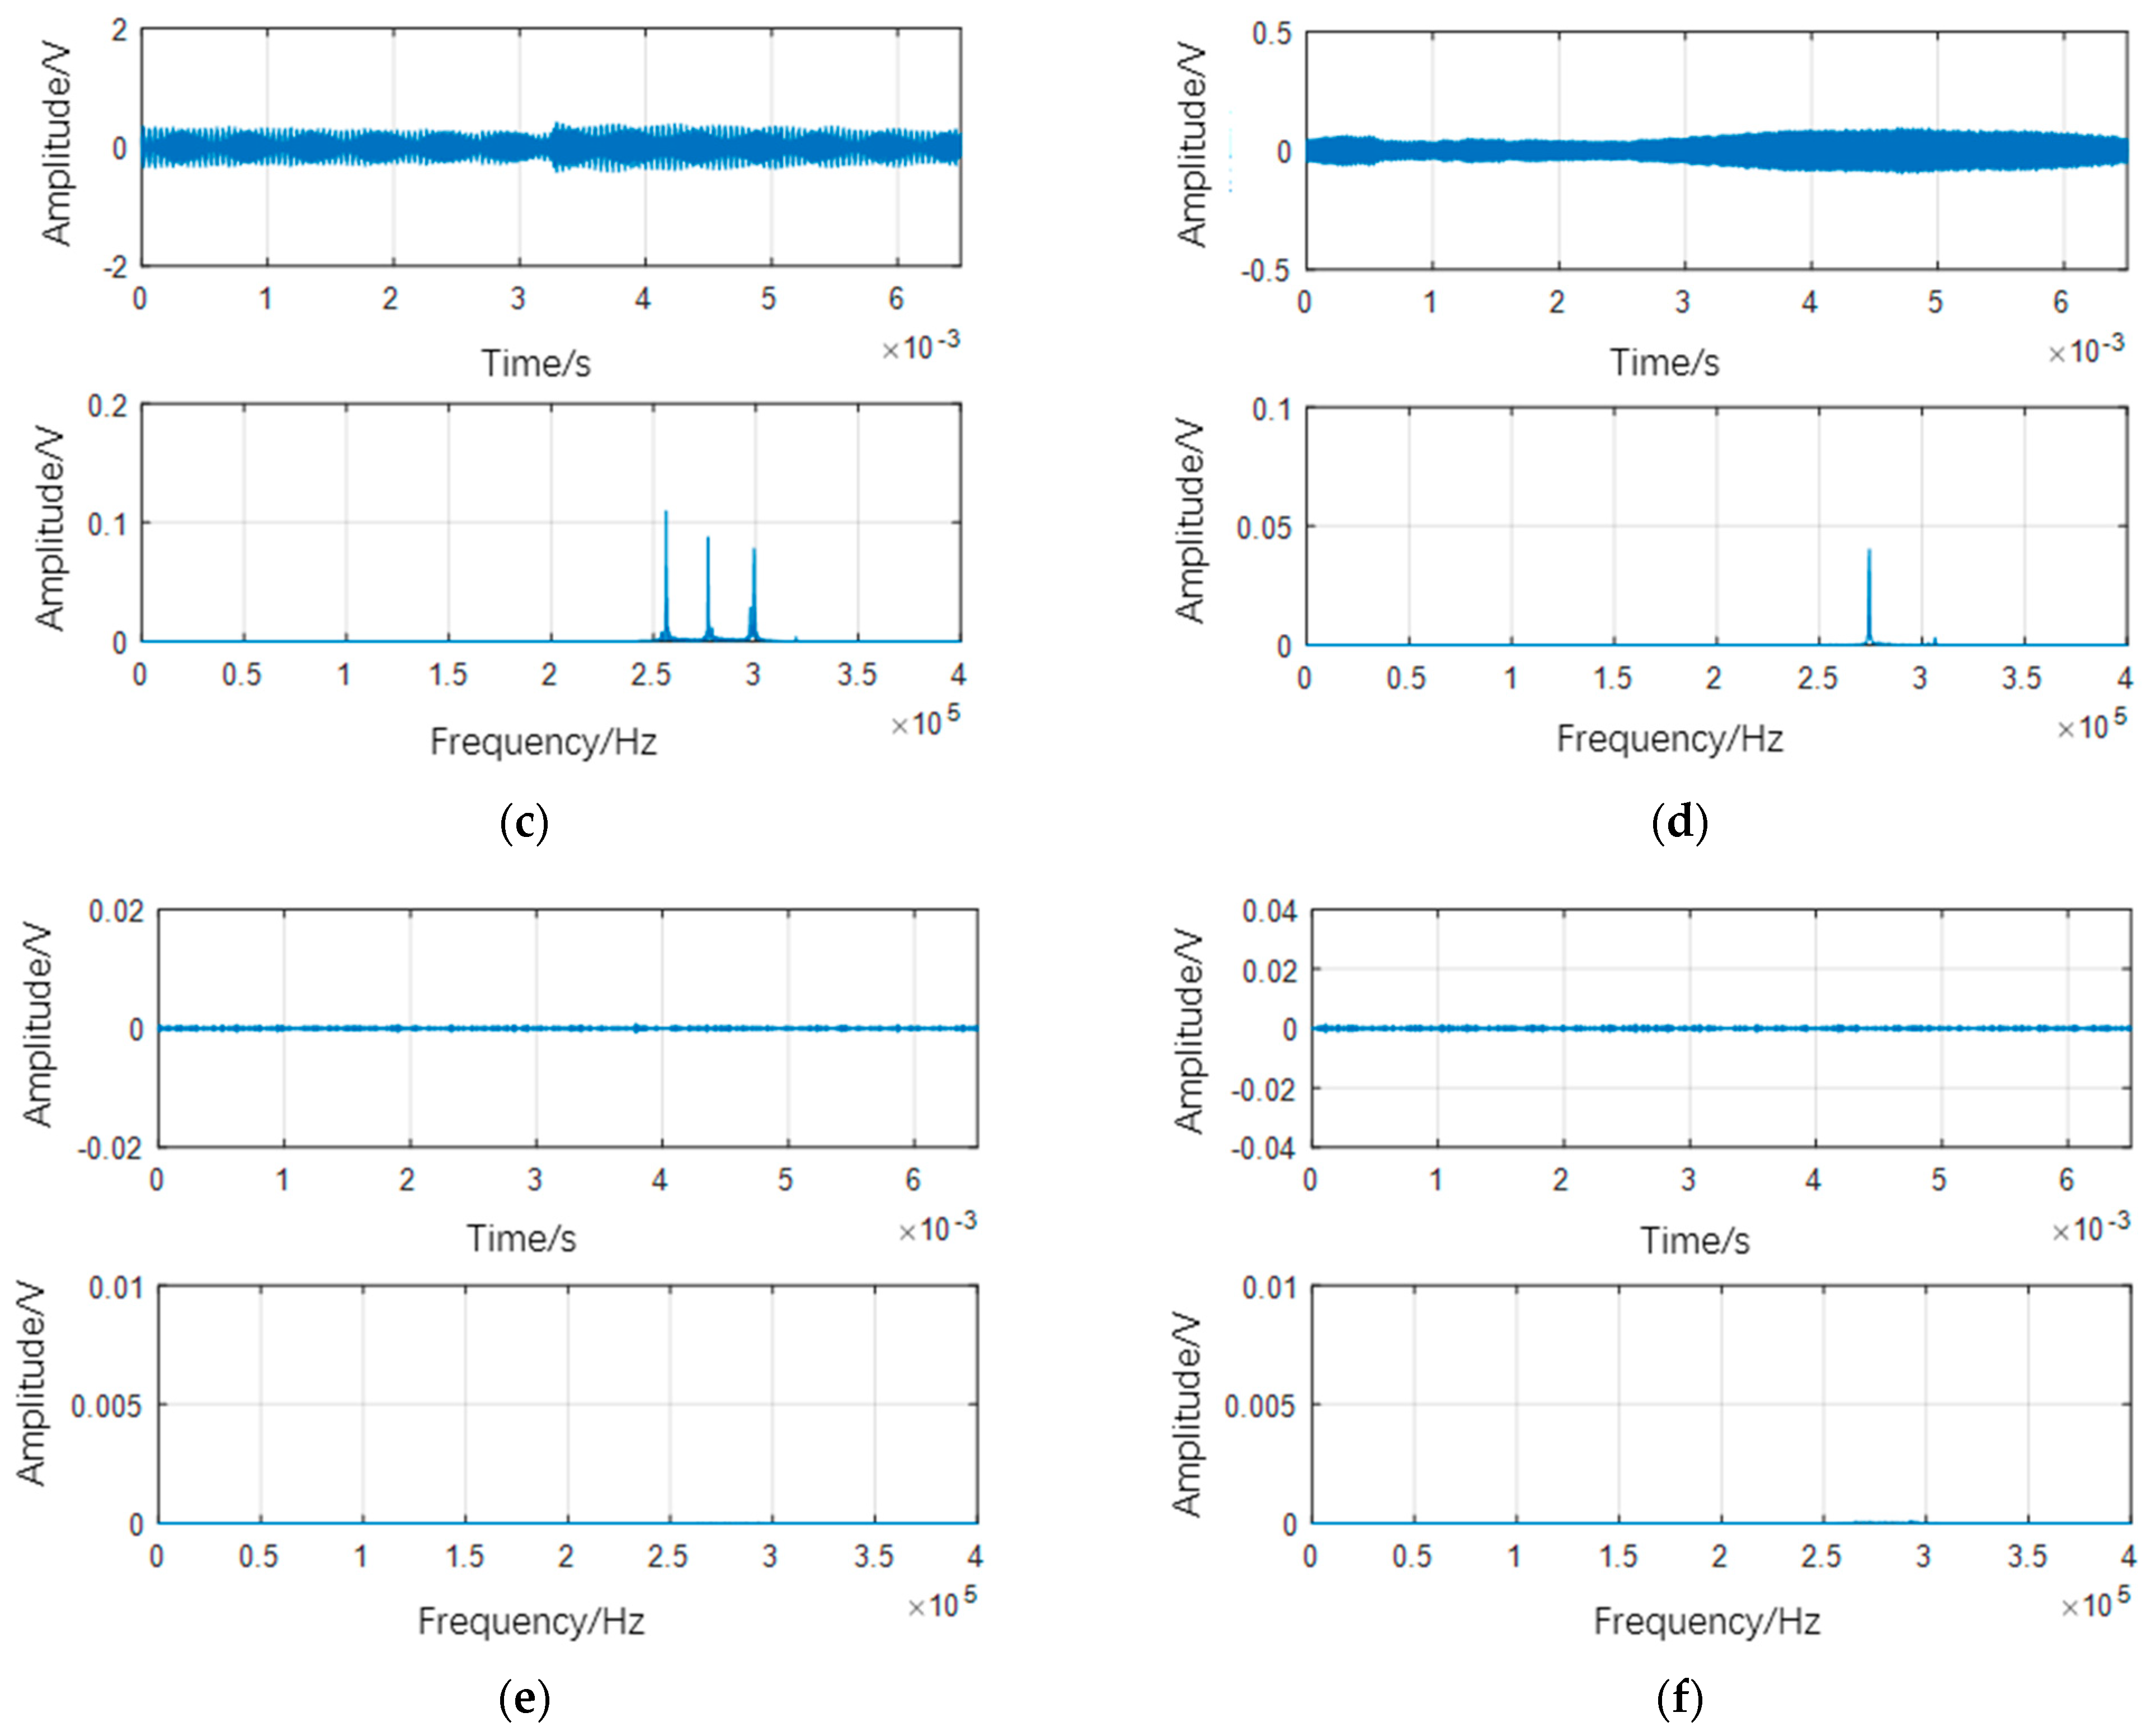
Figure 12 displays the AE signal waveform and spectrum analysis diagrams during operation under the condition of dry gas seal spring failure. From the waveform diagram, it is noticeable that under spring failure conditions, at a pressure of 0.1 MPa and 100 r/min, the maximum amplitude of the AE signal waveform reaches approximately 2.5 V. However, at 600 r/min, the waveform amplitude decreases to below 0.2 V. Beyond 800 r/min, the amplitude of the AE signal waveform drops even further, reaching below 0.02 V. The spectrum analysis in Figure 12a–d illustrates the presence of a high-frequency band (240–320 kHz) in the AE signal, indicating contact between the sealing end faces and friction between them generating high-frequency signal bands. However, in the spectrum analysis of Figure 12e,f, no high-frequency signals are observed, and the frequency amplitude is minimal, signifying that the dry gas seal end face is detached at this time.
During dry gas seal spring failure operation, the AE signal resembles the normal seal operation signal but is not entirely identical. The spring’s failure reduces the compensating force on the dry gas seal end face, making it easier for the sealing rotating and stationary rings to detach during the seal’s startup process. Figure 13 shows the filtered AE signal of the dry gas seal spring failure operation.
From Figure 13a–d, it is evident that high-frequency sealing AE signals are consistently present at dry gas sealing speeds below 600 r/min, indicating that the rotating and stationary rings end faces remain in contact during this period. After the rotational speed exceeds 800 r/min, as seen in Figure 13e,f after high-frequency band filtering, the signal waveform becomes extremely small. This suggests the absence of high-frequency AE signals at this point, indicating that the dry gas seal rotating and stationary ring end faces are completely detached, with no contact or friction occurring.
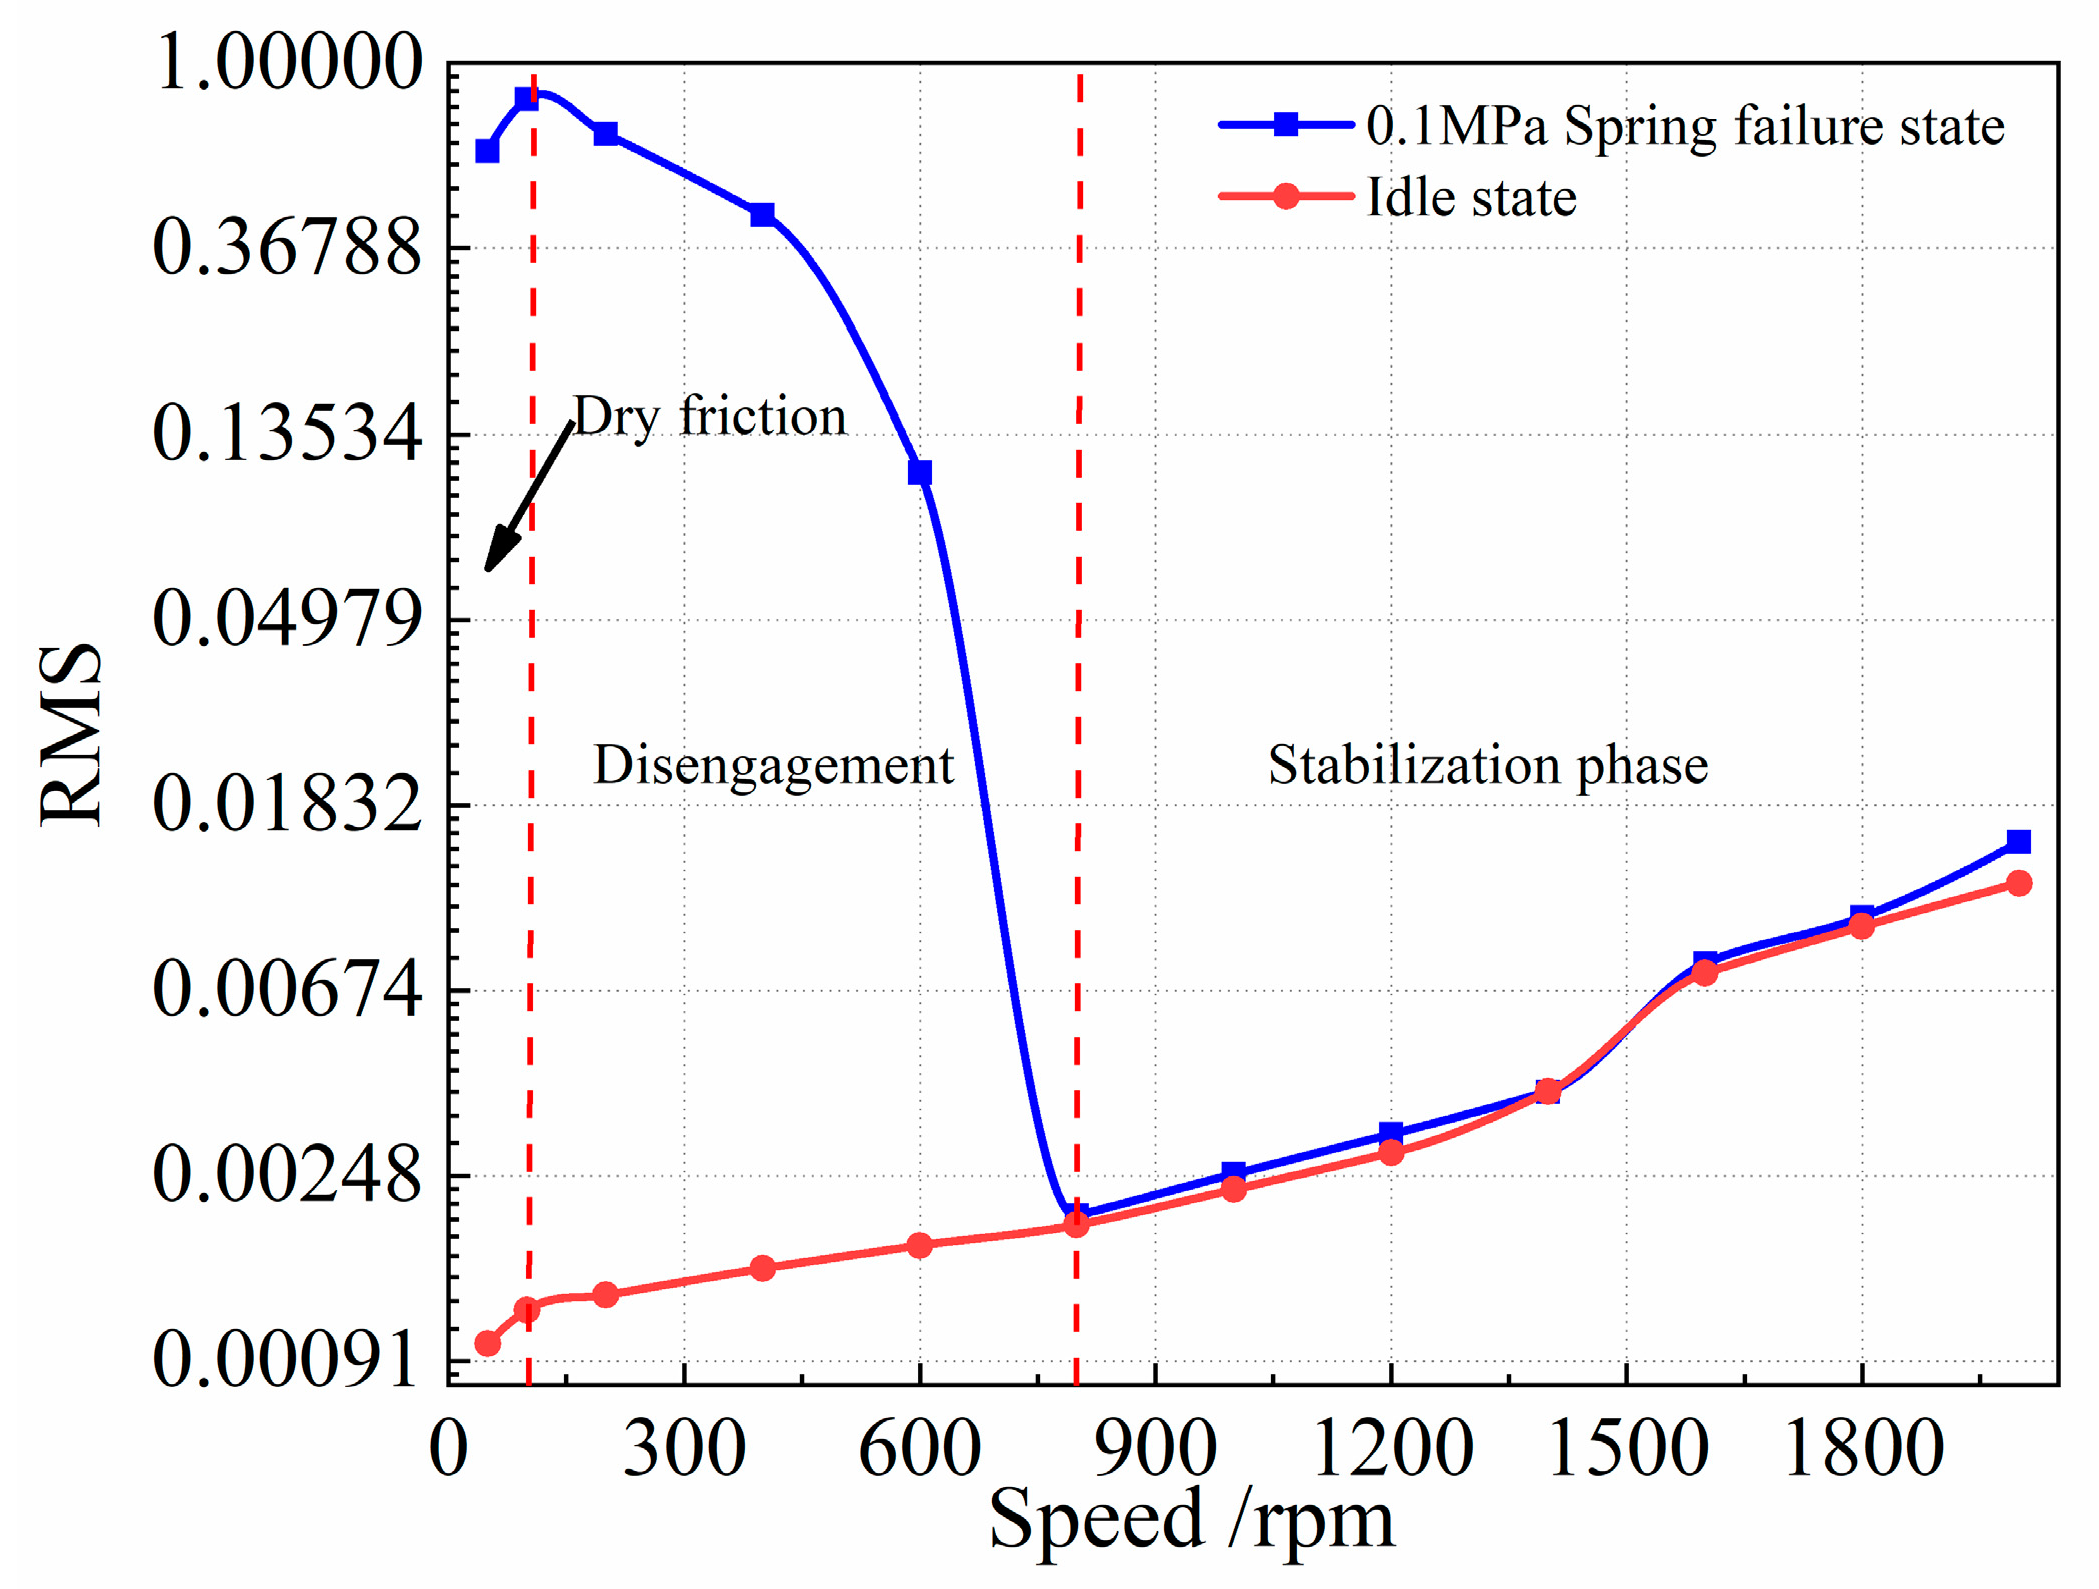
Figure 14 depicts the relationship between AE signal energy and the rotational speed of dry gas seals under the spring failure fault operation state. It is evident that when the speed is below 100 r/min, the AE signal energy of the dry gas seal increases with the speed. In the speed range between 100 r/min and 800 r/min, the AE signal energy gradually decreases with increasing speed. However, when the speed exceeds 800 r/min, the AE signal energy reaches its lowest point and then gradually increases with further speed increases.
These trends can be explained by the fact that at speeds below 100 r/min, the sealing end face remains in complete contact, and the AE signal energy is significantly influenced by the slip speed. As speed increases, the AE signal energy also increases. As the rotational speed continues to rise, the dry gas seal end face gradually detaches due to the fluid dynamic pressure effect. In this semi-contact state, increasing the speed reduces the contact area of the seal end face, leading to decreased AE signal energy. At 800 r/min, the seal end face completely detaches, resulting in the lowest energy. When the speed exceeds 800 r/min, the sealing end face remains completely disengaged, and the AE signal energy trend aligns with that observed during idle operation, gradually increasing with speed.

5. Conclusions

In conclusion, this article presents a significant discovery using acoustic emission (AE) detection to monitor the contact status of dry gas seals under various operating conditions. This finding enhances the feasibility and effectiveness of AE measurement techniques in detecting initial-stage faults in mechanical seal operation. Furthermore, it lays a solid theoretical foundation for the future development of mechanical seals towards intelligence, high reliability, and extended lifespan. The key conclusions drawn from the study are as follows:
(1)
During the operation of dry gas seals, contact between the sealing end faces generates an AE signal source. According to the experiments and data analysis presented in this article, the frequency range of 240–320 kHz is attributed to the frictional AE signal generated by the end-face contact during the operation of dry gas seals.
(2)
The root mean square of the AE signal can effectively distinguish between three different states of dry gas seals: low-speed friction, gradual detachment, and stable operation.
(3)
When operating under the fault state of a sealing end-face defect, the dynamic pressure effect on the dry gas sealing end face is insufficient, and the sealing end face remains in a continuous rubbing state. The amplitude of the AE signal waveform is high, and the root mean square value continuously increases with the speed.
(4)
When operating under a spring failure fault, the end face of the dry gas seal’s rotating and stationary rings completely disengages after 800 revolutions, ensuring stable operation.

Author Contributions

Conceptualization, S.Y., J.D. and J.L.; methodology, S.Y., J.D. and J.L.; software, S.W., J.D. and Z.L.; validation, S.Y. and J.L.; formal analysis, S.W.; investigation, J.D. and Z.L.; resources, S.Y. and J.L.; data curation, S.Y., Z.L., J.D. and J.L.; writing—original draft preparation, J.D. and Z.L.; writing—review and editing, S.Y., J.D. and J.L.; visualization, S.W. and Z.L.; supervision, S.Y.; project administration, S.Y. and J.L.; funding acquisition, S.Y. All authors have read and agreed to the published version of the manuscript.

Funding

This work was supported by the National Key R&D Program of China (Grant No. 2020YFB2010001), the Ningbo Natural Science Foundation (Young Doctoral Innovative Research Project) (No. 2022J152), Basic Public Welfare Research Program of Zhejiang Province (No. LY22E050010), the National Natural Science Foundation of China (No. 51905480), the Ningbo Science and Technology Innovation 2025 Major Project (No. 2022Z005 & 2022Z007).

Data Availability Statement

Data are contained within the article.

Acknowledgments

This work was co-supported by the National Key R&D Program of China (Grant No. 2020YFB2010001).

Conflicts of Interest

The authors declare no conflict of interest.

References

  1. Wang, Y.; Sun, J.; Hu, Q.; Da, W. Orientation effect of ordered roughness microstructure on spiral groove dry gas seal. Tribol. Int. 2018, 126, 97–105. [Google Scholar]
  2. Bob, F. Review of features in Sealing Technology during the last year. Seal. Technol. 2005, 5, 6–11. [Google Scholar]
  3. Wang, Q.; Chu, F. Experimental determination of the rubbing location by means of acoustic emission and wavelet transform. J. Sound Vib. 2001, 248, 91–103. [Google Scholar] [CrossRef]
  4. Chen, J.; Tang, L.; Ding, X.; Si, J.; Chen, D.; Sun, B. Frictional vibration performances of dry gas seal rings with DLC film textured surface via chaos theory. Tribol. Trans. 2021, 64, 667–678. [Google Scholar] [CrossRef]
  5. Sato, I. Rotating machinery diagnosis with acoustic emission techniques. Electr. Eng. Jpn. 1990, 110, 115–127. [Google Scholar] [CrossRef]
  6. Green, I. Real time monitoring and control of mechanical face seal dynamic behavior. Seal. Technol. 2001, 2001, 6–11. [Google Scholar] [CrossRef]
  7. Ding, X.; Zhang, H.; Zhang, W.; Su, H. Axial vibration test and analysis on gas film sealing ring system in dry gas seal. J. Vib. Meas. Diagn. 2013, 33, 231–235+337–338. (In Chinese) [Google Scholar]
  8. Wang, J.; Wang, X.; Zhang, C.; Jia, Q.; Chen, R.; Liu, K. Distribution detection method of film thickness in mechanical seal based on ultrasonic principle. China Mech. Eng. 2019, 30, 684–689. (In Chinese) [Google Scholar]
  9. Márquez, F.P.G.; Tobias, A.M.; Pérez, J.M.P.; Papaelias, M. Condition monitoring of wind turbines: Techniques and methods. Renew. Energy 2012, 46, 169–178. [Google Scholar] [CrossRef]
  10. Zhao, X.G.; Chen, C.Z.; Zhou, B.; Liu, X.H. Study on monitoring damage about material of blade in wind turbine based on acoustic emission. Adv. Mater. Res. 2011, 201–203, 2753–2758. [Google Scholar] [CrossRef]
  11. Bejger, A.; Drzewieniecki, J.B.; Bartoszko, P.; Frank, E. The Use of Coherence Functions of Acoustic Emission Signals as a Method for Diagnosing Wind Turbine Blades. Energies 2023, 16, 7474. [Google Scholar] [CrossRef]
  12. Al-Ghamd, A.M.; Mba, D. A comparative experimental study on the use of acoustic emission and vibration analysis for bearing defect identification and estimation of defect size. Mech. Syst. Signal Process. 2006, 20, 1537–1571. [Google Scholar] [CrossRef]
  13. Sadegh, H.; Mehdi, A.N.; Mehdi, A. Classification of acoustic emission signals generated from journal bearing at different lubrication conditions based on wavelet analysis in combination with artistic neural network and genetic algorithm. Tribol. Int. 2016, 95, 426–434. [Google Scholar] [CrossRef]
  14. Jiang, P.; Sun, W.; Li, W.; Wang, H.; Liu, C. Extreme-Low-Speed Heavy Load Bearing Fault Diagnosis by Using Improved RepVGG and Acoustic Emission Signals. Sensors 2023, 23, 3541. [Google Scholar] [CrossRef] [PubMed]
  15. Renhart, P.; Maier, M.; Strablegg, C.; Summer, F.; Grün, F.; Eder, A. Monitoring Tribological Events by Acoustic Emission Measurements for Bearing Contacts. Lubricants 2021, 9, 109. [Google Scholar] [CrossRef]
  16. Hu, F.; He, Q.; Huang, W.; Yin, Y.; Wen, X.; Liu, Y.; Wang, Y. Face grooves for state monitoring in dry gas seals. Tribol. Int. 2023, 189, 108950. [Google Scholar] [CrossRef]
  17. Li, X.; Fu, P.; Chen, K.; Lin, Z.; Zhang, E. The Contact State Monitoring for Seal End Faces Based on Acoustic Emission Detection. Shock Vib. 2015, 2016, 8726781. [Google Scholar] [CrossRef]
  18. Towsyfyan, H.; Gu, F.; Ball, A.D.; Liang, B. Tribological behavior diagnostic and fault detection of mechanical seals based on acoustic emission measurements. Friction 2019, 7, 572–586. [Google Scholar] [CrossRef]
  19. Chai, M.; Hou, X.; Zhang, Z.; Duan, Q. Identification and prediction of fatigue crack growth under different stress ratios using acoustic emission data. Int. J. Fatigue 2022, 160, 106860. [Google Scholar] [CrossRef]
  20. Muir, C.; Swaminathan, B.; Almansour, A.S.; Sevener, K.; Smith, C.; Presby, M.; Kiser, J.D.; Pollock, T.M.; Daly, S. Damage mechanism identification in composites via machine learning and acoustic emission. npj Comput. Mater. 2021, 7, 95. [Google Scholar] [CrossRef]
  21. Huang, W.; Lin, Y.; Liu, Y.; Liu, X.; Gao, Z.; Wang, Y. Face rub-impact monitoring of a dry gas seal using acoustic emission. Tribol. Lett. 2013, 52, 253–259. [Google Scholar] [CrossRef]
  22. Huang, W.; Lin, Y.; Gao, Z.; Fan, W.; Suo, S.; Wang, Y. An acoustic emission study on the starting and stopping processes of a dry gas seal for pumps. Tribol. Lett. 2013, 49, 379–384. [Google Scholar] [CrossRef]
  23. Fan, W.; Huang, W.; Liu, Y.; Yin, Y.; Liu, X.; Wang, Y. State evolution of dry gas seal during repeated start stop operation using acoustic emission method. Tribol. Trans. 2020, 63, 173–181. [Google Scholar] [CrossRef]
  24. Li, X.; Fu, P.; Zhang, Z. Measurement of film thickness in mechanical seals based on AE technology. J. Sichuan Univ. (Eng. Sci. Ed.) 2014, 46, 198–204. (In Chinese) [Google Scholar]
  25. Li, X.; Fu, P.; Cao, W.; Chen, K. The study of acoustic emission monitoring for contact state of seal end faces. J. Vib. Shock 2016, 35, 83–89. (In Chinese) [Google Scholar]
  26. Yin, Y.; Liu, X.; Huang, W.; Liu, Y.; Hu, S. Gas face seal status estimation based on acoustic emission monitoring and support vector machine regression. Adv. Mech. Eng. 2020, 12, 168781402092132. [Google Scholar] [CrossRef]
  27. Wang, L.; Wood, R. Acoustic emissions from aggregated hybrid contacts. Tribol. Int. 2009, 42, 1629–1637. [Google Scholar] [CrossRef]
  28. Towsyfyan, H.; Gu, F.; Ball, A.D.; Liang, B. Modeling acoustic emissions generated by tribological behavior of mechanical seals for condition monitoring and fault detection. Tribol. Int. 2018, 125, 46–58. [Google Scholar] [CrossRef]
  29. Zhang, P.; Gu, B.; Zhou, J.; Wei, L. On hydrodynamic lubrication characteristics of ferrofluid film in a spiral groove mechanical seal. Ind. Lubr. Tribol. 2018, 70, 1783–1797. [Google Scholar] [CrossRef]
  30. Gao, Z.; Lin, Y.; Huang, W.; Suo, S.; Wang, Y. Acoustic emission characteristics of dry gas seals during startup. J. Tsinghua Univ. (Sci. Tech.) 2013, 53, 319–322+329. (In Chinese) [Google Scholar]
  31. Towsyfyan, H. Investigation of the Non-Linear Tribological Behavior of Mechanical Seals for Online Condition Monitoring. Ph.D. Thesis, University of Huddersfield, Huddersfield, UK, 2017. [Google Scholar]
Figure 1. Monitoring system of airborne AE signals for dry gas seal.
Lubricants 12 00035 g001
Figure 2. Layout of acoustic emission sensors.
Lubricants 12 00035 g002
Figure 3. Raw signal waveform and spectrum diagram: (a) 0.1 MPa, 100 r/min; (b) 0.1 MPa, 600 r/min; (c) 0.1 MPa, 1000 r/min; (d) 0.1 MPa, 2000 r/min.
Lubricants 12 00035 g003
Figure 4. Spectrum of Airborne acoustic emission signals for dry gas seal: (a) Sealless operation, 0.1 MPa, 200 r/min; (b) Normal operation, 0.1 MPa, 200 r/min.
Lubricants 12 00035 g004
Figure 5. Time domain waveform and spectrum after filtering: (a) 0.1 MPa, 100 r/min; (b) 0.1 MPa, 600 r/min; (c) 0.1 MPa, 1000 r/min; (d) 0.1 MPa, 1800 r/min.
Lubricants 12 00035 g005
Figure 6. Relationship between acoustic emission RMS value and rotational speed.
Lubricants 12 00035 g006
Figure 7. Setting diagram of sealing end-face defects: (a) Schematic diagram of manually setting defects; (b) Physical image of defects on the end face of the moving ring.
Lubricants 12 00035 g007
Figure 8. Physical diagram of the spring failure configuration.
Lubricants 12 00035 g008
Figure 9. Frequency spectrum analysis diagram of operating AE signal waveform for sealing end-face defects: (a) 0.1 MPa, 100 r/min; (b) 0.1 MPa, 200 r/min; (c) 0.1 MPa, 600 r/min; (d) 0.1 MPa, 1000 r/min; (e) 0.1 MPa, 1200 r/min; (f) 0.1 MPa, 1800 r/min.
Lubricants 12 00035 g009aLubricants 12 00035 g009b
Figure 10. Frequency spectrum diagram of operating AE signal waveform for sealing end-face defects after filtering: (a) 0.1 MPa, 100 r/min; (b) 0.1 MPa, 200 r/min; (c) 0.1 MPa, 600 r/min; (d) 0.1 MPa, 1000 r/min; (e) 0.1 MPa, 1200 r/min; (f) 0.1 MPa, 1800 r/min.
Lubricants 12 00035 g010aLubricants 12 00035 g010b
Figure 11. Relationship diagram between AE signal energy and speed under sealing rotating ring end-face defect condition.
Lubricants 12 00035 g011
Figure 12. AE signal waveform and frequency spectrum analysis diagram of sealing during spring failure operation: (a) 0.1 MPa, 50 r/min; (b) 0.1 MPa, 100 r/min; (c) 0.1 MPa, 200 r/min; (d) 0.1 MPa, 600 r/min; (e) 0.1 MPa, 800 r/min; (f) 0.1 MPa, 1800 r/min.
Lubricants 12 00035 g012aLubricants 12 00035 g012b
Figure 13. Frequency spectrum diagram of the AE signal waveform during spring failure operation after filtering. (a) 0.1 MPa, 50 r/min; (b) 0.1 MPa, 100 r/min; (c) 0.1 MPa, 200 r/min; (d) 0.1 MPa, 600 r/min; (e) 0.1 MPa, 800 r/min; (f) 0.1 MPa, 1800 r/min.
Lubricants 12 00035 g013aLubricants 12 00035 g013b
Figure 14. Relationship between AE signal energy and rotational speed under spring failure state.
Lubricants 12 00035 g014
Table 1. Main components and performance parameters of the experimental system.
Lib RefModelPerformance Parameter
Drive motorYE2-160M1-2Rated speed: 2940 r/min
Air circuit control systemCYTYF120-O2Q-00Maximum pressure: 16 MPa
Dry gas sealing test benchCYTYF015C-01-00Rated power: 11 kW, maximum speed: 3000 r/min
Variable frequency starterY500-X0150C3Rated power: 15 kW
Acoustic emission collectorPXDAQ24260BMaximum sampling frequency: 2.5 MHz, threshold: 35 dB, number of channels: 2, signal bandwidth: 13 kHz~1035 kHz, Hit Definition Time: 800 μs, Peak Definition Time: 200 μs
Table 2. Parameter settings for experimental data collection.
Working ParametersNo Seal Idling, Normal Condition, End-Face Defects
Inlet pressure (MPa)0.1 MPa
Motor speed (r/min)0–2000 r/min
Sampling frequency (kHz)1250 kHz
Channel settings1# channelAcoustic emission signal s1
2# channelAcoustic emission signal s2
3# channelSpeed signal V
Table 3. Bandpass filter parameter configuration.
ParameterValue
Sampling frequency1,250,000 Hz
Low-frequency cutoff frequency (LF)235,000 Hz
High-frequency cutoff frequency (HF)305,000 Hz
Normalized angular frequency (NAF)NAF1 = 2 × LF/Fs; NAF2 = 2 × HF/Fs;
Frequency vector[0 NAF1 −0.1 NAF1 NAF2 NAF2 +0.1 1]
Passband and stopband parameters[0 0 1 1 0 0]
Passband and stopband weights[1 1 1]
Transfer functionremez
Filter order60
Disclaimer/Publisher’s Note: The statements, opinions and data contained in all publications are solely those of the individual author(s) and contributor(s) and not of MDPI and/or the editor(s). MDPI and/or the editor(s) disclaim responsibility for any injury to people or property resulting from any ideas, methods, instructions or products referred to in the content.