A Comprehensive Numerical Study of a Wedge-Shaped Textured Convergent Oil Film Gap


Abstract
:1. Introduction
- Melting/vaporization (for example, electric discharge machining);
- Ablation (for example, laser surface texturing);
- Forced material removal (for example, micro-grinding);
- Dissolution (for example, chemical etching);
- Solidification (for example, micro-casting);
- Material addition (for example, chemical vapor deposition).
- Increase the hydrodynamic pressure;
- Supply the surfaces with additional lubricant;
- Store lubricant;
- Trap wear particles;
- Reduce the real contact area.
2. Simulation Model
2.1. Mathematical Formulation of a Multiphase Flow
2.2. Comparison of Different Simulation Models
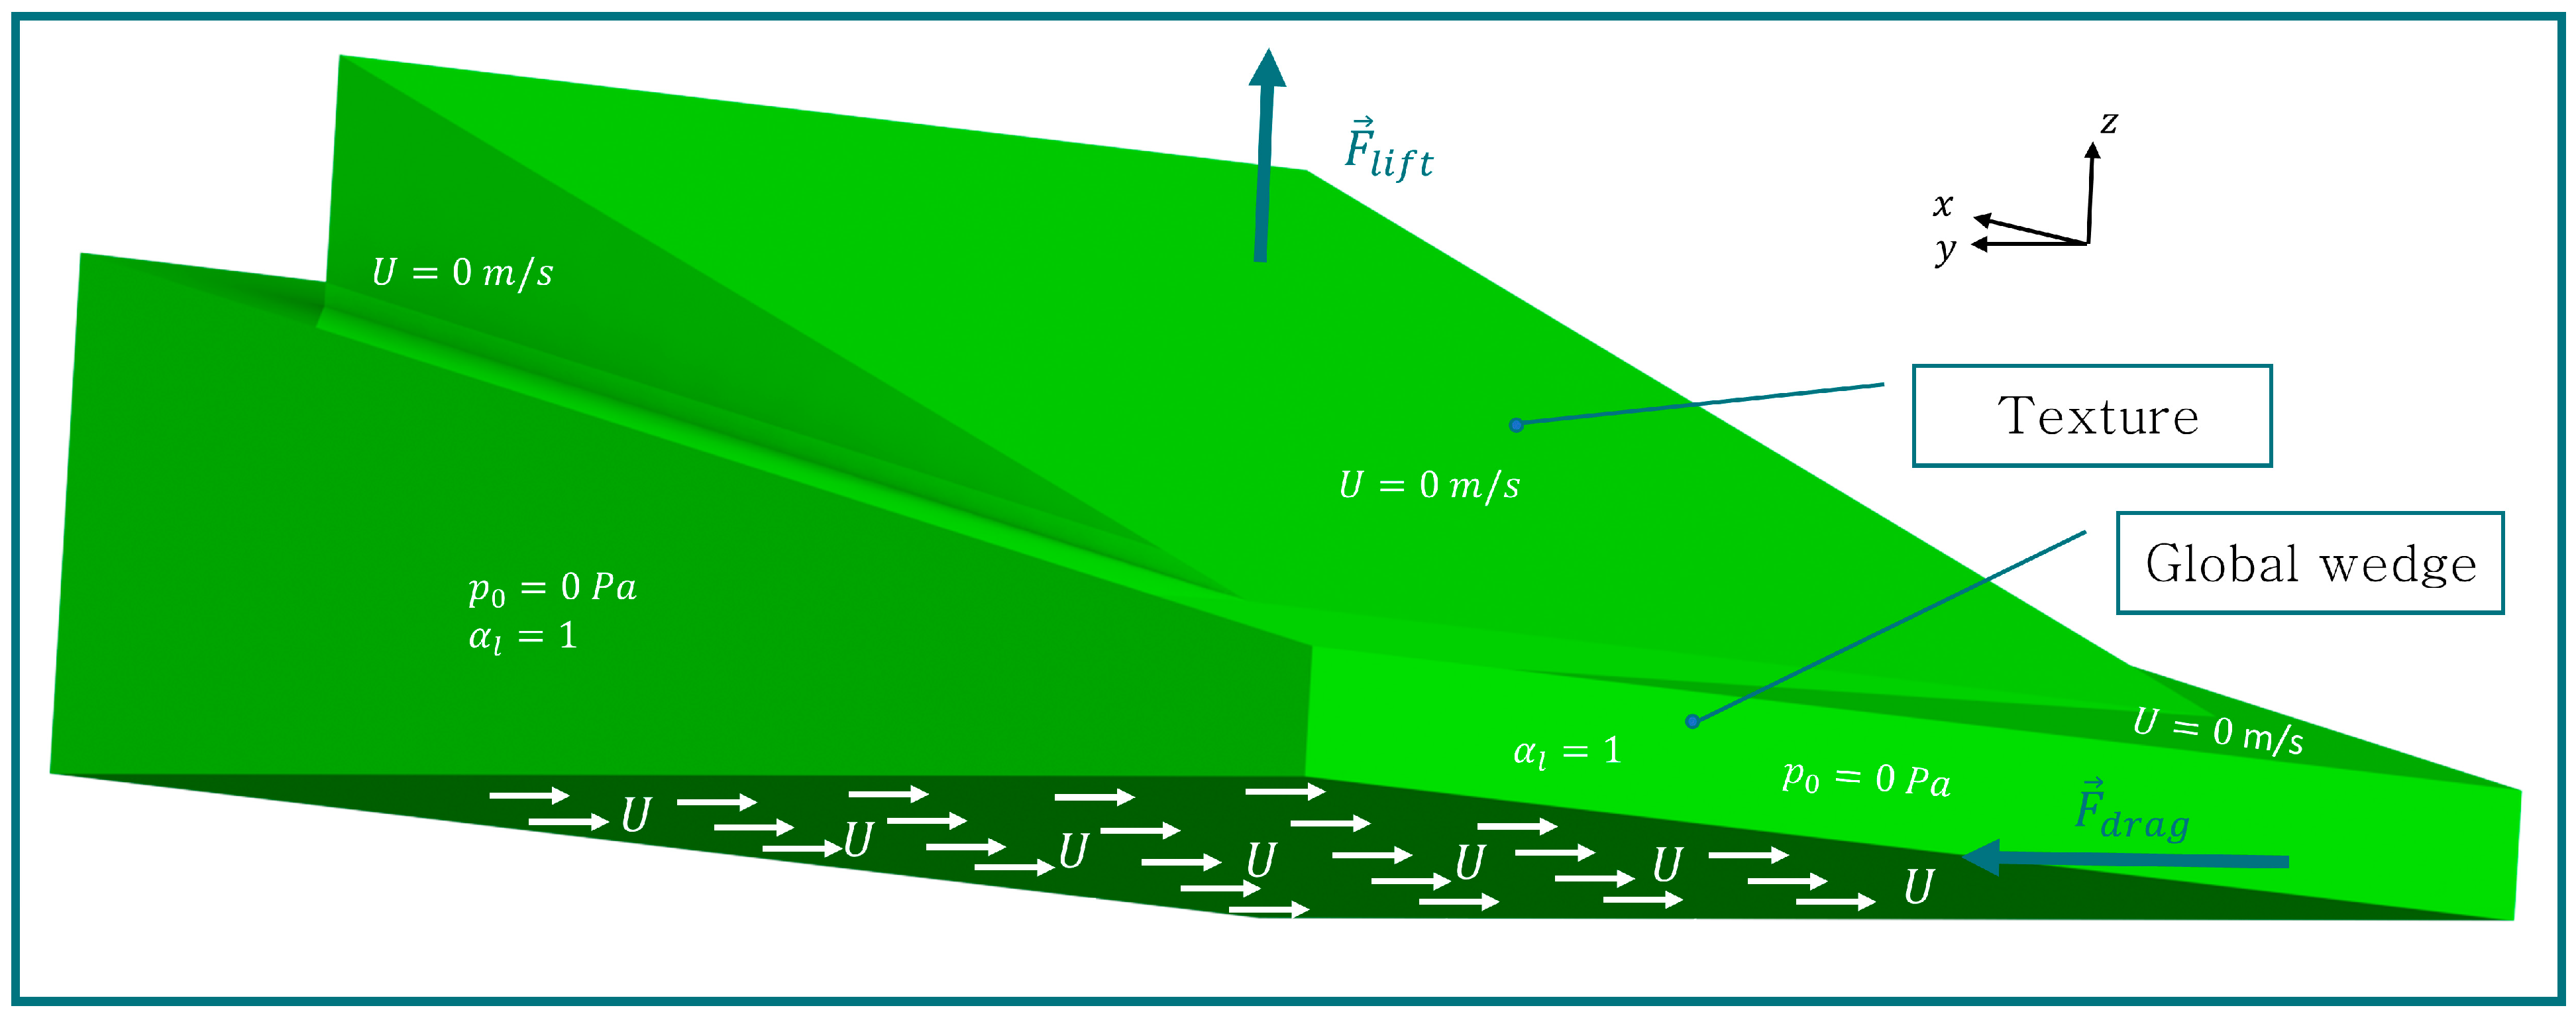
2.3. Simulation Methodology for Wedge-Shaped Textured Surfaces
3. Results
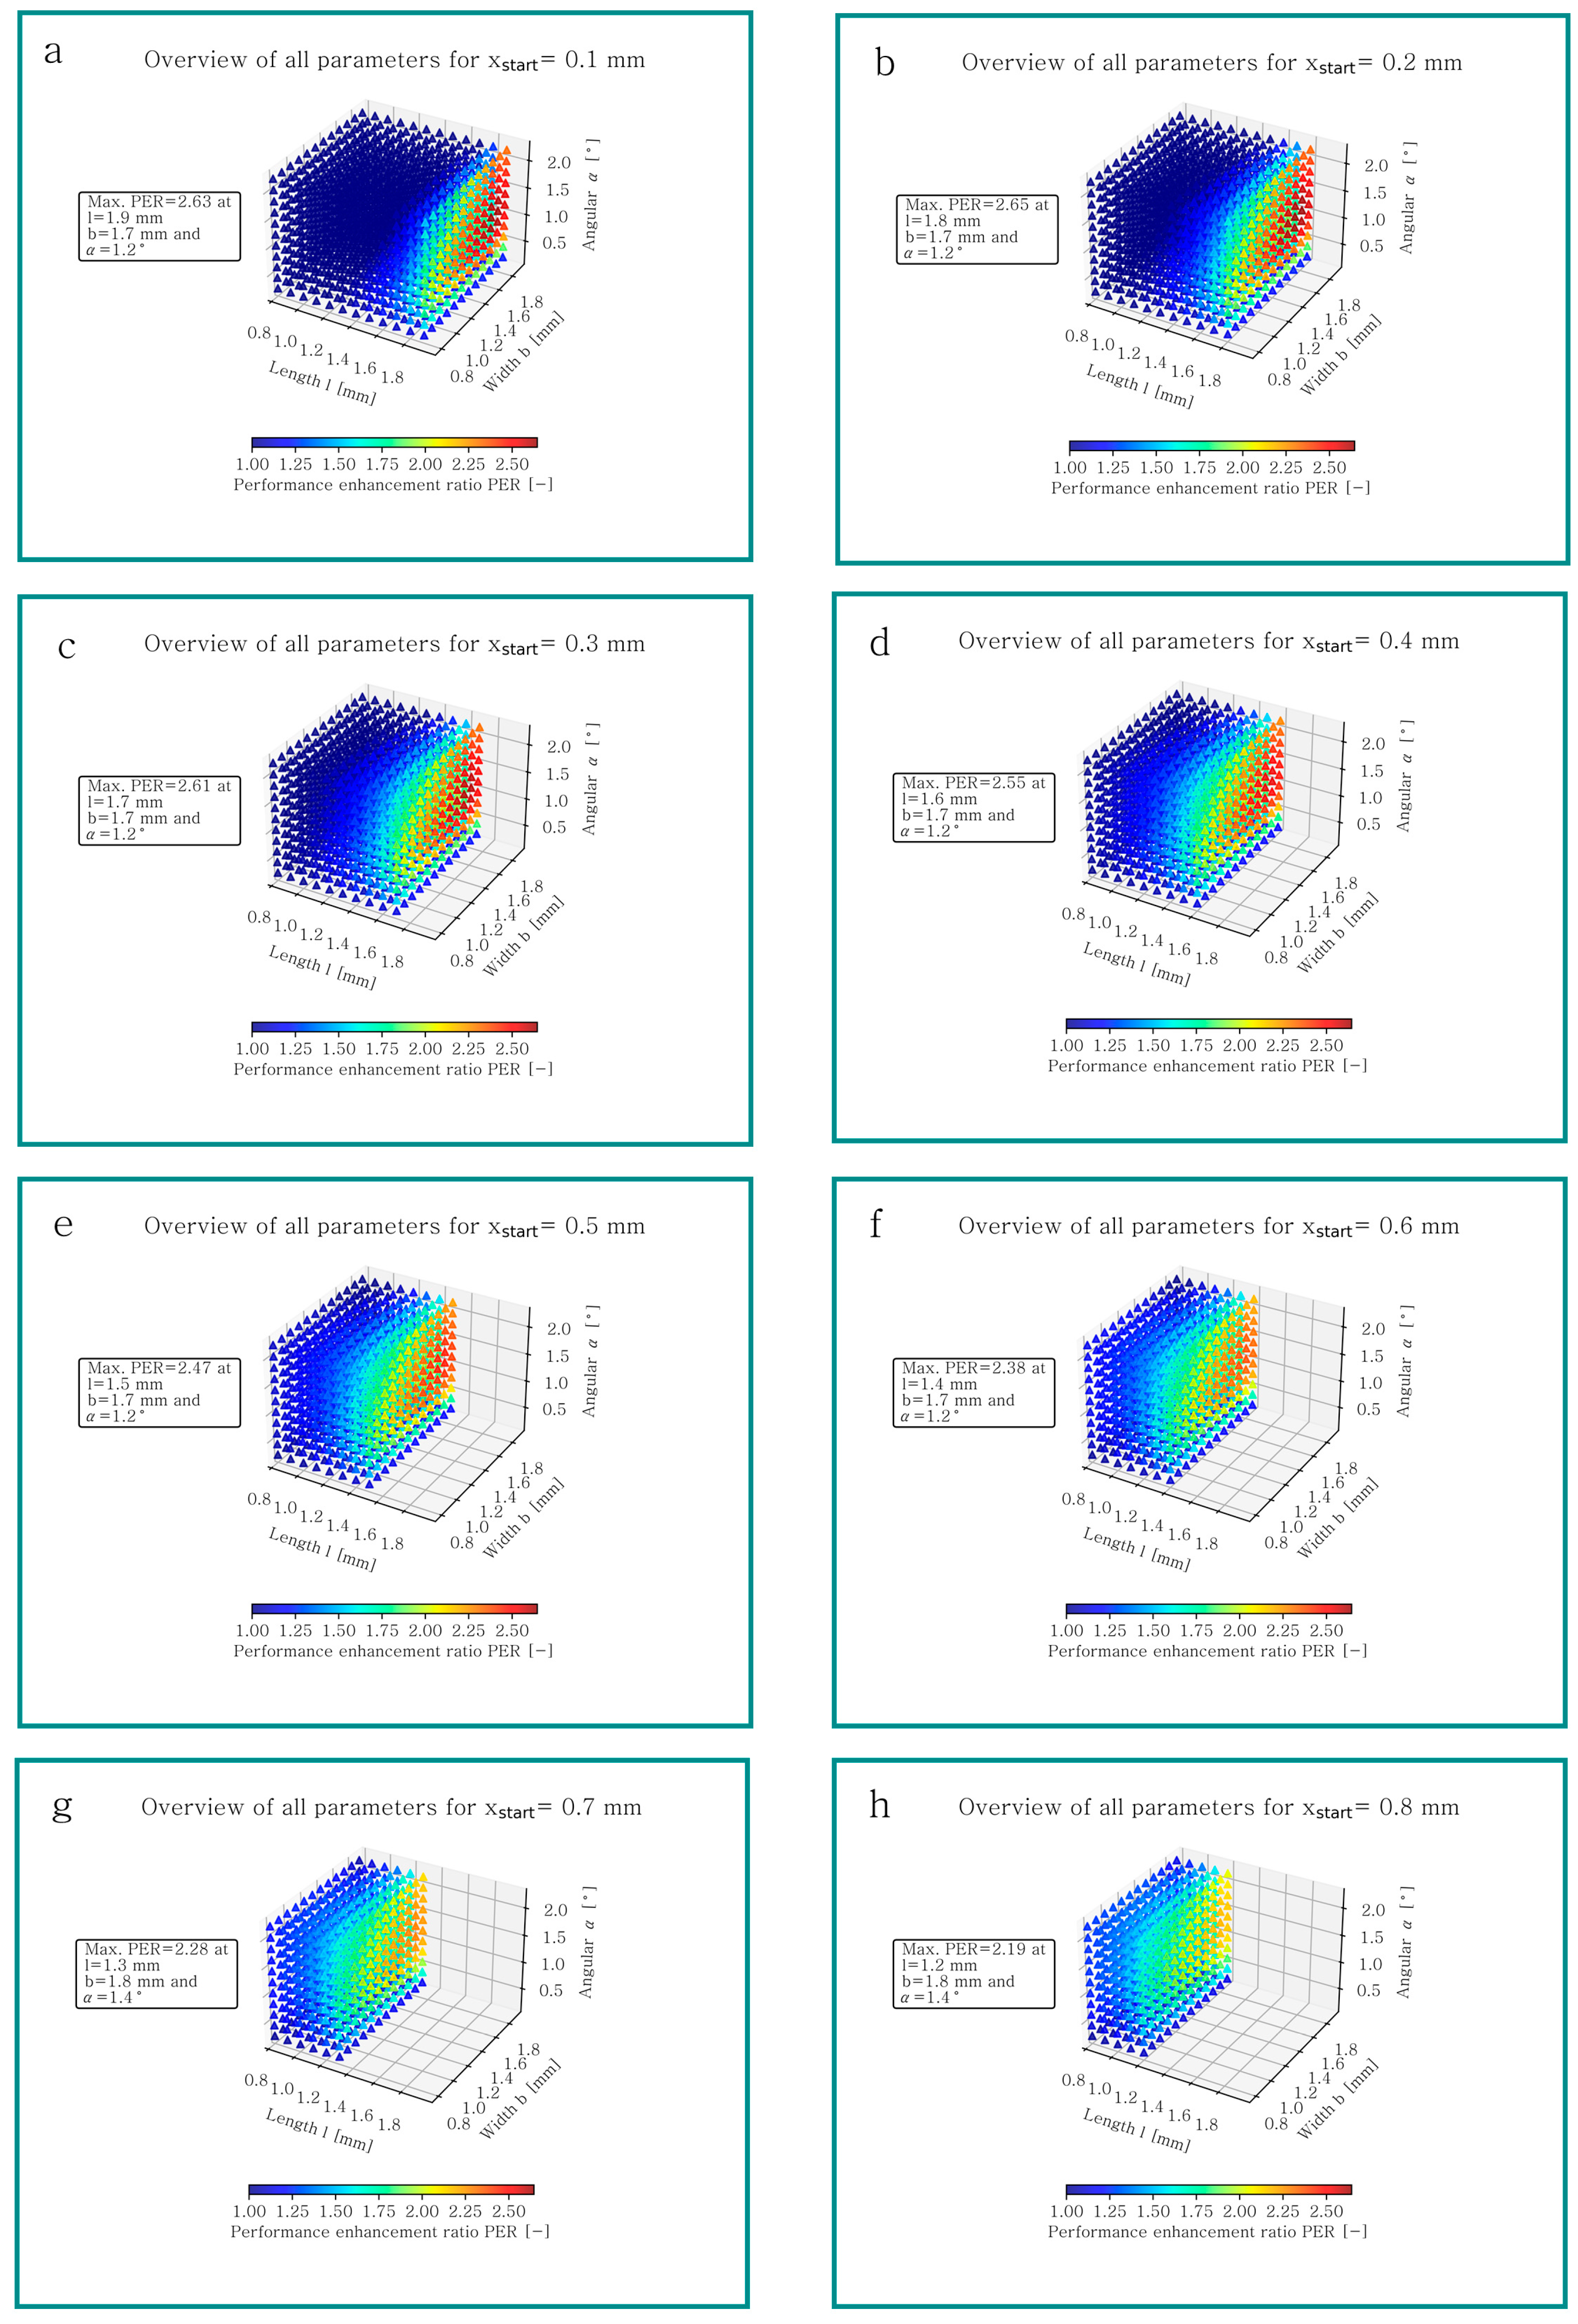
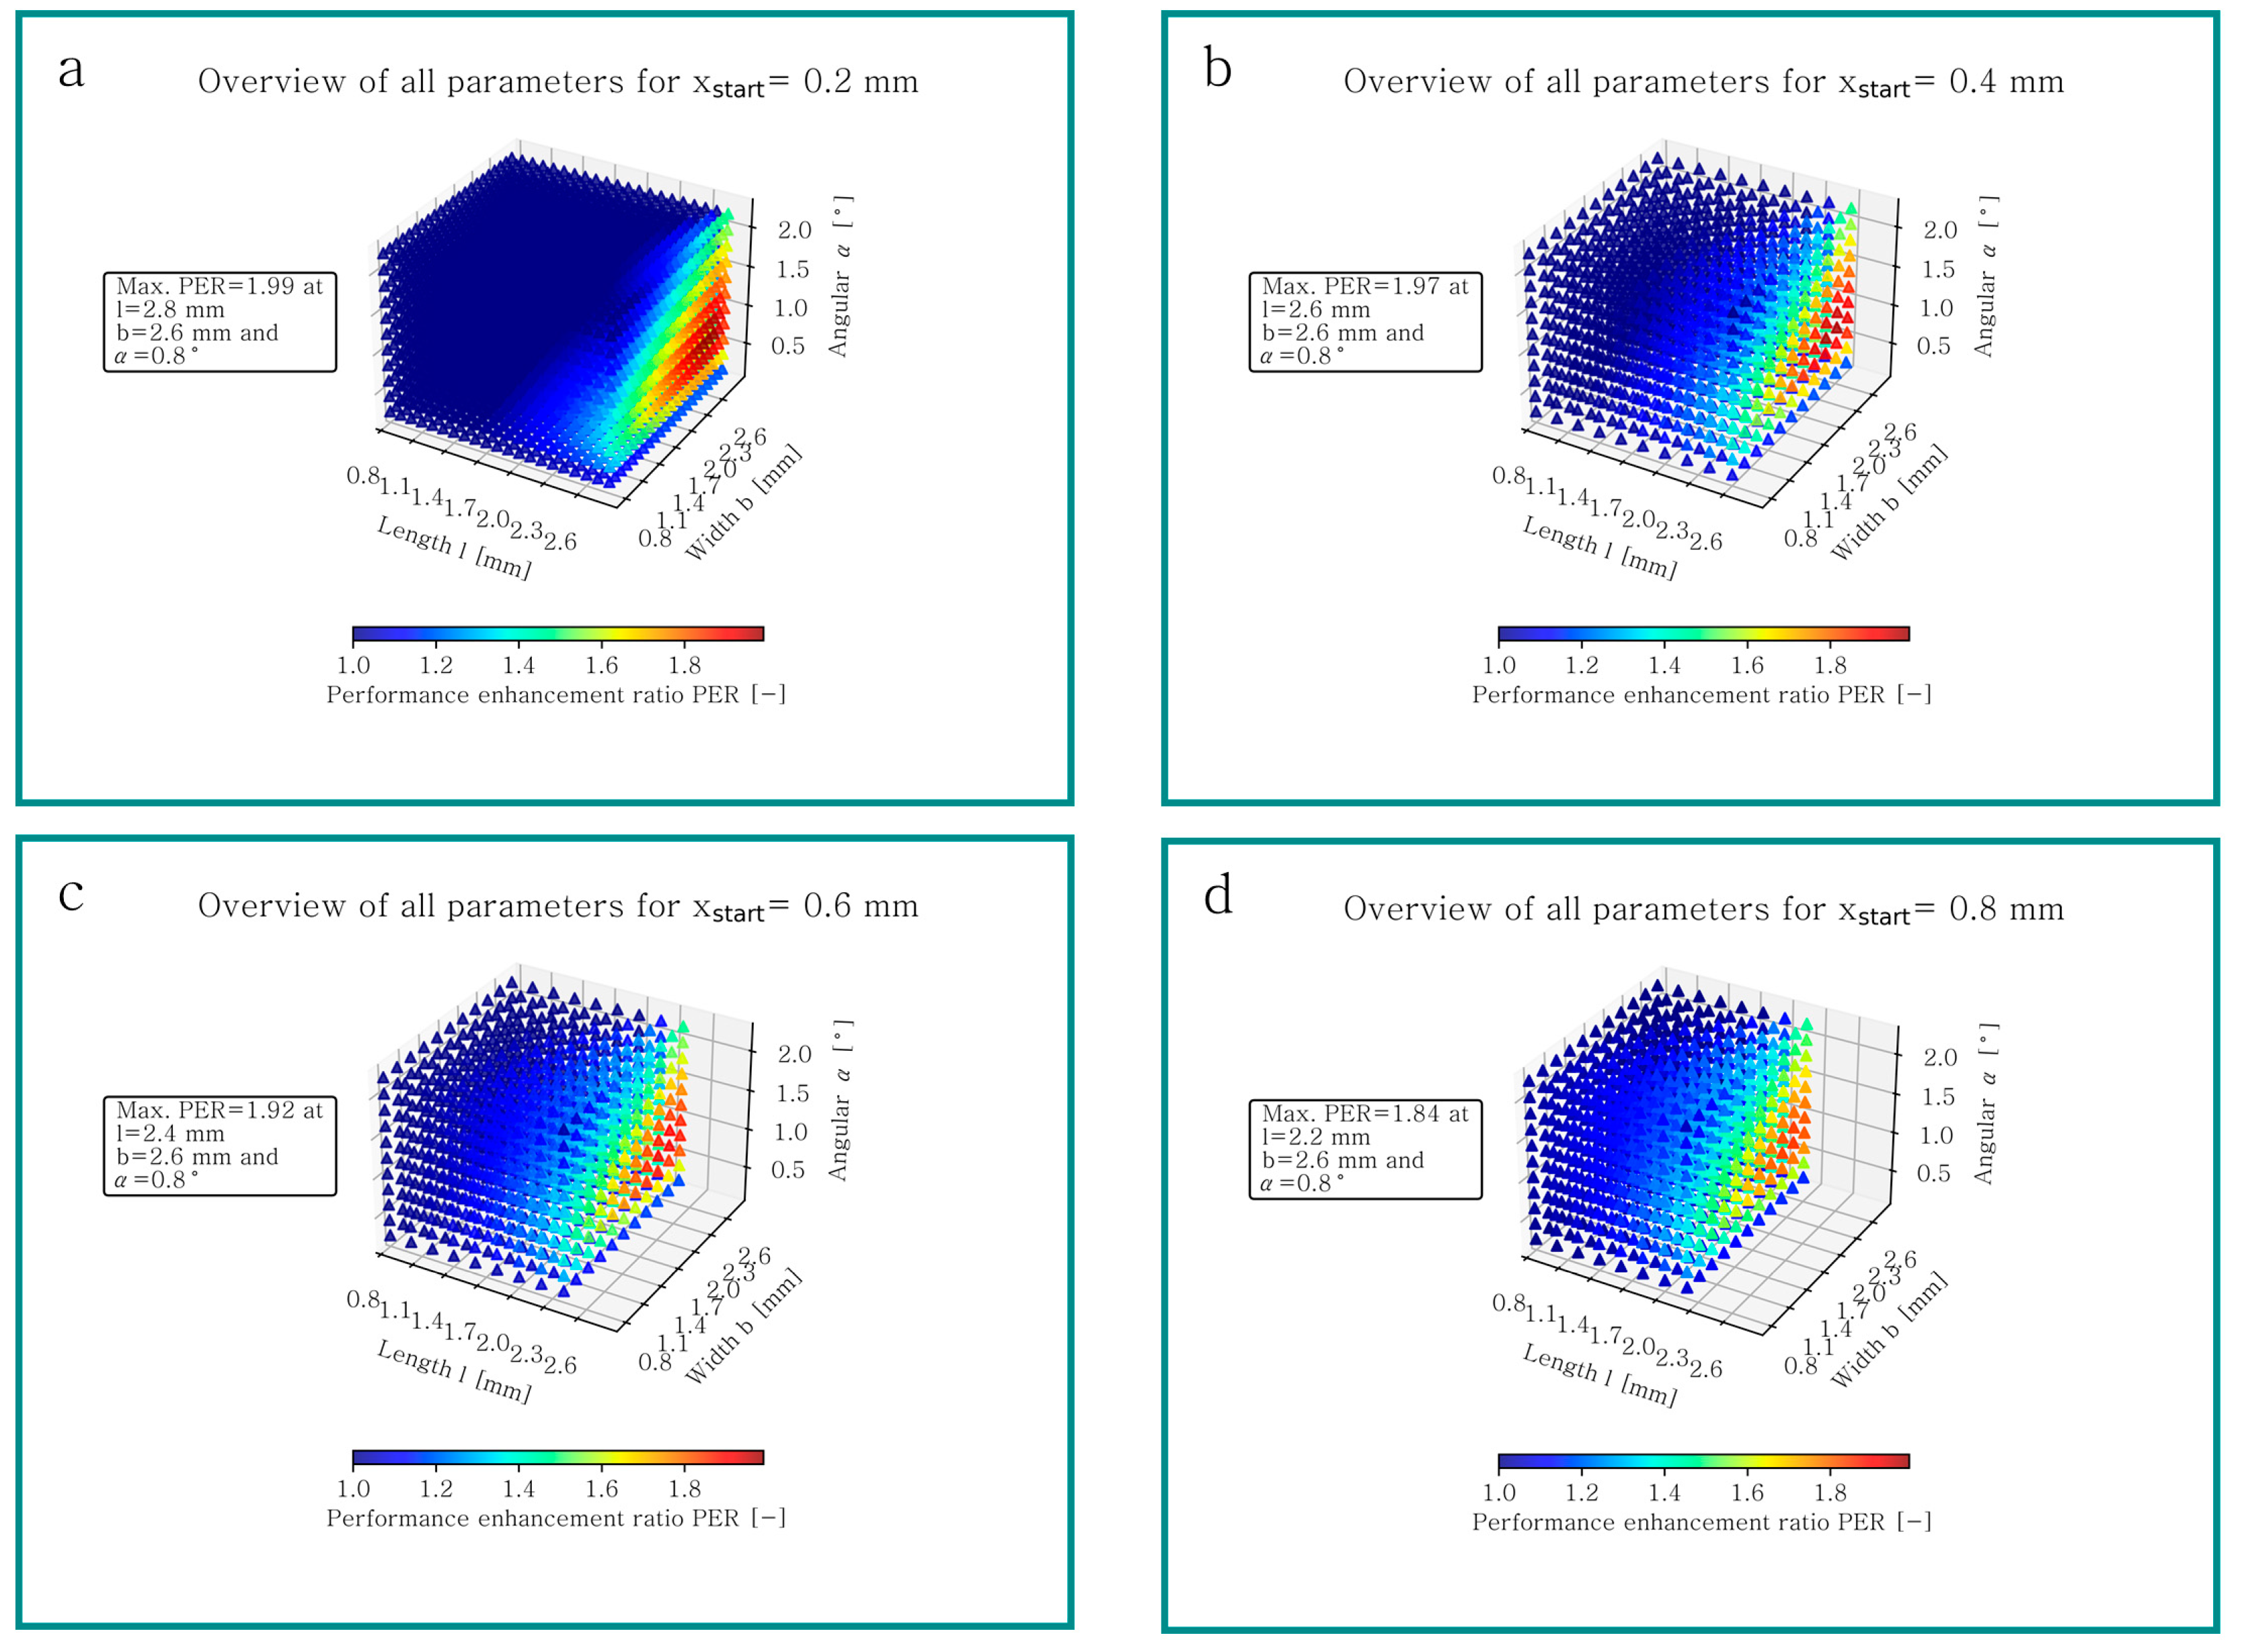
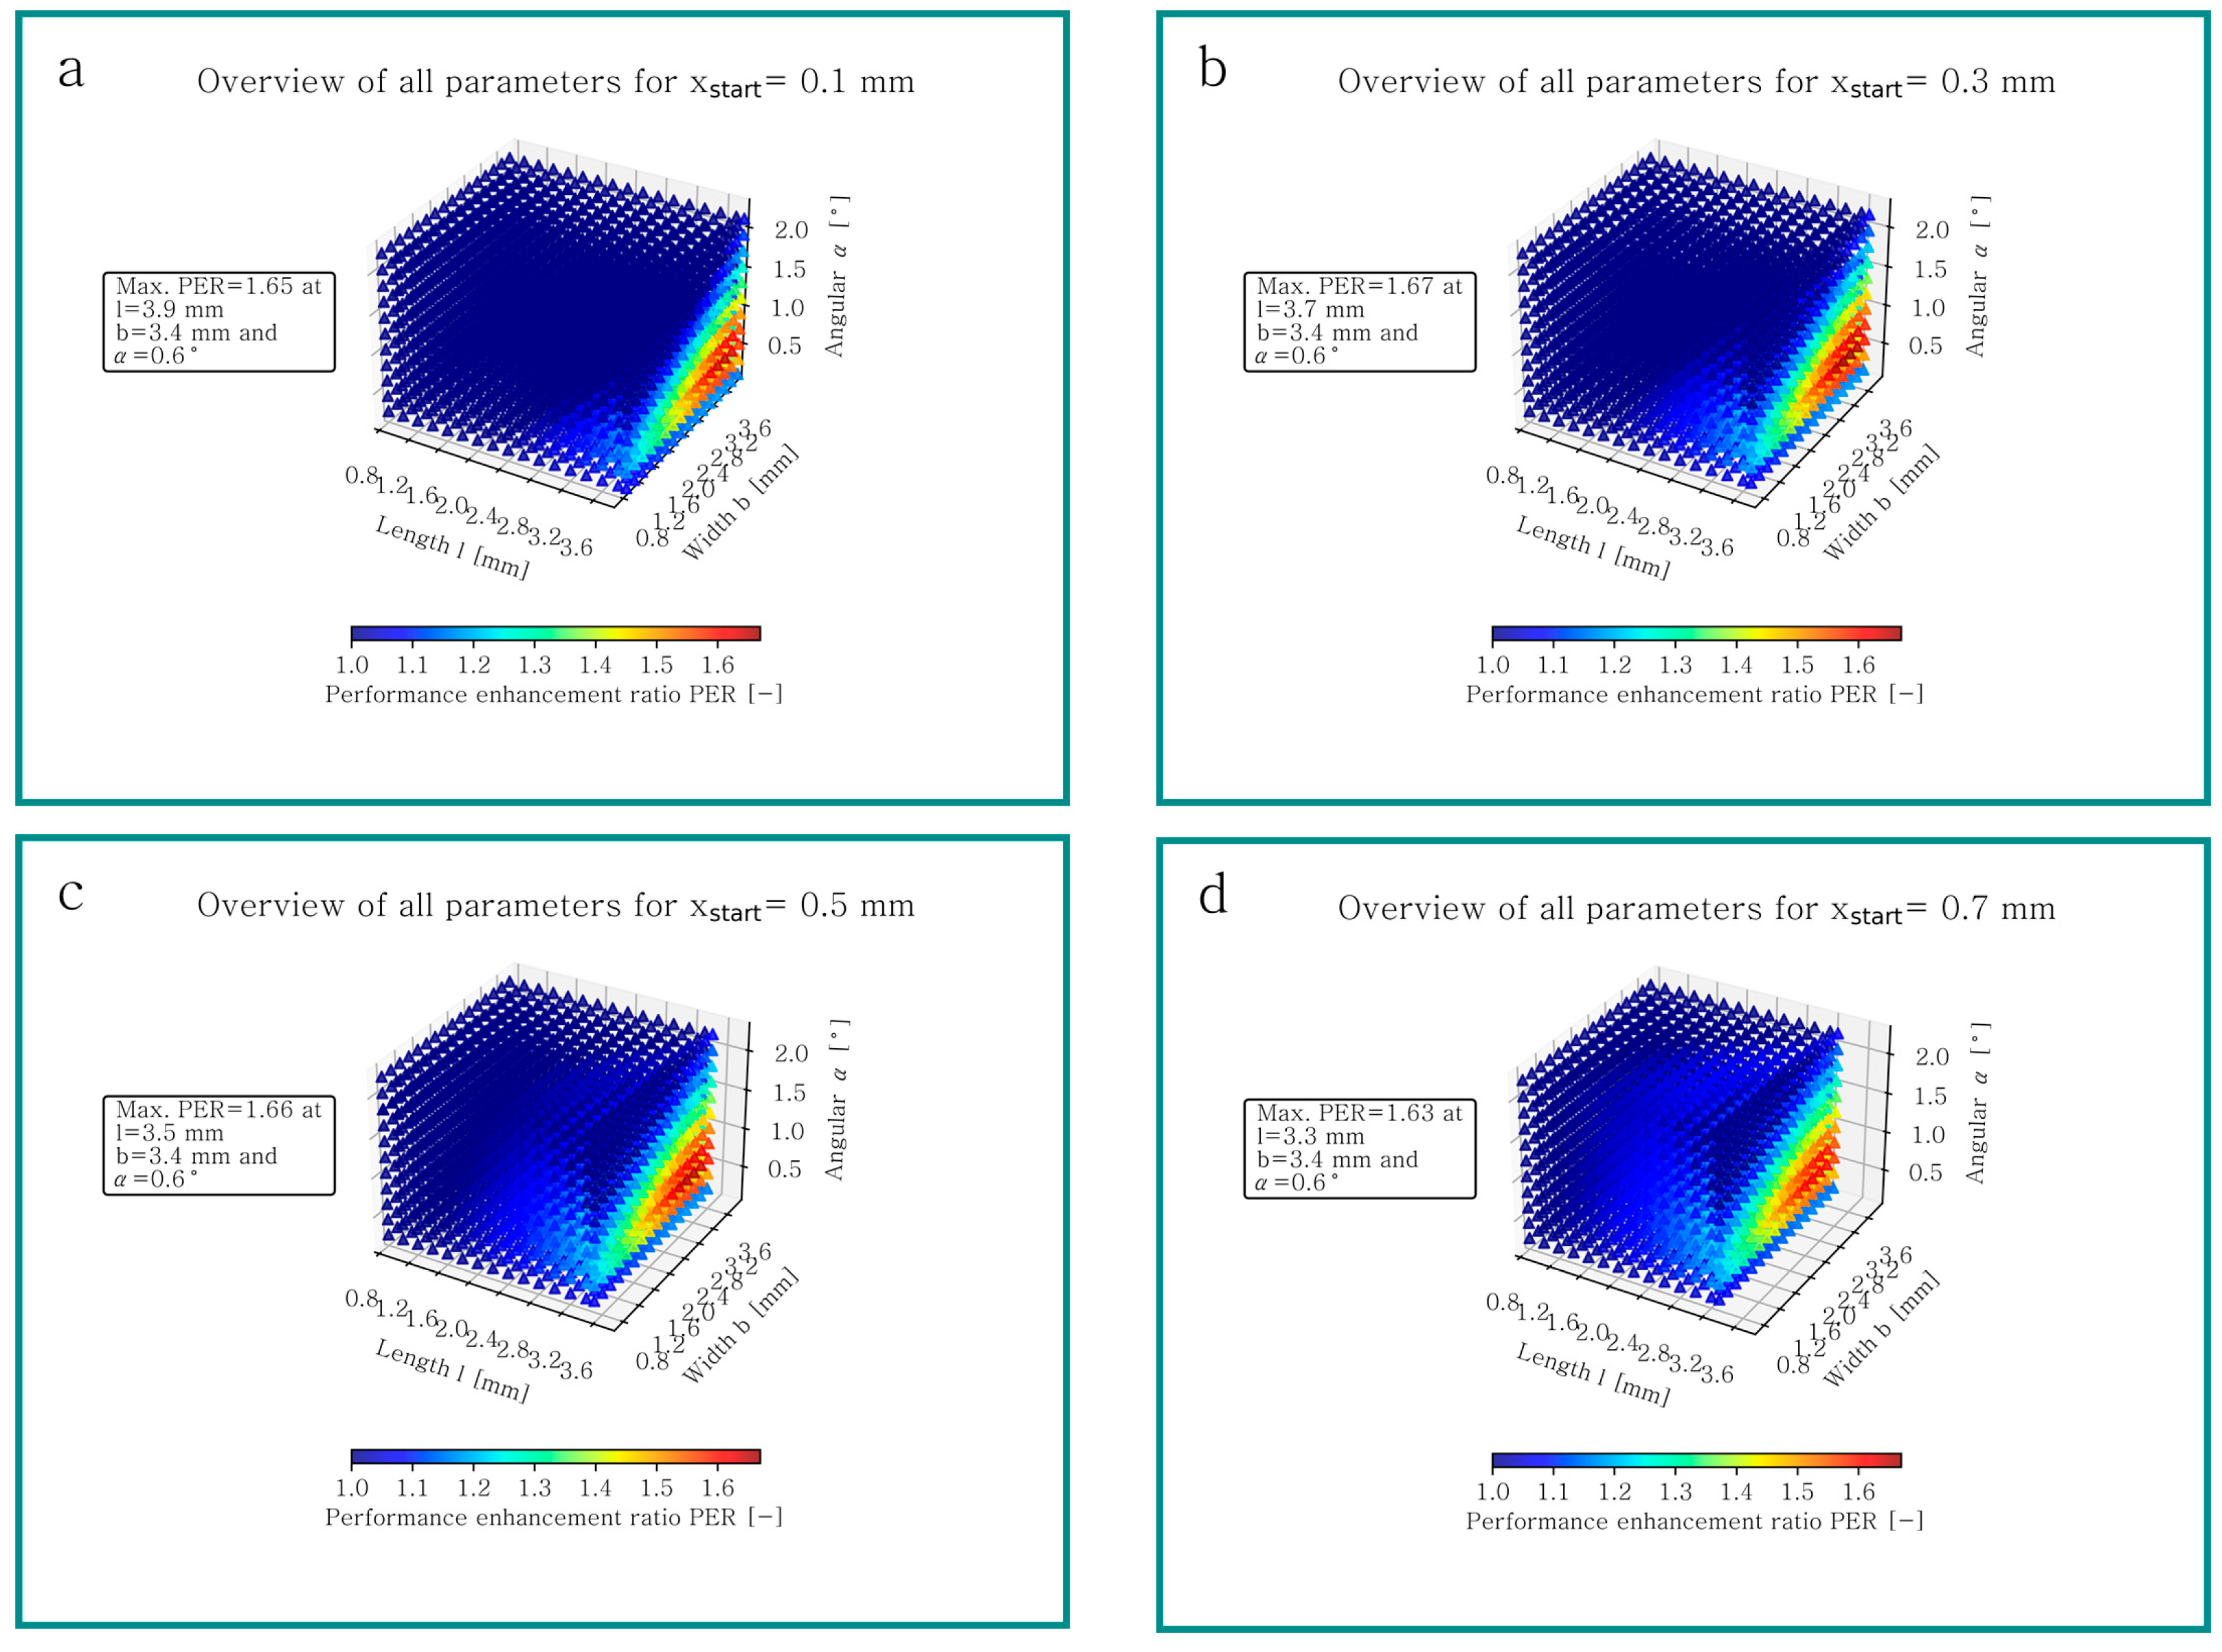
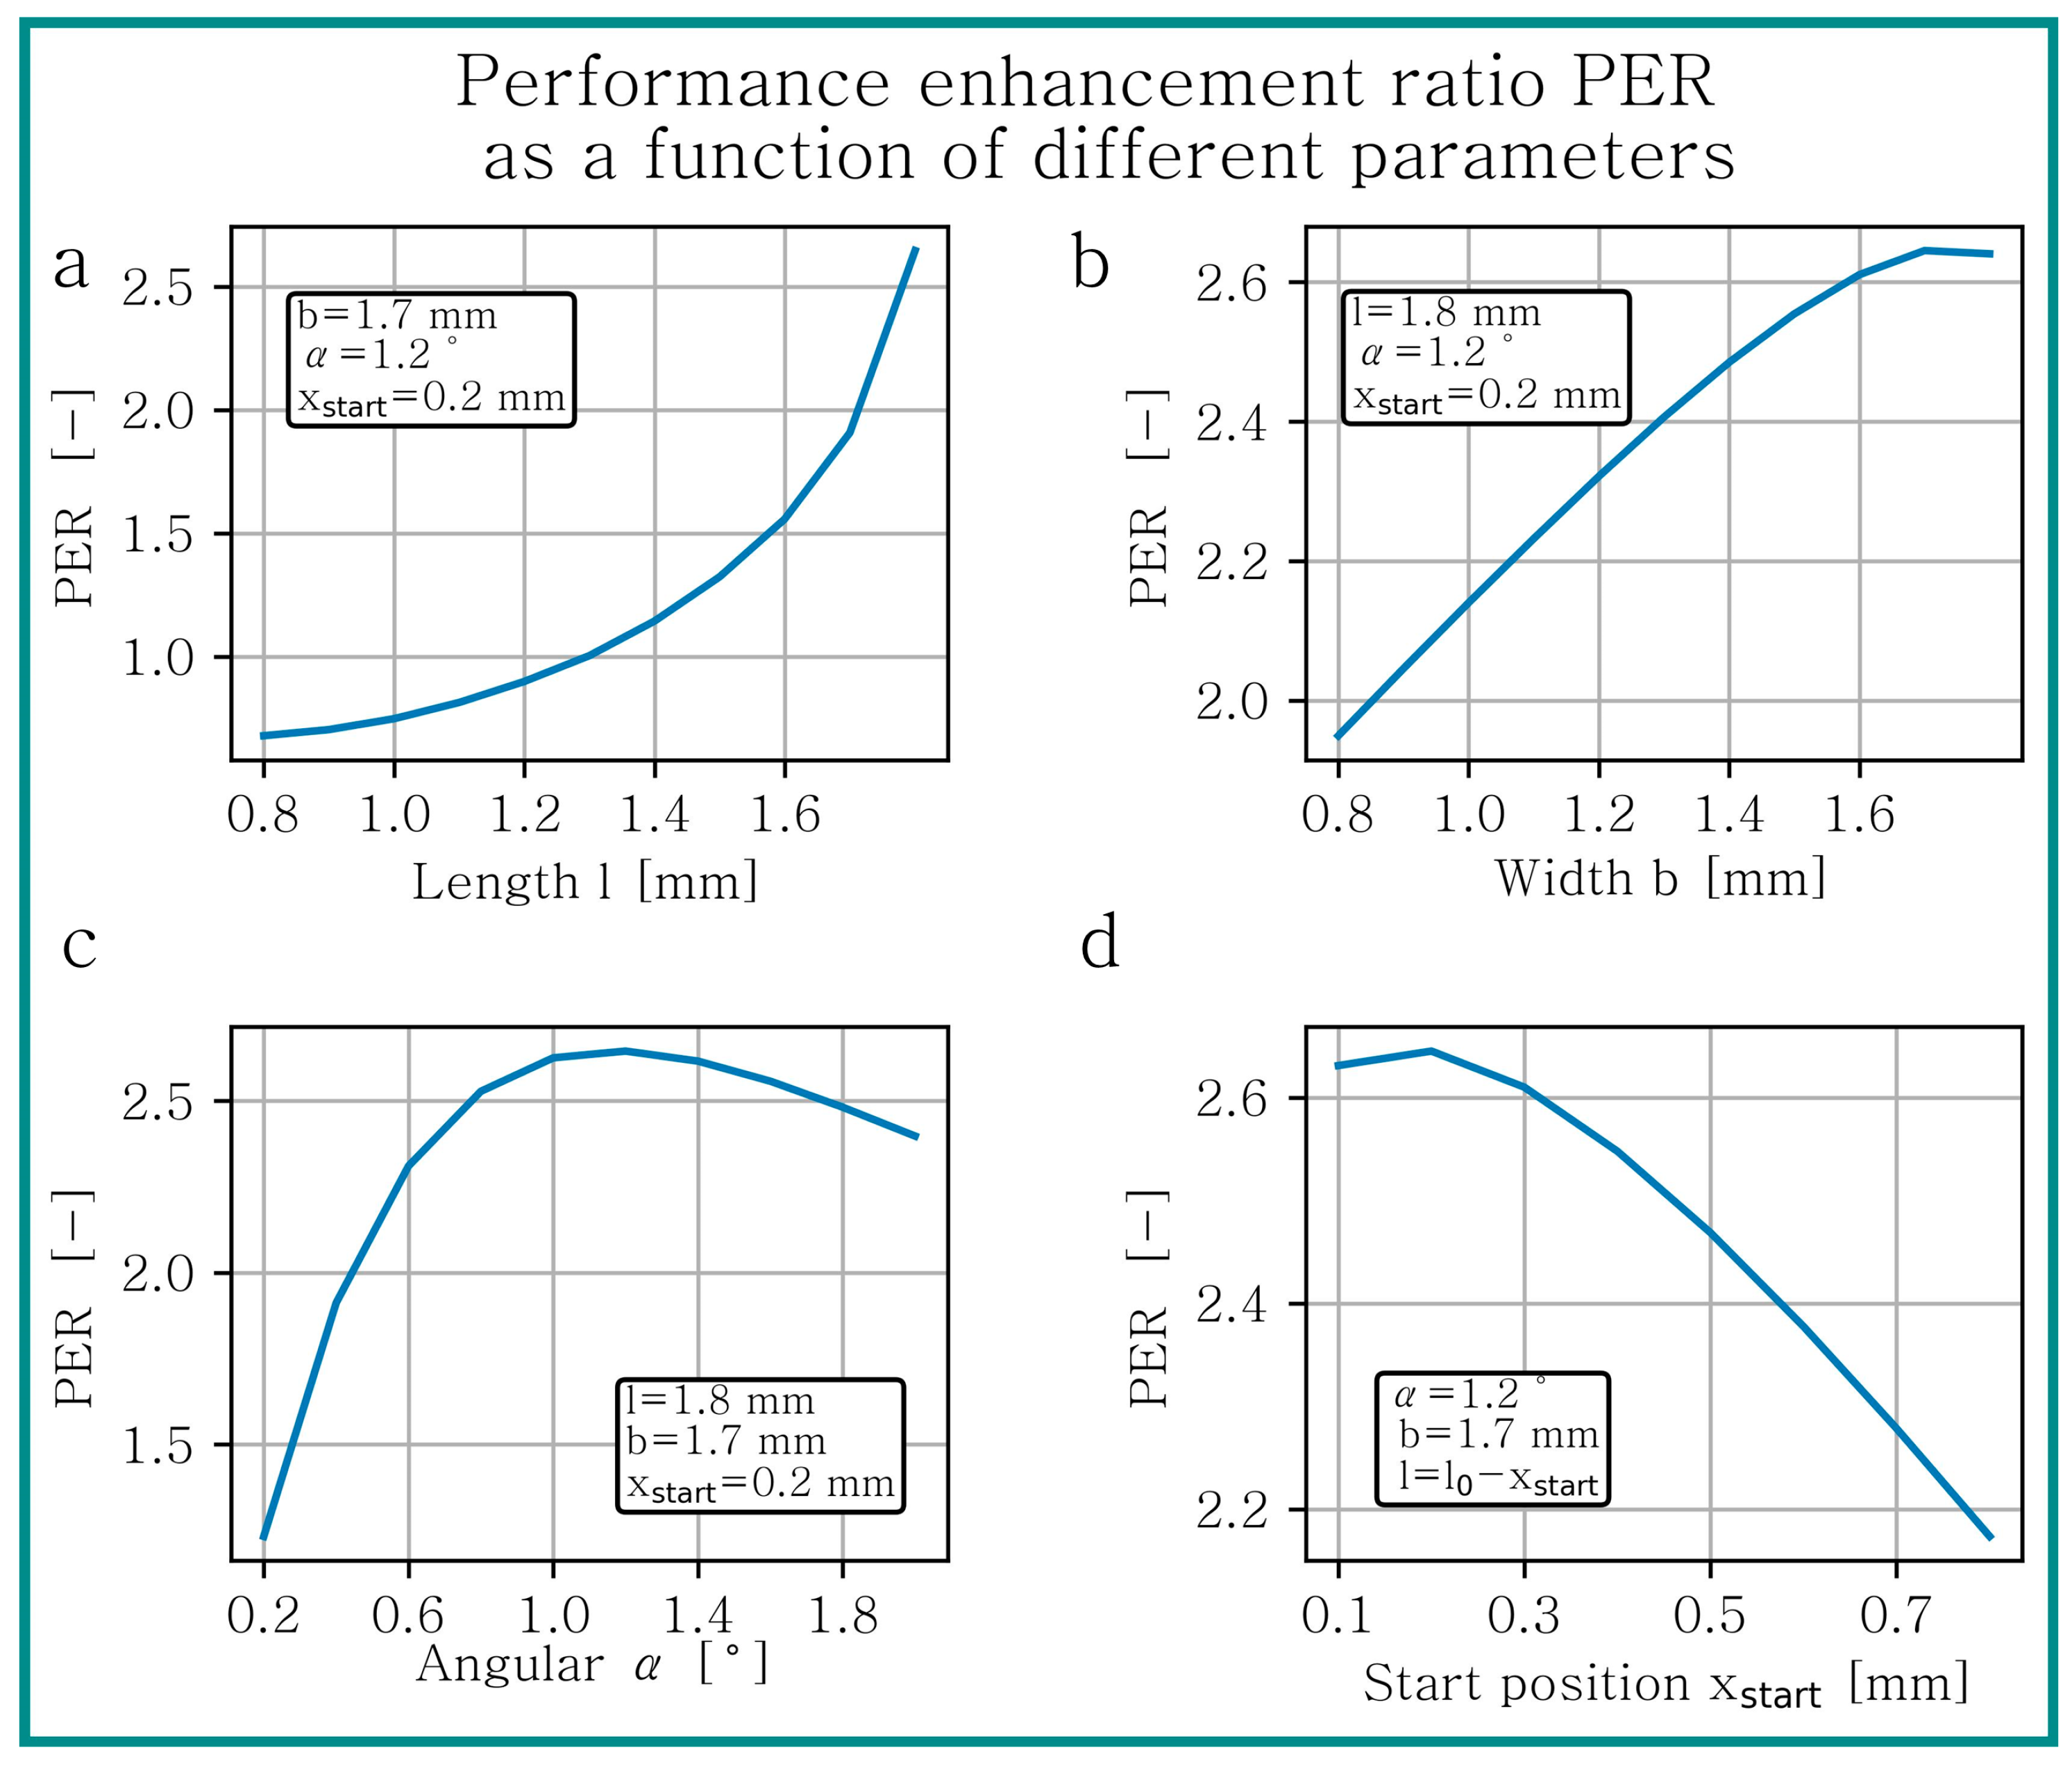
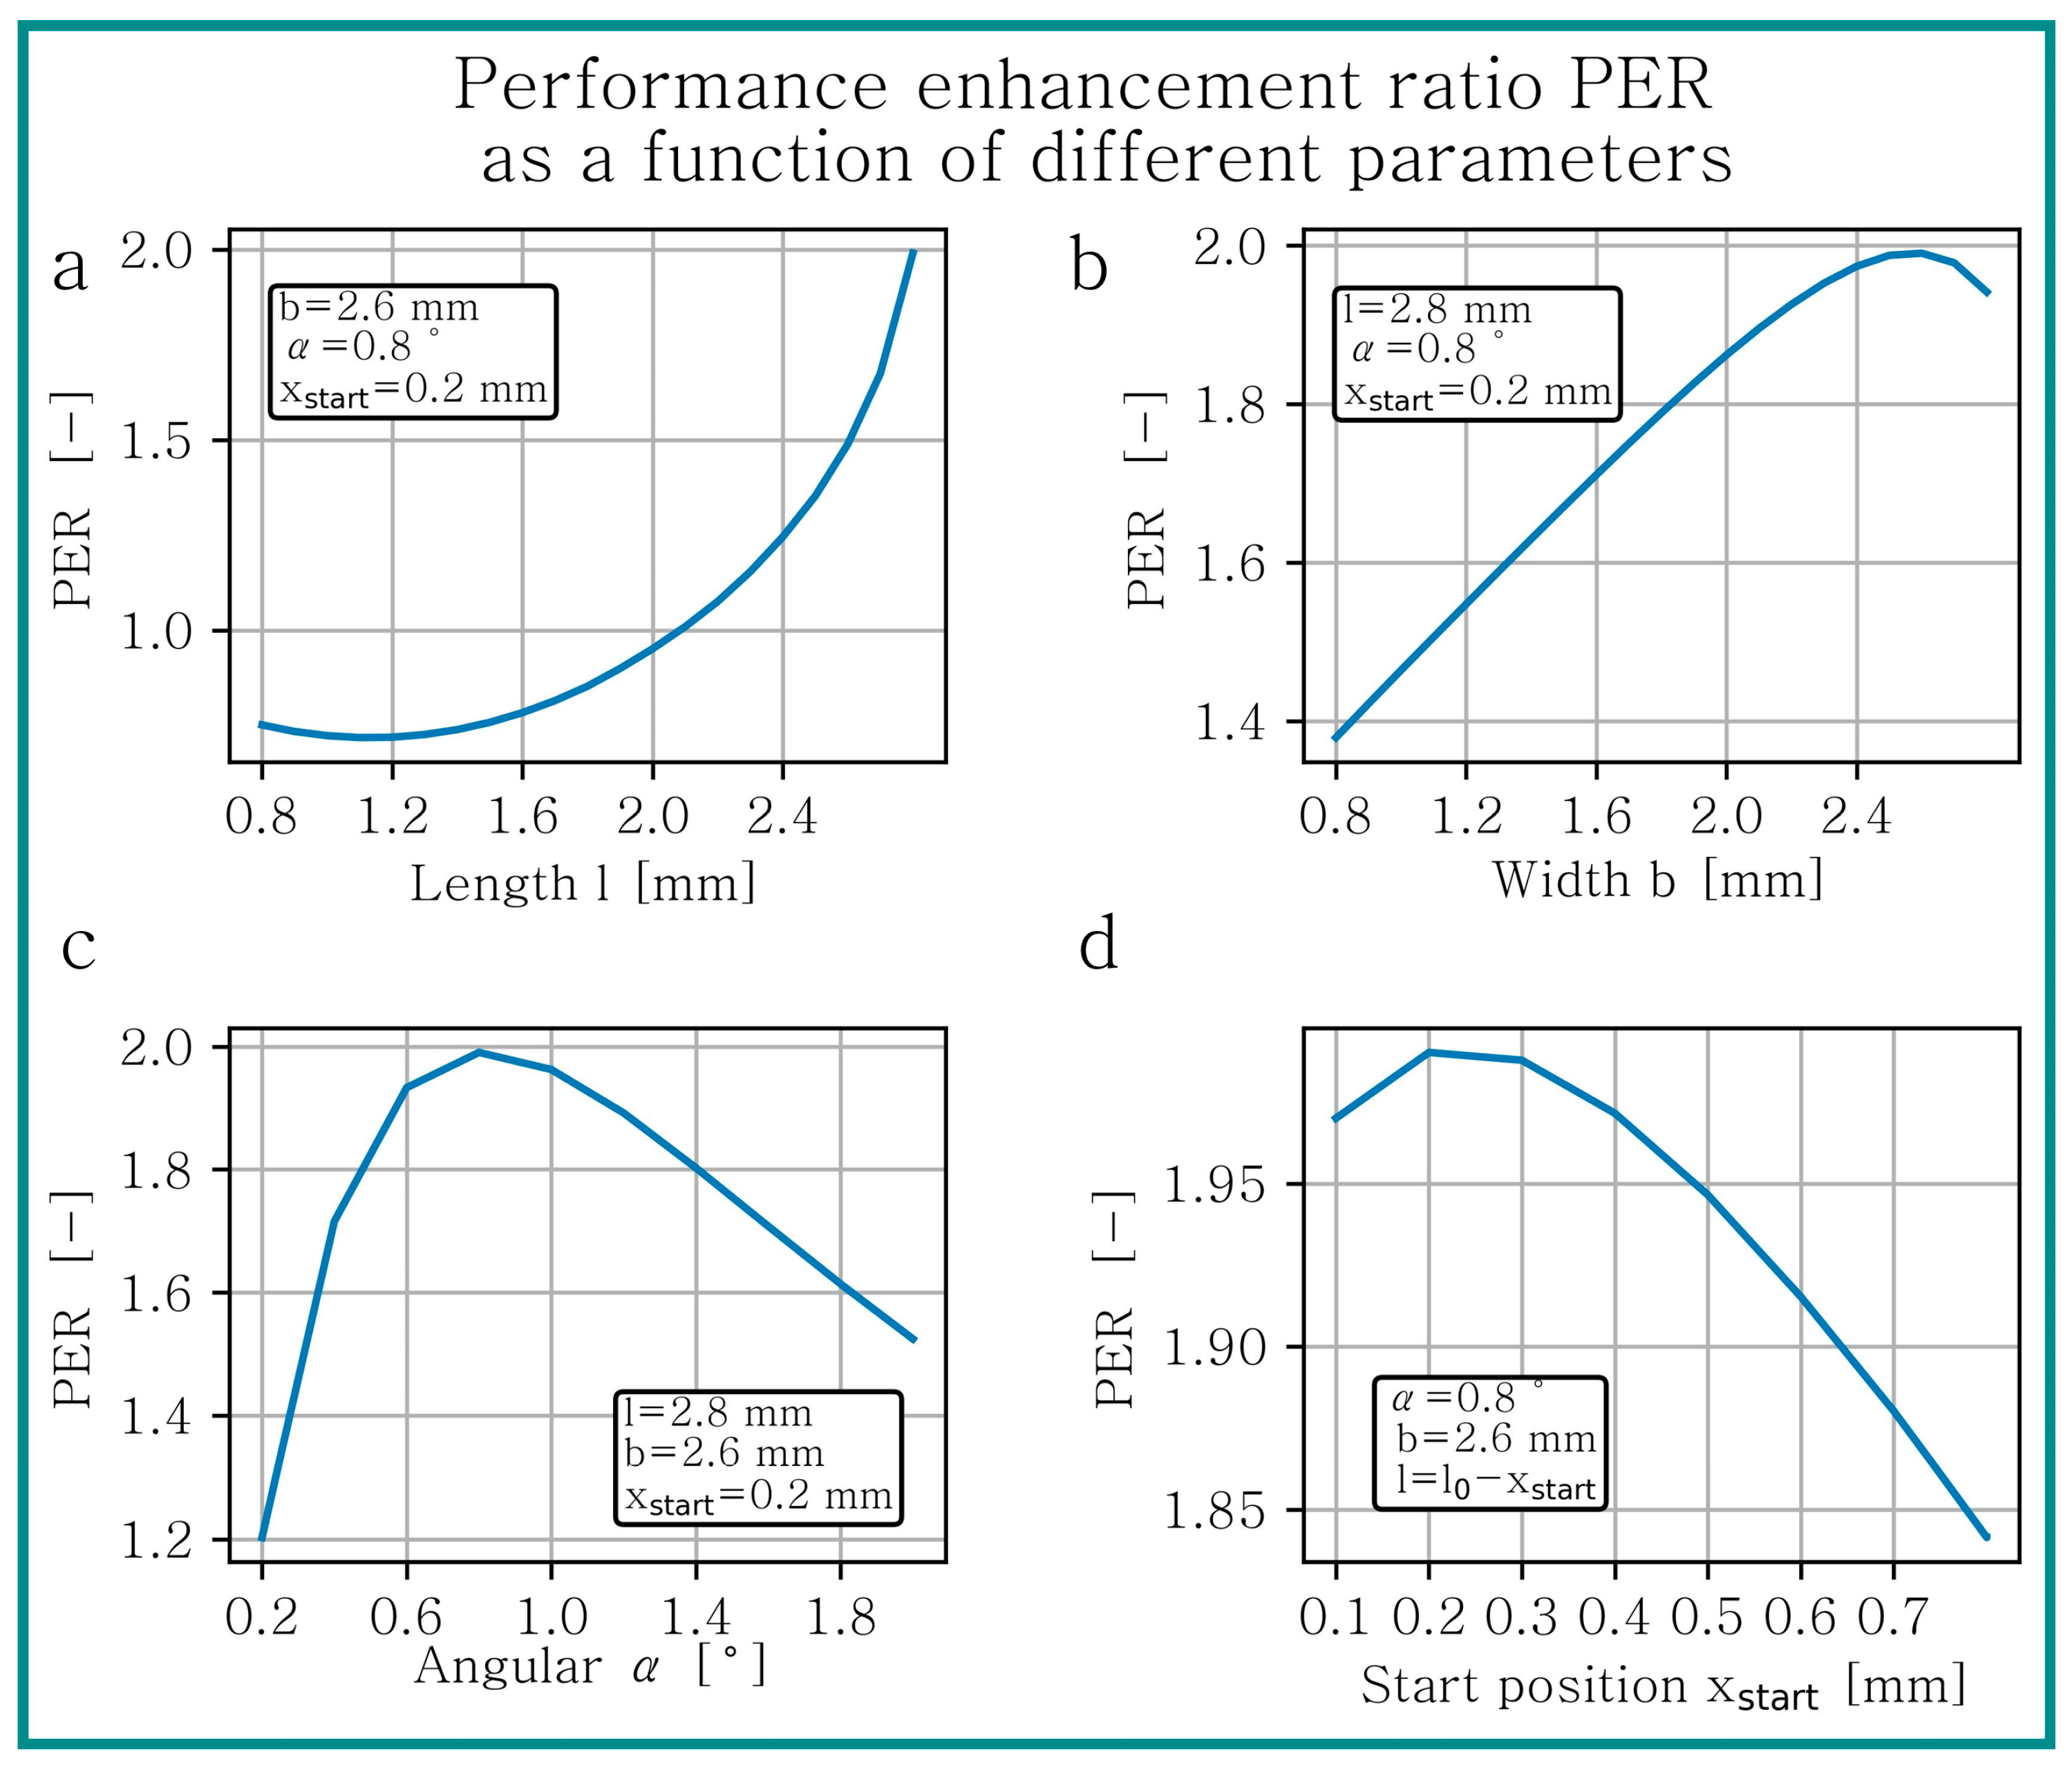
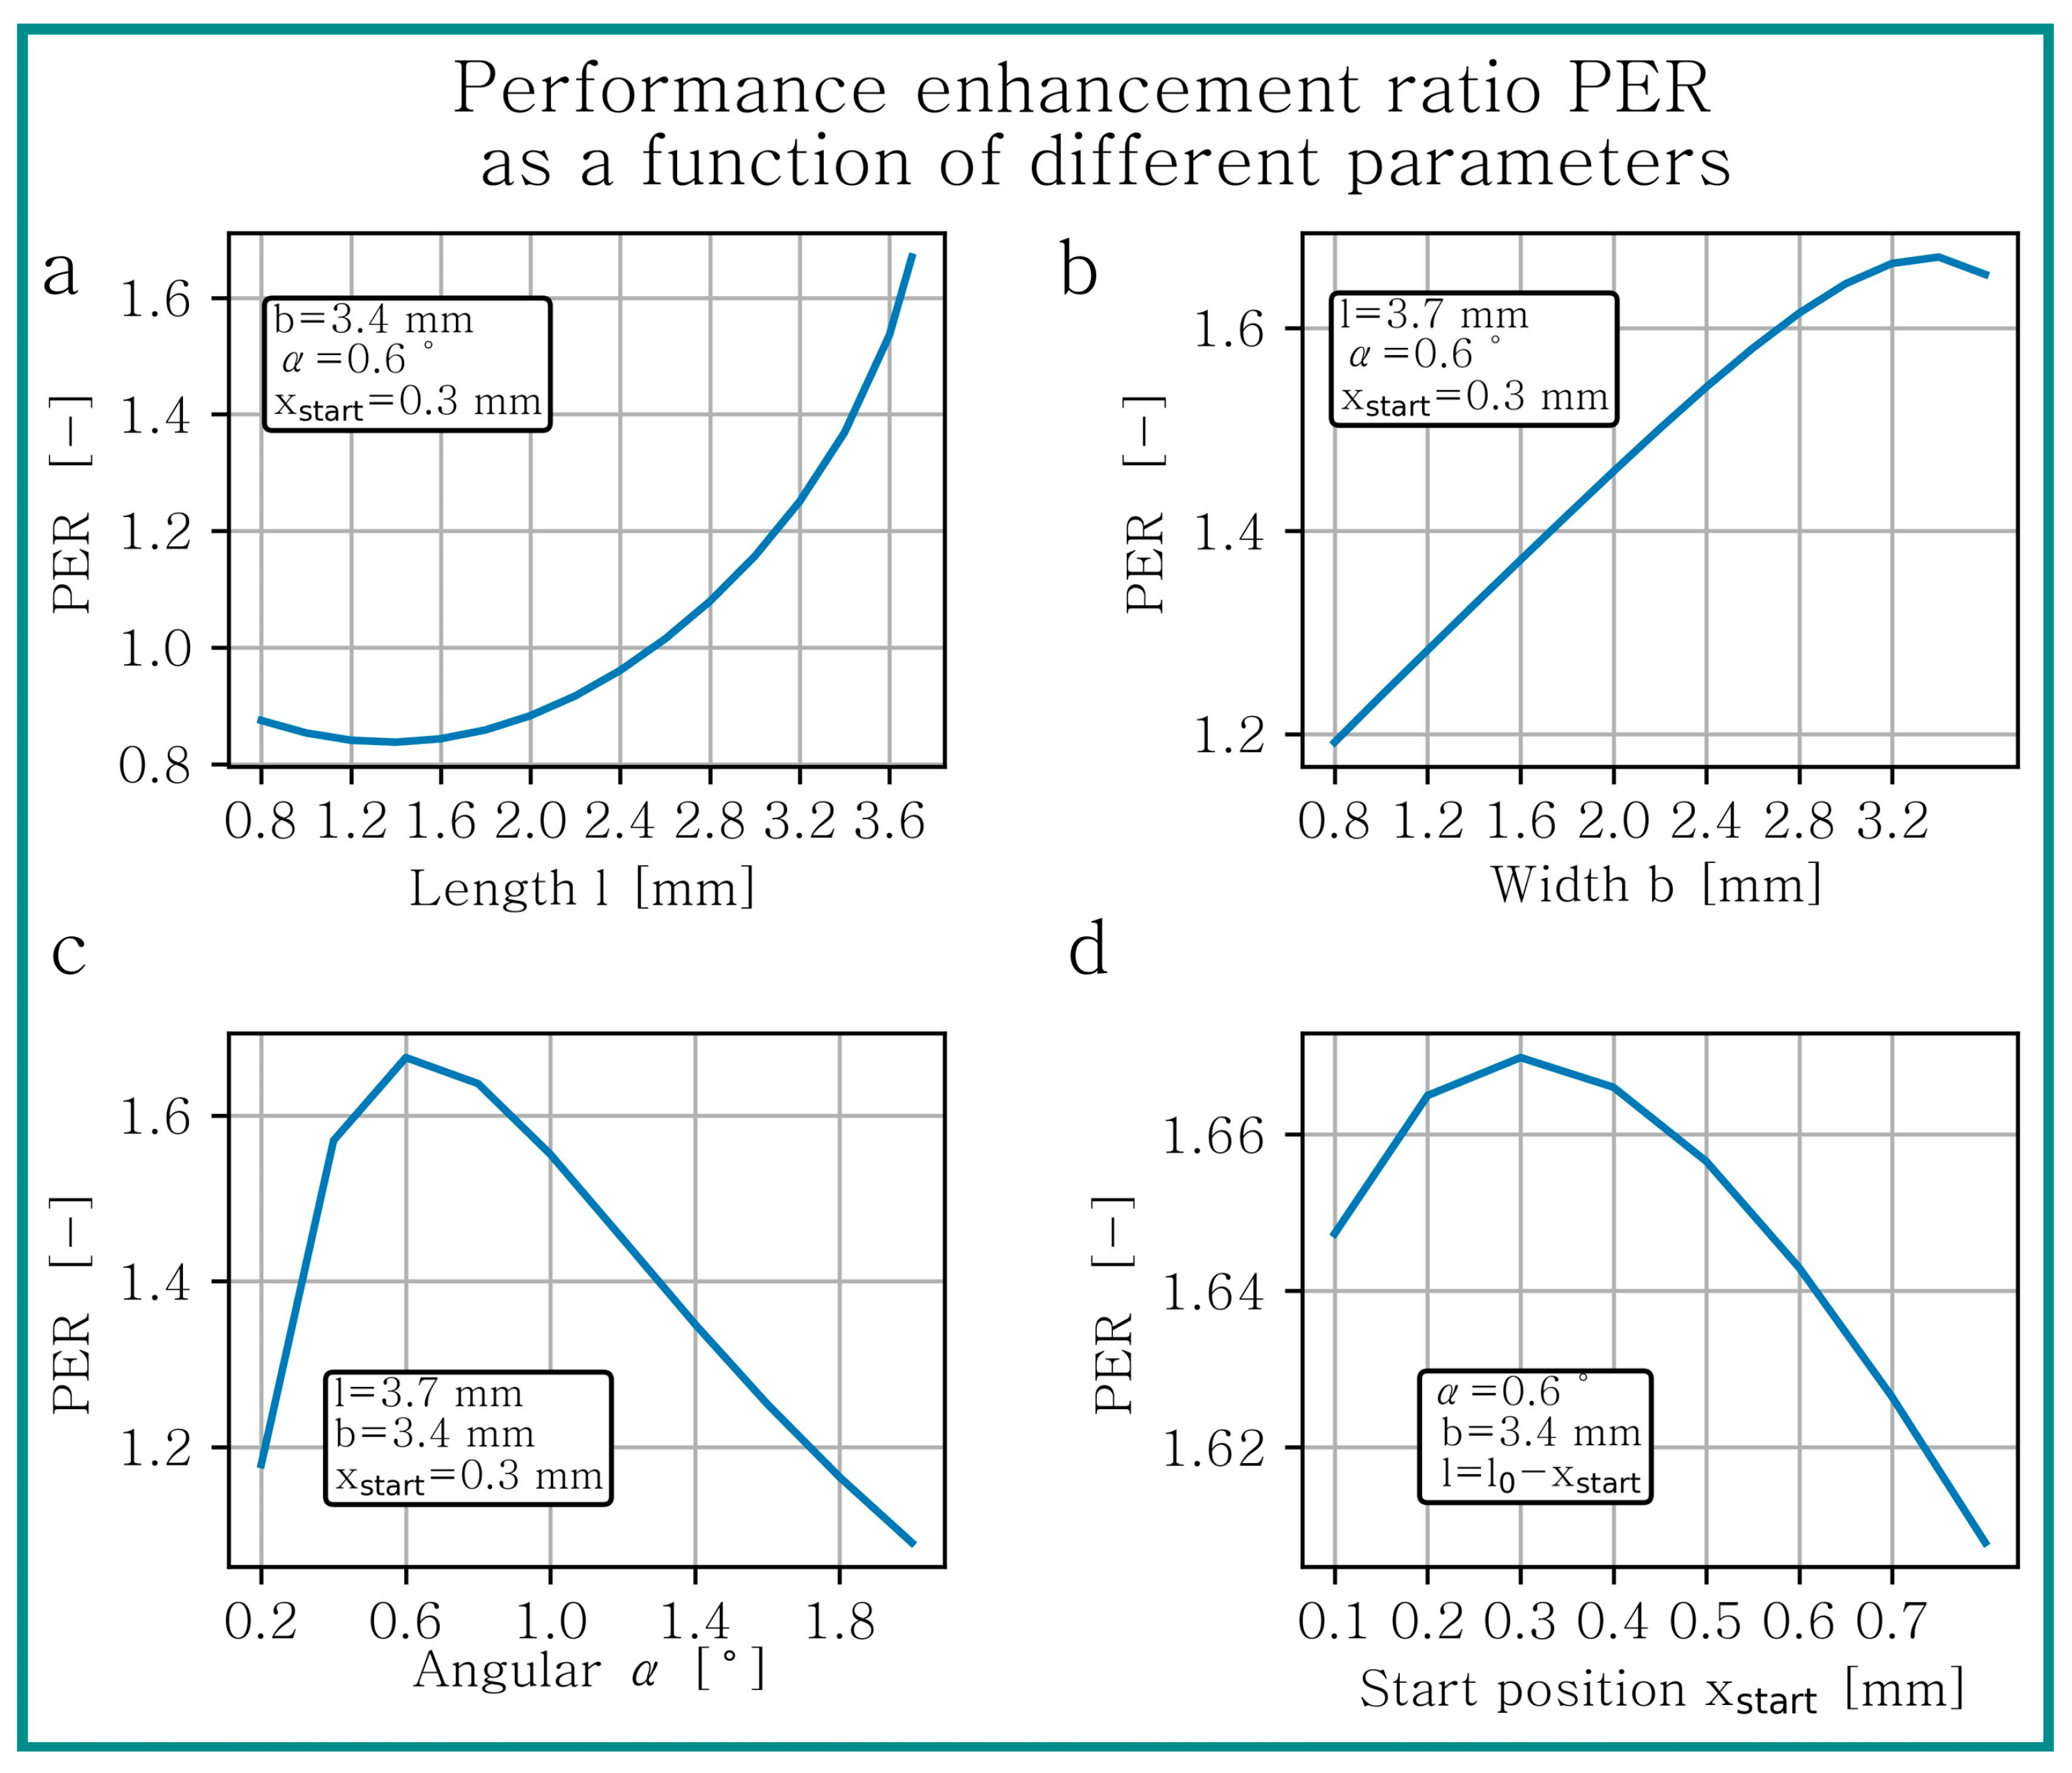
3.1. Analysis of Variation Parameters Depending on PER
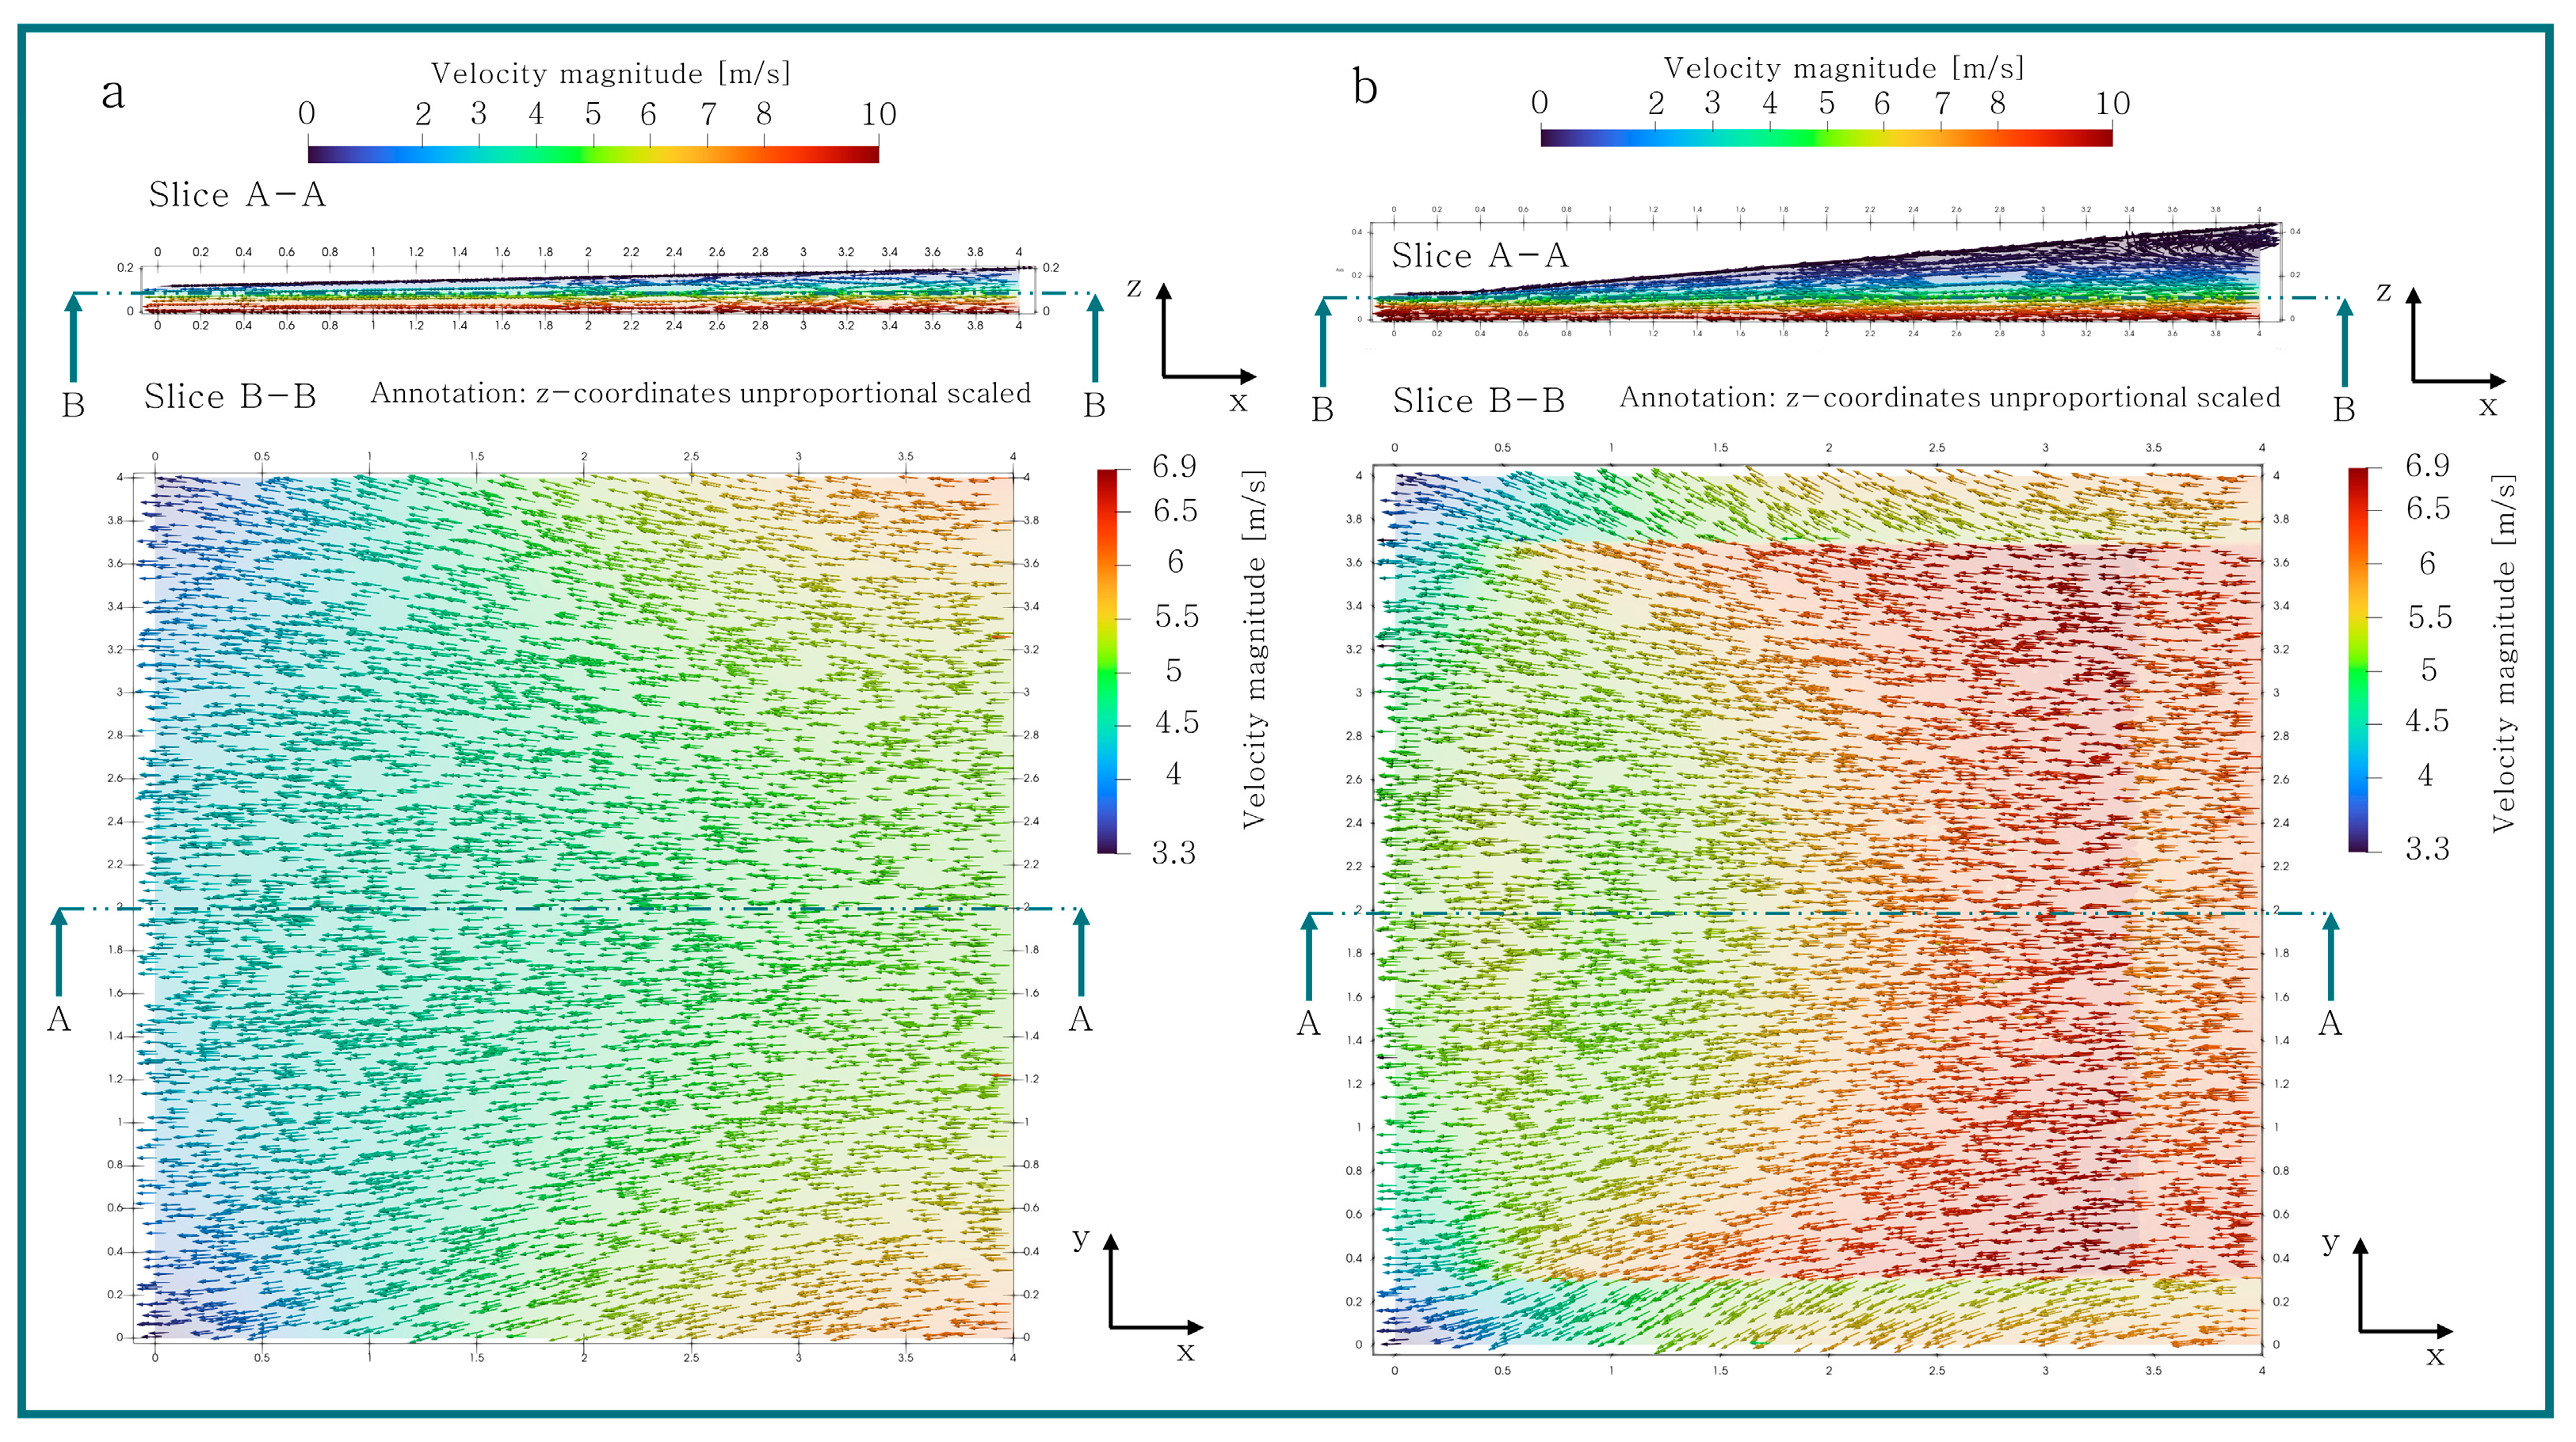
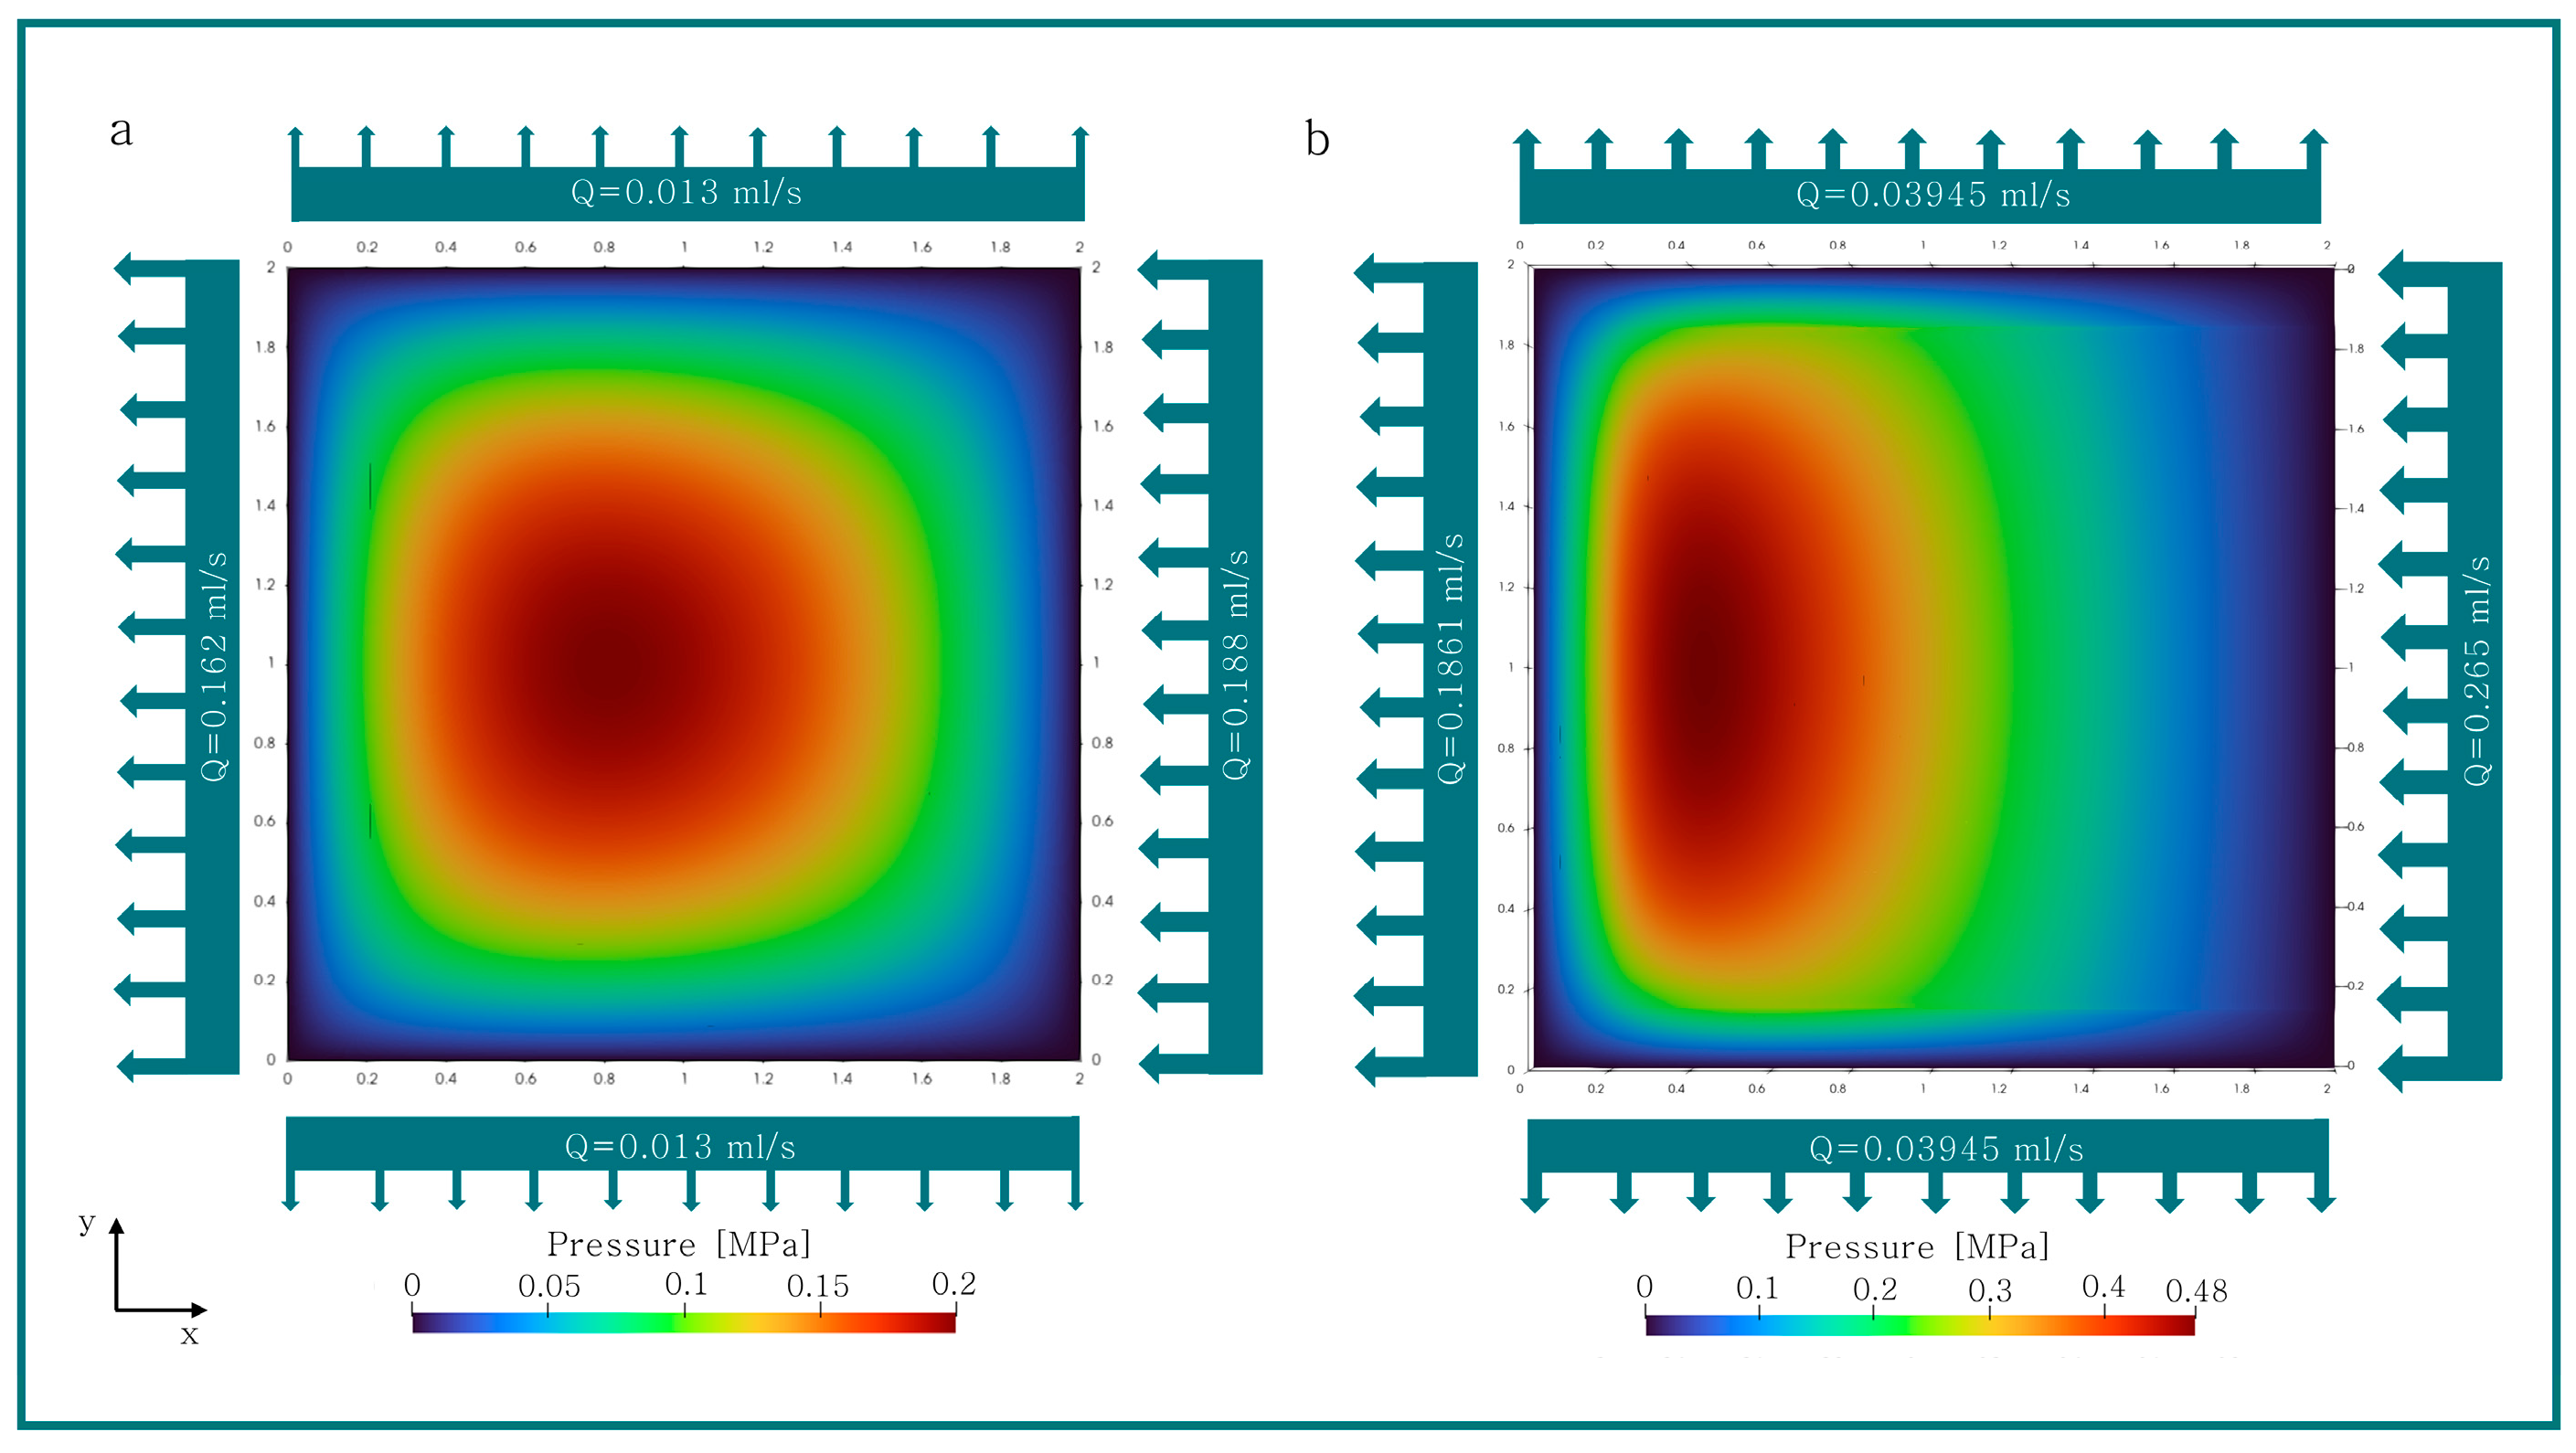
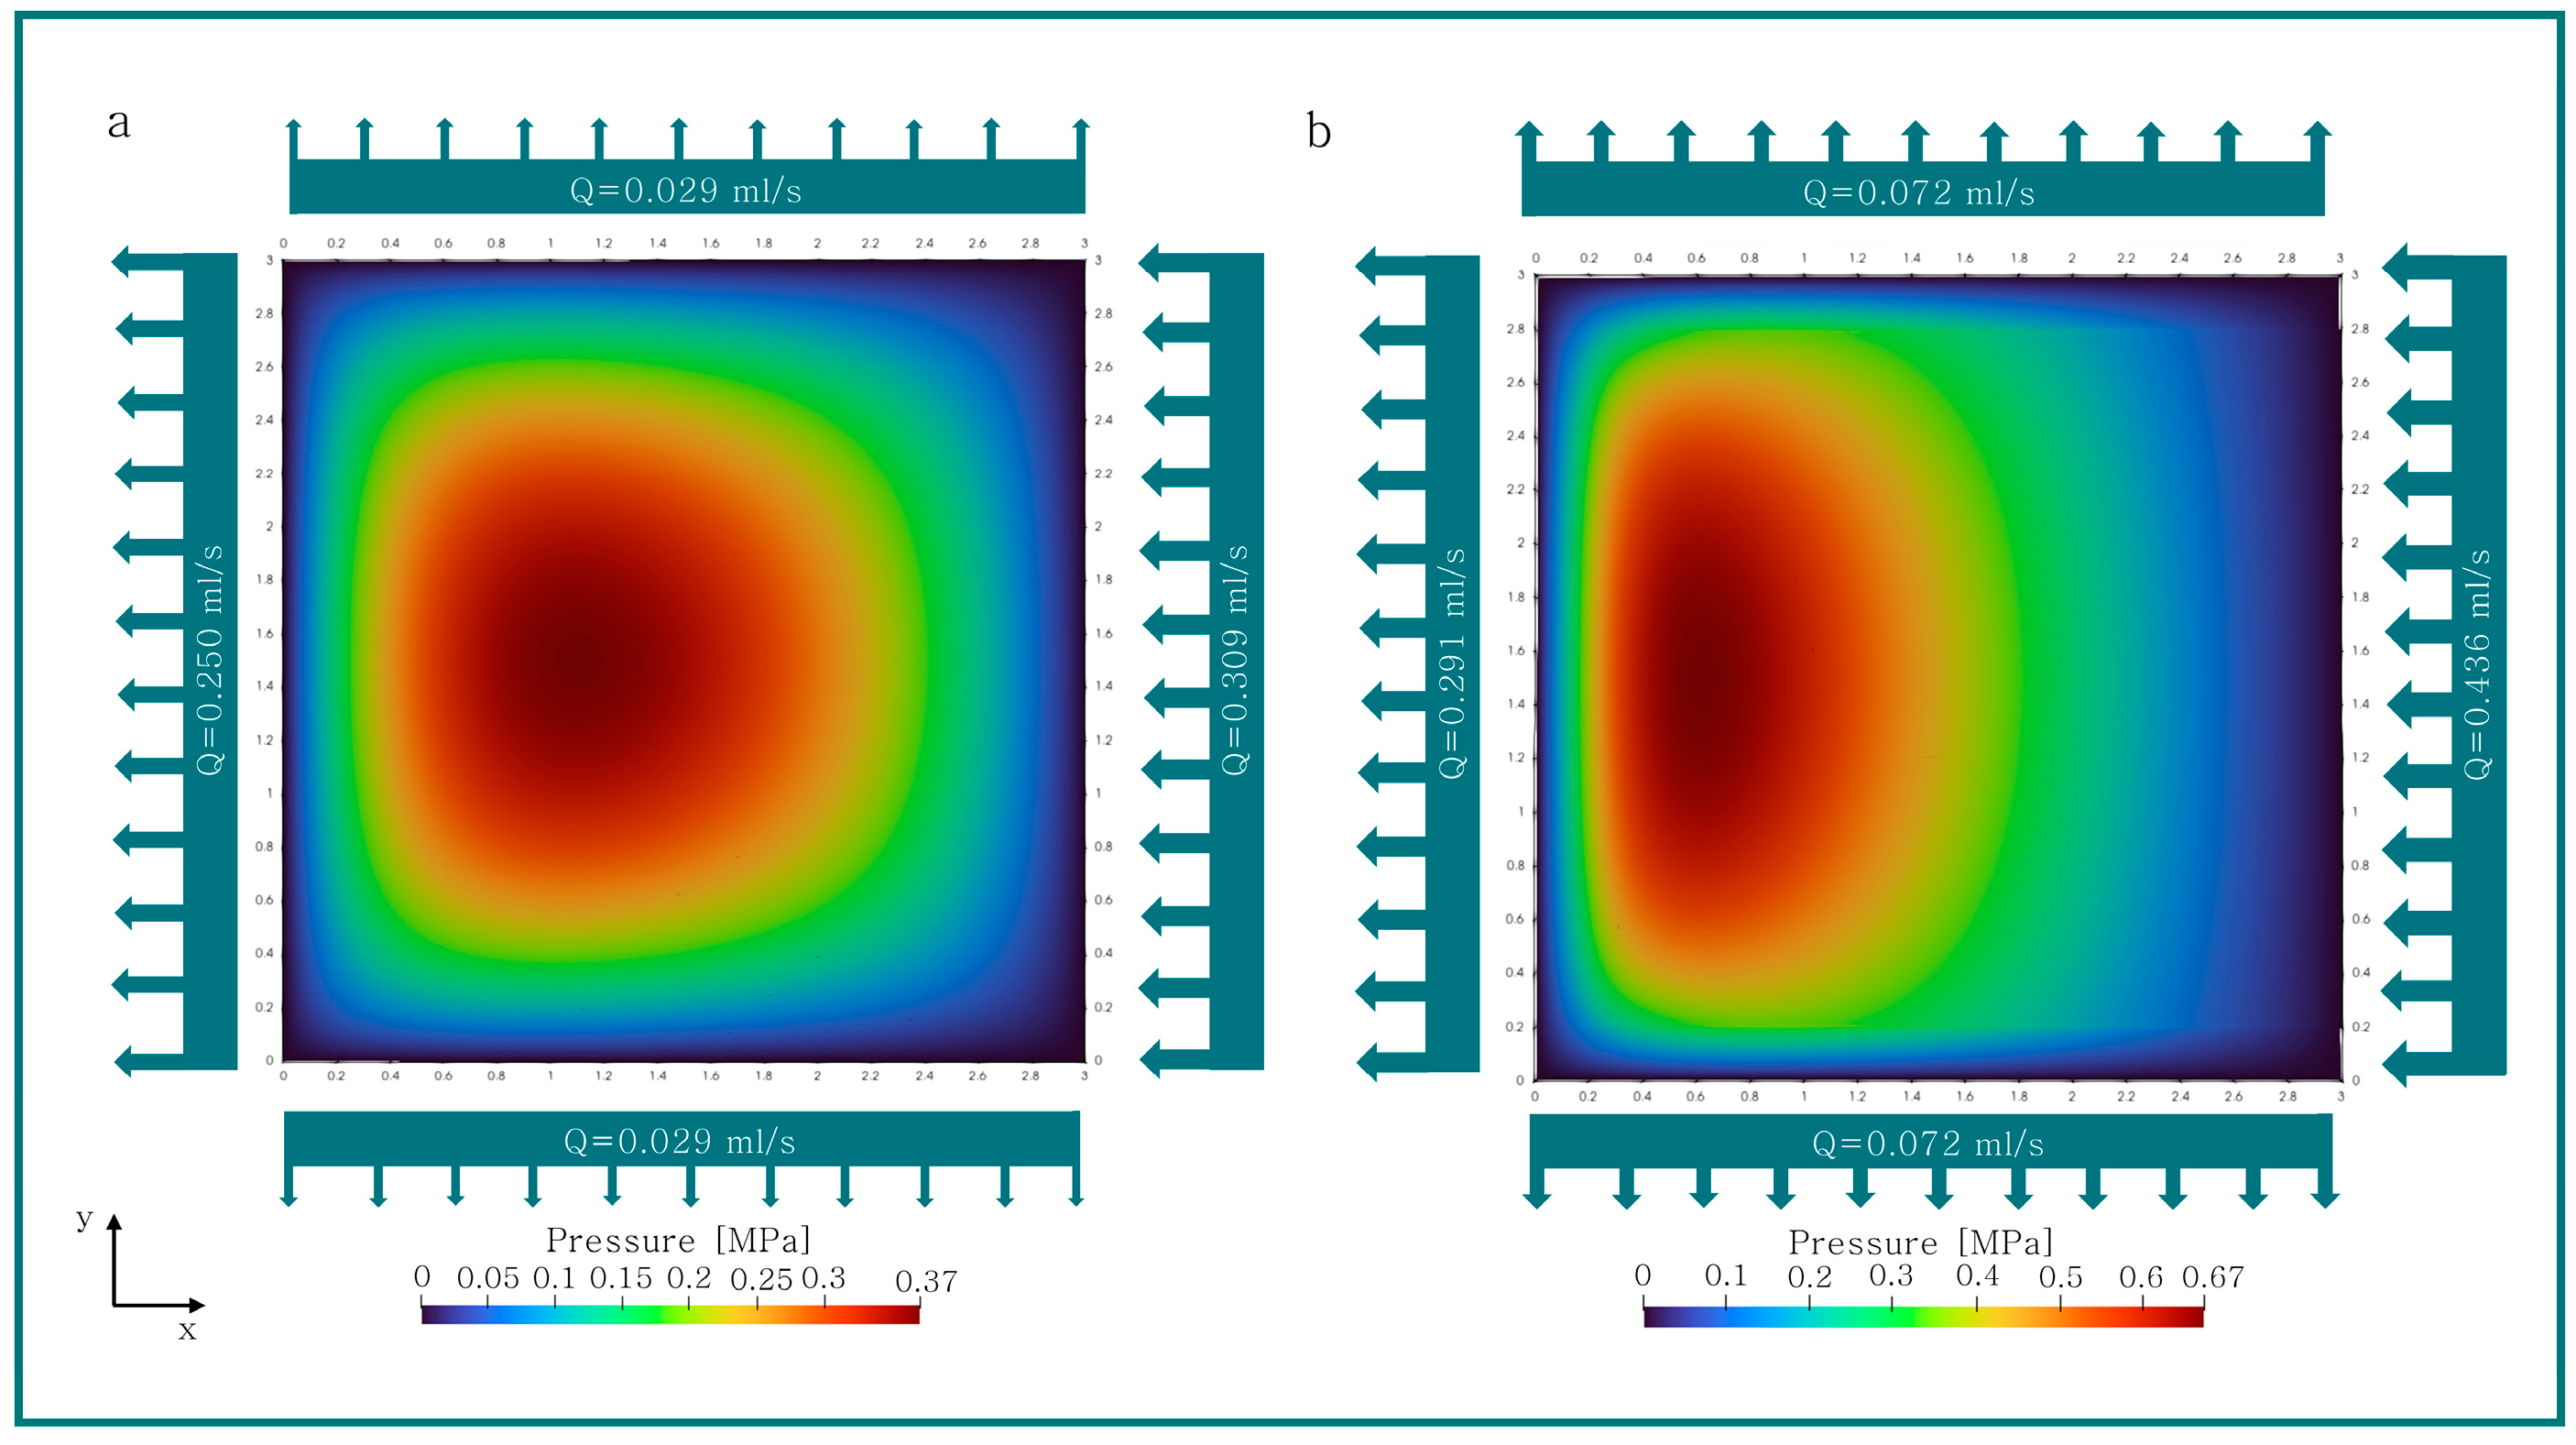
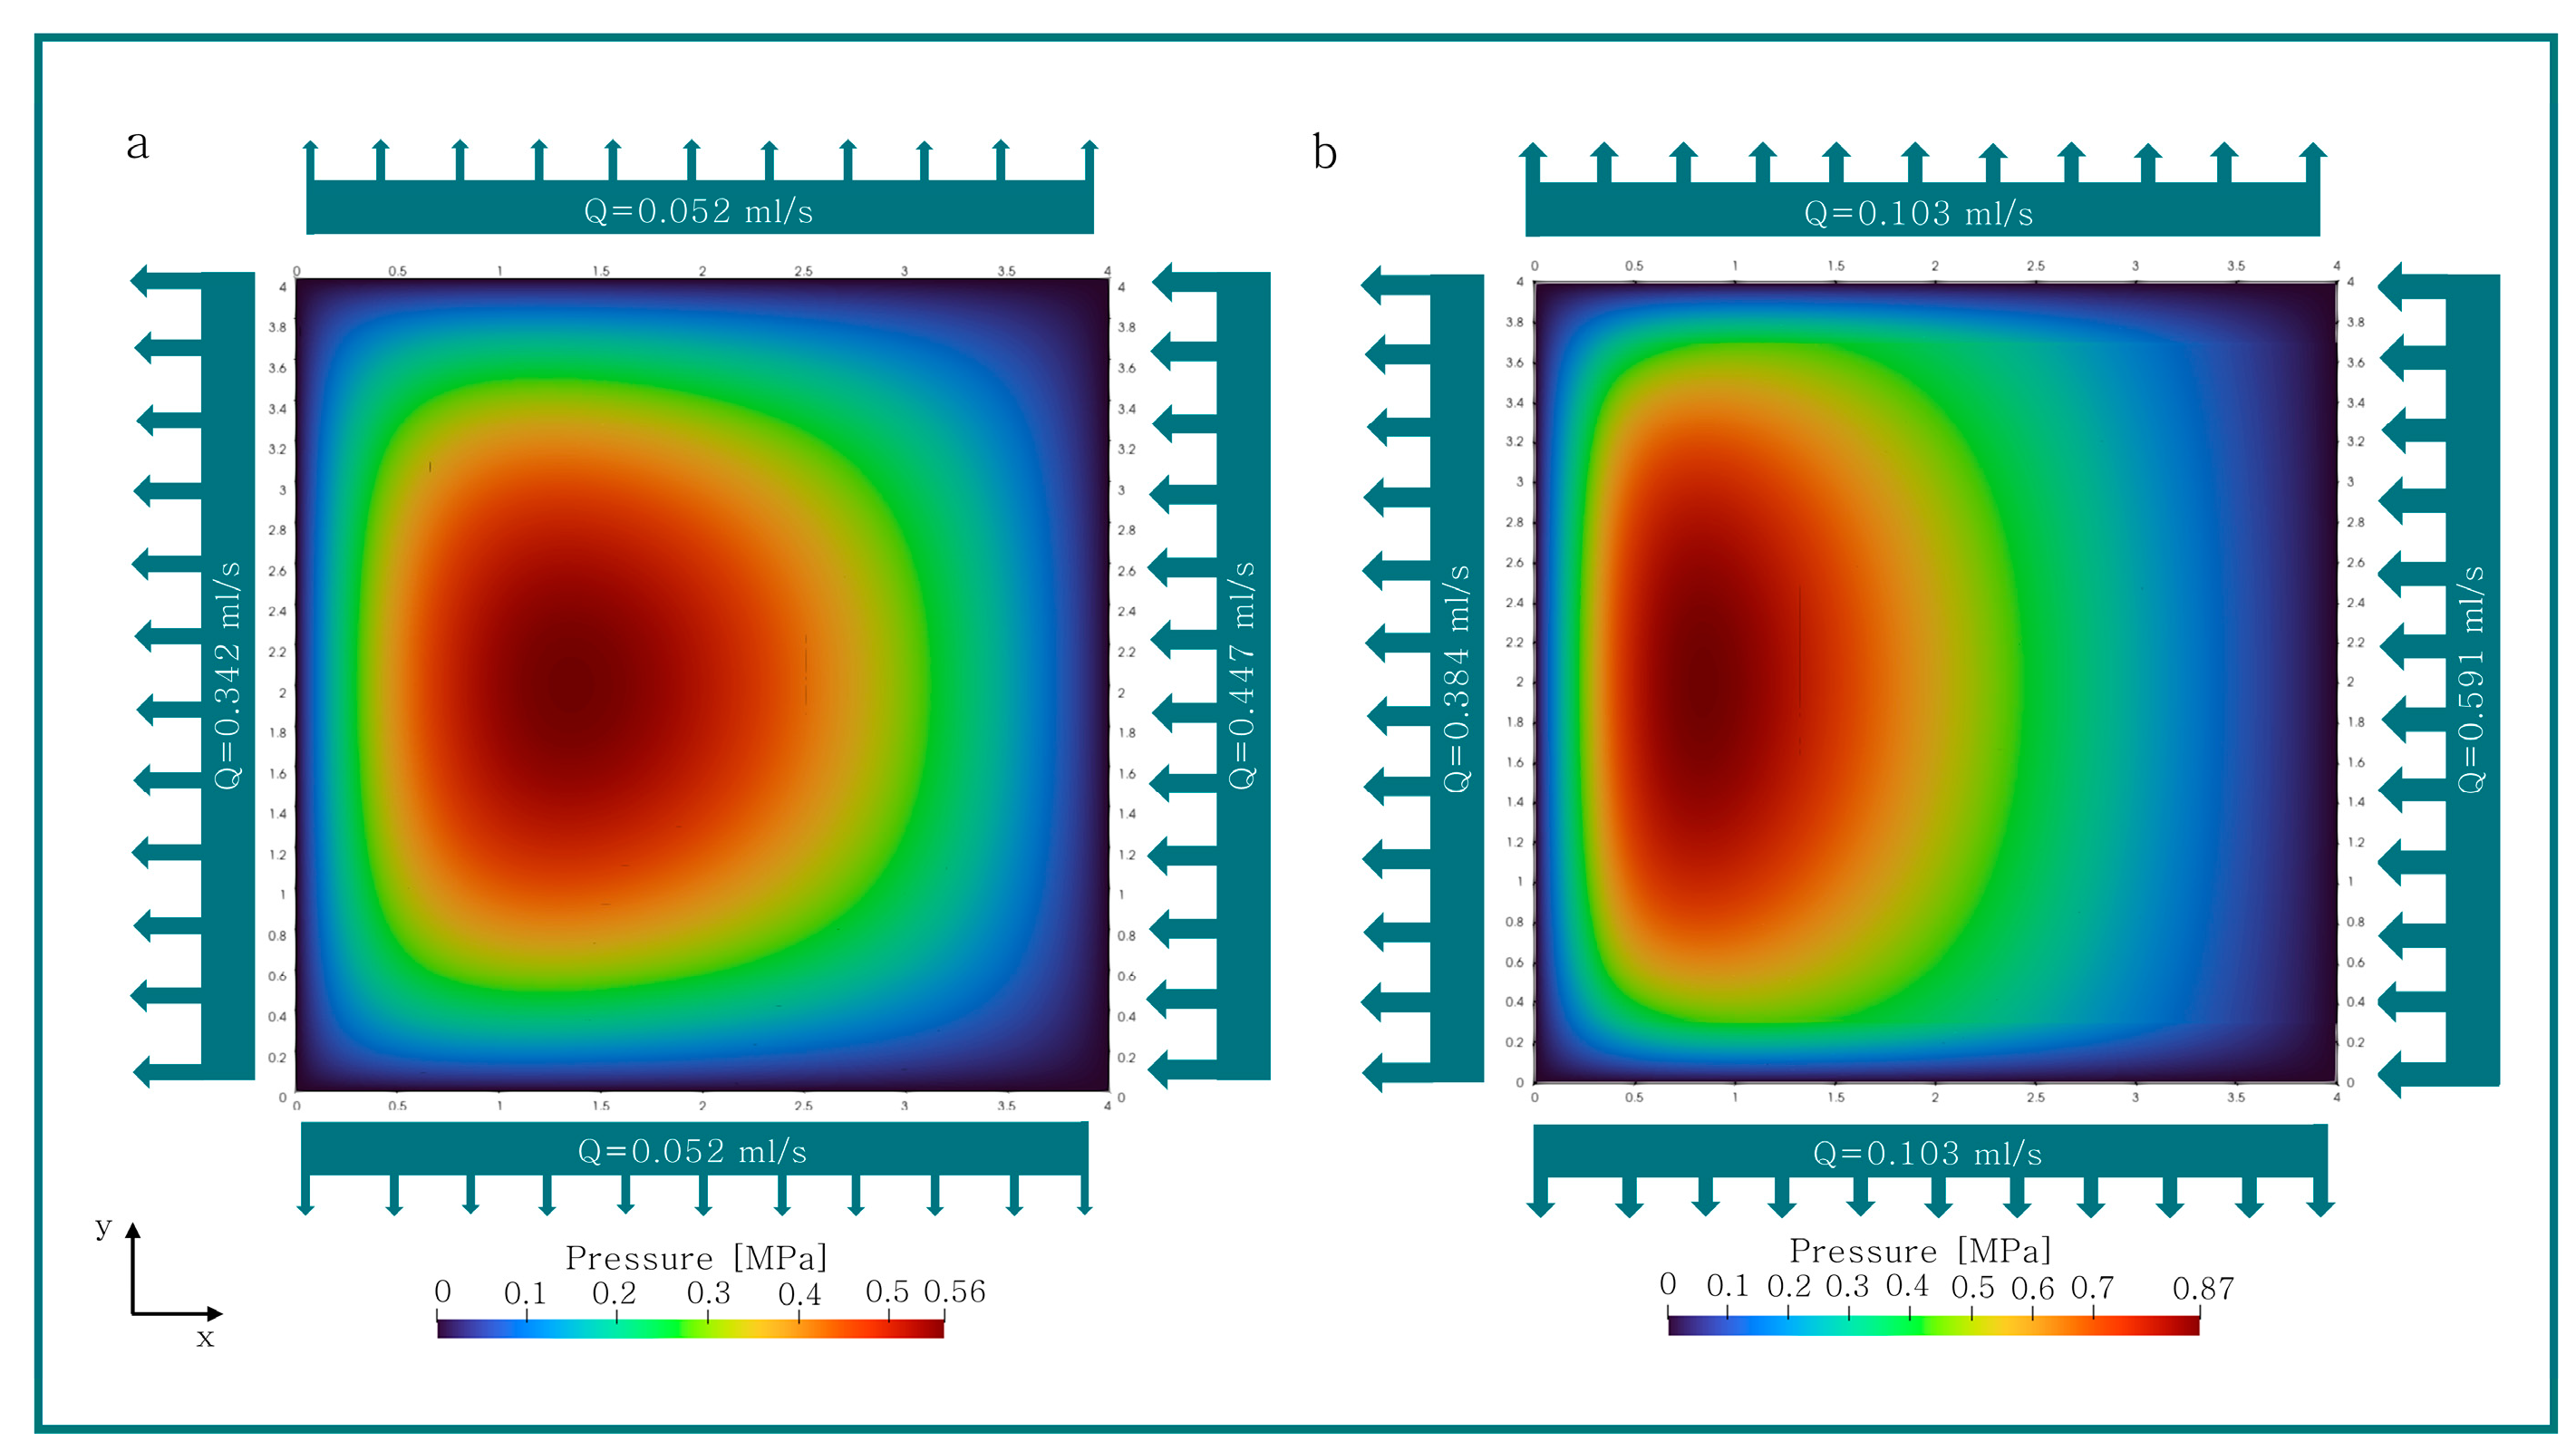
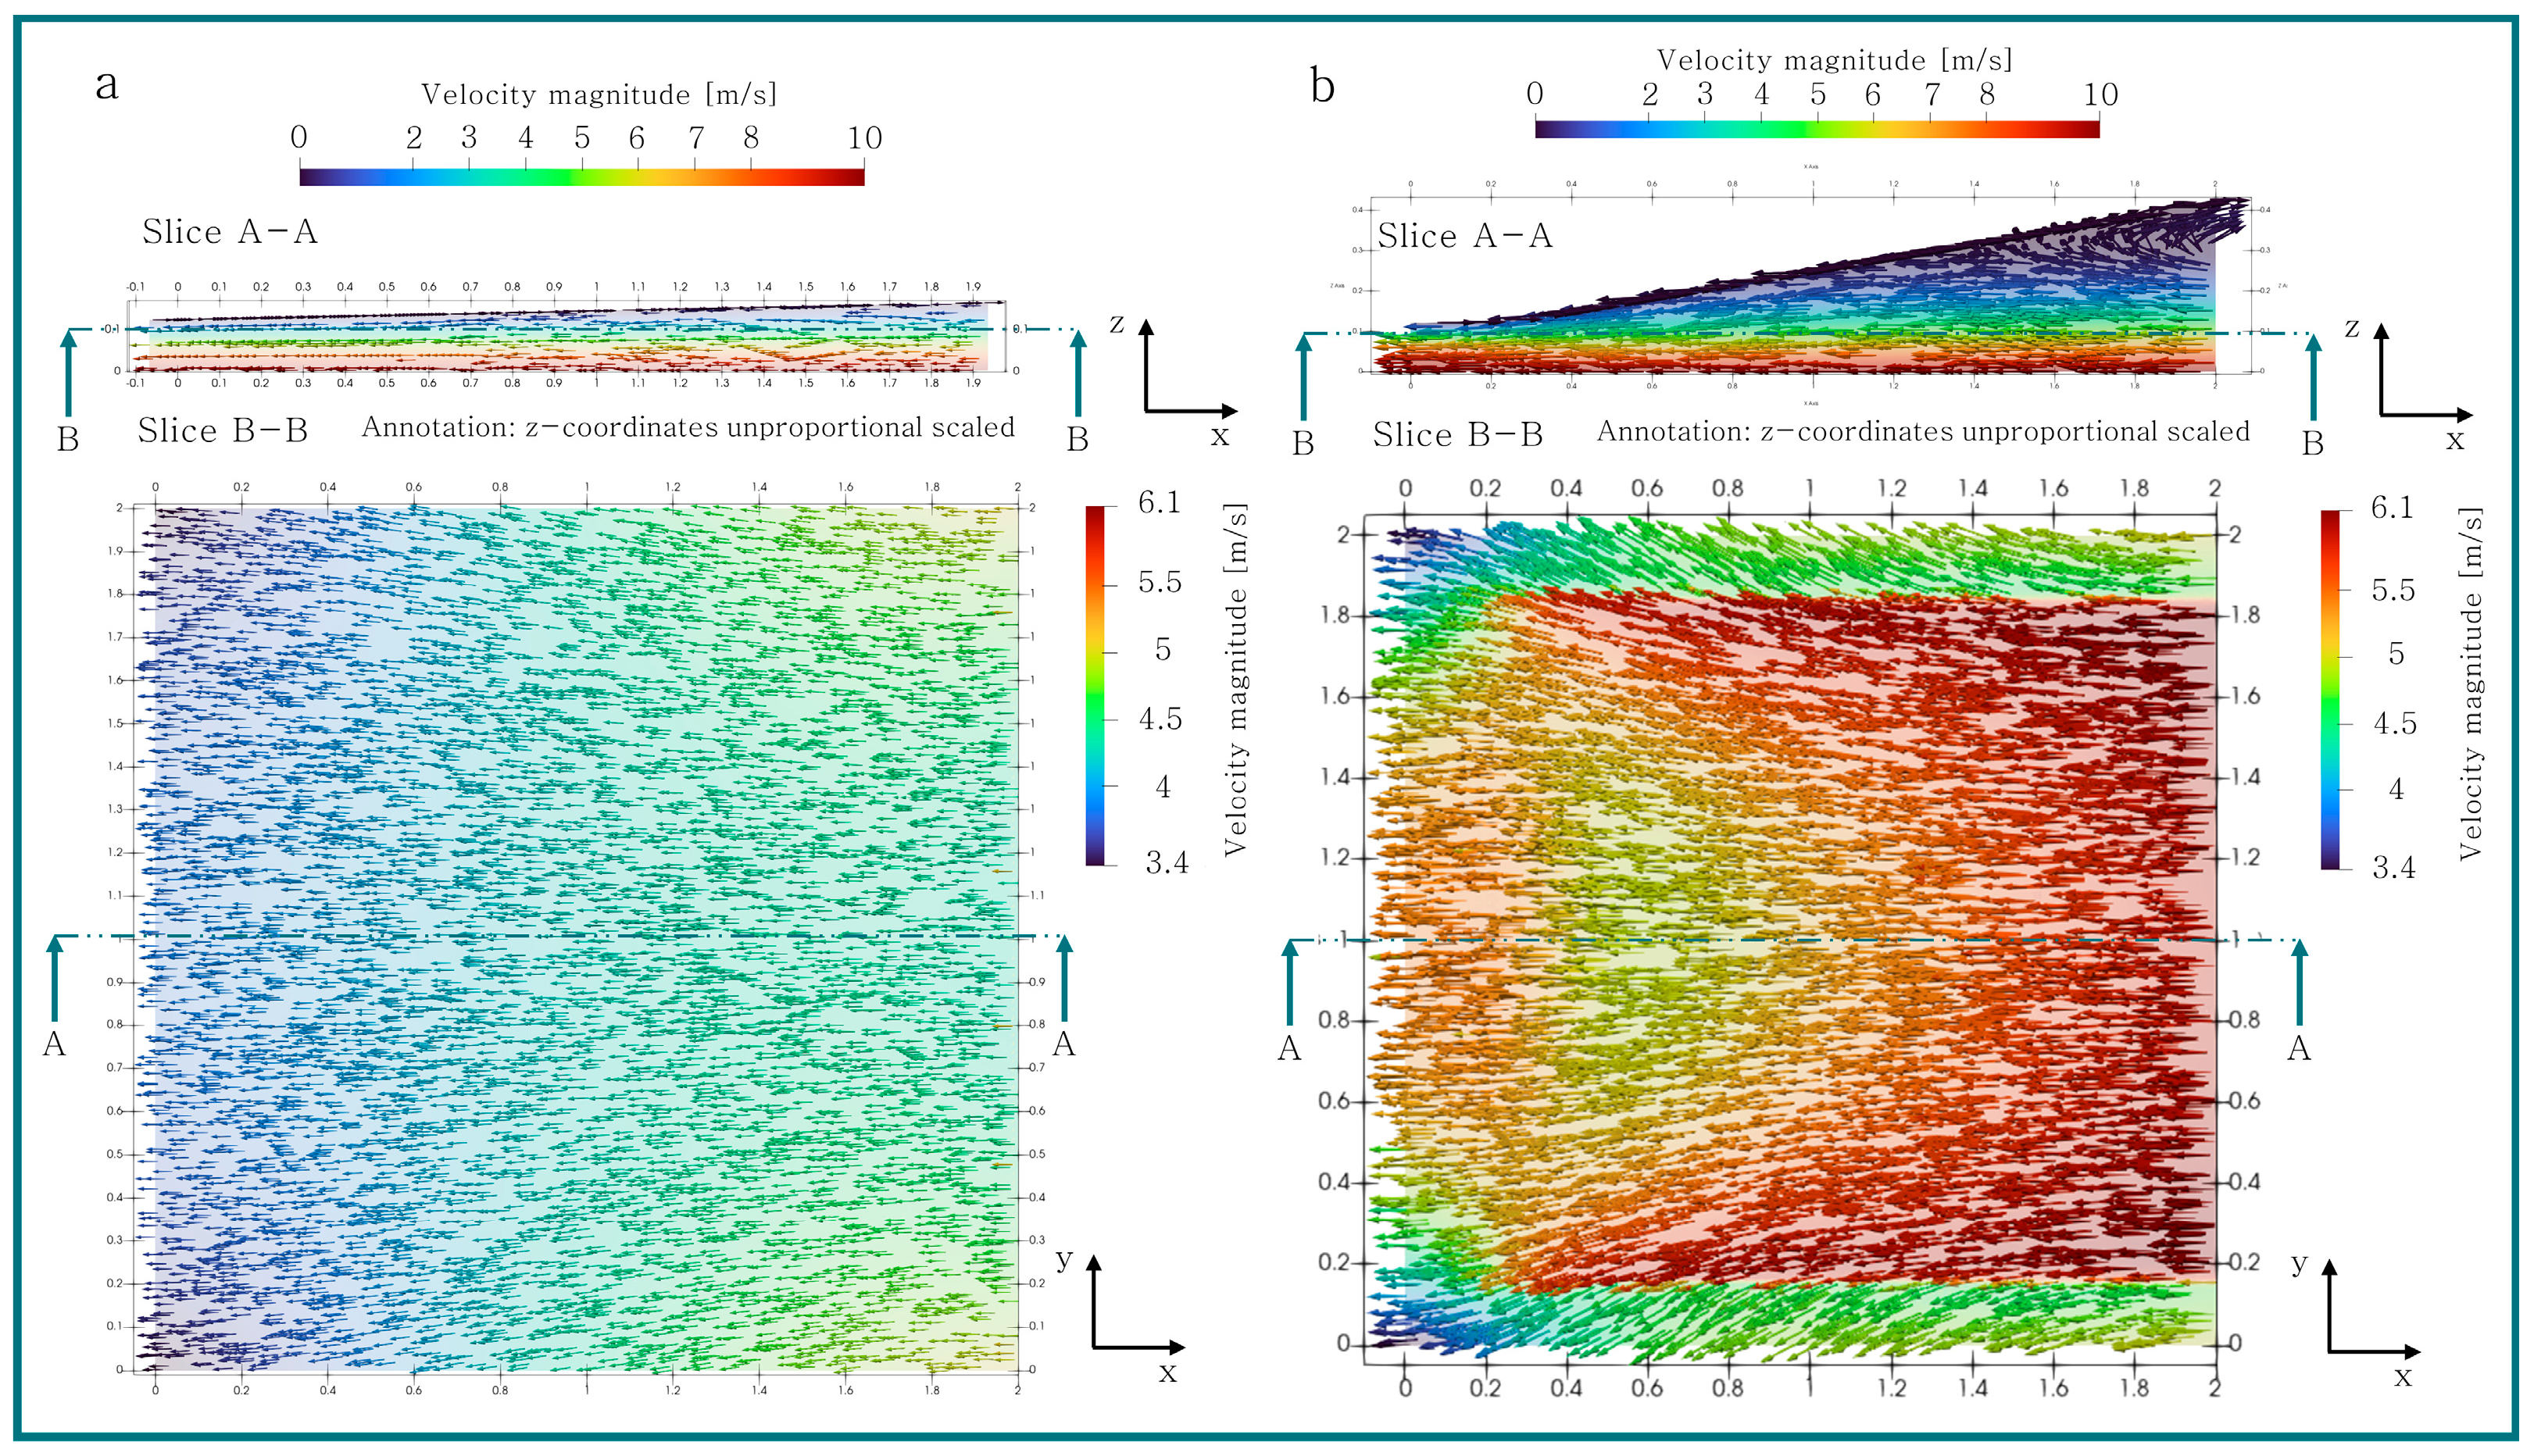
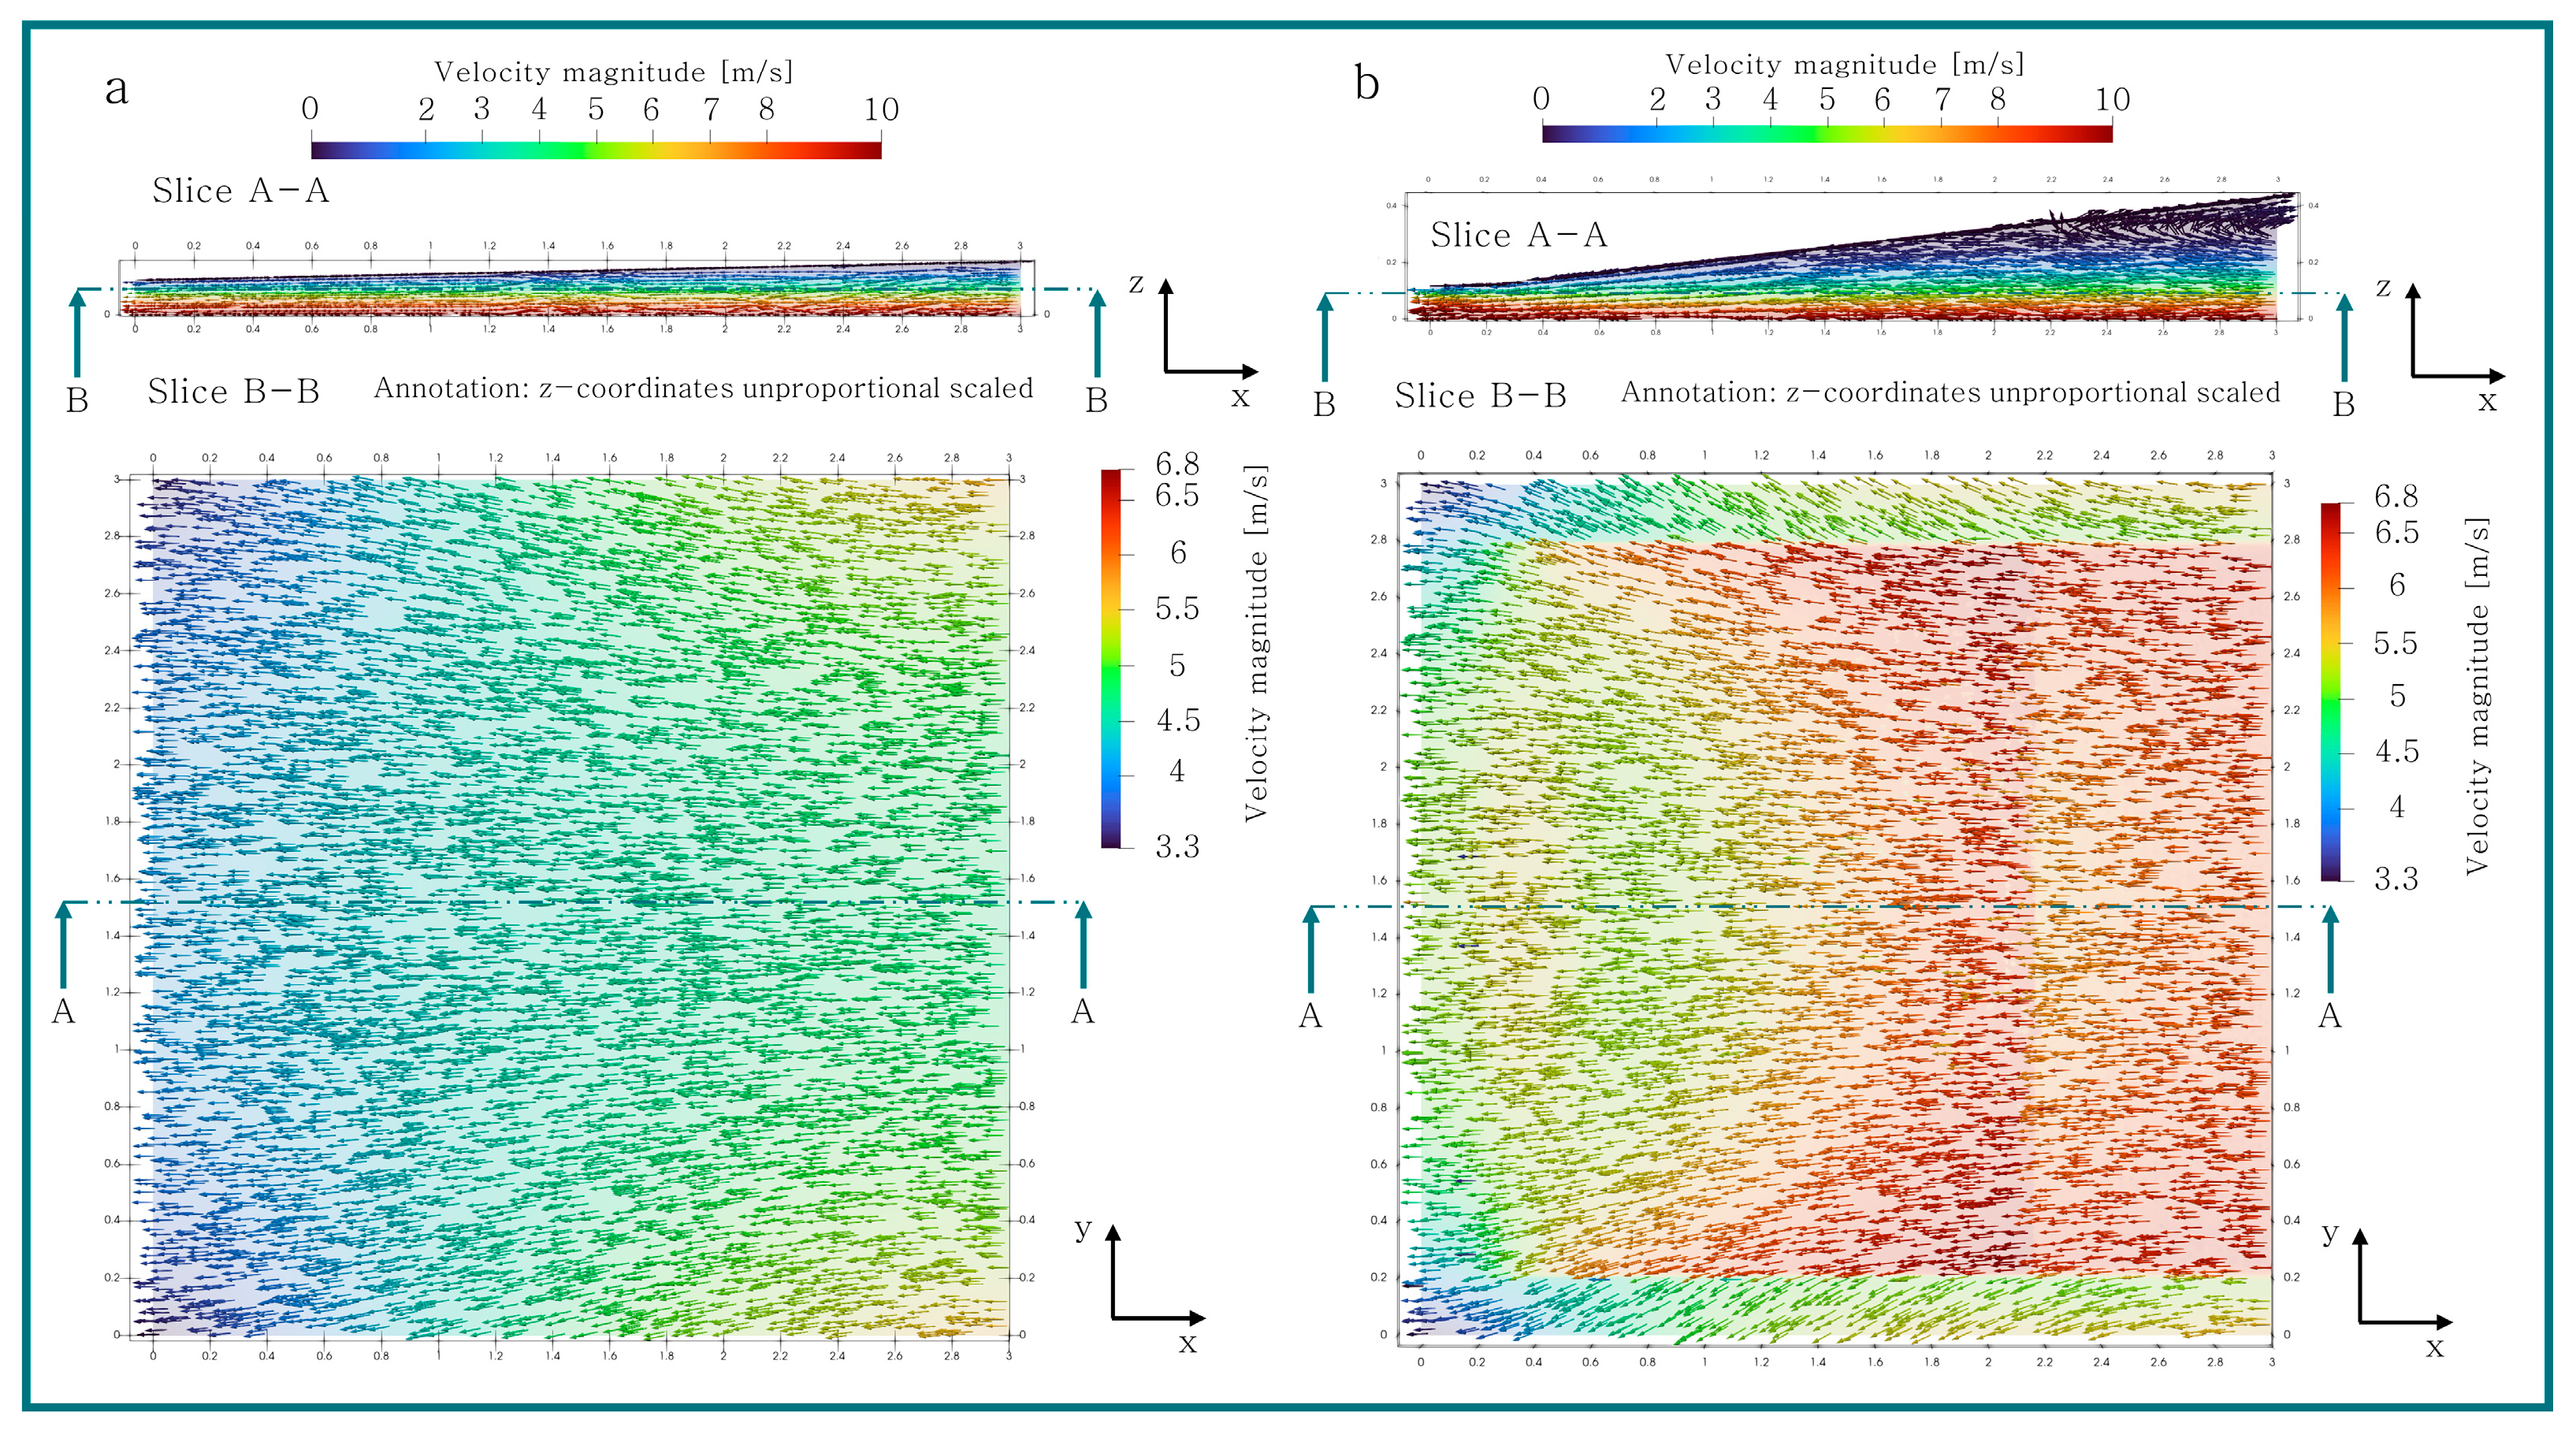
3.2. Pressure and Velocity Field Analysis
4. Discussion
5. Conclusions
- The performance of a wedge-shaped texture is strongly influenced by the geometry parameters. An increasing texture length improves the tribological behavior and the maximal PER can be achieved with an open texture at the inlet. This means that the texture increases the area of the face where the fluid advects.
- Depending on the dimensions of the oil film gap, a relative texture width of to leads to the best performance.
- With increasing dimensions of the oil film gap, the optimum texture angle decreases. The best performance can be achieved if the oil film gap at the inlet side has an absolute height of about , more or less independent of the geometry of the oil film gap.
- A relative start position of the texture , referring to the length of the oil film gap between and enhances the performance in the best way.
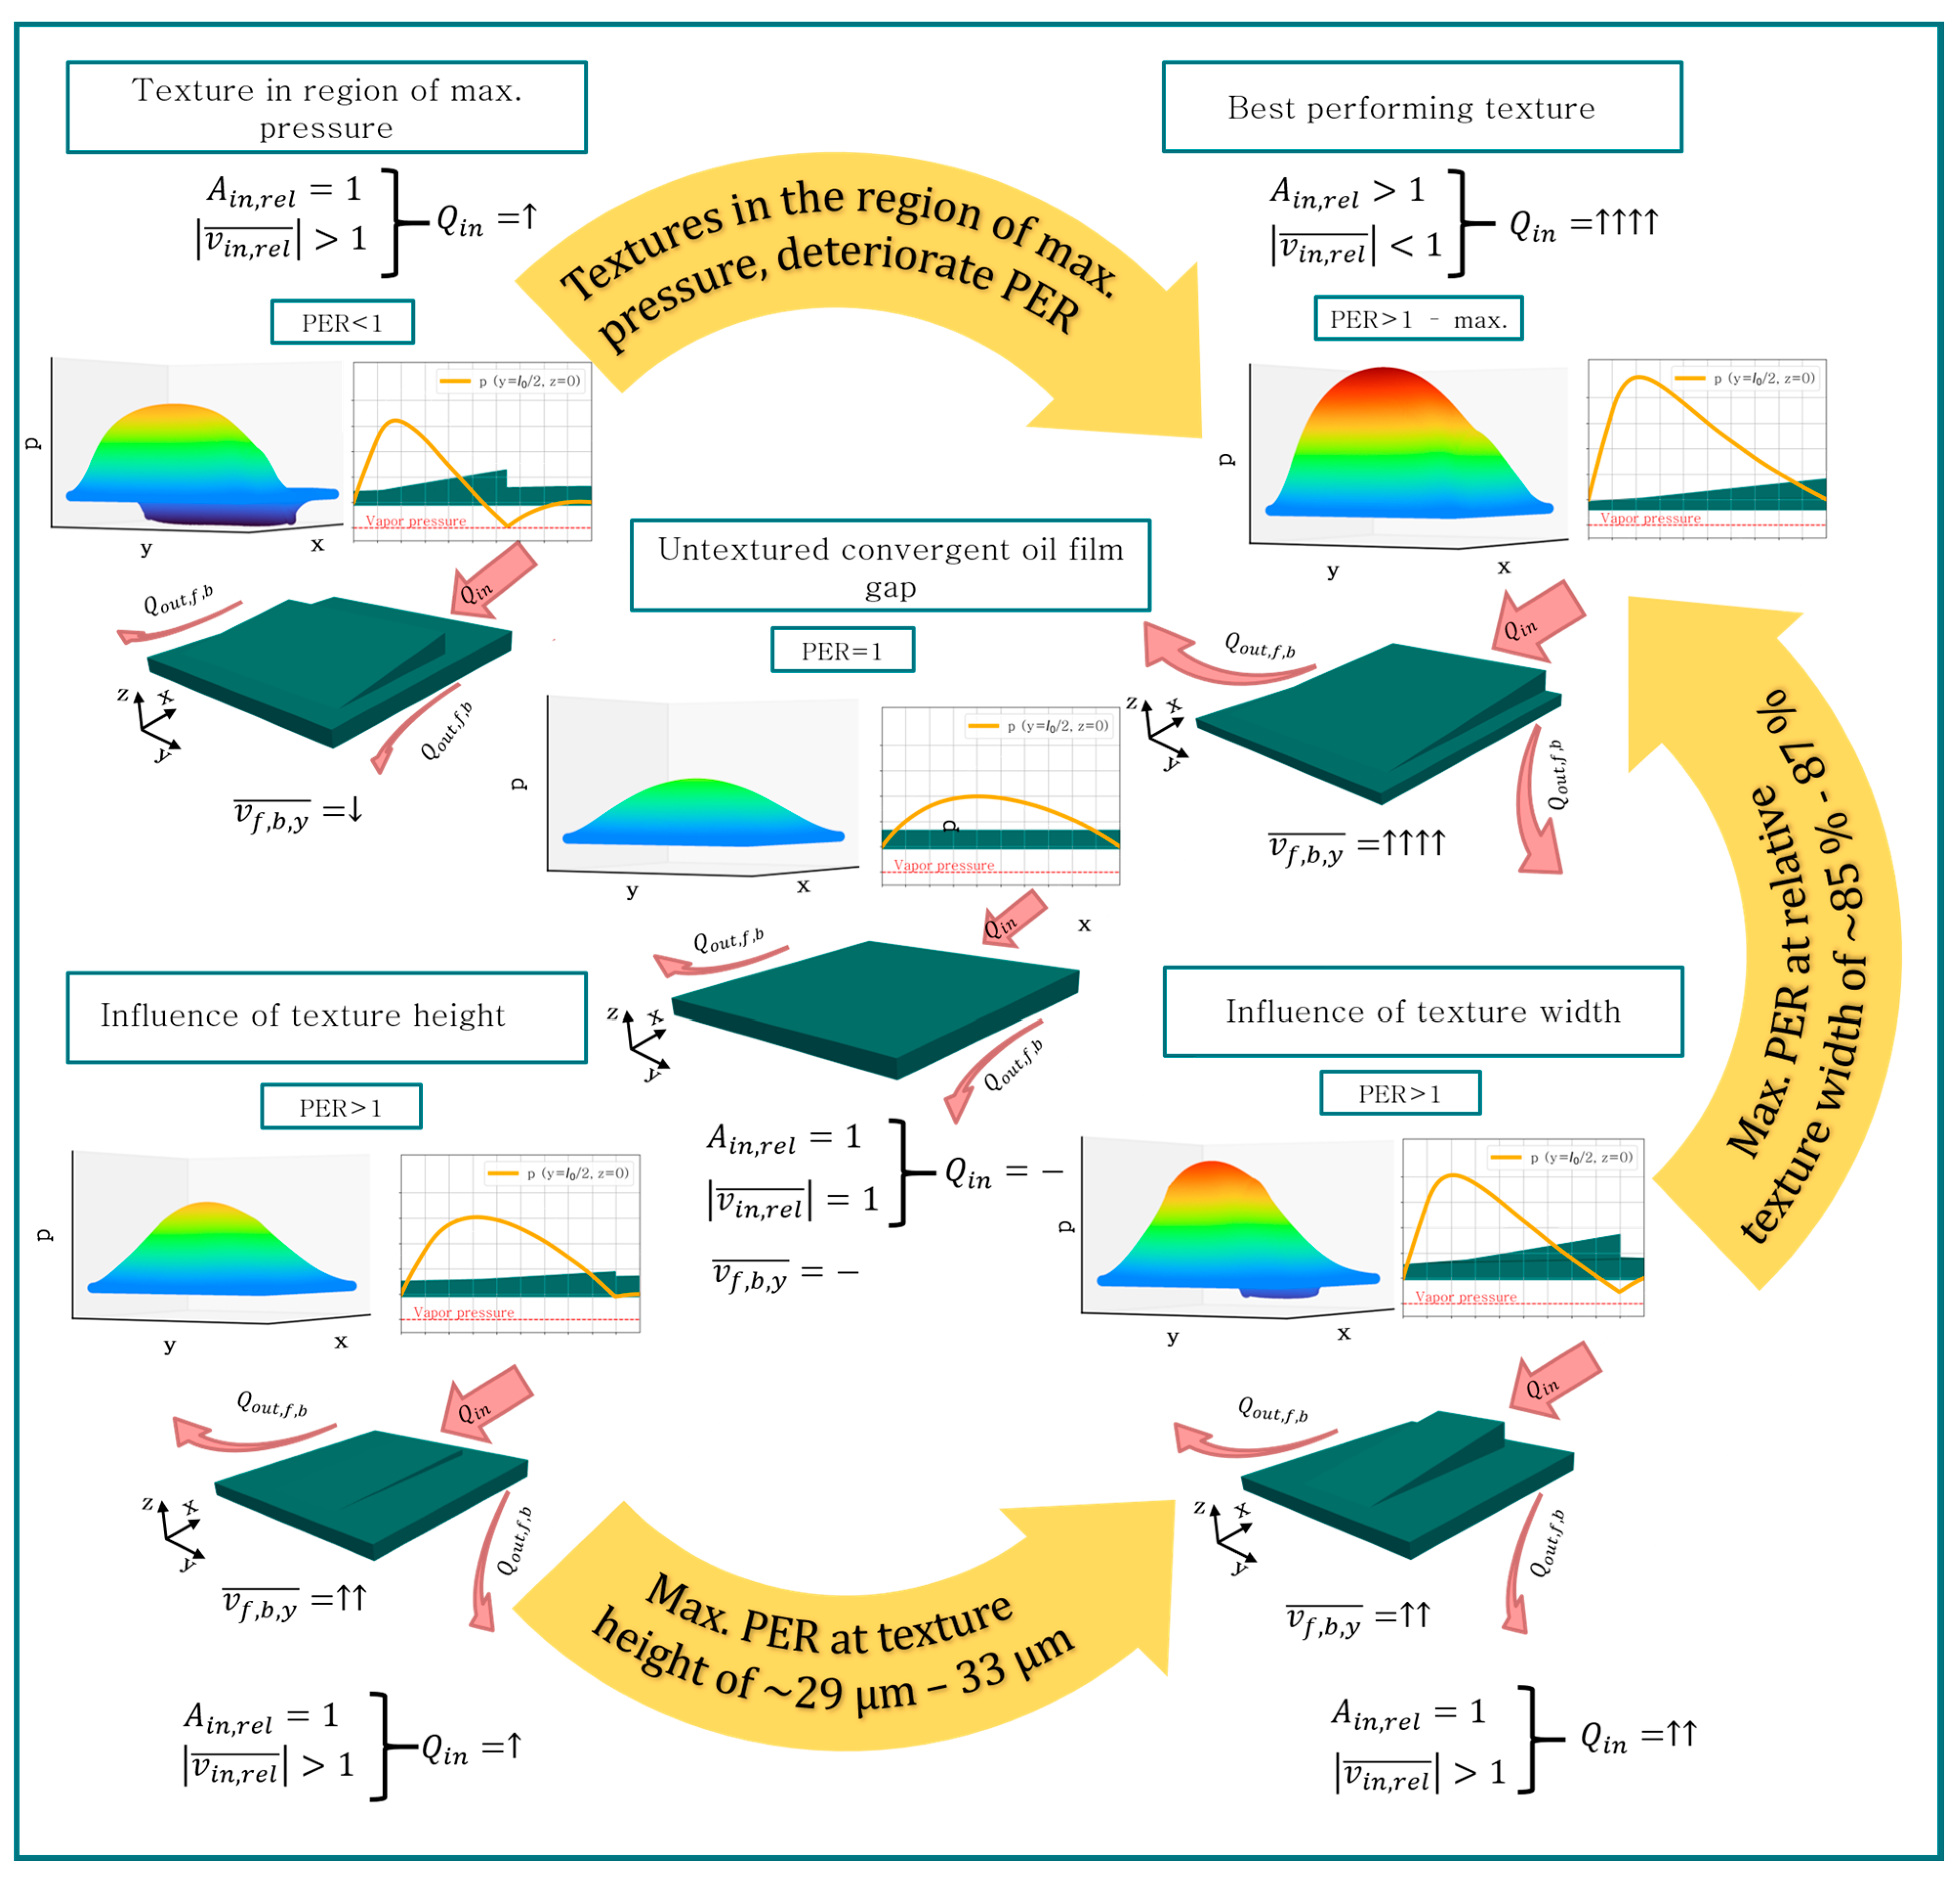
- The texture increases the fluid velocity perpendicular to the movement direction, leading to an increasing volume flow perpendicular to the movement direction.
- The texture also induces additional pressure.
- Textures that are only located in the area of maximal pressure deteriorate the tribological performance.
Author Contributions
Funding
Data Availability Statement
Conflicts of Interest
References
- Holmberg, K.; Erdemir, A. The impact of tribology on energy use and CO2 emission globally and in combustion engine and electric cars. Tribol. Int. 2019, 135, 389–396. [Google Scholar] [CrossRef]
- Tian, G.; Zhang, Y.; Feng, X.; Hu, Y. Focus on Bioinspired Textured Surfaces toward Fluid Drag Reduction: Recent Progresses and Challenges. Adv. Eng. Mater. 2022, 24, 2100696. [Google Scholar] [CrossRef]
- Dutta, P.; Nagar, O.P.; Sahu, S.K.; Savale, R.R.; Raj, R.G. Aerodynamic analysis of bionic winglet- slotted wings. Mater. Today Proc. 2022, 62, 6701–6707. [Google Scholar] [CrossRef]
- Arslan, A.; Masjuki, H.H.; Kalam, M.A.; Varman, M.; Mufti, R.A.; Mosarof, M.H.; Khuong, L.S.; Quazi, M.M. Surface Texture Manufacturing Techniques and Tribological Effect of Surface Texturing on Cutting Tool Performance: A Review. Crit. Rev. Solid State Mater. Sci. 2016, 41, 447–481. [Google Scholar] [CrossRef]
- Pou-Álvarez, P.; Riveiro, A.; Nóvoa, X.; Fernández-Arias, M.; del Val, J.; Comesaña, R.; Boutinguiza, M.; Lusquiños, F.; Pou, J. Nanosecond, picosecond and femtosecond laser surface treatment of magnesium alloy: Role of pulse length. Surf. Coat. Technol. 2021, 427, 127802. [Google Scholar] [CrossRef]
- Huang, F.; Jin, X. Surface texture generation using high-feed milling with spindle speed modulation. Precis. Eng. 2021, 72, 13–24. [Google Scholar] [CrossRef]
- Bijani, D.; Deladi, E.L.; Akchurin, A.; de Rooij, M.B.; Schipper, D.J. The Influence of Surface Texturing on the Frictional Behaviour of Parallel Sliding Lubricated Surfaces under Conditions of Mixed Lubrication. Lubricants 2018, 6, 91. [Google Scholar] [CrossRef]
- Liu, Y.; Zhang, H.; Dai, S.; Dong, G. Designing a bioinspired scaly textured surface for improving the tribological behaviors of starved lubrication. Tribol. Int. 2022, 173, 107594. [Google Scholar] [CrossRef]
- Bei, G.; Ma, C.; Wang, X.; Sun, J.; Ni, X. Study on Tribological Characteristics of Textured Surface under Convergent Oil Film Gap. Lubricants 2022, 10, 183. [Google Scholar] [CrossRef]
- Rosenkranz, A.; Costa, H.L.; Profito, F.; Gachot, C.; Medina, S.; Dini, D. Influence of surface texturing on hydrodynamic friction in plane converging bearings—An experimental and numerical approach. Tribol. Int. 2019, 134, 190–204. [Google Scholar] [CrossRef]
- Sharma, S.; Jamwal, G.; AWASTHI, R.K. Numerical study on steady state performance enhancement of partial textured hydrodynamic journal bearing. Ind. Lubr. Tribol. 2019, 71, 1055–1063. [Google Scholar] [CrossRef]
- Dobrica, M.B.; Fillon, M.; Pascovici, M.D.; Cicone, T. Optimizing surface texture for hydrodynamic lubricated contacts using a mass-conserving numerical approach. Proc. Inst. Mech. Eng. Part J J. Eng. Tribol. 2010, 224, 737–750. [Google Scholar] [CrossRef]
- Grützmacher, P.G.; Profito, F.J.; Rosenkranz, A. Multi-Scale Surface Texturing in Tribology—Current Knowledge and Future Perspectives. Lubricants 2019, 7, 95. [Google Scholar] [CrossRef]
- Hamilton, D.B.; Walowit, J.A.; Allen, C.M. A Theory of Lubrication by Microirregularities. J. Basic Eng. 1966, 88, 177–185. [Google Scholar] [CrossRef]
- Babu, P.V.; Ismail, S.; Ben, B.S. Experimental and numerical studies of positive texture effect on friction reduction of sliding contact under mixed lubrication. Proc. Inst. Mech. Eng. Part J J. Eng. Tribol. 2021, 235, 360–375. [Google Scholar] [CrossRef]
- Hu, D.; Guo, Z.; Xie, X.; Yuan, C. Effect of spherical-convex surface texture on tribological performance of water-lubricated bearing. Tribol. Int. 2019, 134, 341–351. [Google Scholar] [CrossRef]
- Yagi, K.; Sugimura, J. Performance of Balancing Wedge Action in Textured Hydrodynamic Pad Bearings. J. Lubr. Technol. 2017, 139, 248. [Google Scholar] [CrossRef]
- Liang, X.; Liu, Z.; Wang, H.; Zhou, X.; Zhou, X. Hydrodynamic lubrication of partial textured sliding journal bearing based on three-dimensional CFD. Ind. Lubr. Tribol. 2016, 68, 106–115. [Google Scholar] [CrossRef]
- van Liem, N.; Zhenpeng, W.; Renqiang, J. Effect of shape/size and distribution of microgeometries of textures on tribo-performance of crankpin bearing. Proc. Inst. Mech. Eng. Part J J. Eng. Tribol. 2022, 236, 421–433. [Google Scholar] [CrossRef]
- Maier, M.; Pusterhofer, M.; Grün, F. Multiscale Wear Simulation in Textured, Lubricated Contacts. Coatings 2023, 13, 697. [Google Scholar] [CrossRef]
- Gropper, D.; Wang, L.; Harvey, T.J. Hydrodynamic lubrication of textured surfaces: A review of modeling techniques and key findings. Tribol. Int. 2016, 94, 509–529. [Google Scholar] [CrossRef]
- Dobrica, M.B.; Fillon, M. About the validity of Reynolds equation and inertia effects in textured sliders of infinite width. Proc. Inst. Mech. Eng. Part J J. Eng. Tribol. 2009, 223, 69–78. [Google Scholar] [CrossRef]
- Cupillard, S.; Glavatskih, S.; Cervantes, M.J. Inertia effects in textured hydrodynamic contacts. Proc. Inst. Mech. Eng. Part J J. Eng. Tribol. 2010, 224, 751–756. [Google Scholar] [CrossRef]
- Shibata, Y.; Enomoto, Y. Global Existence of Classical Solutions and Optimal Decay Rate for Compressible Flows via the Theory of Semigroups. In Handbook of Mathematical Analysis in Mechanics of Viscous Fluids; Giga, Y., Novotný, A., Eds.; Springer International Publishing: Cham, Switzerland, 2018; pp. 2085–2181. [Google Scholar]
- Netgen/NGSolve Finite Element Tool. Available online: https://docu.ngsolve.org/latest/index.html (accessed on 10 January 2024).
- Concli, F. Equilibrium of a journal bearing: A simplified CFD-analytical coupled approach. In Advances in Fluid Mechanics XIII; WIT Transactions on Engineering Sciences: Southampton, UK, 2020; pp. 13–25. [Google Scholar]
- Merkle, C.L.; Feng, J.; Buelow, P.E. Computational modeling of sheet cavitation. In Proceedings of the 3rd International Symposium on Cavitation, Grenoble, France, 7–10 April 1998. [Google Scholar]
- Gao, G.; Yin, Z.; Jiang, D.; Zhang, X. Numerical analysis of plain journal bearing under hydrodynamic lubrication by water. Tribol. Int. 2014, 75, 31–38. [Google Scholar] [CrossRef]
- OpenFoam. Available online: https://www.openfoam.com/ (accessed on 8 October 2023).
- Pusterhofer, M.; Bergmann, P.; Summer, F.; Grün, F.; Brand, C. A Novel Approach for Modeling Surface Effects in Hydrodynamic Lubrication. Lubricants 2018, 6, 15. [Google Scholar] [CrossRef]
- Maier, M.; Pusterhofer, M.; Summer, F.; Grün, F. Validation of statistic and deterministic asperity contact models using experimental Stribeck data. Tribol. Int. 2021, 165, 107329. [Google Scholar] [CrossRef]
- Chen, Y.M.; Rigaut, B.; Armanet, F. Wear behaviour of partially stabilized zirconia at high sliding speed. J. Eur. Ceram. Soc. 1990, 6, 383–390. [Google Scholar] [CrossRef]
- Savio, A.; Cianferra, M.; Armenio, V. Analysis of Performance of Cavitation Models with Analytically Calculated Coefficients. Energies 2021, 14, 6425. [Google Scholar] [CrossRef]
- Hong, B.; Lv, S.; Liu, Q.; Hou, J.; Ji, Y.; Gao, Z.; Gao, J.; Hu, J. A Simple Method to Evaluate the Vapor Pressure of Transformer Oil at Various Temperatures. In Proceedings of the 2018 7th International Conference on Energy and Environmental Protection (ICEEP 2018), Shenzhen, China, 14–15 July 2018; Advances in Engineering Research. Atlantis Press: Amsterdam, The Netherlands, 2018; Volume 2018. [Google Scholar]
- Lang, O.R.; Steinhilper, W. Gleitlager: Berechnung und Konstruktion von Gleitlagern Mit Konstanter und Zeitlich Veränderlicher Belastung; mit 6 Arbeitsblättern, 1978th ed.; Springer: Berlin, Germany, 2014. [Google Scholar]
- Meng, F.M. On influence of cavitation in lubricant upon tribological performances of textured surfaces. Opt. Laser Technol. 2013, 48, 422–431. [Google Scholar] [CrossRef]
- Ullah, M.Z.; Rizwan, M.; Raza, A.; Ahmed, A.; Abid, M. Effect of dimple shape and depth on tribological performance of textured surface. In Proceedings of the 2021 International Bhurban Conference on Applied Sciences and Technologies (IBCAST), Islamabad, Pakistan, 12–16 January 2021; IEEE: Piscataway Township, NJ, USA, 2021; pp. 719–725. [Google Scholar]
- DIN ISO 2768-1:1991-06; General Tolerances; Tolerances for Linear and Angular Dimensions without Individual Tolerance Indications. Identical with ISO 2768-1:1989; International Organization for Standardization: Geneva, Switzerland, 1991.


| Designation | ||||
|---|---|---|---|---|
| Geometry I | 2 | 2 | 0.15 | 15 |
| Geometry II | 3 | 3 | 0.15 | 15 |
| Geometry III | 4 | 4 | 0.15 | 15 |
| Parameters | |
|---|---|
| Density oil liquid | 857 |
| Density oil vapor | 0.13 |
| Dynamic viscosity liquid | 22.4 |
| Dynamic viscosity vapor | 2 × 10⁻² |
| Condensation coefficient | 33.3 |
| Vaporization coefficient | 1.55 × 10⁻³ |
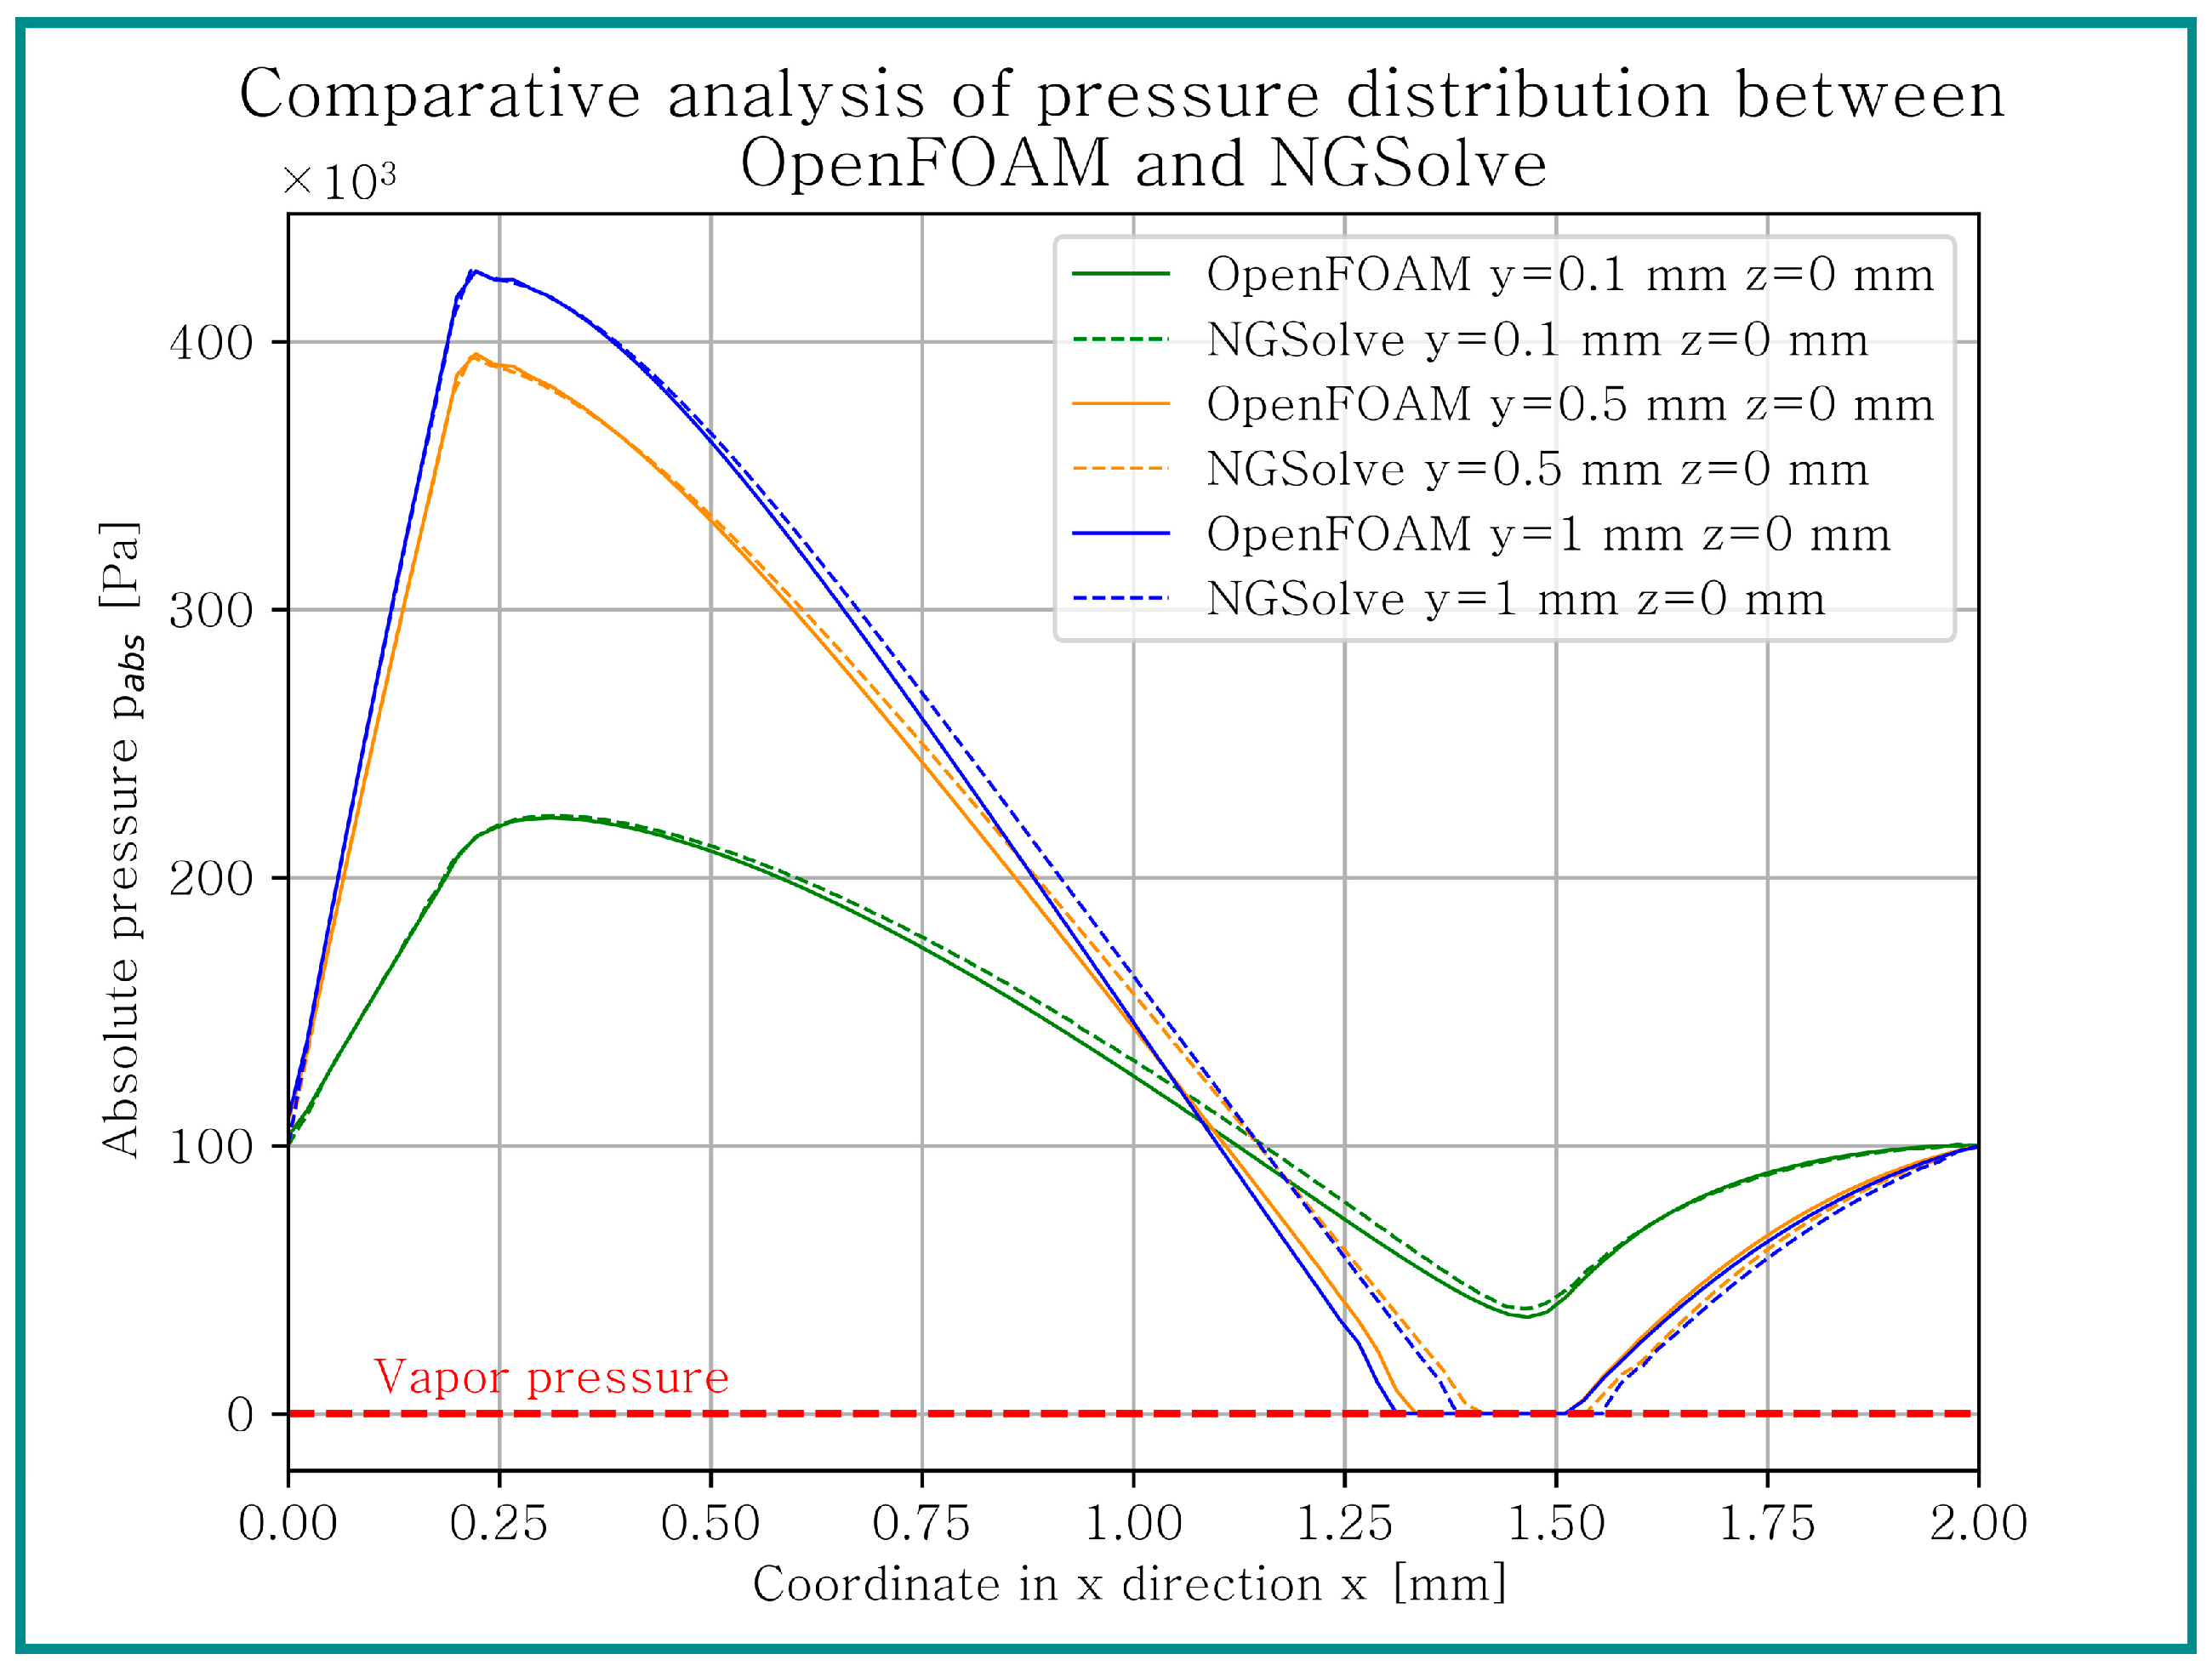
| Vapor pressure | 165 |
| Input velocity | 10 |
| Reference time | |
| Geometry I | 2.65 | 2.18 | 0.82 |
| Geometry II | 1.99 | 1.64 | 0.82 |
| Geometry III | 1.67 | 1.43 | 0.87 |
Disclaimer/Publisher’s Note: The statements, opinions and data contained in all publications are solely those of the individual author(s) and contributor(s) and not of MDPI and/or the editor(s). MDPI and/or the editor(s) disclaim responsibility for any injury to people or property resulting from any ideas, methods, instructions or products referred to in the content. |
© 2024 by the authors. Licensee MDPI, Basel, Switzerland. This article is an open access article distributed under the terms and conditions of the Creative Commons Attribution (CC BY) license (https://creativecommons.org/licenses/by/4.0/).
Share and Cite
Scharf, R.; Maier, M.; Pusterhofer, M.; Grün, F. A Comprehensive Numerical Study of a Wedge-Shaped Textured Convergent Oil Film Gap. Lubricants 2024, 12, 121. https://doi.org/10.3390/lubricants12040121
Scharf R, Maier M, Pusterhofer M, Grün F. A Comprehensive Numerical Study of a Wedge-Shaped Textured Convergent Oil Film Gap. Lubricants. 2024; 12(4):121. https://doi.org/10.3390/lubricants12040121
Chicago/Turabian StyleScharf, Raphael, Michael Maier, Michael Pusterhofer, and Florian Grün. 2024. "A Comprehensive Numerical Study of a Wedge-Shaped Textured Convergent Oil Film Gap" Lubricants 12, no. 4: 121. https://doi.org/10.3390/lubricants12040121
APA StyleScharf, R., Maier, M., Pusterhofer, M., & Grün, F. (2024). A Comprehensive Numerical Study of a Wedge-Shaped Textured Convergent Oil Film Gap. Lubricants, 12(4), 121. https://doi.org/10.3390/lubricants12040121