Article

Approach to Determine the Limiting Shear Stress of Lubricants at High Pressures Based on Traction Mapping

1
School of Mechanical and Automotive Engineering, Qingdao University of Technology, Qingdao 266520, China
2
State Key Laboratory of Solid Lubrication, Lanzhou Institute of Chemical Physics, Chinese Academy of Sciences, Lanzhou 730000, China
3
Qingdao Key Laboratory of Lubrication Technology for Advanced Equipment, Qingdao Center of Resource Chemistry and New Materials, Qingdao 266100, China
*
Authors to whom correspondence should be addressed.
Lubricants 2024, 12(4), 128; https://doi.org/10.3390/lubricants12040128
Submission received: 28 February 2024 / Revised: 10 April 2024 / Accepted: 12 April 2024 / Published: 14 April 2024

Abstract

:
Typical lubricants behave in a non-Newtonian manner under conditions of high shear and high pressure, as is commonly observed in lubricated rolling/sliding contacts. To optimize and predict the friction therein, knowledge of the high-pressure rheological behaviors of lubricants and limiting shear stress (LSS) is essential. This study developed an approach for determining the LSS of lubricants based on friction mapping of rolling/sliding contacts, using a ball-on-disc traction machine. The main contribution lies in the introduction of a practical approach for the selection of a proper entrainment velocity for determining the LSS, with reduced thermal influences and near isothermal conditions. The proposed approach enables full film lubrication, while keeping the film as thin as possible to prevent excessive shear heating and, thus, thermal effects. The LSS of two lubricants, PAO40 and complex ester, has been measured at pressures ranging from 1.2 GPa to 1.7 GPa. A bilinear model has been used to describe the variation of LSS with pressure. The impact of entrainment velocity selection on the measurement of LSS is also discussed.

1. Introduction

Friction consumes approximately 30% of the primary energy in the world [1]. Friction at any scale should be optimized, such as in lubricated rolling/sliding contacts in bearings as well as gears in powertrain applications. These contacts are non-conformal and operate mainly in the lubrication regime of elastohydrodynamic lubrication (EHL) [2]. The contact pressure in the EHL film can reach several gigapascals, so that the viscosity of the lubricant is very high at such high contact pressures. Upon rolling/sliding motion, the shear stress increases dramatically and typical lubricants behave in a non-Newtonian manner at such high shear stress [3]. To model and assess the local shear stress and, thus, friction in EHL-lubricated contacts, it is essential to know the non-Newtonian rheological behavior of lubricants under conditions of high pressure and high shear. Such knowledge would also help to develop low-friction (energy efficiency) lubricants for machine elements.
The high-pressure rheological behavior of lubricants is schematically shown in Figure 1 [3]. It is called a flow curve, which is usually a plot of shear stress versus shear rate. At low shear rates, lubricants behave in a Newtonian manner, where the shear stress increases linearly with shear rate. When a critical stress, τ c , is reached, the lubricant starts to undergo shear thinning, which is characterized by a non-linear increase in shear stress with increasing shear rate, shown by a gradual decrease in the slope of the flow curve in Figure 1. With a further increase in the shear rate, the curve reaches a plateau regime, featuring no further increase in shear stress with shear rate. The plateau regime is called the limiting shear stress (LSS) state. The definition of the LSS was first proposed by Smith [4] and it represents the maximum stress that a fluid can transfer. Bair and Winer [5] pointed out that the LSS determines the maximum traction force in highly loaded EHL contacts. For typical lubricants of gears and bearings, the coefficient of friction of full film EHL hardly exceeds 0.08. For more information on the flow curve and related high-pressure rheology, interesting readers are referred to Refs. [3,6].
The LSS is usually believed to be a kind of shear localization such as a wall slip [7,8] or a plug flow [9,10]. Some other work suggested that LSS may be related to the thermal effects and glass transition of lubricants [11,12,13,14]. Over the past decades, molecular dynamics (MD) simulations have been used to simulate the rheological properties of fluids under conditions of high pressure and high shear [15,16,17]. Although the occurrence of LSS has been extensively studied in the past, its physical origins are still unknown [18,19]. Without detecting its nature, this study focuses on the measurements and modeling of the LSS of lubricants at high pressures.
The most widely used method to measure the LSS of lubricants is based on the measurement of traction curves of EHL-lubricated contacts [13,19,20,21]. The traction curve is usually a plot of the coefficient of friction against slide-to-roll ratio (SRR). This can be achieved by means of traction machines in the form of either a twin-disc or a ball-on-disc configuration [22], with tests performed at a certain contact pressure, entrainment velocity, and supplied oil temperature. Macroscopically, the LSS may refer to the average shear stress in the contact region when the coefficient of friction is independent of the SRR; see details in Section 3. It has been shown that the LSS is strongly dependent on pressure [13,20,21,23,24]. Fang et al. [20] proposed a non-average method to investigate the elastic–plastic properties of traction fluids in EHL contacts and the results showed that the LSS and pressure were linearly related. Ndiaye et al. [21] investigated the effects of pressure and temperature on the LSS, based on traction measurements and proposed a new model to express the LSS.
As pointed out by Ndiaye et al. [21] for the measurement of LSS, it is important to ensure that traction tests are performed at a relatively constant temperature. To achieve this, an appropriate entrainment velocity needs to be selected to reduce the influences of both shear heating at a high velocity and mixed lubrication at a low velocity. Their results demonstrated that the entrainment velocity corresponding to the lambda ratio (ratio of the minimum film thickness to the combined surface roughness) of three could be selected as the transition velocity from mixed lubrication to full film EHL in lubricated point contacts. However, many studies have shown that when the lambda ratio is less than three, e.g., about one, the lubrication regime has already been in the full film EHL for the studied engineering surfaces [25,26]. Currently, there is still no widely accepted criterion to judge the transition of lubrication regimes through the lambda ratio or other parameters.
In this study, we proposed a new practical approach for the selection of the entrainment velocity that enables full film EHL conditions without using the criterion of a lambda ratio of three, as in Ref. [21], and, hence, further minimizes the influence of thermal effects for the LSS measurements. It may contribute to a more accurate measurement of the LSS of lubricants through traction mapping using a ball-on-disc traction rig. The LSS of two lubricants, PAO40 and complex ester, is characterized at different contact pressures. A bilinear model is used to depict the measured LSS. The influences of the entrainment velocity selection on the LSS characterization are discussed.

2. Experimental Methods

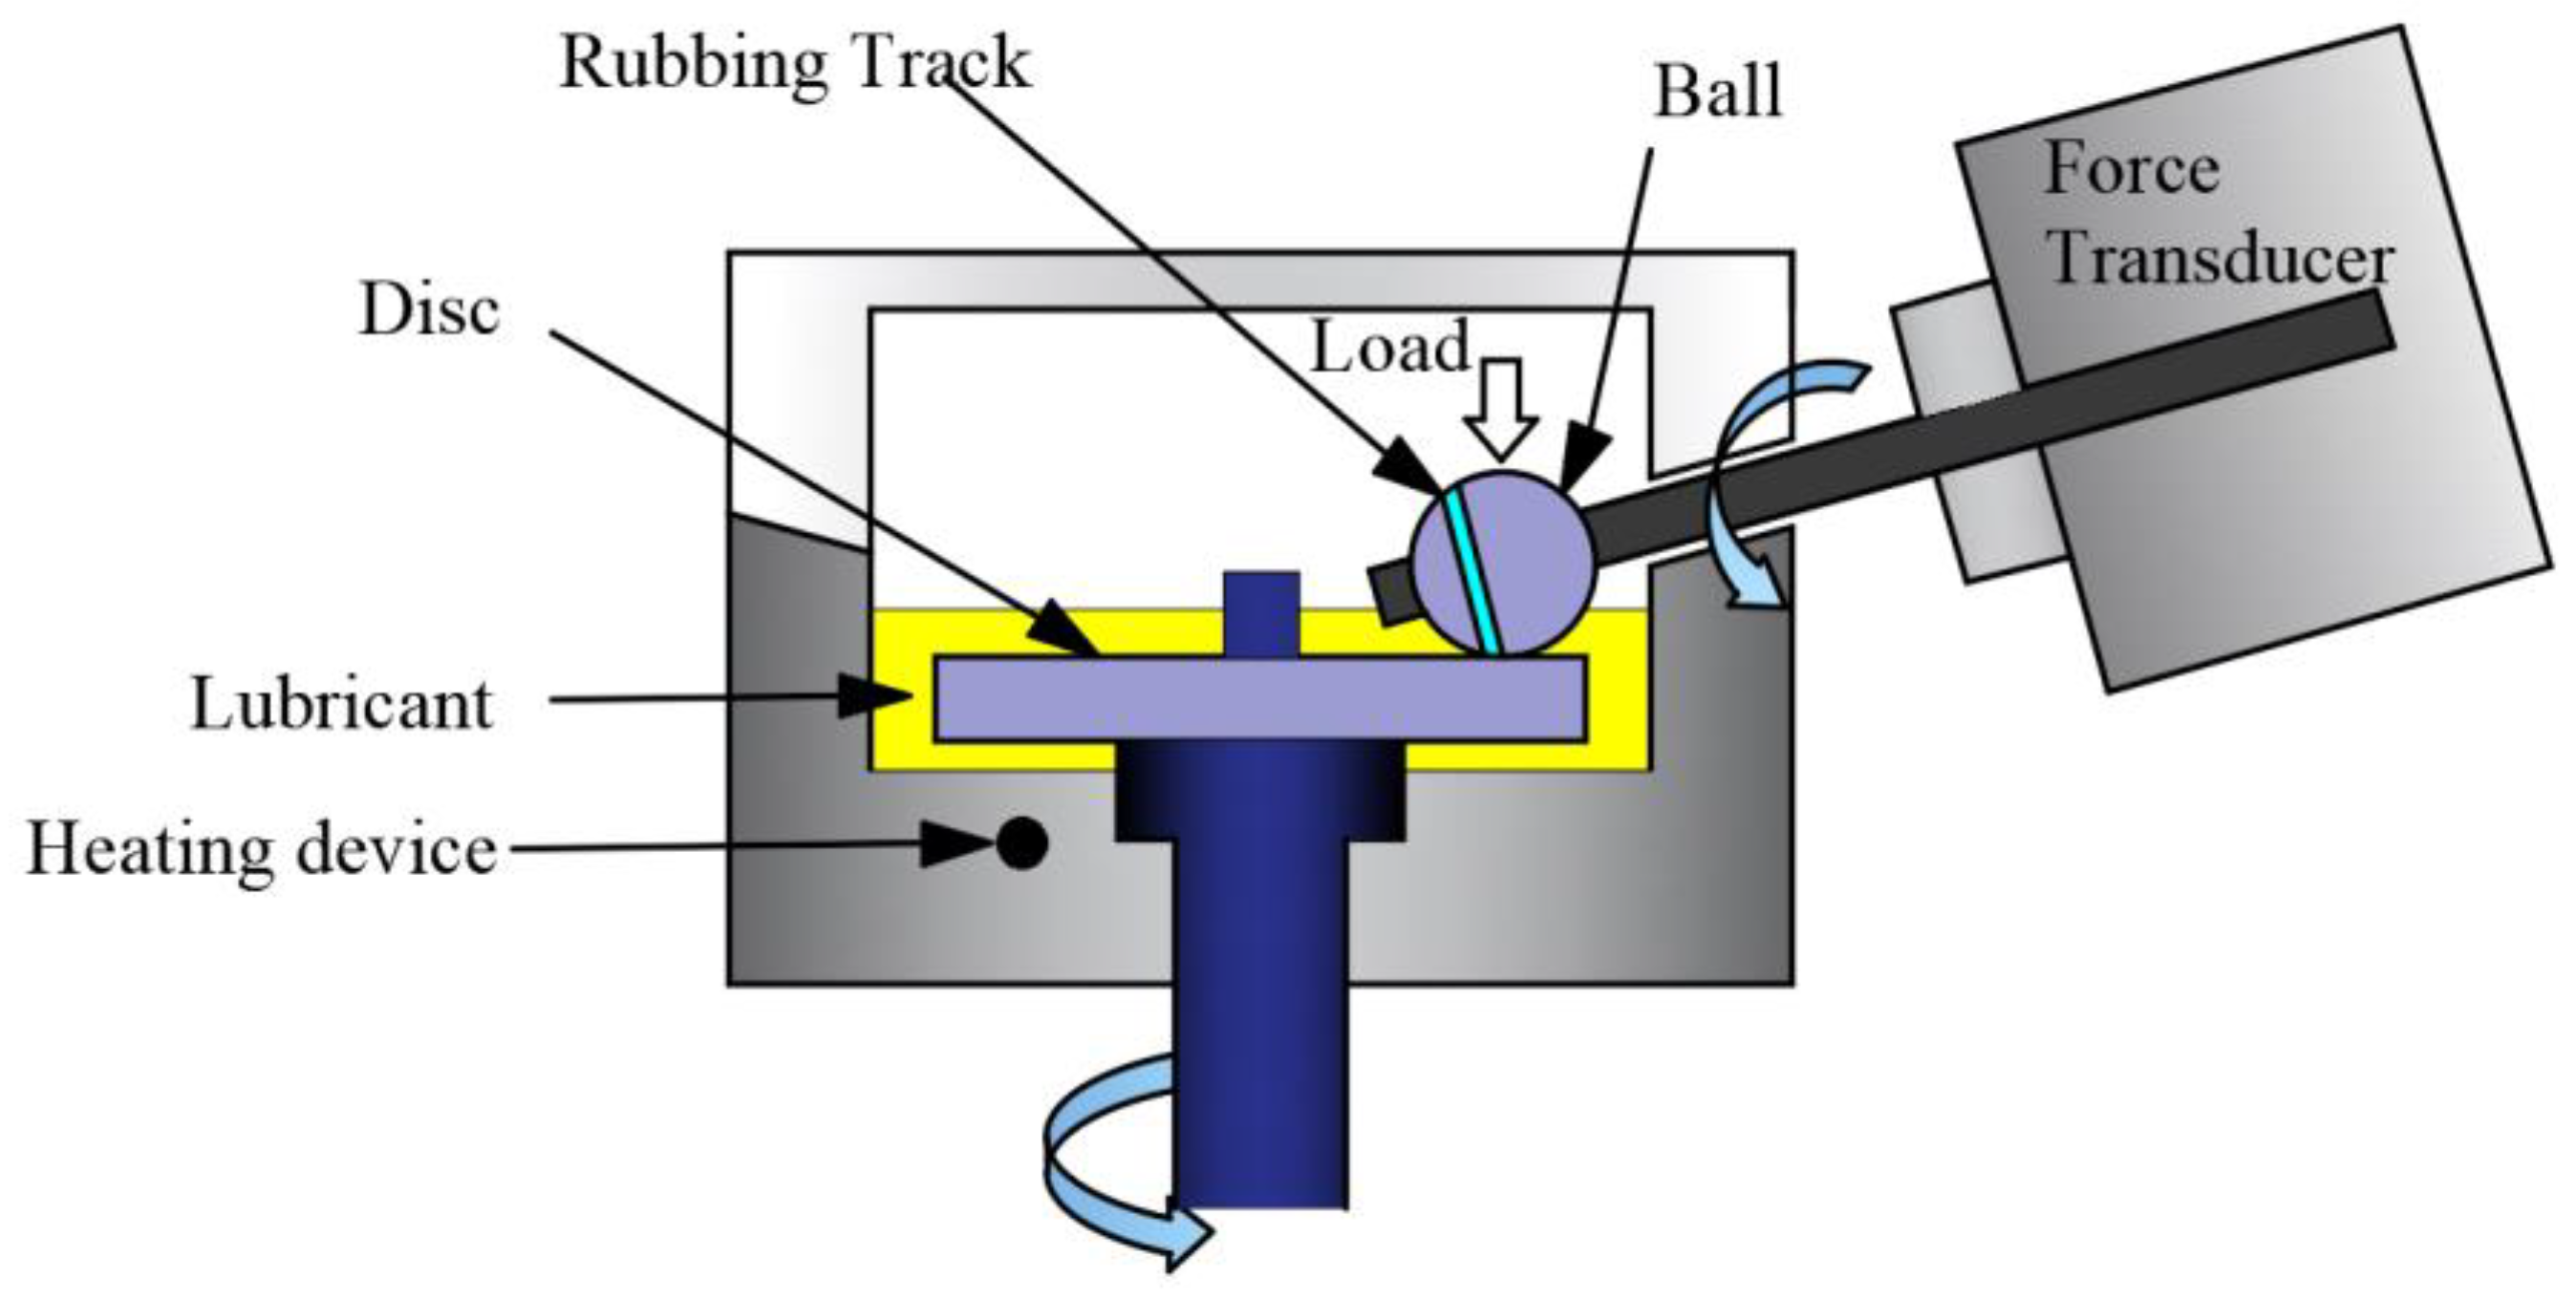
2.1. Traction Machine

Traction curves were measured on a mini-traction machine (MTM2, PCS Instruments, UK), as schematically shown in Figure 2. A ball with a diameter of 19.05 mm is loaded on a polished disc, which forms a circular (point) contact. The ball and the disc are driven independently by two motors, to achieve different entrainment velocities and slide-to-roll ratios (SRRs). The entrainment velocity, u e , is defined as u e = ( u 1 + u 2 ) / 2 , where u 1 is the velocity of the disc and u 2 is the velocity of the ball. The slide-to-roll ratio, SRR, is defined as SRR =  u s / u e , where u s = | u 1 u 2 | is the sliding velocity.
Before traction measurements, about 30 mL of lubricant was added into the pot until the submergence of the upper working surface of the disc was observed. This can meet the requirement of sufficient lubricant supply, i.e., avoid starvation during traction measurements. The temperature of the oil bath is well-controlled using an accurate closed-loop system in a range from 25 °C to 140 °C. The traction force is measured using a force transducer mounted on the ball shaft. The ball-driving shaft is tilted towards the center of the disc, aiming to eliminate the influence of spin effect on traction. It should be noted that the measured traction is sliding friction only, because the rolling friction is eliminated by averaging the absolute values of the two friction forces measured at positive and negative SRRs.

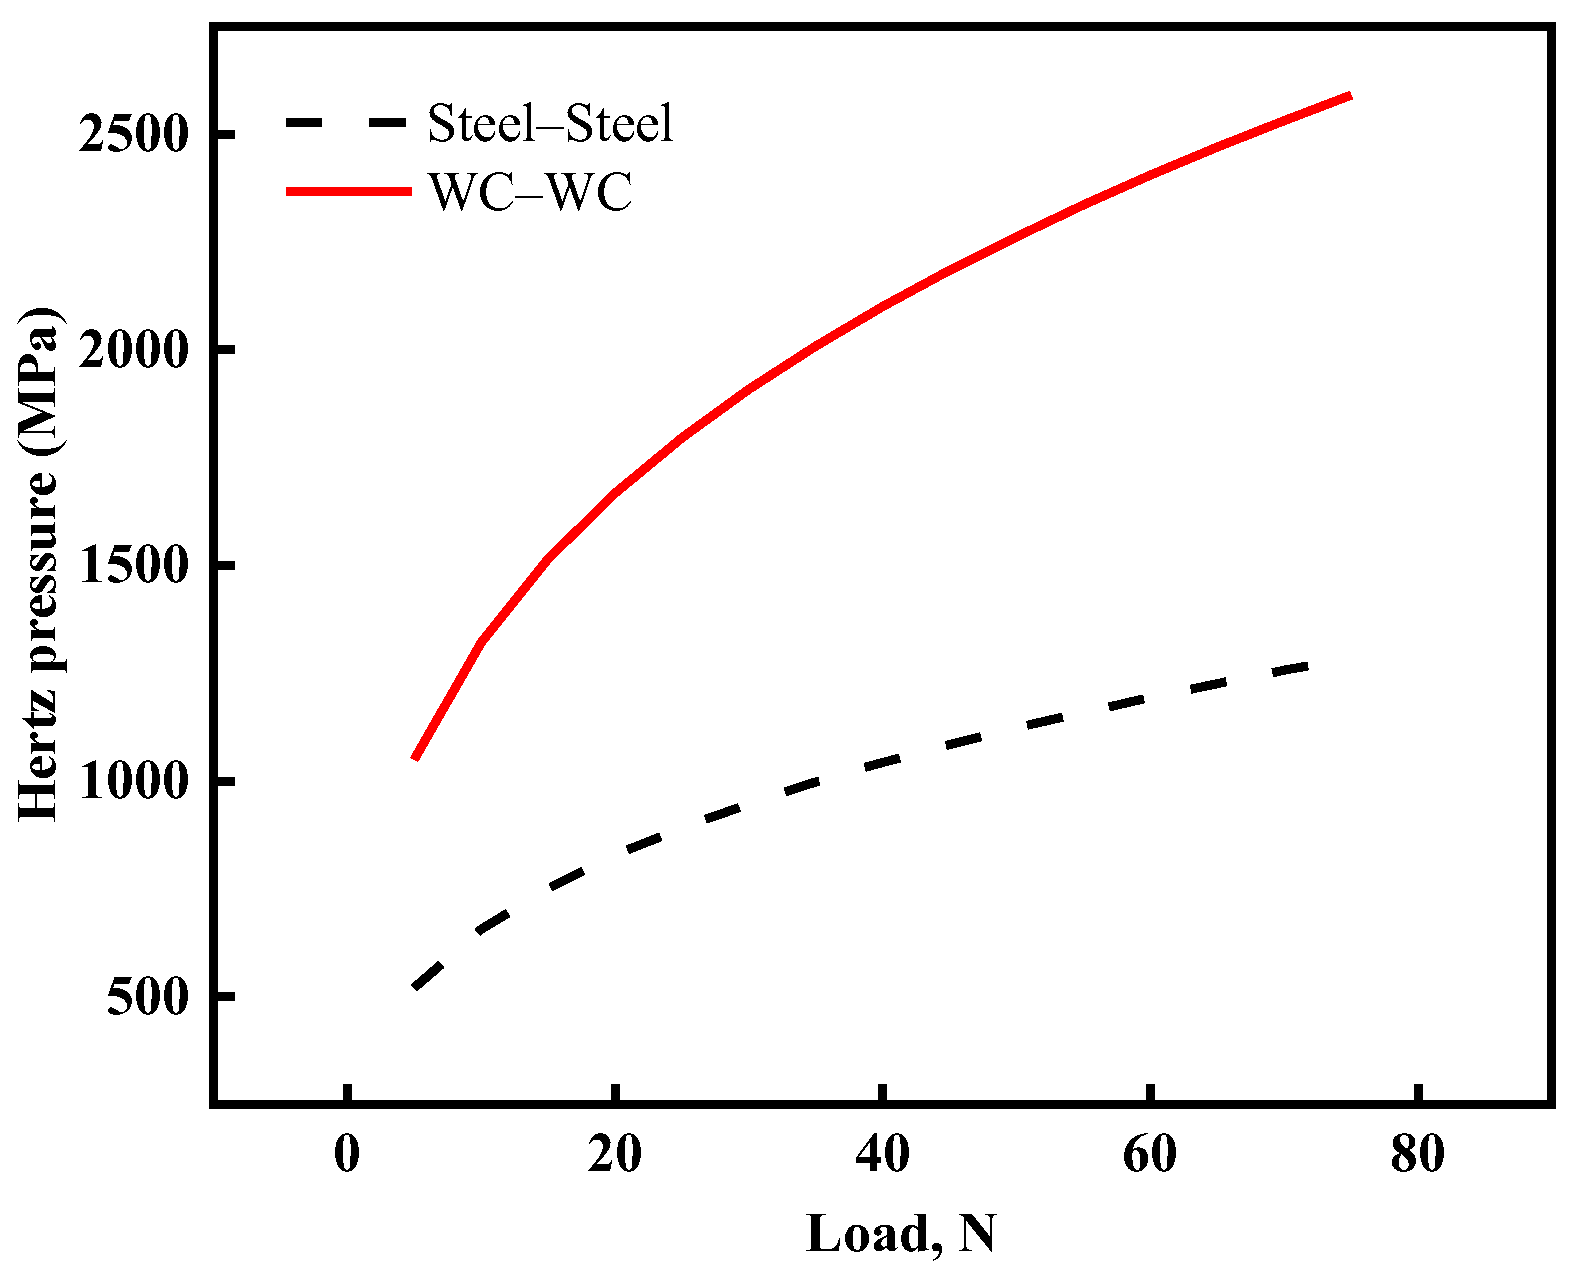
2.2. Specimens and Lubricants

The maximum load of MTM2 is 75 N and corresponds to a maximum Hertzian contact pressure of 1.25 GPa for specimens (i.e., both ball and disc) made of AISI 52,100 bearing steel. However, in practical engineering, the maximum Hertz contact pressure can reach 2.5 GPa in rolling bearings and gears [2,27]. In addition, the measurements of the LSS require conditions of high contact pressures that are generally higher than 0.8 GPa [3,24]. Therefore, tungsten carbide, WC, material (K20) was used for both the ball and the disc in order to achieve high pressures. The physical parameters of K20 are shown in Table 1. The K20 carbide has a higher elasticity modulus compared to AISI 52,100 bearing steel, allowing for a higher contact pressure under the same load, as shown in Figure 3. The surface roughness values, Ra, of the balls and the discs used in the tests were both smaller than 20 nm. This could help to ensure full film EHL at relatively low entrainment velocities. The geometrical and physical parameters of the specimens are shown in Table 1.
Two types of base oils, PAO40 and complex ester, were used as lubricants in this study. They have the same kinematic viscosity of 39 mm/s2 at 100 °C. PAO40 was purchased from Mobil Corporation and the complex ester was supplied by Qingdao Lubemater Lubrication Material Technology Corporation. Both lubricants were free of additives. Their viscosity, density, and viscosity index are shown in Table 2.

2.3. Operating Conditions

The maximum Hertzian contact pressure, p H , of rolling/sliding contacts in machine elements is typically in the range of 0.5 GPa to 2.5 GPa. These correspond to a mean contact pressure, p m , from 0.33 GPa to 1.66 GPa. By considering the above pressure range in practice and the high-pressure conditions required for LSS measurements, the mean Hertzian contact pressures used for traction measurements in this work were 1.2 GPa, 1.3 GPa, 1.4 GPa, 1.5 GPa, 1.6 GPa, and 1.7 GPa, corresponding to loads of 25 N, 32 N, 40 N, 49 N, and 72 N with the MTM2. The oil bath temperature was fixed at 40 °C and the SRR varied in the range of 0–50%. Before tests, the ball and the disc were ultrasonically cleaned, separately, in petroleum ether for 10 min. The oil pot was cleaned with petroleum ether and then with alcohol.
The lubricated rolling/sliding contact can be in EHL, mixed lubrication, and boundary lubrication, depending on the operating conditions and the lubricant being tested. To determine the LSS from measured traction curves, it is necessary to select an appropriate entrainment velocity that ensures full film EHL, which avoids the influence of asperity contacts and the resulting boundary friction on the LSS determination. Meanwhile, it is necessary to choose an entrainment velocity as small as possible to achieve a thin film thickness to reduce the influences of thermal effects on LSS measurements [21,22].
In this study, traction curves at a series of entrainment velocities, u e , were measured. A practical approach of velocity selection and its influence on the LSS determination will be given in Section 3.3 and Section 4.4, respectively. The operating conditions are listed in Table 3.

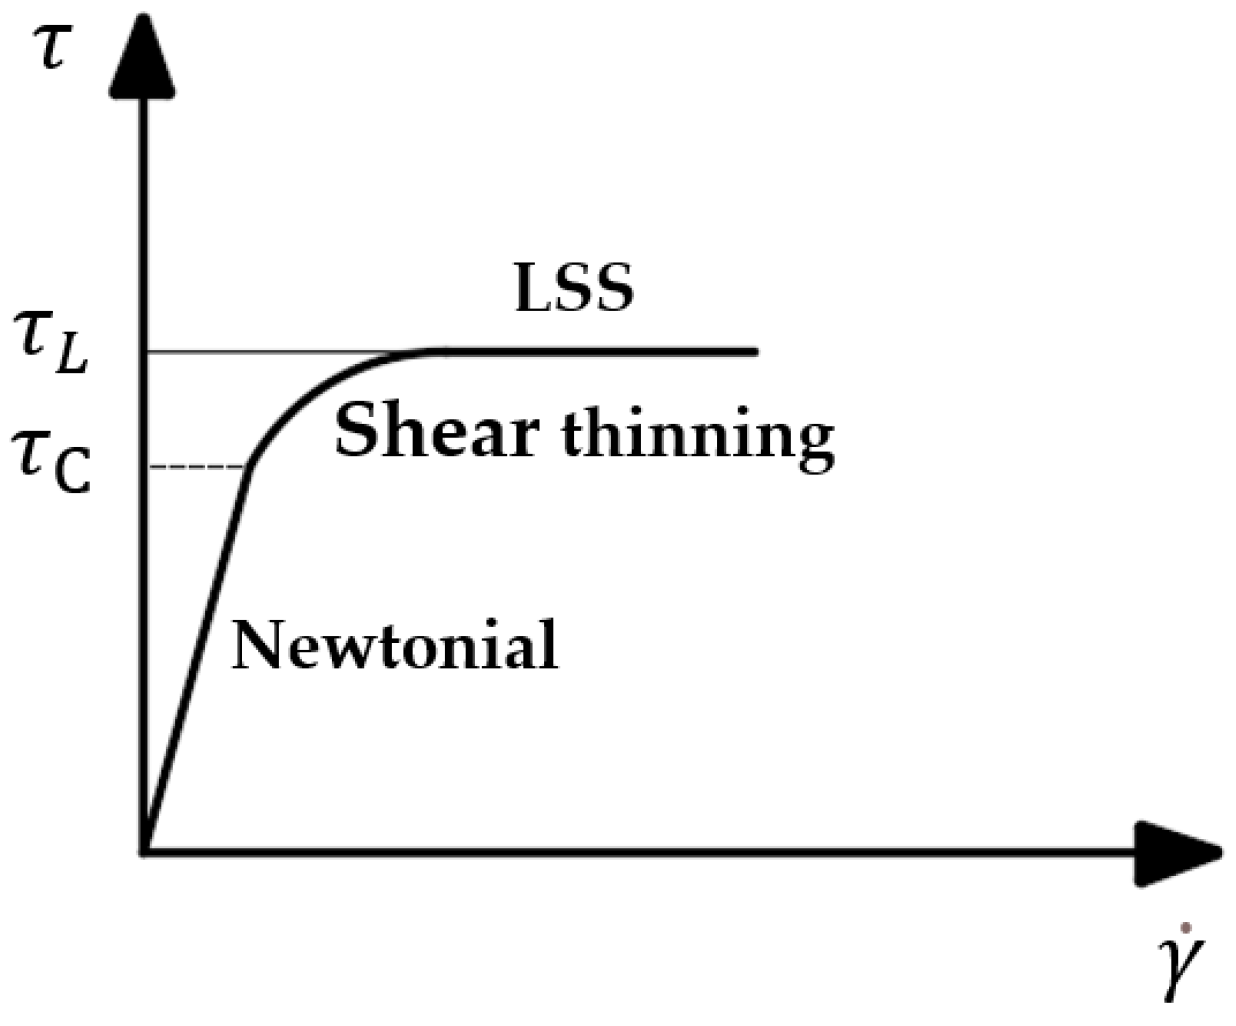
3. Limiting Shear Stress (LSS) Measurement

In this study, the LSS of lubricants is derived from measured traction curves. In Section 3.1, we firstly describe the characteristics of traction curves measured at different operating conditions. Section 3.2 gives the approach for determining the LSS with the maximum coefficient of friction, based on measured traction curves. The approach of selecting the above-mentioned proper entrainment velocity is described in Section 3.3.

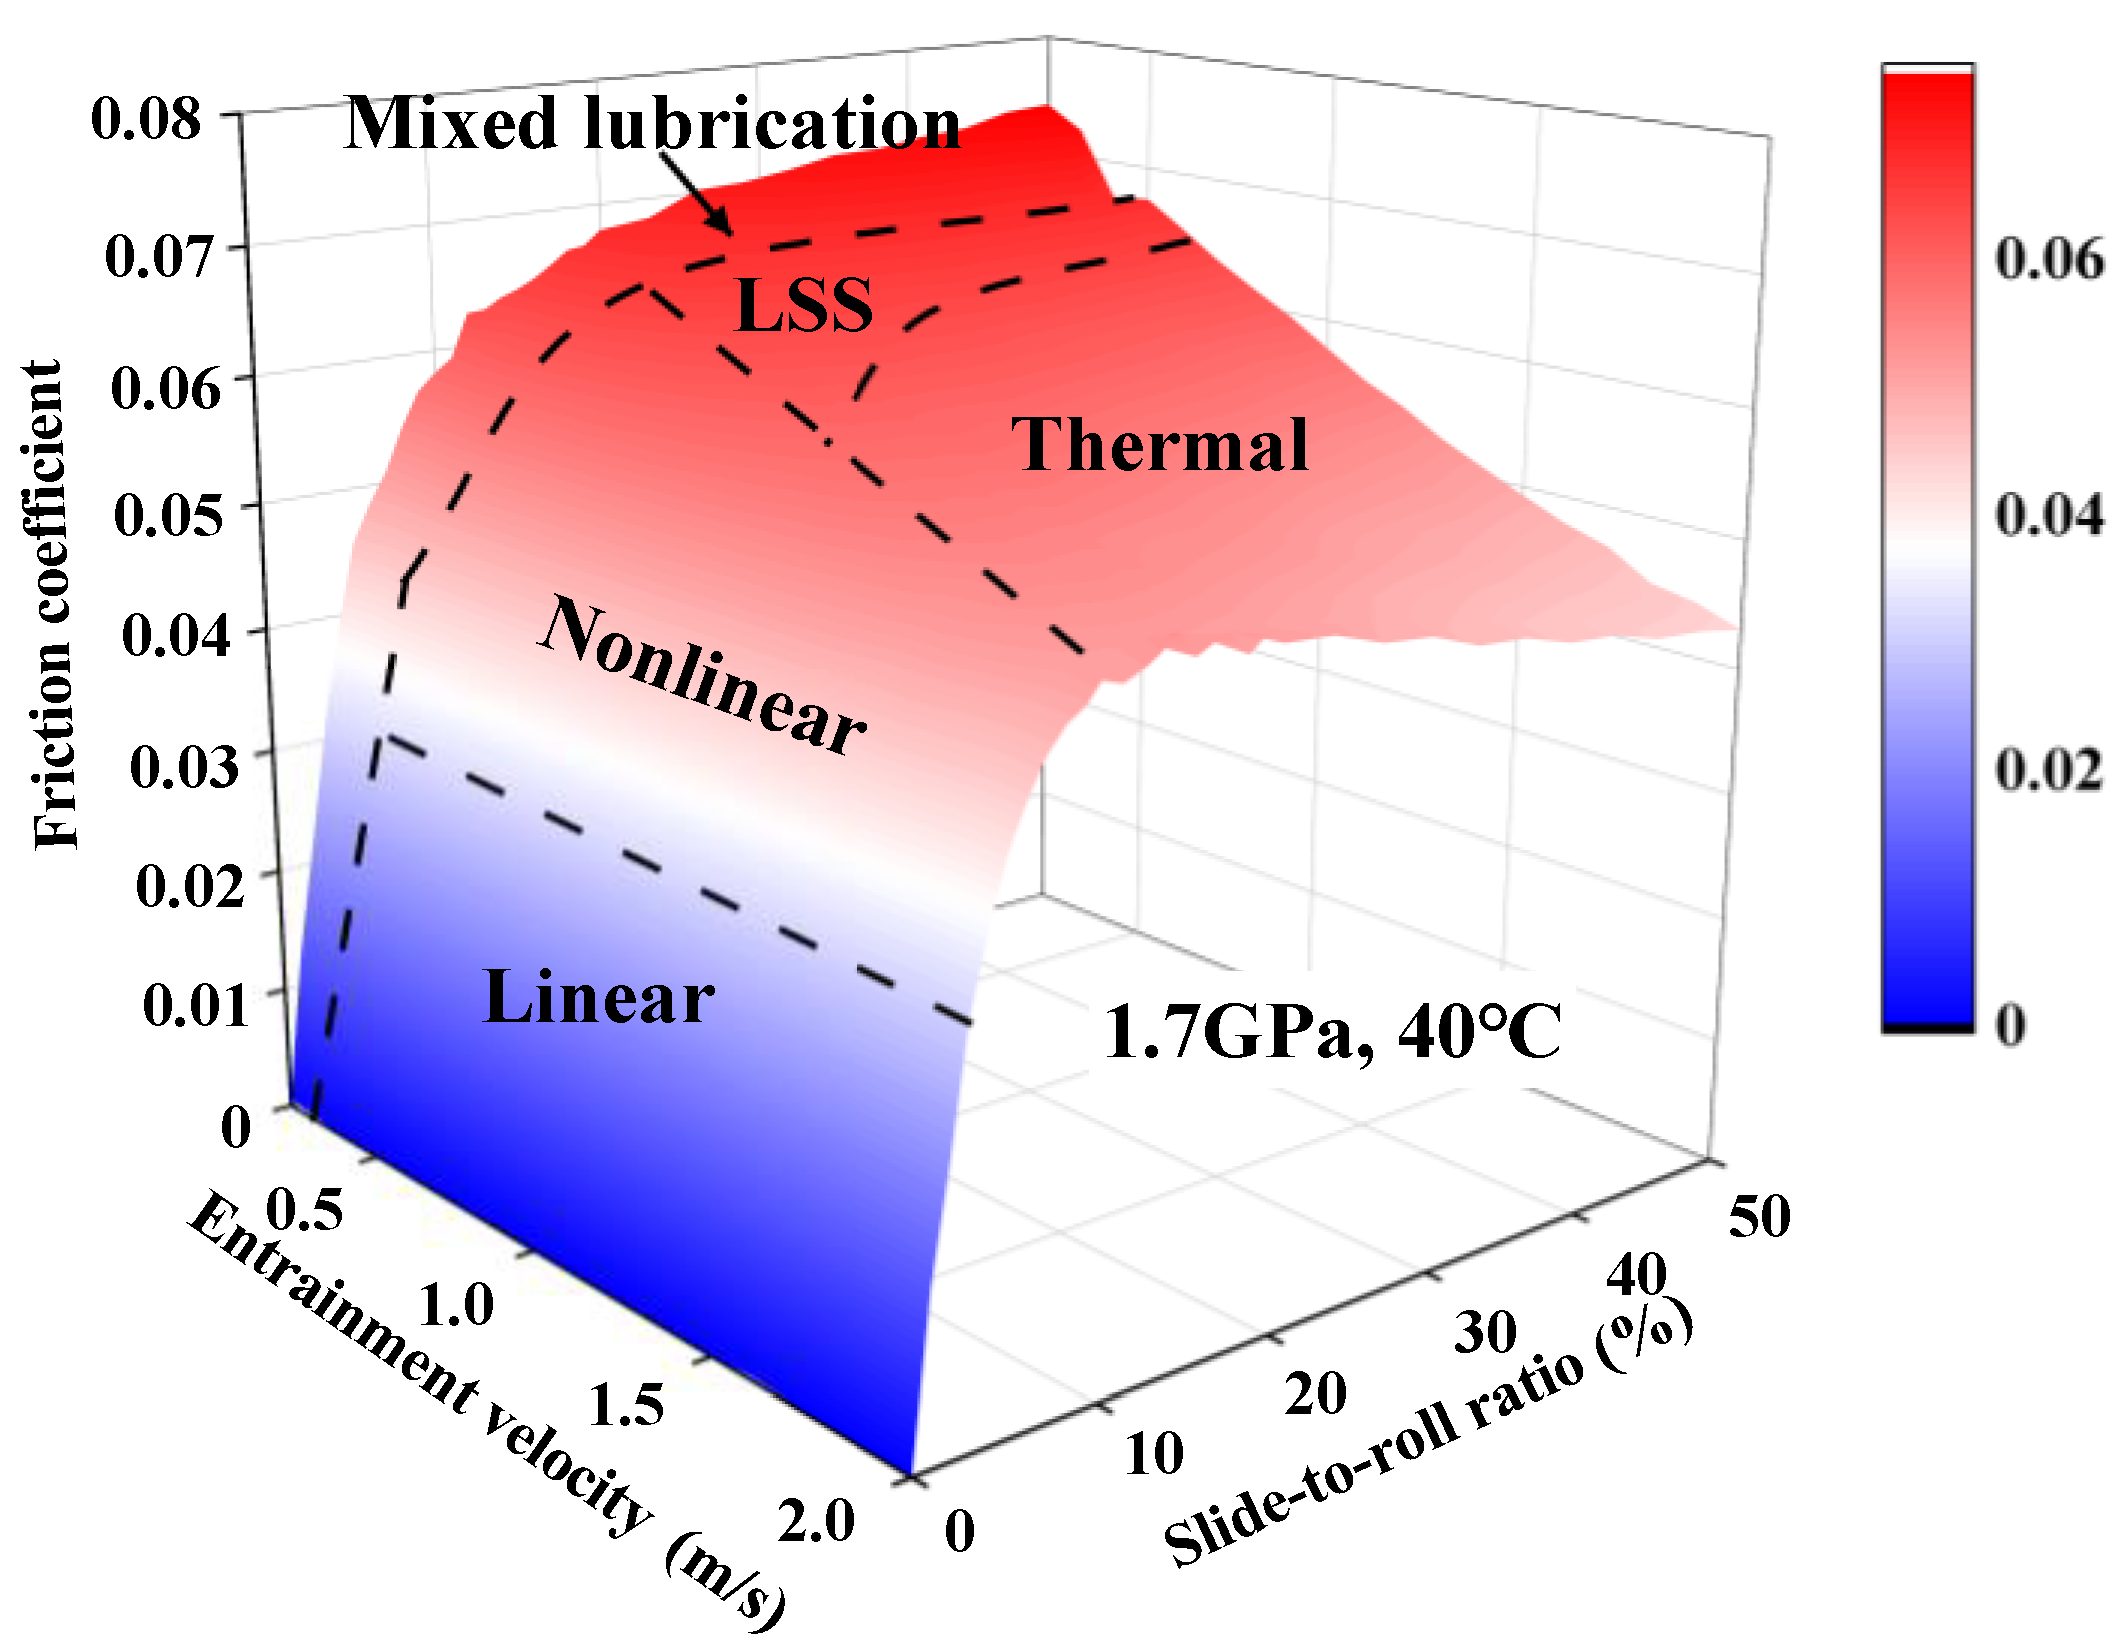
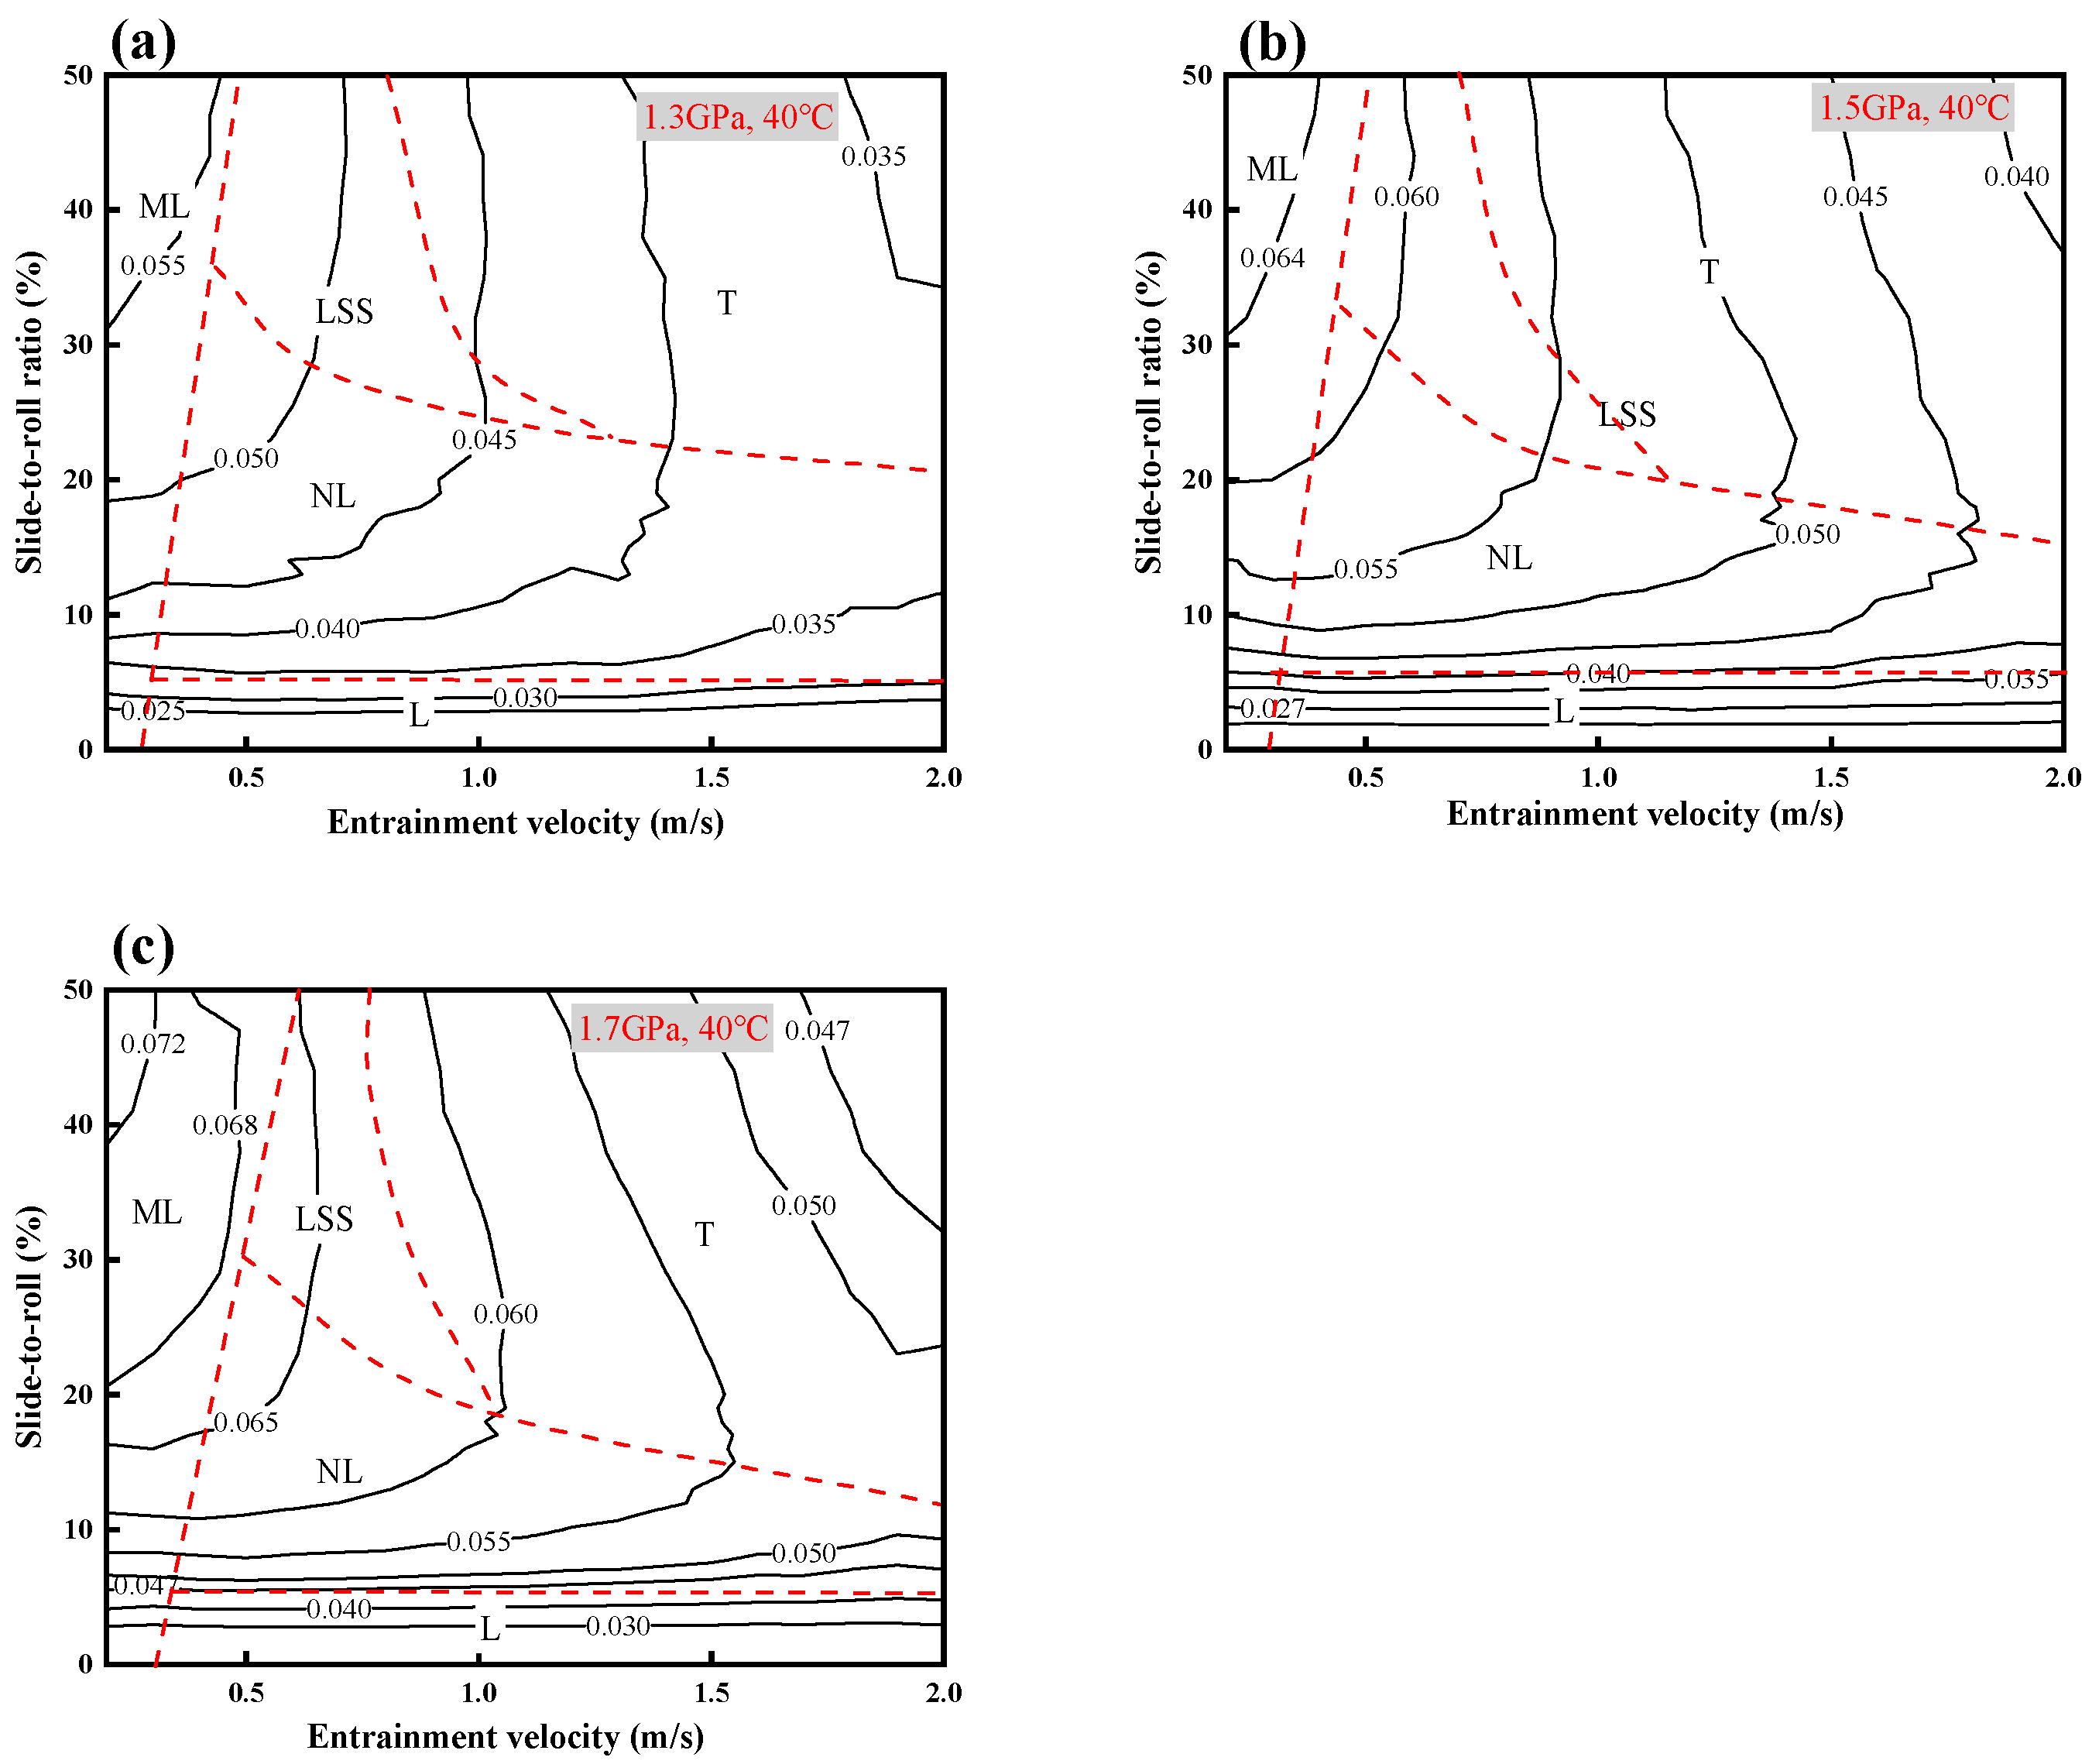
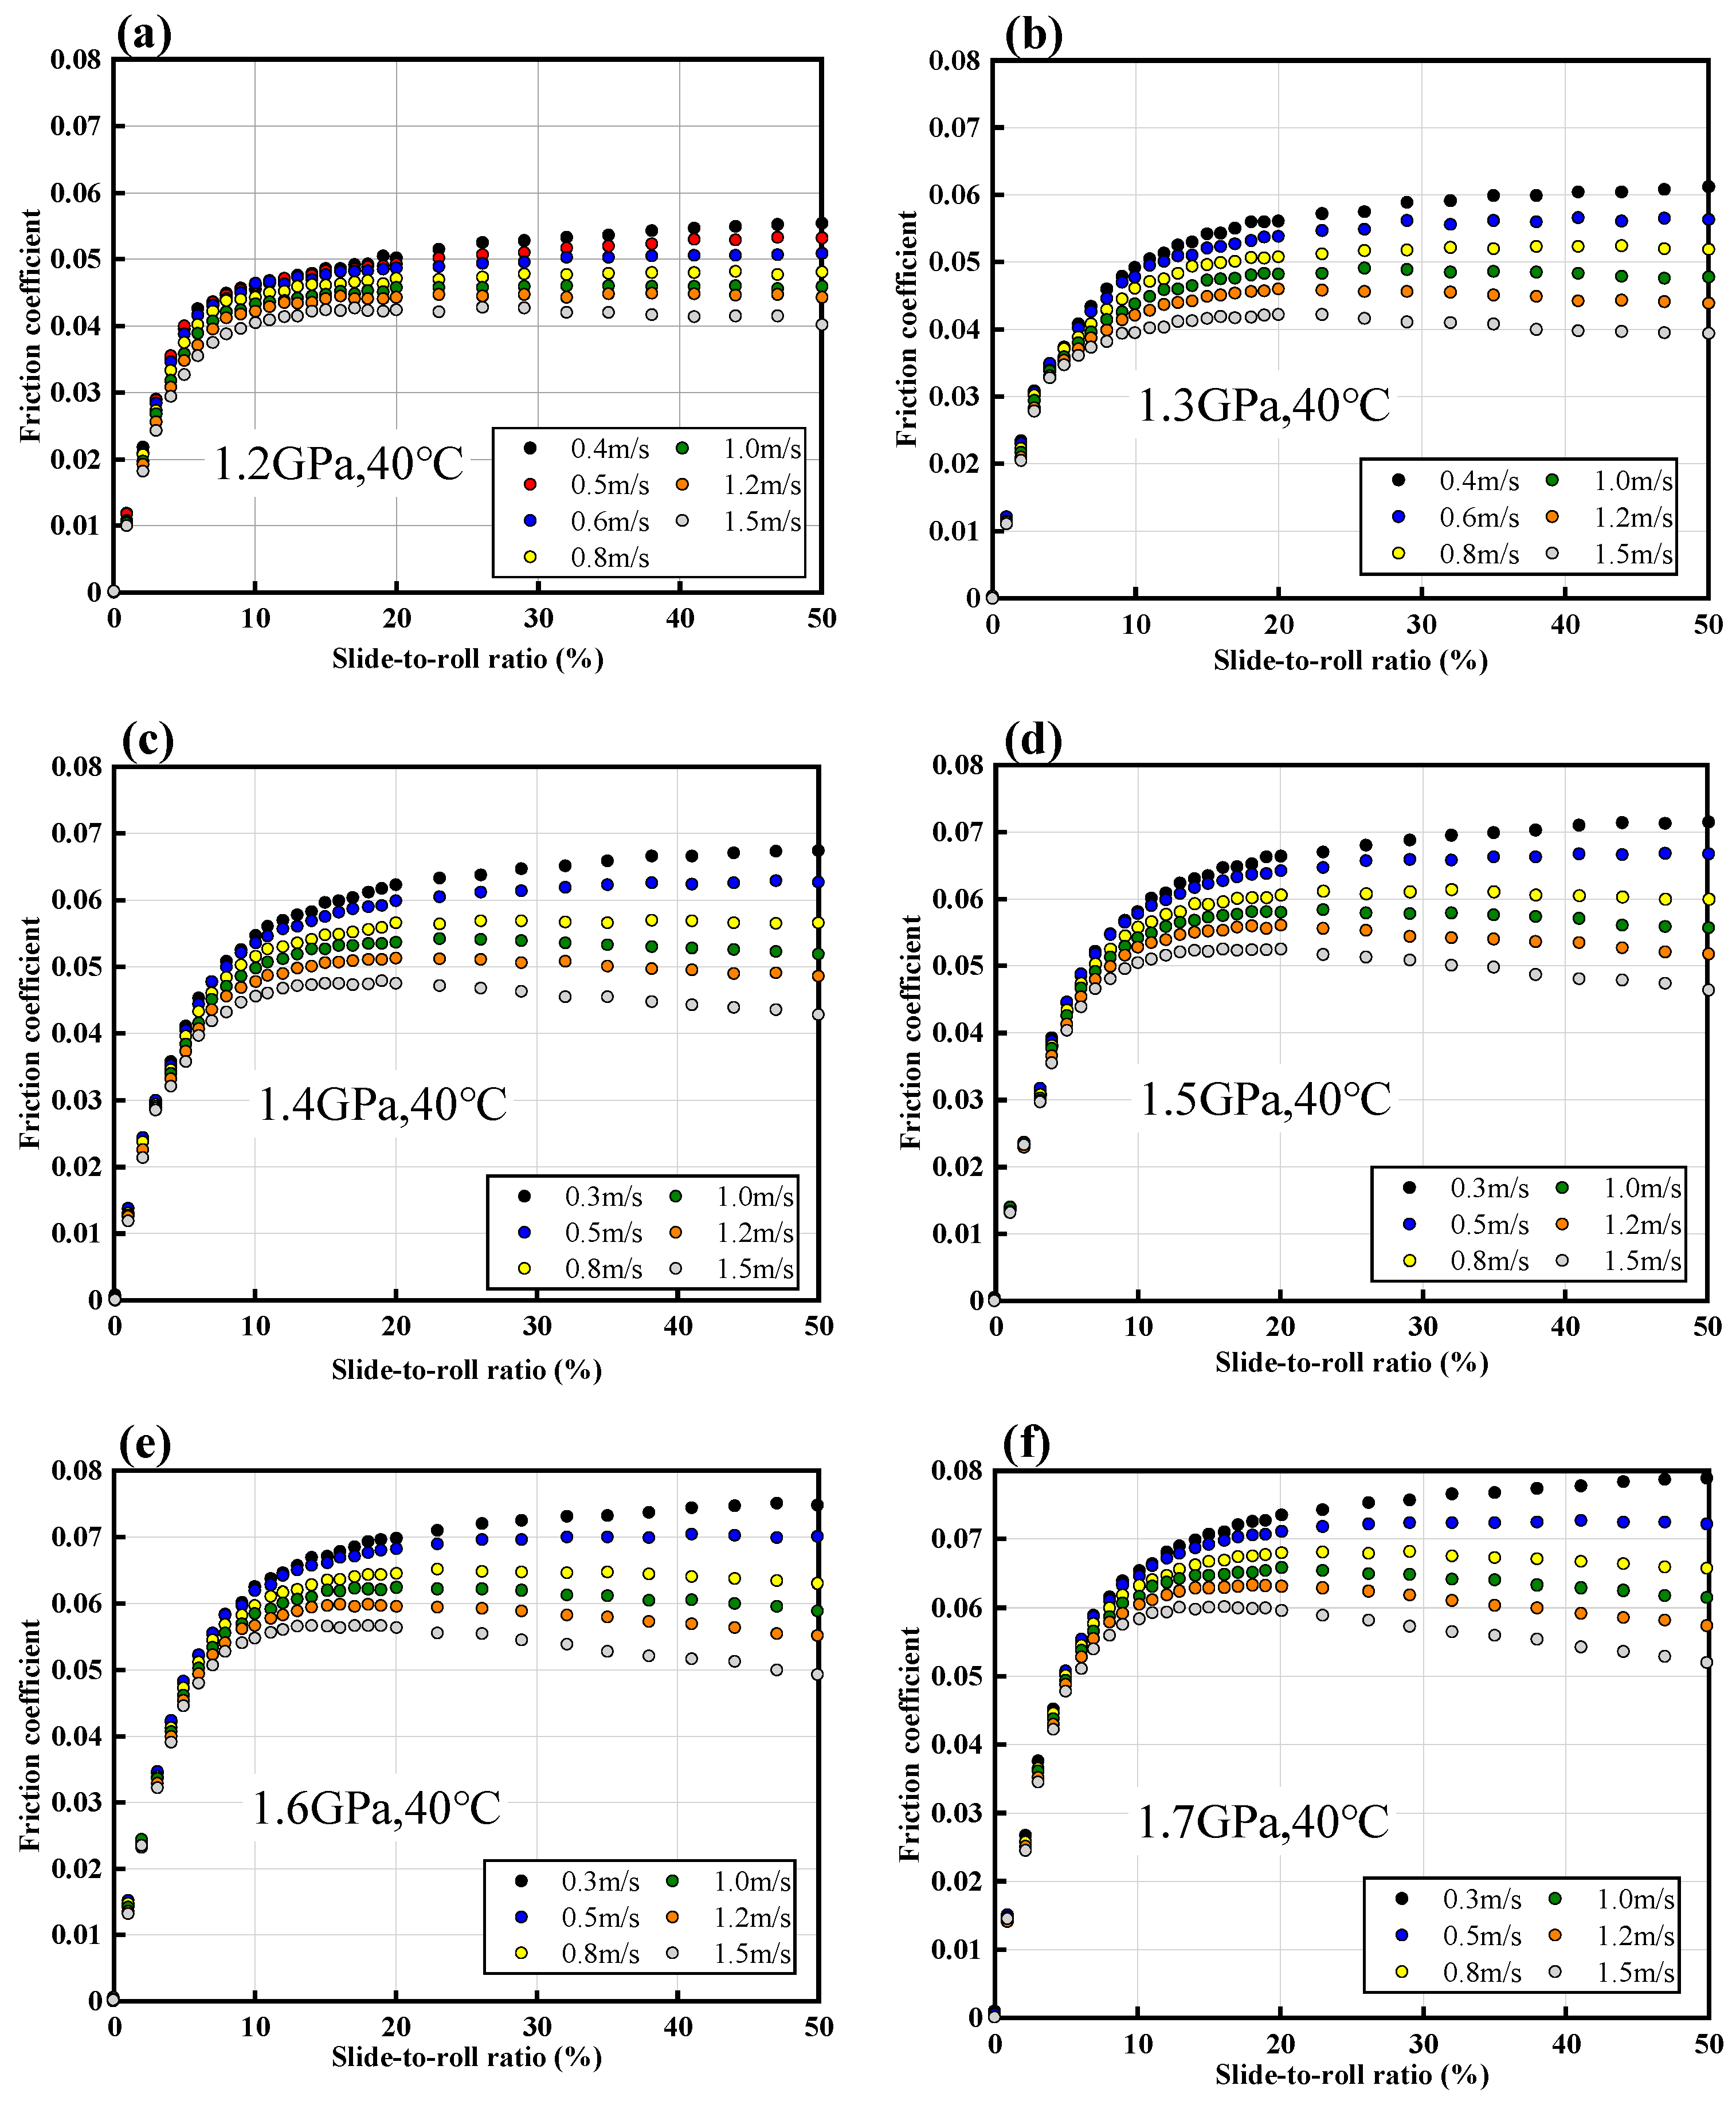
3.1. 3D Map of Traction

Figure 4 depicts the 3D friction map at different entrainment velocities for lubricant PAO40. The mean Hertzian contact pressure is 1.7 GPa and the temperature is 40 °C. The 3D friction map can be divided into five traction regions, namely linear region, non-linear region, LSS region, thermal region, and mixed lubrication region. The first four regions belong to full film EHL, while the last region belongs to mixed lubrication. Note that the transition lines in Figure 4 have been drawn based on the appearance of the friction curves, rather than any simulation or calculation.
The linear region occurs at low SRRs (usually less than 10%), in which the coefficient of friction increases linearly with SRR. Note that the linear increase behavior of the traction curve is not equivalent to the linear variation of shear stress, in terms of the shear rate in the flow curve in Figure 1, representing a Newtonian fluid. This is due to the fact that the pressure and the fluid rheological properties are non-homogeneous at different locations of the lubricated contact. The measured coefficient of friction is an average of the shear stresses over the entire contact. Interested readers are referred to Ref. [28].
As the SRR increases, the EHL traction enters the non-linear region. This is mainly attributed to the fact that the highly pressurized lubricants in the center of the contact start to show non-Newtonian shear thinning behavior. The apparent viscosity of the lubricant thus decreases locally. Therefore, the shear stress is reduced, compared to the Newtonian behavior. Meanwhile, local lubricants close to the periphery of the contact (thus, the low-pressure area) may still be in the Newtonian state [29]. As a result, the measured coefficients of friction over the entire contact exhibit a non-linear trend of increase with SRR.
With further increases in SRR, the traction may reach a “plateau” regime, characterized by an almost constant friction coefficient with SRR. This “plateau” regime is believed to be primarily attributed to reaching the LSS of lubricants under conditions of high contact pressures (0.8 GPa or larger) and high shear [25,29]. Note that the “plateau” regime appears only at a suitable entrainment velocity and/or lubricating film thickness, among other conditions. Above the proper entrainment velocity and/or the proper film thickness, the pronounced heat generation and temperature rise in the film would lead the traction regime to go to the thermal region, as marked in Figure 4, and, thus, prevent the traction curve from reaching the “plateau” regime [3,24,29,30]. The thermal region in EHL is typically characterized by a decrease in the friction coefficient with SRR, see, for example, in Figure 4. If the entrainment velocity is too low, the formed EHL film would fail to separate the asperity contacts, leading to mixed lubrication.
Figure 5c presents the corresponding two-dimensional contour plot of the 3D traction map shown in Figure 4. The 2D map illustrates the boundary (transition lines) for different lubrication regimes. The abbreviations L, NL, LSS, ML, and T correspond to the linear region, non-linear region, LSS region, mixed lubrication region, and thermal region, respectively. The zone of LSS is quite small, which highlights the difficulty in the measurements of the LSS. Figure 5a,b present the 2D contour plots of traction at two other mean contact pressures—1.3 GPa and 1.5 GPa, respectively. It can be seen that the coefficient of friction increases with increasing contact pressure and the zone of mixed lubrication gradually enlarges as a result of severe operating conditions. As a contrast, the zone of LSS does not vary significant with increasing pressures. Furthermore, as can be seen in Figure 5, the boundary between NL and L is nearly horizontal, indicating that the entrainment velocity has minimal impact on the slope of the linear traction regime.

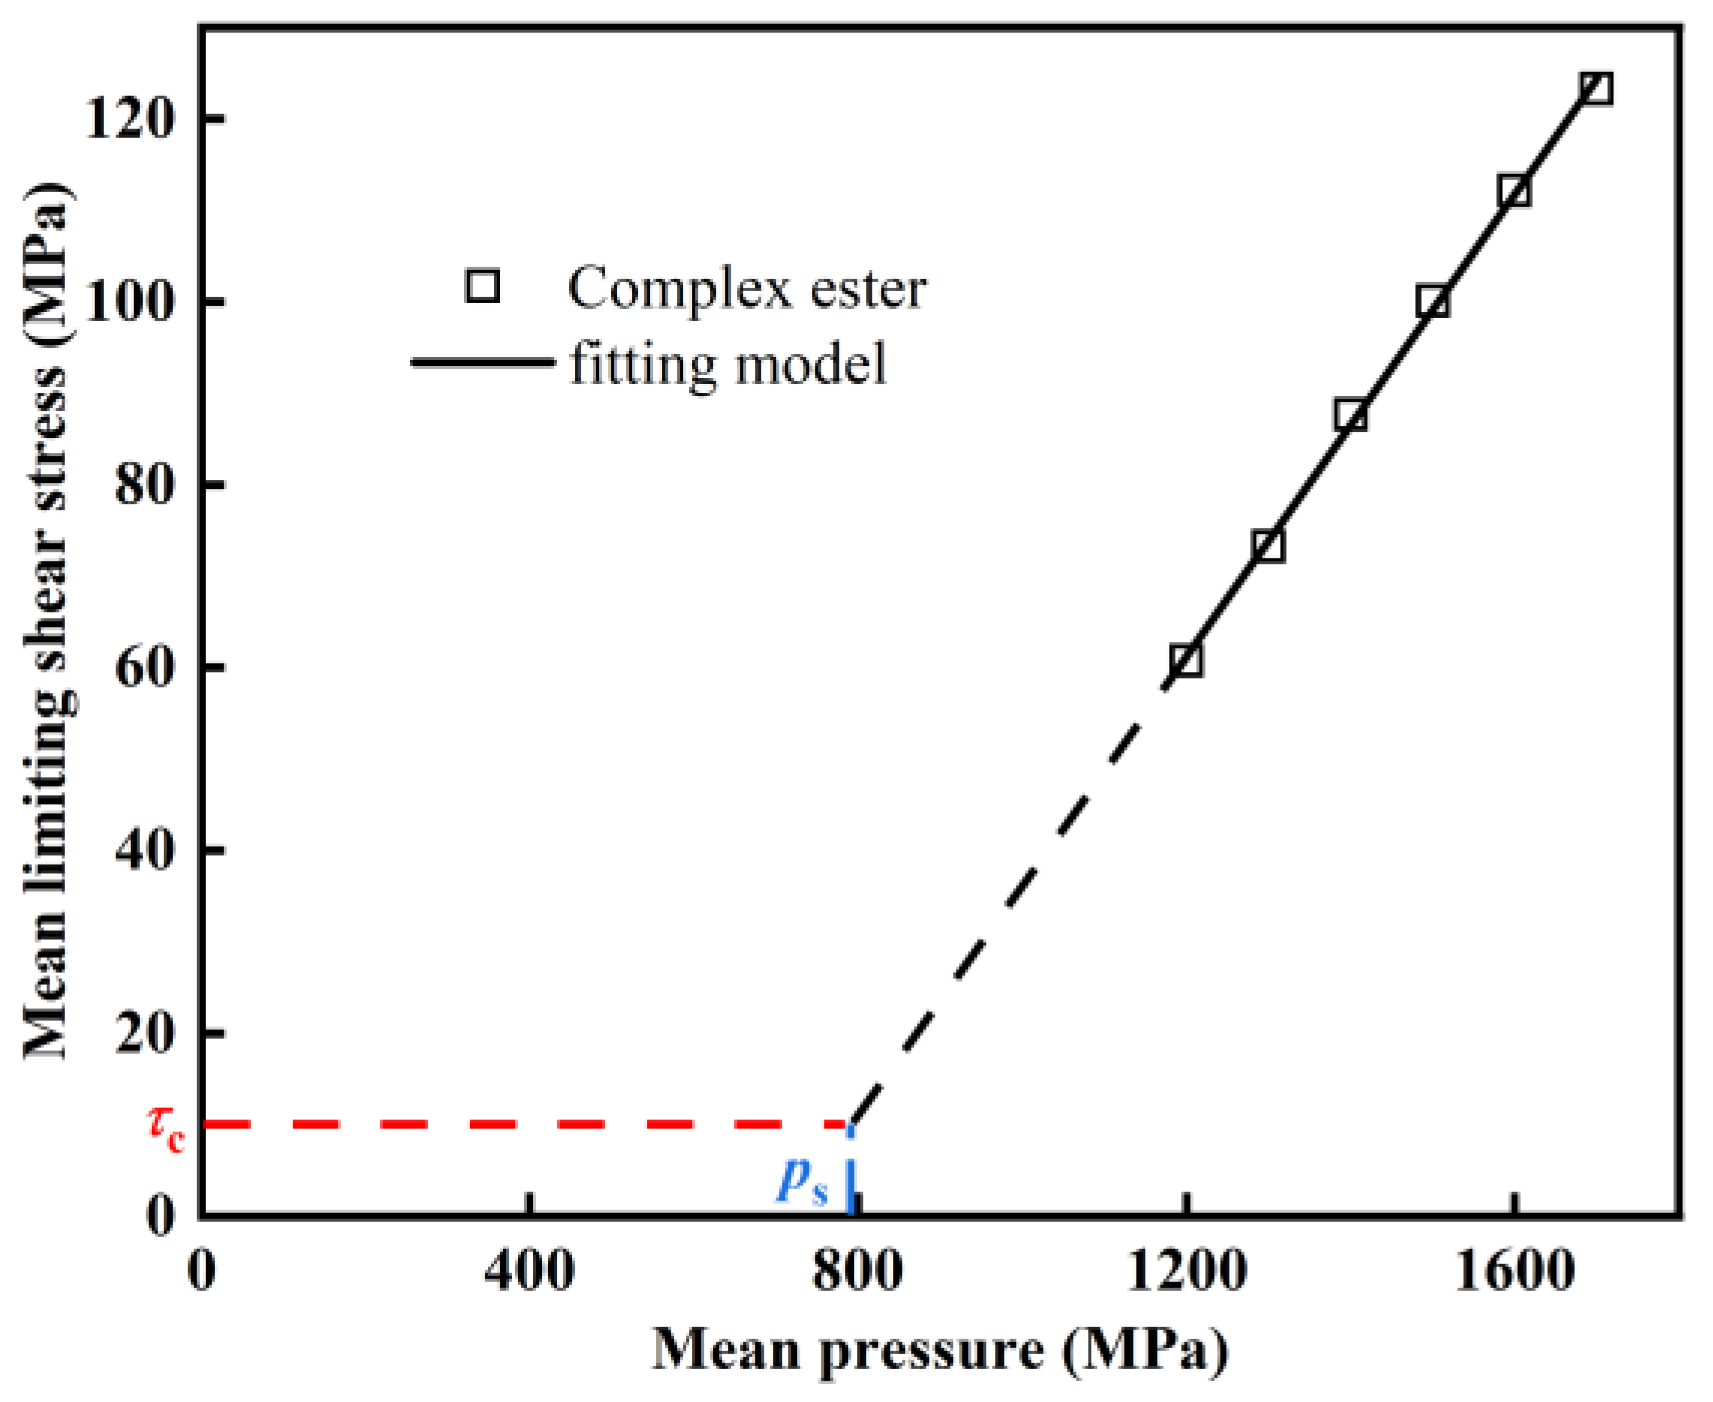
3.2. Limiting Shear Stress

The LSS of lubricants at a specific pressure can be obtained through analysis of the 3D traction map in Section 3.1, by selecting the maximum coefficient of friction, f m a x , at a specific entrainment velocity, i.e., in the “plateau region” of the measured traction curves. The principle of the velocity selection shall be detailed in Section 3.3. The relation between the limiting shear stress, τ L S S , and the maximum friction coefficient, f m a x , read as follows:
τ L S S = f m a x F N A = f m a x p m
where F N is the normal load, A the contact area, and p m the mean contact pressure. To be precise, the obtained LSS, τ L S S , through traction measurements is a mean LSS of the EHL film over the whole contact. Nevertheless, the local pressure and, thus, the shear stress are very high in the contact and the lubricant therein might be assumed to reach the LSS regime. Based on this assumption, it is meaningful to obtain a mean LSS for the specified mean contact pressure.
The LSS of lubricants at different contact pressures can be obtained by measuring a set of traction curves at different entrainment velocities (i.e., traction mapping) under different loads. The principle for the selection of the entrainment velocity and the maximum EHL friction coefficient are detailed in the following section.

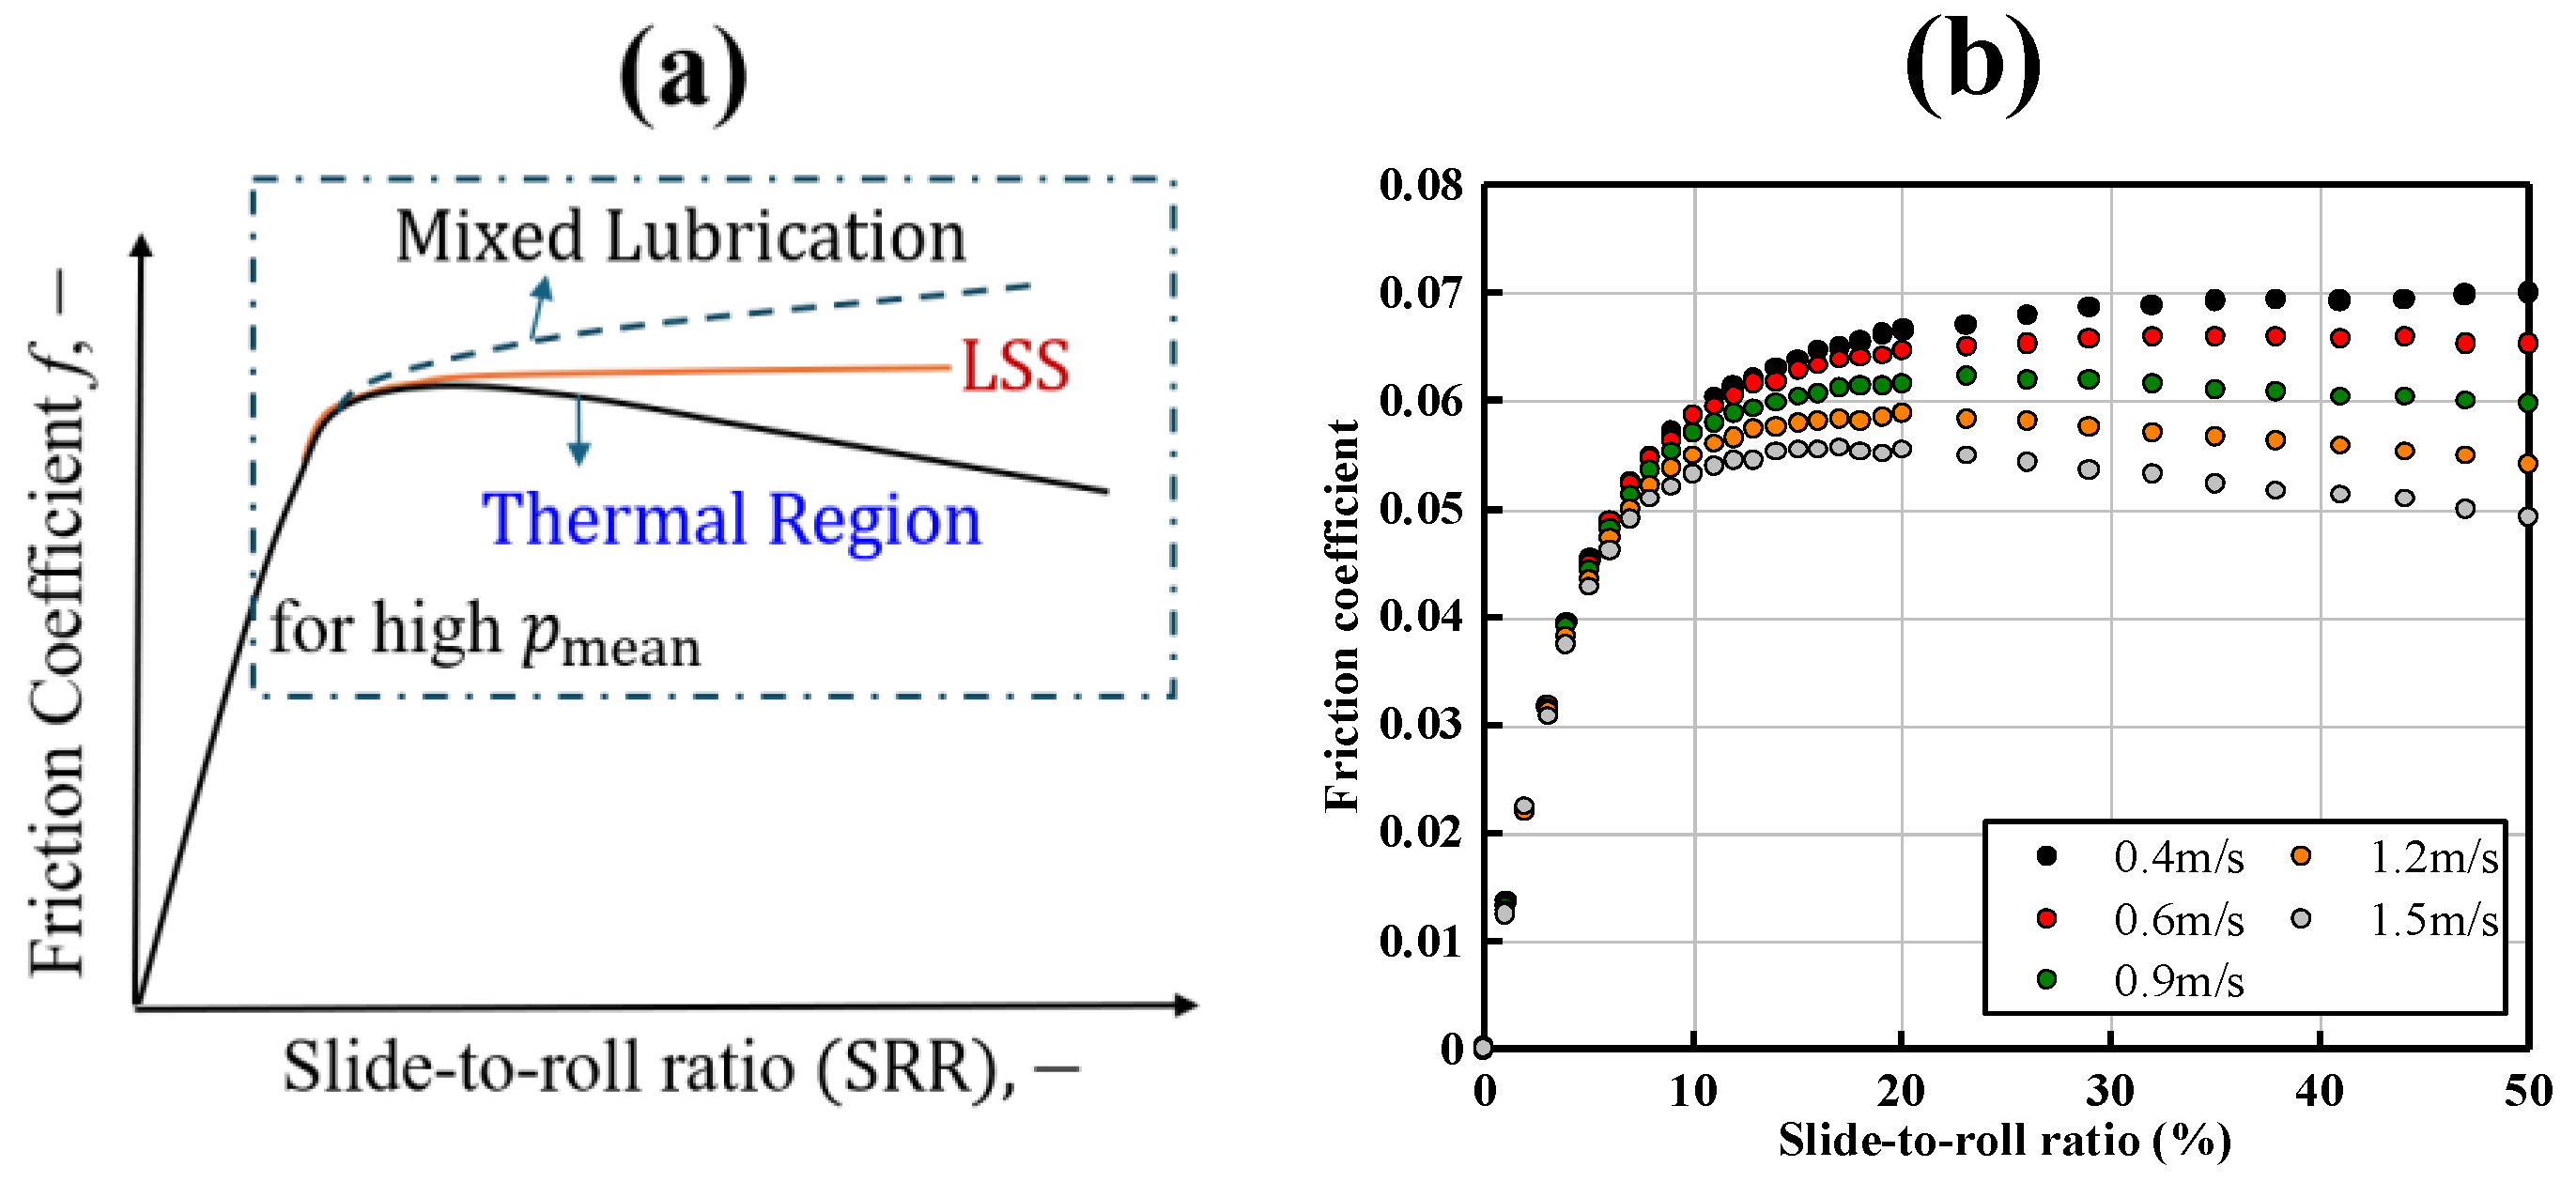
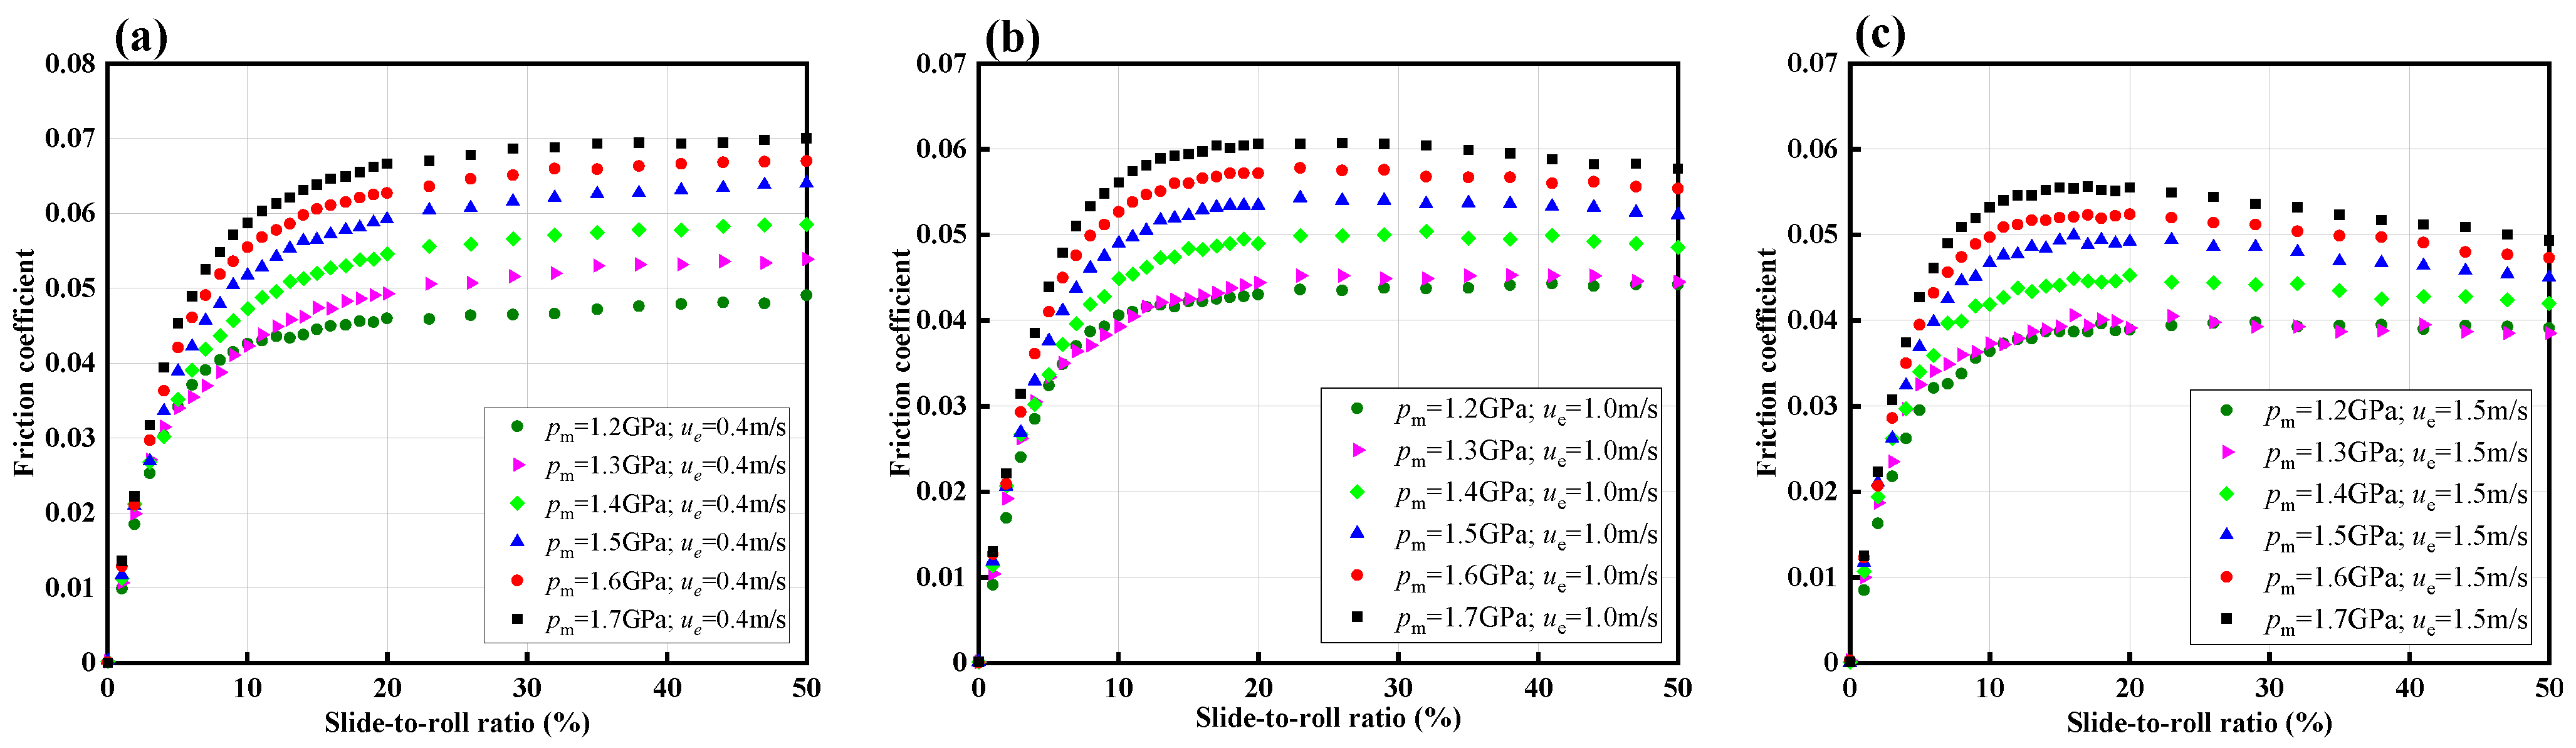
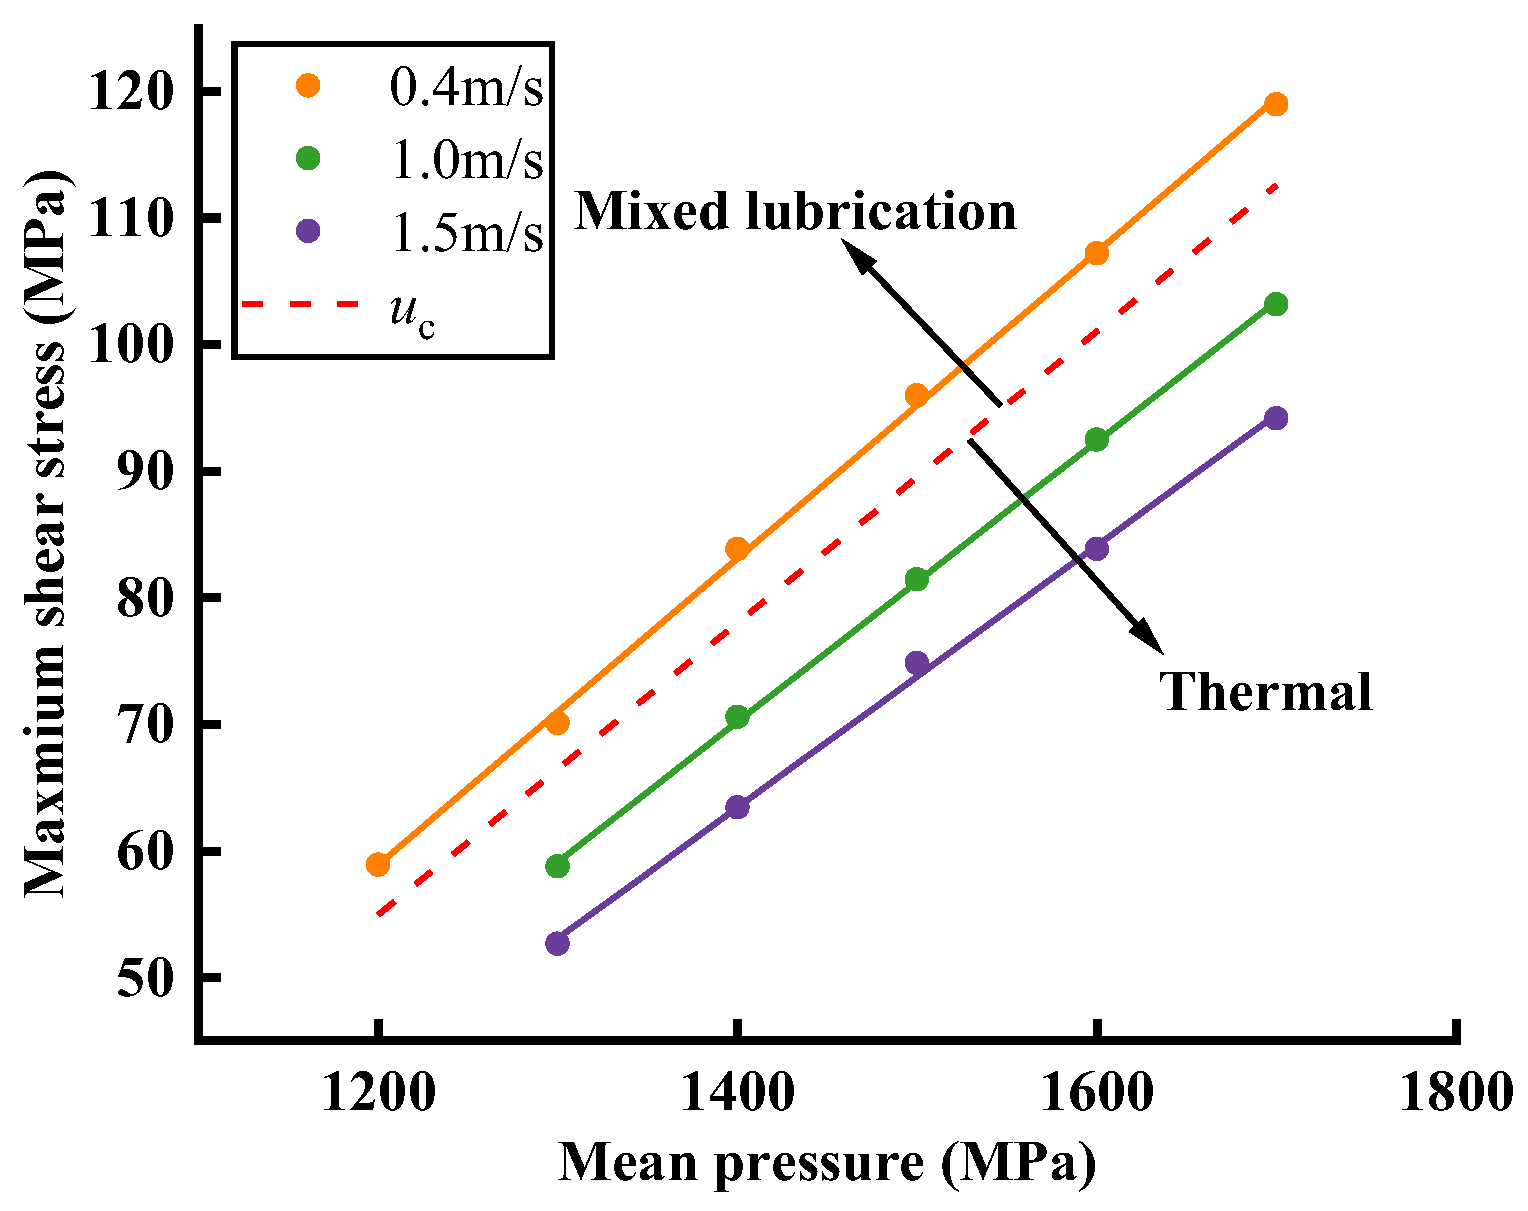
3.3. Approach for the Selection of Entrainment Velocity and Maximum EHL Friction Coefficient

Under specific conditions, such as a fixed contact pressure and oil supply temperature, the measurements of the LSS for a specific lubricant, as well as the associated determination of the maximum EHL coefficient of friction, require the smallest entrainment velocity to be chosen, in order to avoid the thermal effects of a thick film at high entrainment velocities, while ensuring full film lubrication. Higher or lower entrainment velocities would have influences on the accuracy of the measured values (see Section 4.4), with the former introducing thermal effects and the latter possibly resulting in mixed lubrication due to insufficient EHL film build-up. As a result, the accurate measurements of the LSS rely on the selection of the proper entrainment velocity.
In this work, we achieve the target through traction mapping, i.e., measuring traction curves at a series of entrainment velocities, covering transition of lubrication regimes from mixed lubrication to full film EHL. The entrainment velocity representing such a transition was selected as the proper velocity, by observing the trend of variation of the measured traction curves. As schematically shown in Figure 6a, there are three types of traction curves depending on the entrainment velocities at a high contact pressure. At a low entrainment velocity, the lubrication regime is in mixed lubrication, which is characterized by a continuous rise in the friction coefficient above the stage of linear increase in the traction curve, as shown in the dotted box in the figure. At a high enough entrainment velocity, the lubrication regime is in full film EHL. The traction curve will eventually enter the thermal region with increasing SRR, which is demonstrated by a decrease in the friction coefficient. For an appropriate entrainment velocity in between, the traction curve may present a “plateau” regime, which indicates the behavior of LSS. The subjected entrainment velocity is chosen to be the critical speed in this study. Accordingly, the f m a x of the friction curve at this speed is used as the input in Equation (1) for the determination of the LSS at the corresponding mean contact pressure.
A set of measured traction curves at different entrainment velocities is given in Figure 6b for PAO40 at an oil temperature of 40 °C and a mean Hertzian contact pressure of 1.7 GPa. The traction curves reach the so-called plateau region when the entrainment velocity, u e , is 0.6 m/s and when the SRR is within the range of 20% to 35%. In contrast, at a low entrainment velocity of 0.4 m/s, the traction curve shows characteristics of mixed lubrication, while at velocities above 0.6 m/s, the traction curves show characteristics of thermal EHL. Therefore, the maximum coefficient of friction at the velocity of 0.6 m/s is chosen to obtain the LSS at the subjected mean contact pressure of 1.7 GPa. Here, the maximum friction coefficient is 0.066 and the LSS is calculated to be 112.2 MPa, according to Equation (1). It should be noted that the entrainment velocities selected for different mean Hertzian contact pressures are not necessarily identical.

4. Results and Discussion

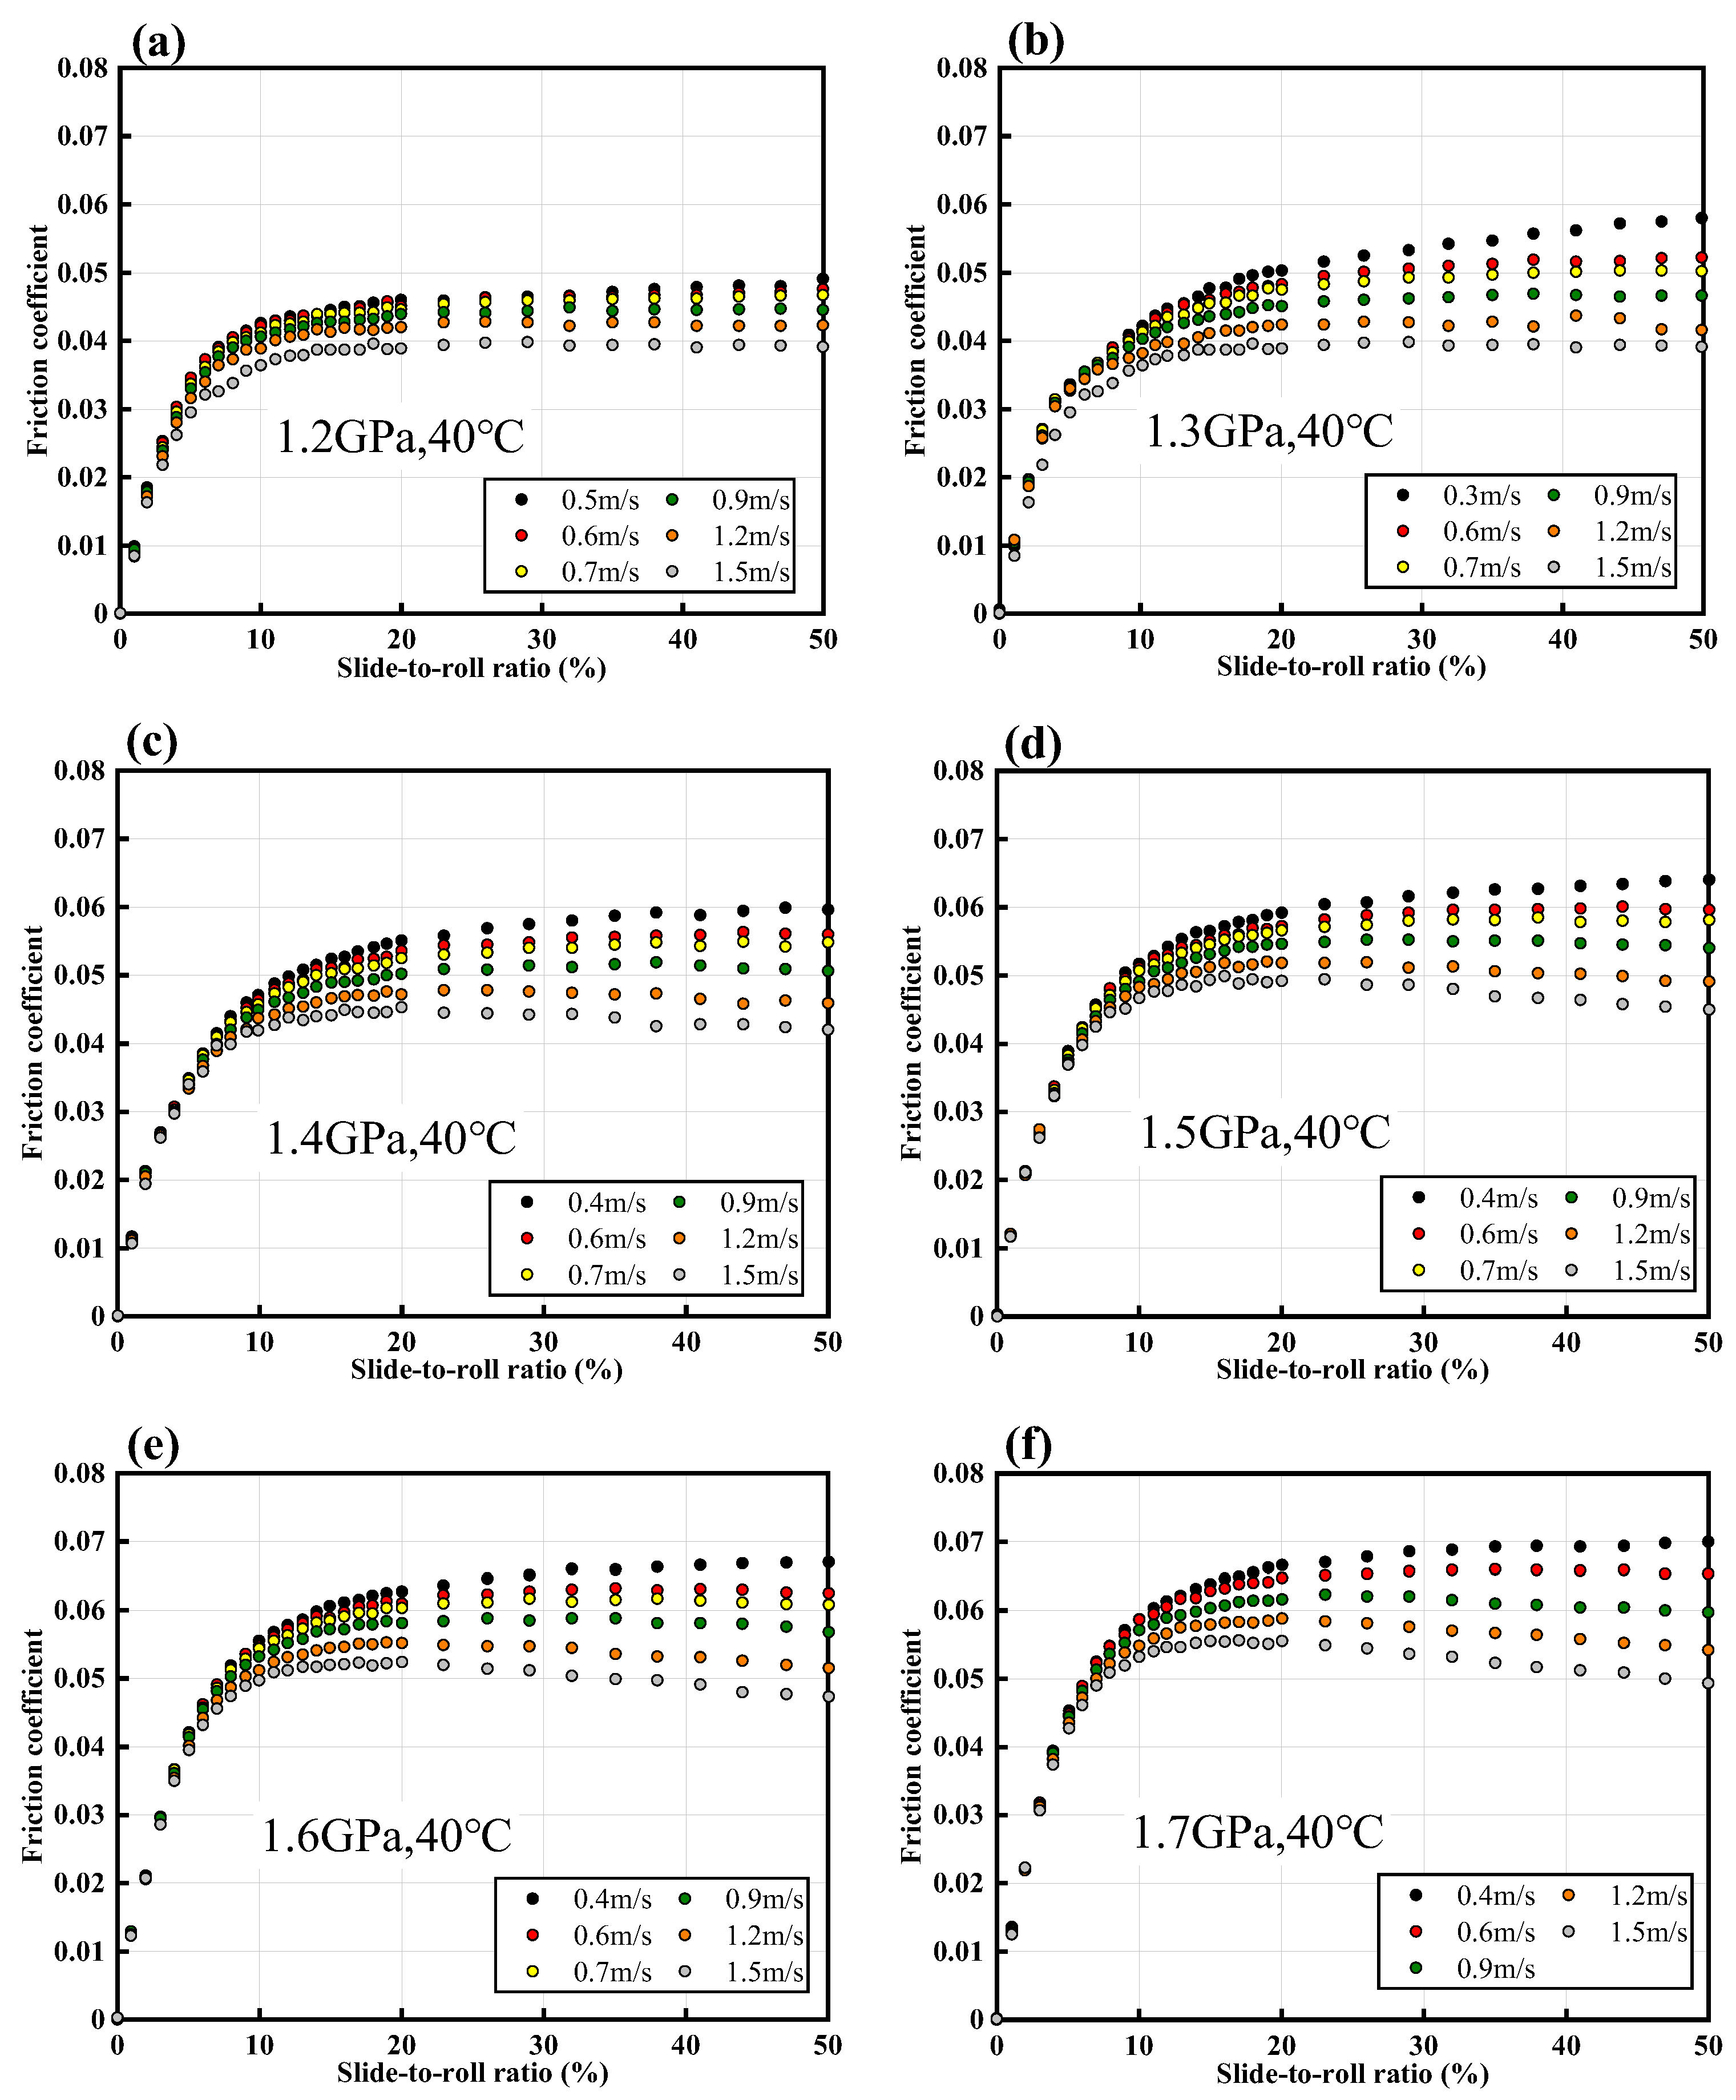
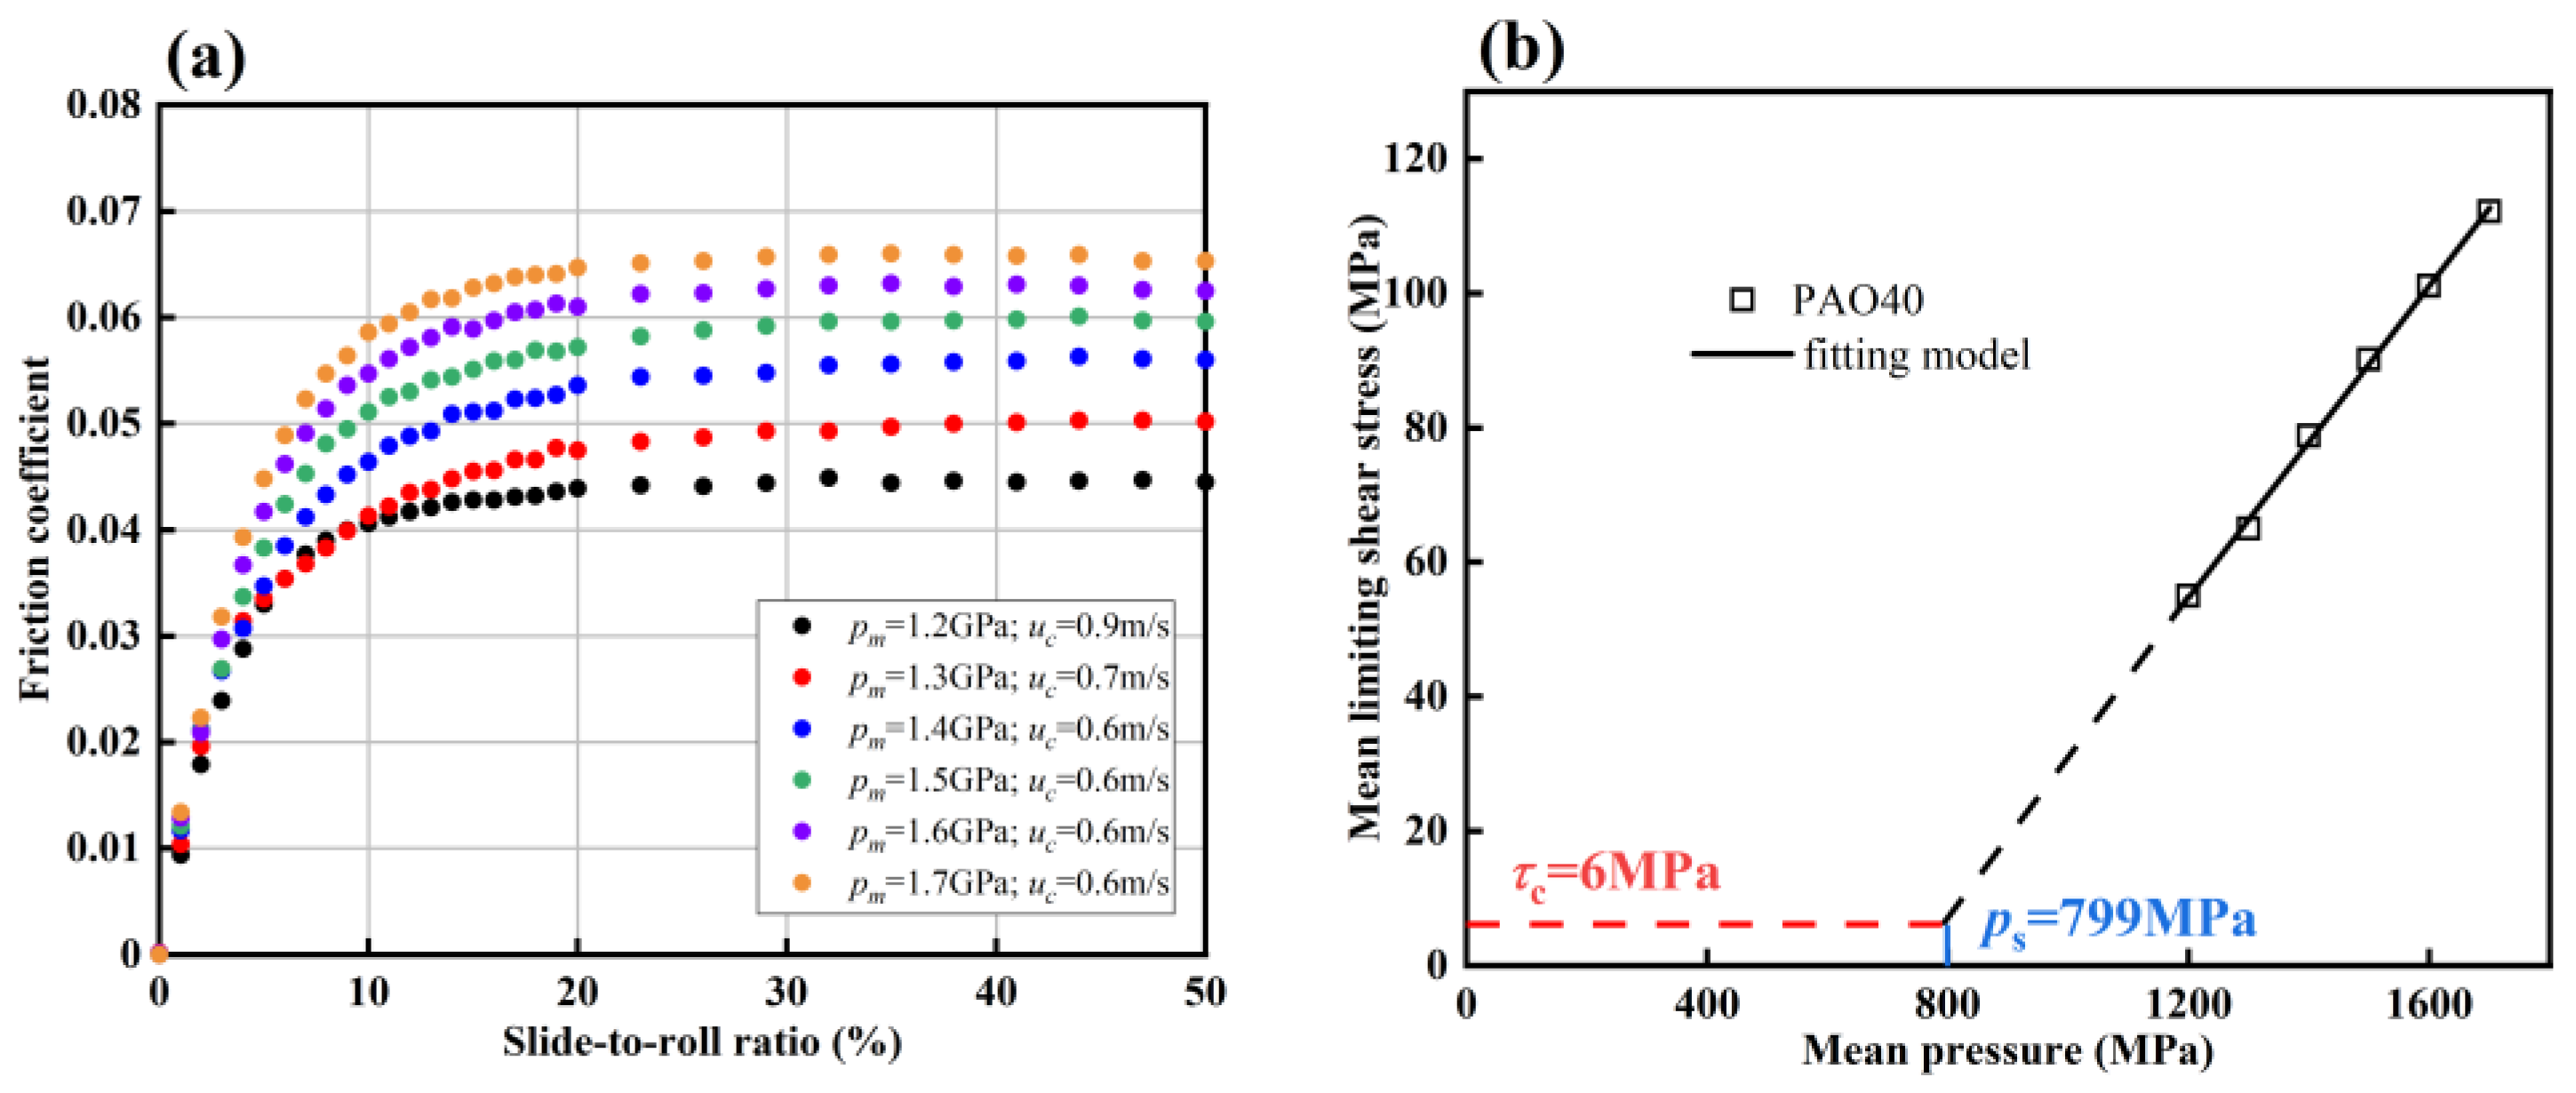
4.1. Measurement and Analysis of LSS for PAO40

Figure 7a–f show the measured traction curves of PAO40 at a set of entrainment velocities under different mean Hertzian contact pressures. For each figure at the same mean Hertzian contact pressure, the lubrication regime varies from mixed lubrication to EHL, with the increase in the entrainment velocity. In EHL, the coefficient of friction shows an overall decreasing trend at a high SRR, due to shear heating. For the same entrainment velocity among measured traction curves, the maximum coefficient of friction becomes larger with increasing mean Hertzian contact pressures. This is related to the increase in viscosity and LSS of the lubricant under a high pressure [3,31].
Based on the traction mapping approach given in Section 3, the critical entrainment velocity, u c , can be determined for each set of friction curves in Figure 7a–f. The corresponding maximum friction coefficient, f m a x , is obtained for each contact pressure and is substituted into Equation (1) to obtain the LSS. Table 4 summarizes the values of the above parameters at different mean Hertzian contact pressures. It can be seen that at different contact pressures, the u c at which the lubricant reaches the LSS remains nearly constant. This is because that load/pressure has little influence on the EHL film thickness and, thus, the lubrication regime [32]. In addition, the u c required to achieve full film lubrication should be higher at a higher contact pressure, as the lubricating film thickness should be slightly smaller. However, the opposite trend is observed in Table 4, even though the magnitude of the variation in u c is quite small. This might be related to the slightly smoothing effect of the ball surface in the experimental process, which starts with tests at low contact pressures and then proceeds to higher pressures. Nevertheless, the variation in u c is so small and would not significantly affect the values of the LSS. For future work, new ball and disc specimens are suggested to be used.
Figure 8a shows the traction curves with a “plateau” state for the different contact pressures used in Figure 7. Figure 8b plots the determined LSS of PAO40 in terms of the mean contact pressure. A linear relation can be observed, as follows:
τ L S S = Λ p m τ L 0
where Λ is the LSS coefficient and τ L 0 is the fitting constant. For PAO40, the fit yields Λ = 0.1219 and τ L 0 = 91.43   M Pa, with a coefficient of determination, R2, of 0.999, i.e.,
τ L S S = 0.1219 p m 91.43 ,   R 2 = 0.999
Through Figure 8b, it can be seen that the intercept of the fitting LSS curve of PAO40 with the y-axis is negative, i.e., −91.43 MPa. Such a negative intercept of LSS with pressure has also been reported by Poll et al. [24] for several oils and by Ndiaye et al. [21] for the Shell T9 and benzyl benzoate model fluids. However, it differs from the earlier results of Johnson et al. [13] and Fang et al. [20]. The LSS curve in this work intersects the positive semi-x axis, which indicates the physical meaning that the lubricant could only reach the LSS status above a critical pressure, i.e., the ps marked in Figure 8b. When the pressure is lower than ps, the shear stress is low in the film and the lubricant may be in a Newtonian and/or shear-thinning state. To determine the value of ps, Poll et al. [13] suggested using the critical shear stress, τ C , to represent the LSS when the pressure is smaller than ps. The so-called critical shear stress, τ C , represents the shear stress from which the lubricant starts to behave in a non-Newtonian manner, e.g., shear thinning. Note that the critical shear stress, τ C , can be obtained either through high-pressure rheological measurements or through molecular dynamics simulation [3]. It cannot be accurately obtained through measured traction curves because of the varying state of lubricants in the lubricated contact. Therefore, the LSS model of PAO40 might be written as:
τ L S S = τ C p < p s 0.1219 p m 91.43 p > p s
where p s is the critical pressure starting from which the lubricant can reach the LSS. By adopting   τ C = 6   M P a for PAO40, according to the high-pressure measurements of Bair [3], the corresponding critical pressure, p s , of PAO40 is about 799 MPa. Note that the stress and pressure in the equation have units of MPa. This value highlights the necessity of measuring the LSS at high contact pressures, e.g., larger than 800 MPa.
The two parameters Λ   and τ L 0 in Equation (2) are related to the type and molecular structure of lubricants. Lubricants with the same low-shear viscosity but different molecular structures may have different LSS values, as well as different values of these two characteristic parameters. Ultimately, these differences will lead to different coefficients of friction in concentrated rolling/sliding contacts.

4.2. Analysis of Limiting Shear Stress for Complex Ester

Complex ester has a different molecular structure and polarity compared to PAO40. The LSS of one complex ester was measured in this section, following the same approach for PAO40, to check the linear relation between LSS and pressure, as well as the validity of Equation (2).
The measured traction curves of the complex ester at six different mean Hertzian contact pressures are shown in Figure 9. Similarly, a set of entrainment velocities has been used to facilitate the determination of critical velocity that distinguishes mixed lubrication and full film EHL. Table 5 summarizes the values of the critical entrainment velocity, the corresponding maximum coefficient of friction, and the determined LSS at different mean contact pressures. The variation of the LSS with the mean contact pressure is plotted in Figure 10. It still follows a linear relation by showing a positive intersect with the positive semi-x axis. Adopting the bilinear LSS model in the same form as Equation (4), the variation of the LSS with pressure for the complex ester can be expressed as:
τ L S S = τ C p < p s 0.126 p m 90.26 p > p s
Note that there is a lack of critical shear stress, τ C , value for the studied ester. Therefore, the corresponding critical pressure, p s , cannot be known exactly, as schematically drawn in Figure 10.

4.3. Comparison of Limiting Shear Stress of the Two Lubricants

The values of the LSS for the two lubricants are compared in Table 6. The low-shear (Newtonian) viscosity of the two lubricants is identical at 100 °C and the viscosity of PAO40 is slightly higher than that of the complex ester at 40 °C (see Table 2). It is interesting to see that the LSS of PAO40 is always lower than that of the complex ester at the same pressure, at 40 °C. This means that the coefficient of friction of heavily loaded EHL contacts cannot be judged through the viscosity of lubricants at atmospheric pressure. Indeed, it depends on the rheological behavior of the lubricants under high pressure and high shear stress. This suggests that the LSS model could be used to characterize the traction behavior of lubricants at high contact pressures. Further studies are required to explain the difference in the LSS of the two lubricants from the point of view of molecular structures.

4.4. Effect of Entrainment Velocity on LSS Measurement

Section 3.3 illustrated the importance of choosing a proper critical entrainment velocity in LSS measurements. The influences of entrainment velocity on the LSS measurements are shown, using PAO40, in this section. The critical entrainment velocities determined in Table 4 were in the range of 0.6 m/s to 0.9 m/s. Figure 11 shows the traction curves of PAO40 at six different mean contact pressures, when the entrainment velocities are either smaller or higher than the critical velocity. They are 0.4 m/s, 1.0 m/s, and 1.5 m/s, respectively. The entrainment velocity of 0.4 m/s corresponds to the lubrication state of mixed lubrication, and the other two of 1.0 m/s and 1.5 m/s correspond to EHL. For each entrainment velocity, the maximum shear stress under different contact pressures is obtained by using the maximum coefficient of friction in the measured traction curves. The results are compared in Figure 12. It can be seen that the maximum shear stresses measured at different entrainment velocities (thus, different lubrication regimes) are still in linear relation to the mean contact pressure. However, the LSS values measured at the low velocity are larger, due to mixed lubrication, and are lower at high velocities, due to the thermal effect in EHL. This example illustrates the importance of selecting the critical entrainment velocity in LSS measurements.

5. Conclusions

In this study, traction curves of two lubricants under different contact pressures and entrainment velocities were measured under mixed and full film EHL regimes. An approach for the accurate measurement of the LSS based on traction mapping was given, especially regarding the practical approach for the selection of the critical entrainment velocity that distinguishes mixed lubrication and full film EHL. The proposed selection method for the critical velocity could help to reduce the influence of shear heating and, thus, give more accurate values of LSS. The variation of the LSS with mean Hertzian contact pressure was studied for PAO40 and the complex ester at 40 °C. The main conclusions are summarized as follows:
  • The measured LSS and the EHL coefficient of friction of the complex ester are higher than that of the PAO40, while the low-shear viscosity of the complex ester is lower than that of PAO40 at ambient pressure and 40 °C.
  • For both lubricants, PAO40 and complex ester, the measured LSS varies linearly with mean contact pressure and the relation can be described using the bilinear LSS model. The y-axis intercept of the fitting curve of the measured LSS is negative. This is in accordance with the results in the literature for model fluids and widely used commercial lubricants.
  • The choice of critical velocity has significant influence on the measurements of limiting shear stress. The effects of temperature and molecular structure on the limiting shear stress of lubricants will be investigated in future studies.

Author Contributions

Conceptualization, F.G., H.L. and Z.M.; writing—original draft preparation, Z.M.; writing—review and editing, Z.M., H.L., Y.H. and Y.Z.; validation, Z.M. and H.L.; data curation, Z.M. and S.L.; methodology, Z.M., H.L. and F.G.; funding acquisition, W.L. and X.W.; resources, W.L. and X.W. supervision, W.L., H.L. and F.G.; project administration, H.L.; investigation, Z.M.; formal analysis, Z.M. All authors have read and agreed to the published version of the manuscript.

Funding

This research was funded by the National Natural Science Foundation of China, grant number 52305227; by the Shandong Province Key R&D Program, grant number 2023CXPT060; by the Gansu Province Chief Scientist Program, grant number 23ZDKA012; and by the Gansu Postdoctoral Science Foundation (E202C6SK).

Data Availability Statement

Available upon enquiry. The data are not publicly available due to privacy.

Conflicts of Interest

The authors declare no conflicts of interest.

References

  1. Holmberg, K.; Erdemir, A. Influence of Tribology on Global Energy Consumption, Costs and Emissions. Friction 2017, 5, 263–284. [Google Scholar] [CrossRef]
  2. Gohar, R. Elastohydrodynamics; World Scientific: Singapore, 2001. [Google Scholar]
  3. Bair, S. High Pressure Rheology for Quantitative Elastohydrodynamics; Elsevier eBooks: Amsterdam, The Netherlands, 2019. [Google Scholar] [CrossRef]
  4. Smith, F.W. Lubricant Behavior in Concentrated Contact—Some Rheological Problems. ASLE Trans. 1960, 3, 18–25. [Google Scholar] [CrossRef]
  5. Bair, S.; Winer, W.O. A rheological model for elastohydrodynamic contacts based on primary laboratory data. J. Lubr. Technol. 1979, 101, 258–264. [Google Scholar] [CrossRef]
  6. Jacobson, B.O. Rheology and Elastohydrodynamic Lubrication; Elsevier: Amsterdam, The Netherlands, 1991; Volume 19. [Google Scholar]
  7. Zhang, Y.; Wang, W.; He, L.; Zhao, Z. Slip Status in Lubricated Point-Contact Based on Layered Oil Slip Lubrication Model. Tribol. Int. 2020, 144, 106104. [Google Scholar] [CrossRef]
  8. Wong, P.L.; Li, X.M.; Guo, F. Evidence of Lubricant Slip on Steel Surface in EHL Contact. Tribol. Int. 2013, 61, 116–119. [Google Scholar] [CrossRef]
  9. Jacobson, B. An Experimental Determination of the Solidification Velocity for Mineral Oils. ASLE Trans. 1974, 17, 290–294. [Google Scholar] [CrossRef]
  10. Šperka, P.; Křupka, I.; Hartl, M. Evidence of Plug Flow in Rolling–Sliding Elastohydrodynamic Contact. Tribol. Lett. 2014, 54, 151–160. [Google Scholar] [CrossRef]
  11. Ndiaye, S.N.; Martinie, L.; Philippon, D.; Gonon-Caux, M.; Margueritat, J.; Vergne, P. On the Influence of Phase Change in Highly Loaded Frictional Contacts. Tribol. Lett. 2020, 68, 54. [Google Scholar] [CrossRef]
  12. Zhang, Y.; Wen, S. An Analysis of Elastohydrodynamic Lubrication with Limiting Shear Stress: Part II—Load Influence. Tribol. Trans. 2002, 45, 211–216. [Google Scholar] [CrossRef]
  13. Johnson, K.L.; Tevaarwerk, J.L. Shear Behaviour of Elastohydrodynamic Oil Films. Proc. R. Soc. Lond. 1977, 356, 215–236. [Google Scholar] [CrossRef]
  14. Kobayashi, H.; Fujita, Y. Mechanisms for Three Kinds of Limiting Shear Stresses Appearing in the Traction Modes of Viscous, Viscoelastic, and Glassy States of Lubricants. J. Appl. Phys. 2014, 115, 223509. [Google Scholar] [CrossRef]
  15. Xu, R.; Martinie, L.; Vergne, P.; Joly, L.; Fillot, N. An Approach for Quantitative EHD Friction Prediction Based on Rheological Experiments and Molecular Dynamics Simulations. Tribol. Lett. 2023, 71, 69. [Google Scholar] [CrossRef]
  16. Washizu, H.; Ohmori, T.; Suzuki, A. Molecular origin of limiting shear stress of elastohydrodynamic lubrication oil film studied by molecular dynamics. Chem. Phys. Lett. 2017, 678, 1–4. [Google Scholar] [CrossRef]
  17. Gattinoni, C.; Heyes, D.M.; Lorenz, C.D.; Dini, D. Traction and Nonequilibrium Phase Behavior of Confined Sheared Liquids at High Pressure. Phys. Rev. E 2013, 88, 052406. [Google Scholar] [CrossRef] [PubMed]
  18. Martinie, L.; Vergne, P. Lubrication at Extreme Conditions: A Discussion about the Limiting Shear Stress Concept. Tribol. Lett. 2016, 63, 21. [Google Scholar] [CrossRef]
  19. Bader, N.F. Traction in EHL-Contacts: The Influence of Local Fluid Rheology and Temperatures. Ph.D. Dissertation, Leibniz University, Hannover, Germany, 2018. [Google Scholar]
  20. Fang, N.; Chang, L.; Webster, M.N.; Jackson, A. A Non-Averaging Method of Determining the Rheological Properties of Traction Fluids. Tribol. Int. 2000, 33, 751–760. [Google Scholar] [CrossRef]
  21. Ndiaye, S.N.; Martinie, L.; Philippon, D.; Devaux, N.; Vergne, P. A Quantitative Friction-Based Approach of the Limiting Shear Stress Pressure and Temperature Dependence. Tribol. Lett. 2017, 65, 149. [Google Scholar] [CrossRef]
  22. Liu, H.C.; Zhang, B.; Bader, N.; Venner, C.H.; Poll, G. Scale and Contact Geometry Effects on Friction in Thermal EHL: Twin-Disc versus Ball-on-Disc. Tribol. Int. 2021, 154, 106694. [Google Scholar] [CrossRef]
  23. Habchi, W.; Vergne, P.; Bair, S.; Andersson, O.; Eyheramendy, D.; Morales-Espejel, G.E. Influence of Pressure and Temperature Dependence of Thermal Properties of a Lubricant on the Behaviour of Circular TEHD Contacts. Tribol. Int. 2010, 43, 1842–1850. [Google Scholar] [CrossRef]
  24. Poll, G.; Wang, D. Fluid Rheology, Traction/Creep Relationships and Friction in Machine Elements with Rolling Contacts. Proc. Inst. Mech. Eng. Part J J. Eng. Tribol. 2012, 226, 481–500. [Google Scholar] [CrossRef]
  25. Hansen, J.; Björling, M.; Larsson, R. Lubricant Film Formation in Rough Surface Non-Conformal Conjunctions Subjected to GPa Pressures and High Slide-to-Roll Ratios. Sci. Rep. 2020, 10, 22250. [Google Scholar] [CrossRef] [PubMed]
  26. Zhu, D.; Wang, Q.J. On the λ Ratio Range of Mixed Lubrication. Proc. Inst. Mech. Eng. Part J J. Eng. Tribol. 2012, 226, 1010–1022. [Google Scholar] [CrossRef]
  27. Zhang, J.; Spikes, H.A. Measurement of EHD Friction at Very High Contact Pressures. Tribol. Lett. 2020, 68, 42. [Google Scholar] [CrossRef]
  28. Bair, S. A traction (friction) curve is not a flow curve. Lubricants 2022, 10, 221. [Google Scholar] [CrossRef]
  29. Habchi, W.; Bair, S.; Vergne, P. On Friction Regimes in Quantitative Elastohydrodynamics. Tribol. Int. 2013, 58, 107–117. [Google Scholar] [CrossRef]
  30. Björling, M.; Larsson, R.; Marklund, P.; Kassfeldt, E. Elastohydrodynamic lubrication friction mapping—The influence of lubricant, roughness, speed, and slide-to-roll ratio. Proc. Inst. Mech. Eng. Part J J. Eng. Tribology 2011, 225, 671–681. [Google Scholar] [CrossRef]
  31. Otero, J.E.; De La Guerra Ochoa, E.; Tanarro, E.C.; Martínez, F.F.; Urgilés, R.W.C. An Analytical Approach for Predicting EHL Friction: Usefulness and Limitations. Lubricants 2022, 10, 141. [Google Scholar] [CrossRef]
  32. Hamrock, B.J.; Dowson, D. Isothermal Elastohydrodynamic Lubrication of Point Contacts: Part III—Fully Flooded Results. J. Lubr. Technol. 1977, 99, 264–275. [Google Scholar] [CrossRef]
Figure 1. Flow curve of lubricants at isothermal conditions.
Lubricants 12 00128 g001
Figure 2. Schematic diagram of the MTM2 test rig used for traction measurements of lubricated rolling/sliding contacts.
Lubricants 12 00128 g002
Figure 3. Hertzian contact pressure at different loads for contact pairs of AISI 52,100 bearing steel and K20 WC carbide.
Lubricants 12 00128 g003
Figure 4. 3D map of friction showing five different regions for lubricated rolling/sliding contacts with PAO40 at T = 40 °C and p m = 1.7 GPa.
Lubricants 12 00128 g004
Figure 5. 2D contour maps of the friction coefficient under different mean contact pressures. (a) 1.3 GPa; (b) 1.5 GPa; and (c) 1.7 GPa. (PAO40, 40 °C).
Lubricants 12 00128 g005
Figure 6. (a) Schematic of friction curves at different lubrication regimes; (b) measured friction curve at different velocities with PAO40 at T = 40 °C and p m = 1.7 GPa.
Lubricants 12 00128 g006
Figure 7. Traction curves of PAO40 at different contact pressures and different entrainment velocities. (a) p m = 1.2   G P a ; (b) p m = 1.3   G P a ; (c) p m = 1.4   G P a ; (d) p m = 1.5   G P a ; (e) p m = 1.6   G P a ; and (f) p m = 1.7   G P a .
Lubricants 12 00128 g007
Figure 8. Variation of limiting shear stress with mean contact pressure for PAO40. (a) Traction curves; (b) linear fitting model of PAO40.
Lubricants 12 00128 g008
Figure 9. Traction curves of complex ester at different contact pressures and different entrainment velocities. (a) p m = 1.2   G P a ; (b) p m = 1.3   G P a ; (c) p m = 1.4   G P a ; (d) p m = 1.5   G P a ; (e) p m = 1.6   G P a ; and (f) p m = 1.7   G P a .
Lubricants 12 00128 g009
Figure 10. A bilinear fitting model for the limiting shear stress of complex ester varying with mean contact pressure.
Lubricants 12 00128 g010
Figure 11. Variation of friction curves with mean contact pressure at different entrainment velocities. (a) u e = 0.4 m/s; (b) u e = 1.0 m/s; and (c) u e = 1.5 m/s.
Lubricants 12 00128 g011
Figure 12. Influence of entrainment velocity and, thus, lubrication regimes on the determination of LSS for lubricants.
Lubricants 12 00128 g012
Table 1. Physical parameters of the disc and ball specimens.
SpecimenMaterialDiameter, mmSurface Roughness Ra, μmYoung’s Modulus, GPaPoisson Ratio
BallWC19.05<0.026100.258
DiscWC46<0.016100.258
Table 2. Properties of two base oils used in experiments.
LubricantKinematic Viscosity at 40 °C, mm/s2Kinematic Viscosity at 100 °C, mm/s2Viscosity Index, VIDensity 20 °C, kg/m3
PAO4039639147850
Complex ester366391551012
Table 3. Operating conditions.
ParameterUnitValue
Temperature, T °C40
Mean Contact pressure, p m GPa1.2~1.7
Entrainment velocity, u e m/s0~2
Slide-to-roll ratio, SRR%0~50
Table 4. f m a x and u c adopted for the LSS determination of PAO40, as well as the measured LSS values under different pressures.
p m /GPa u c /mm/s f m a x /-LSS/MPa
1.29000.044653.52
1.37000.05065.00
1.46000.05678.82
1.56000.06090.18
1.66000.063101.12
1.76000.066112.2
Table 5. f m a x and u c adopted for the LSS determination of complex ester, as well as the measured LSS values under different pressures.
p m /GPa u c /mm/s f m a x /-LSS/MPa
1.26000.050660.72
1.36000.056373.19
1.45000.062687.64
1.55000.0667100.05
1.65000.0701112.16
1.75000.0725123.25
Table 6. Comparison of determined limiting shear stress of PAO40 and complex ester at different pressures.
p m /GPaLSS of PAO40/MPaLSS of Complex Ester/MPa
1.255.4060.72
1.365.0073.19
1.478.8287.64
1.590.18100.05
1.6101.12112.16
1.7112.20123.25
Disclaimer/Publisher’s Note: The statements, opinions and data contained in all publications are solely those of the individual author(s) and contributor(s) and not of MDPI and/or the editor(s). MDPI and/or the editor(s) disclaim responsibility for any injury to people or property resulting from any ideas, methods, instructions or products referred to in the content.

