Abstract
In this work, a set of Feed Forward Neural Networks (FNN) for the estimation of the metal ion concentration of diesel fuels is presented. The dataset vector is obtained through in situ measurements from distillate marine diesel fuel storage tanks all over Greece, in order to reduce the selection bias. It has been demonstrated that the most correlated ions among them are Aluminum (Al), Barium (Ba) and Calcium (Ca). Moreover, the FNN models are the most reliable models to be used for the model construction under discussion. The initial L2 error is relatively small, in the vicinity of 0.3. However, after removing a small dataset that includes 1–2 data points significantly deviating from the model trend, the error is substantially reduced to 0.05, ensuring the reliability and accuracy of the model. If this dataset is cleared, the estimated error is substantially reduced to 0.05, enhancing the reliability and accuracy of the model. The correlation between the sum of the concentrations of the model in relation with the Density and Viscosity are, respectively, 0.15 and 0.29 which are characterized as weak.
1. Introduction
Machine Learning (ML) is the science of modelling a physical, social, or other type phenomenon, using the dataset obtained from experimental, in situ or numerical investigation. In sciences and engineering, numerous scientific publications have emerged in recent years from different aspects of engineering [1,2,3,4]. Among them, some try to implement a model for the estimation of the fluid dynamic response of a transient flow to a temperature-dependent medium, others try to estimate the failure of shallow foundations situated on cohesive soils, there are efforts of monitoring the electrical disturbance through the ML applications and models and others have the chemical identities of the materials to be addressed and estimated with the usage of ML models. The seminal work written in have introduced the Physics Informed Neural Networks (PINN) [5]. These models have been employed also in Lubricants and Marine Diesels leading to a substantial existence of literature for the manipulation of the data extruded from the experimental and in situ activity [6,7,8,9]. In this literature, the Lubricant Viscosity for various operational activities through PINN models is estimated, others have employed productive simulation models of active rotor-bearing systems, the fuel consumption on a marine diesel engine is predicted through ML models like M5 rules algorithm and the wear fault diagnosis for marine diesel engine has been investigated for the most suitable PINN model that can represent this phenomenon and predict the fault with the largest accuracy and reliability in combination with the fast computation of the estimation.
The previous and current research is focusing on the concentration of heavy metals and catalytic fines in the residual marine fuel oil [10]. For this reason, it is common handling practice to blend residual marine fuel oil with distillate marine diesel fuel [11]. Heavy metals are harmful exhaust emissions [12]. There is a gap in measuring the metal ions in the Distillate Marine Fuel (DMF).
The sediment and the metal ions concentration are critical for the diesel fuel quality and especially for the DMF category quality. It is not always easy to measure all the metal ions. The concentration for each of the metal ions is not included in the Diesel fuel quality standard. Investigations have shown that hard <4 μm sediment particles can cause serious abrasive wear to modern diesel high pressure fuel injection systems and result in engine failures. Soft particles such as those typically found in Fatty Acids Methyl Esters (FAME) do not appear to cause abrasive wear. On the other hand, they can cause sediment, because sediment may occur due to inorganic and organic contaminants of the fuel. Inorganic contaminants can consist if rust, dirt, dust, corrosion products and a number of trace materials are retained from the fuel and FAME production [13,14,15].
Sodium is the most challenging to measure and typically the most harmful one. Sodium can cause Internal Diesel Injector Deposit (IDID). Zinc is the main driver for the nozzle coking and additionally, can cause IDID. Copper can cause IDID but mainly affects the catalysts oxidation stability. The combination of Calcium with Zinc and Sodium is proof that a contamination with engine oil is present without excluding possible IDID. Lead can also lead to IDID.
Chlorine usually can be found in combination with sodium. If this is the case, then this is an indication of seawater contamination or a contamination from salt dryers. Phosphorous is sometimes found in combination with Zinc and Calcium. If this is the case (zinc dialkyldithiophosphate-ZDDP), this is an indication that engine oil contamination has occurred. Phosphorous can be a carryover from the FAME (biodiesel) production. Empirically, its concentration must be less than four times the concentration of FAME in the fuel. For example, for a DFA, DFZ and DFB [16], the concentration must be below 0.28 mg/kg as explained in Equation (1).
% FAME × 4 = 0.07 × 4 = 0.28 mg/kg
This is the same for Potassium and Magnesium, which are other carry over ions from FAME production. Following the same rule as above, for Potassium and the Magnesium, the concentration must be less than five times the concentration of FAME in the fuel. This means that in the same sample the Phosphorous and the Magnesium content must not exceed the 0.35 mg/kg, respectively as depicted in Equation (2).
% FAME × 5 = 0.07 × 5 = 0.35 mg/kg
The Iron concentration is a clear indication of corrosion in the fuel distribution and the storage systems. Silicon (Si) is typically present below 1.2 mg/kg as an antifoam additive. Higher concentration in the fuel, except of the overtreatment of the fuel with foam additive, may indicate an engine coolant contamination especially if it will be examined in correlation with the Sodium concentration.
Forty-one (41) samples of marine diesel fuel were collected from all over Greece. The aim of this is to map the quality of the diesel marine fuel traded for the supply of ships and to emphasize the need to comply with existing regulations and directives for the management of its supply.
The sampling of the fuels has been carried out in accordance with the procedures described in the ELOT EN ISO 3170:2004 and ELOT ISO 13739:2020 standards [17,18]. For all the samples Aluminum (Al), Calcium (C), Chromium (Cr), Copper (Cu), Iron (Fe), Magnesium (Mg), Sodium (Na), Nickel (Ni), Phosphorous (P), Lead (Pb), Silicon (Si), Tin (Sn), Vanadium (V), Zinc (Zn), Barium (Ba), Lithium (Li), Manganese (Mn), Molybdenum (Mo), Potassium (K), Silver (Ag) and Titanium (Ti) were analyzed along with Density [19] and Viscosity [20] using Inductively Coupled Plasma Spectroscopy technique (ICP). The aim of the study is to investigate the correlation of all the monitored ions through the respective correlation matrix. Moreover, an investigation from various types of Artificial Neural Networks like the Feed Forward Neural Networks, the Random Forest Optimization method for the model hyperparameters and the Extreme Gradient Boost method. The first one was selected since it resulted in the smallest L2 error. Moreover, the formulation of the models that refer to the most correlated ions that have input parameters are the Density and the Viscosity and the corresponding ion concentration are subsequently given, with the 3D representation of the model and the respective projections to the Density–Concentration and Viscosity–Concentration planes. The total number of samples are forty-one (41). This research differs from the existing literature review mentioned above in the following aspects. Firstly, the relatively large amount of dataset for the corresponding physical application which are situated throughout a country reducing the possible biases that may occur. Moreover, this amount of dataset vector is not found in relative studies thus it can be used as a future reference. In addition, the FNN construction that follows a reliability analysis for the metal ion concentration aims to correlate the most influent metal ions among them in order to estimate with a substantial accuracy each other’s concentration when the Density and the Viscosity of the Marine Diesel is known. It has been demonstrated that the highest correlation is between Al, Ba, Ca ions with a correlation coefficient in the order of magnitude of 0.65. The models with the forty-one elements have relatively high L2 error, in the vicinity of 0.30–0.40 but if some clearly divergent points are removed from the sampling set the error is rapidly improved with the error to be reduced to in the vicinity of 0.05.
2. Materials and Methods
Feed Forward Neural Networks (FNN)
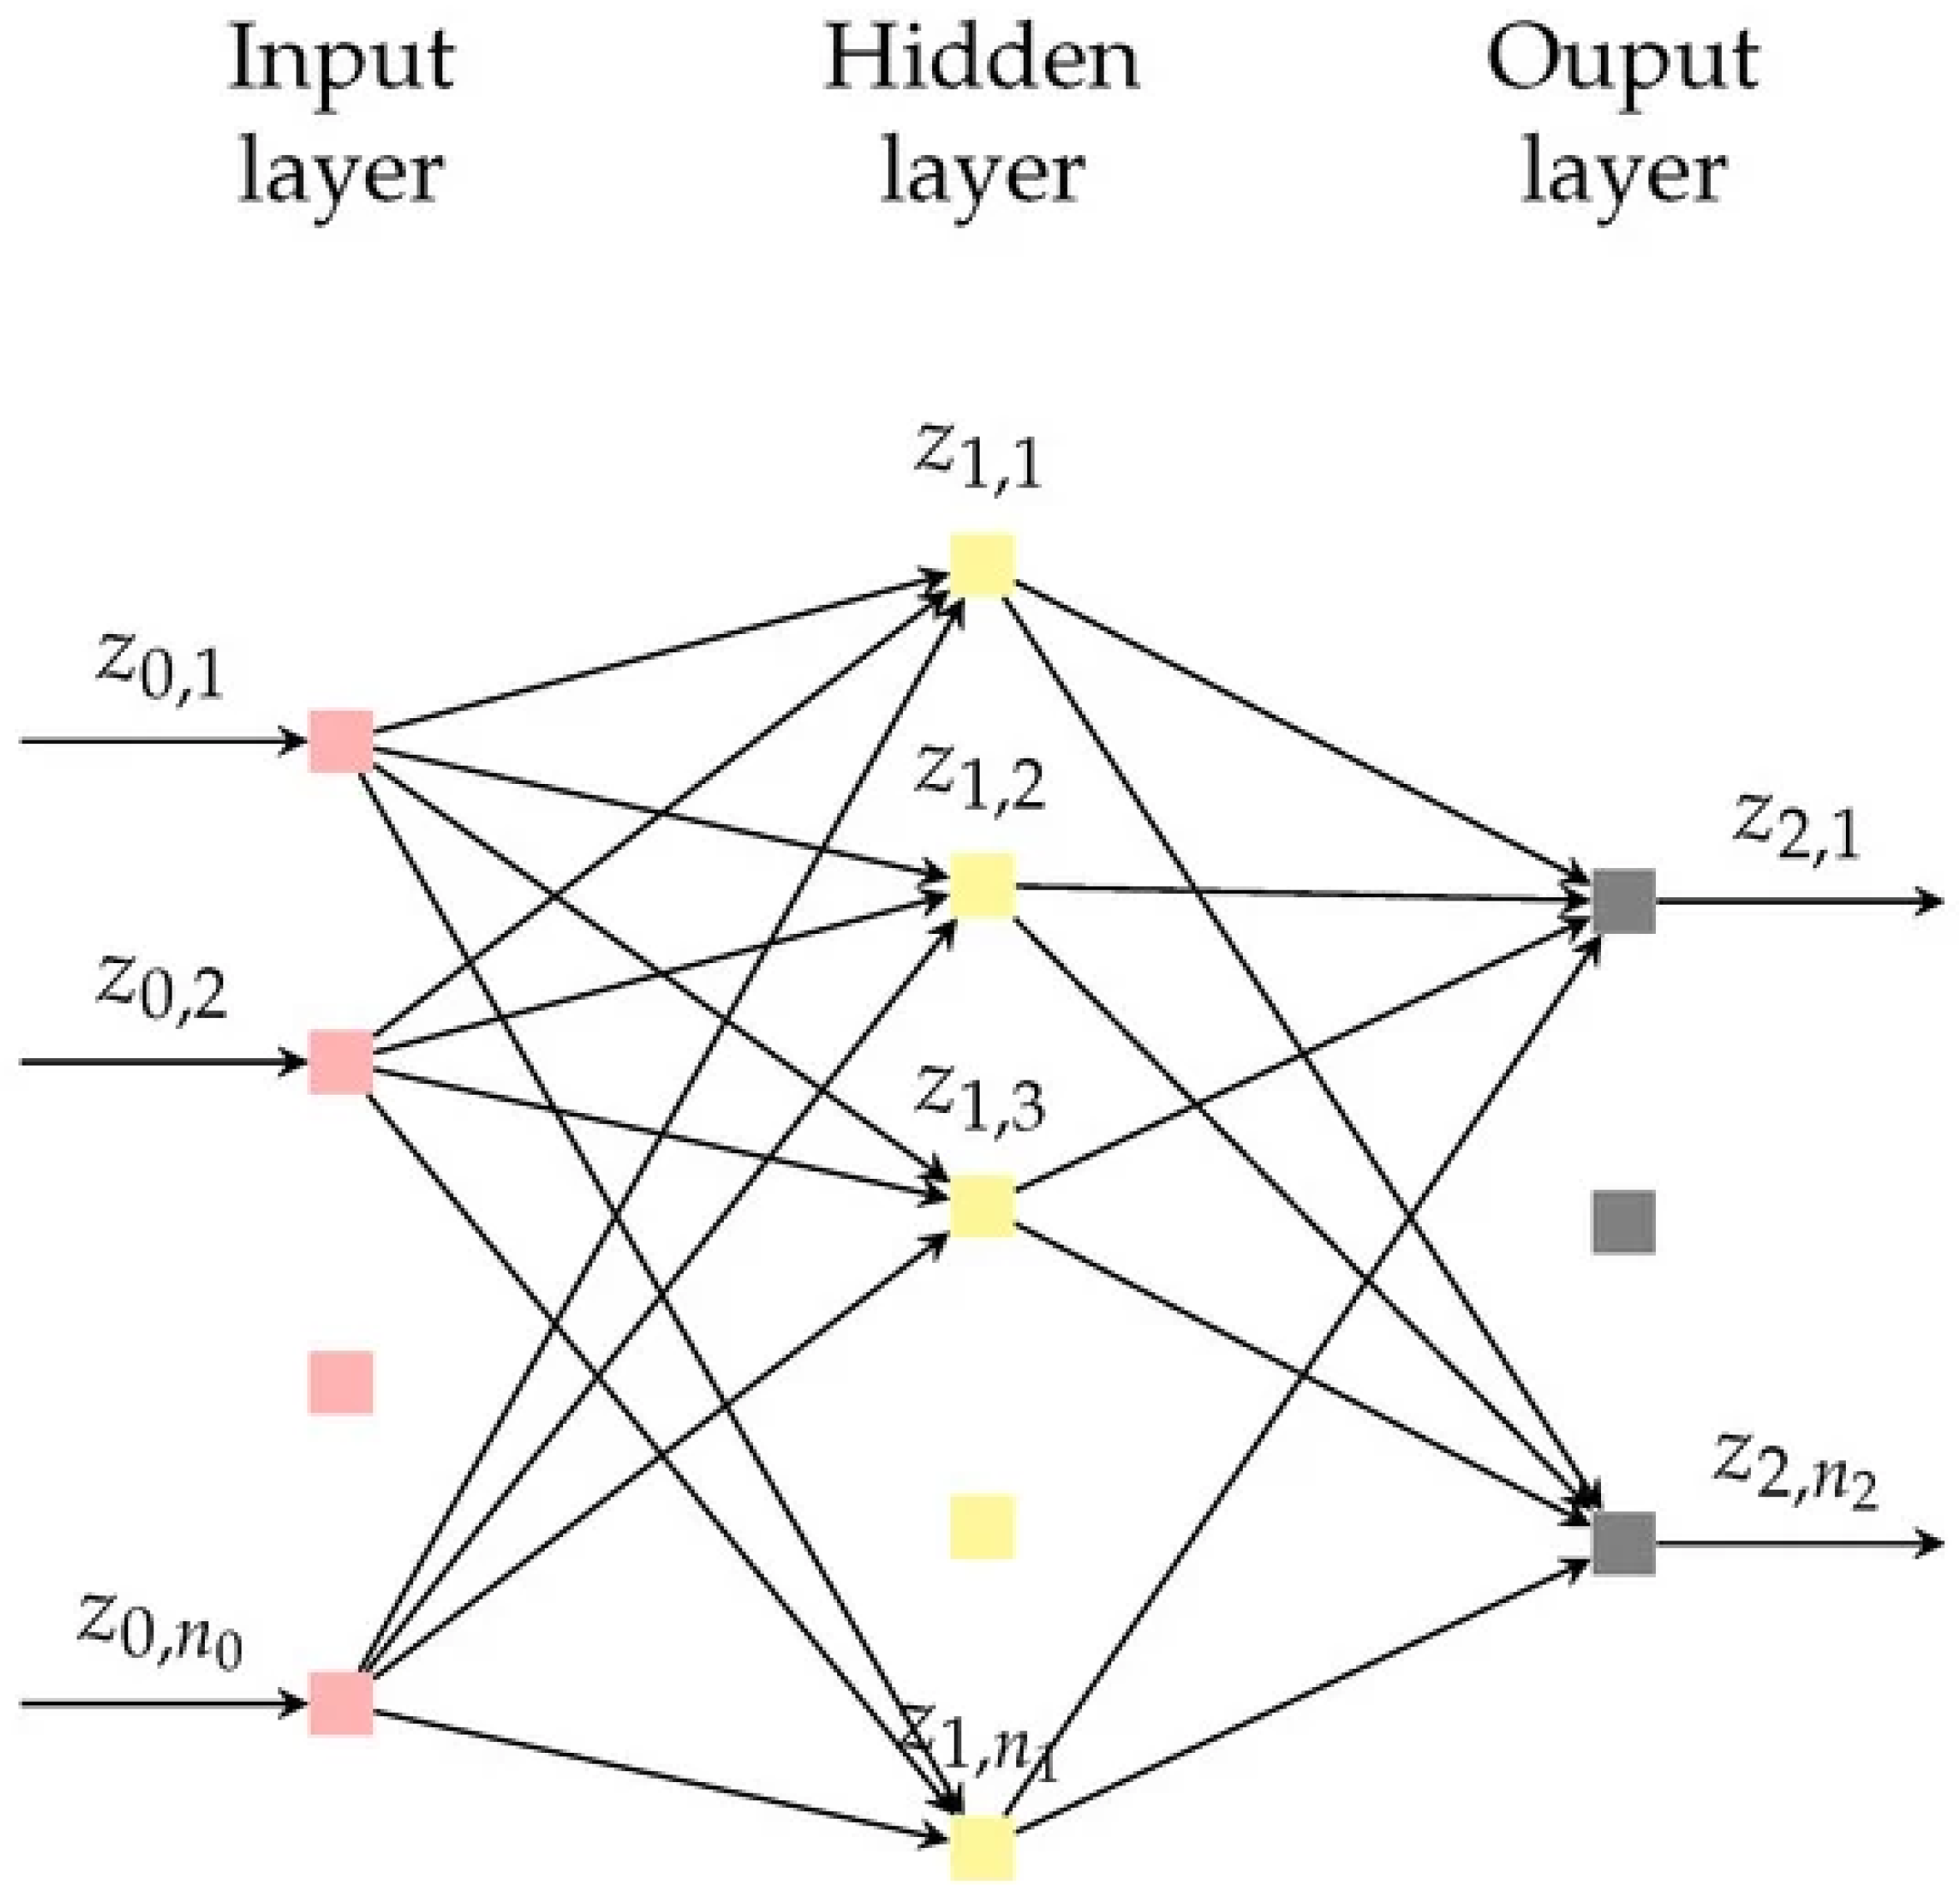
A feed-forward neural network (FNN) is a congregating of interrelated calculating components named as neurons, distributed as input, output and a set of interposed hidden layers. Subsequently, assume Nk: Rd0 -> Rdk+1 be an FNN consisting of k hidden layers, each of one having nj neurons, for j = 1, 2, …k. The input and output layers comprise of n0 = d0 and nk+1 = dk+1 neurons. All layers but the input is associated with a weight matrix and a bias vector, denoted with Wj and bj, respectively; all these matrices, given for all the network layers, characterize the model hyperparameters. The input vector is denoted as z0ЄRd0 and the output vector of the j-th layer is denoted as zjЄRdj, for j = 1, 2, …, k + 1. An illustrative rendition of a FNN setup with one hidden layer is depicted in Figure 1.
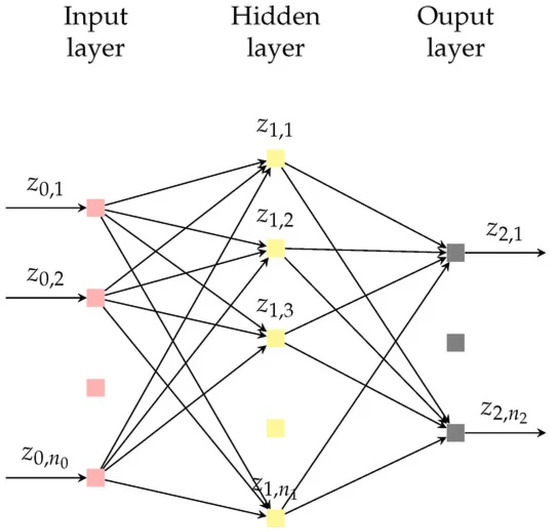
Figure 1.
A Feed Forward Neural Network (FNN) with one hidden layer.
The application of a network’s layer, j, can be portrayed using the relation:
where δj(·) is a non-linear activation function which is applied layer-wise. Subsequently, the FNN model is a function mapping inputs z0ЄRd0 to outputs zk+1ЄRdk+1, with Equation (3).
zj = δj(Wjzj−1 + bj), for all j Є {1, 2, …, k + 1}
The activation functions are nonlinear; thus, the minimization of the loss function is a non-convex problem, thus can only be solved with non-linear iterative algorithms such as stochastic gradient descent and quasi-Newton methods [21,22]. In the present paper, the FNN method is applied in order to construct the NN that estimates the concentration of the ion in relation with the Density and the Viscosity.
3. Machine Learning Application: Models Estimating the Concentration of the Ions
3.1. Data Curation and Experimental Procedure
In different marine diesel storage tanks from all over Greece, samples of the diesel have been obtained. With this selection, the possible biases are reduced, and the quality of the marine diesel is mapped in a realistic way. This marine diesel is sold for the supply of ships. This procedure emphasizes the importance of complying with the regulations, national and international, for the management of the supply.
In total, 41 samples were obtained from the storage tanks. The procedure described in ELOT EN ISO 3170:2004 and ELOT ISO 13739:2020 [17,18] was followed. Moreover, the concentration of the following material ions were found: Aluminum (Al), Calcium (C), Chromium (Cr), Copper (Cu), Iron (Fe), Magnesium (Mg), Sodium (Na), Nickel (Ni), Phosphorous (P), Lead (Pb), Silicon (Si), Tin (Sn), Vanadium (V), Zinc (Zn), Barium (Ba), Lithium (Li), Manganese (Mn), Molybdenum (Mo), Potassium (K), Silver (Ag) and Titanium (Ti). Their concentration was measured using the method of Inductively Coupled Plasma Spectroscopy technique (ICP). Density and Viscosity were measured based on the ELOT ΕΝ ISO 12185 and ASTM D 7042-21, respectively [19,20].
Subsequently, the total dataset of forty-one (41) samples, initially was considered as acceptable for implementing a reliability analysis and formulation of the models from Machine Learning theory. In latent analysis, the possibility of omitting some of the samples, in order to increase the accuracy of the model in a substantial amount was considered and subsequently was done. This procedure was with a limit of four samples (10% of the total dataset) in order to keep the dataset as homogeneous as it was taken from the experimental test and to avoid selection bias errors.
3.2. Preliminary Results: Reliability Analysis and Selection of the Best Suitable Machine Learning Application
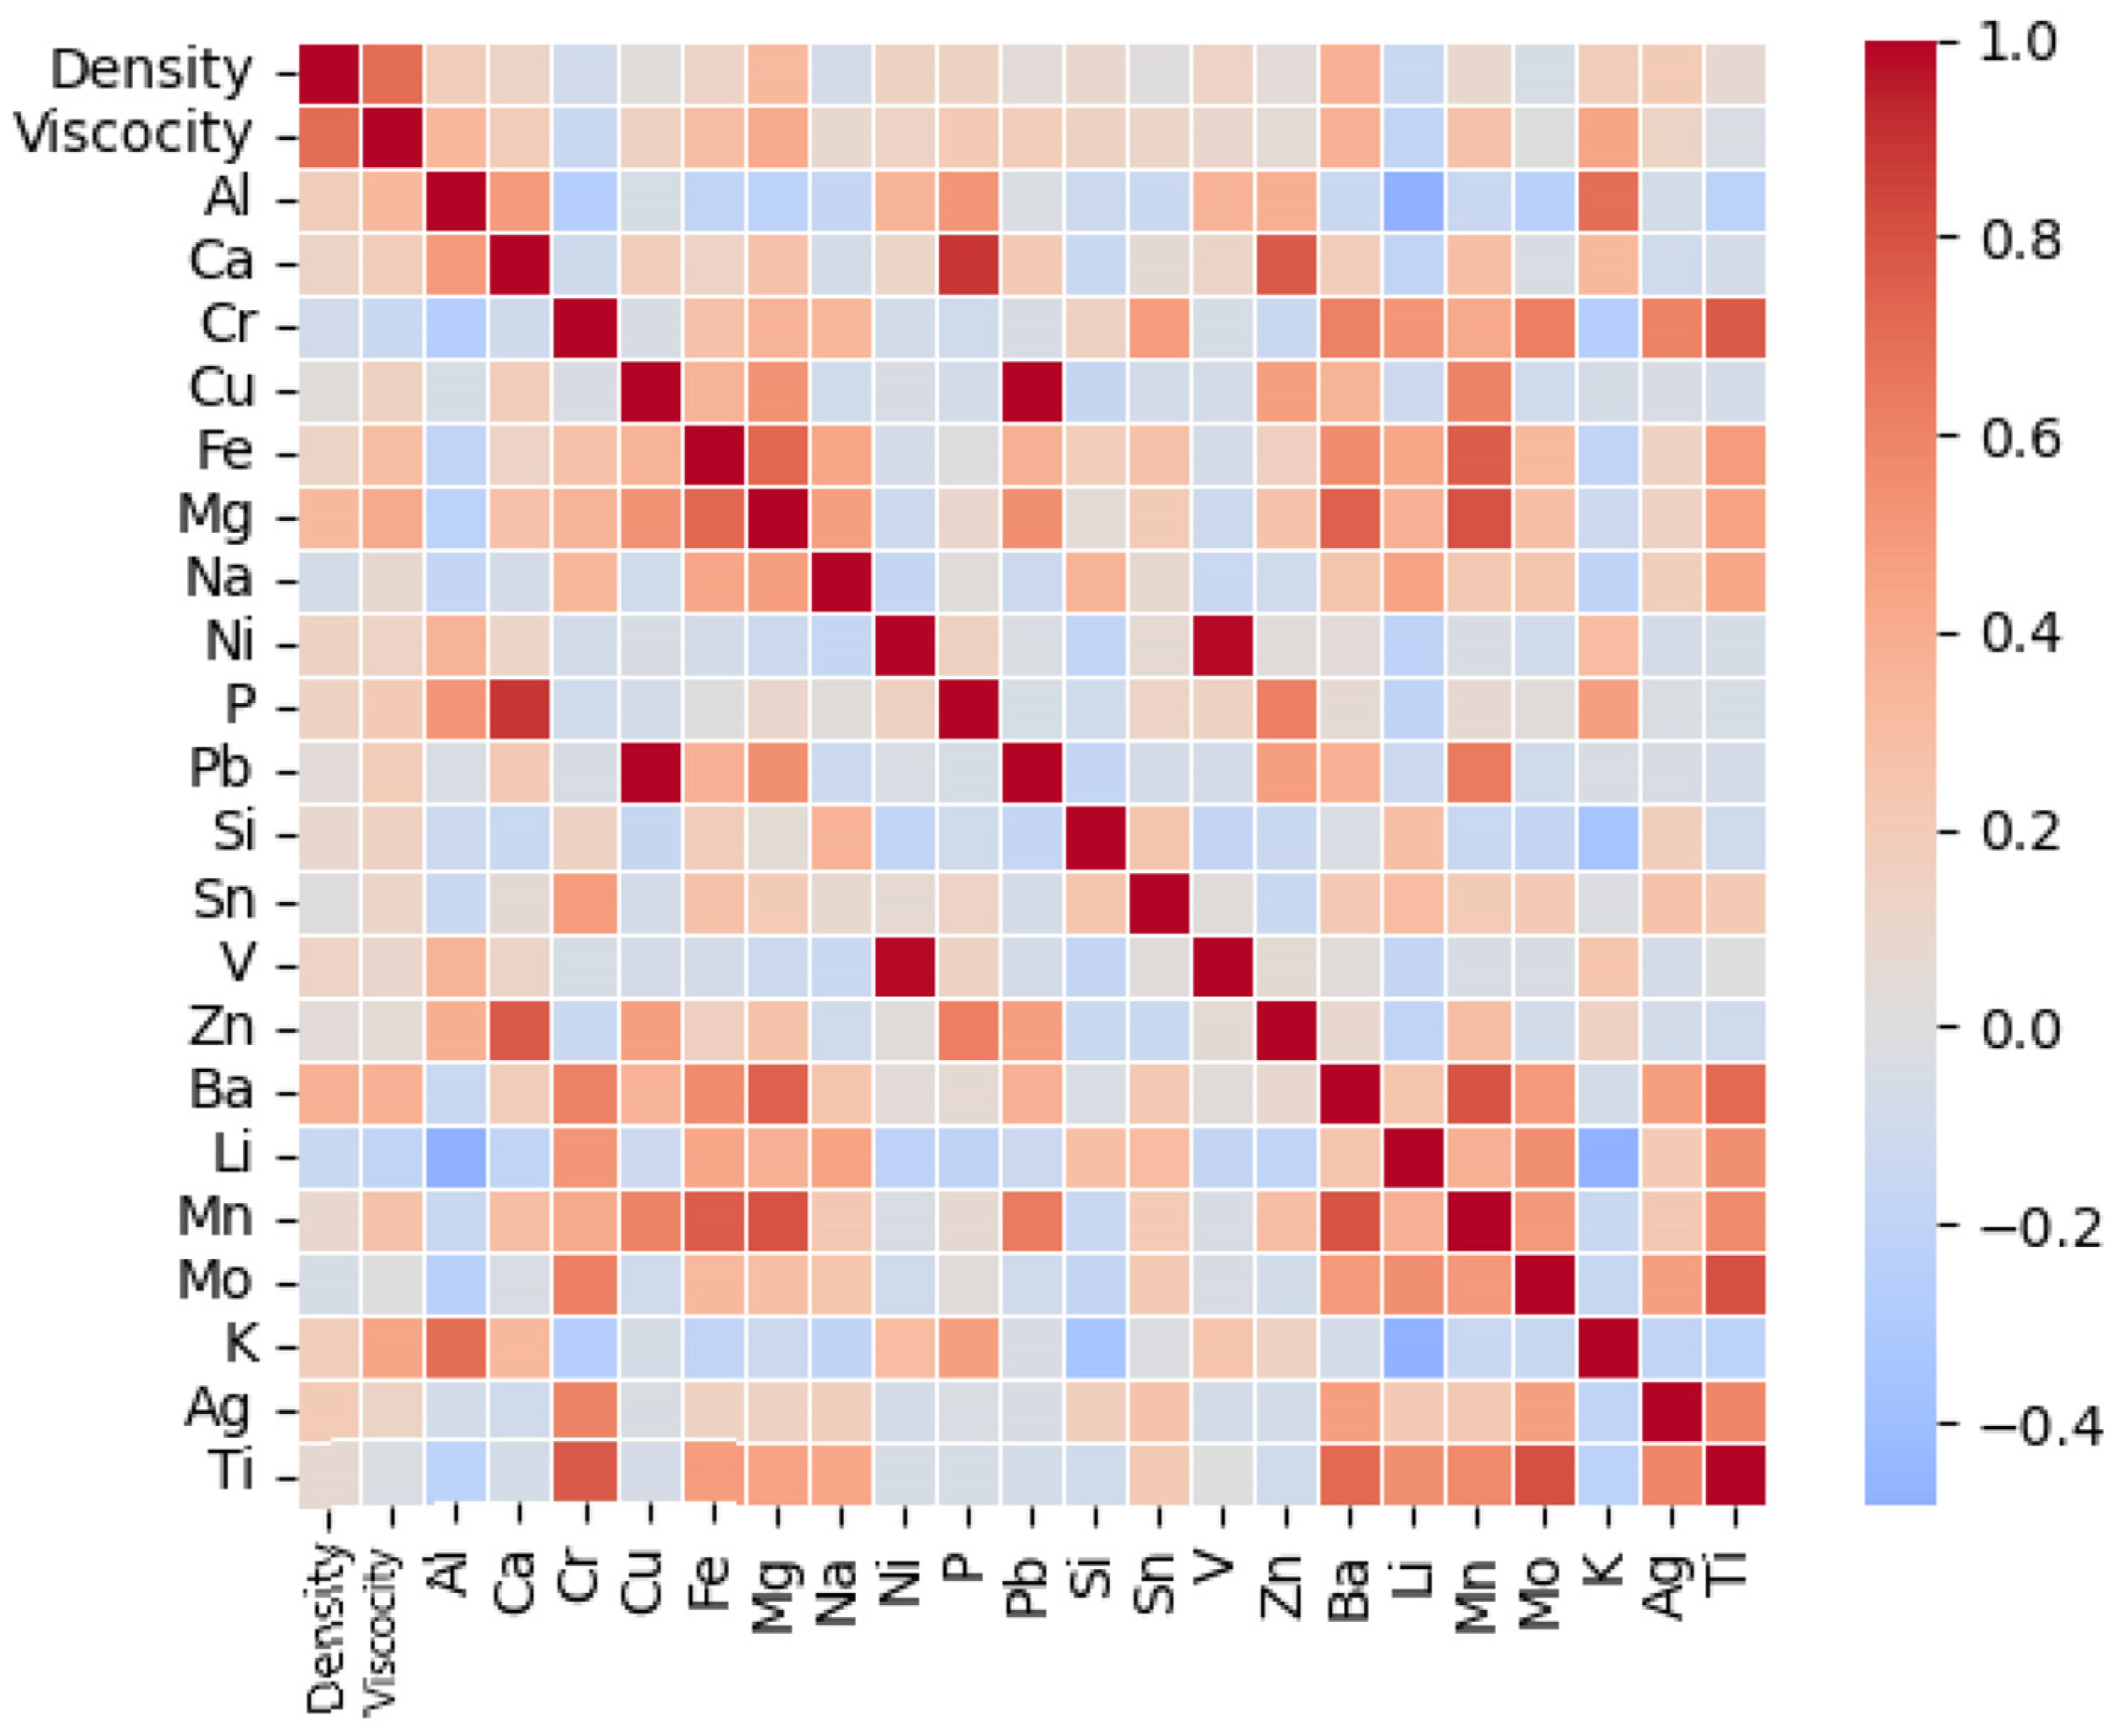
Initially, before the main results of this paper, a reliability analysis was performed for the determination of the most correlated variables between them. Subsequently, a correlation matrix between the amounts of Density, Viscosity and the ions concentration was constructed and is depicted in Figure 2.
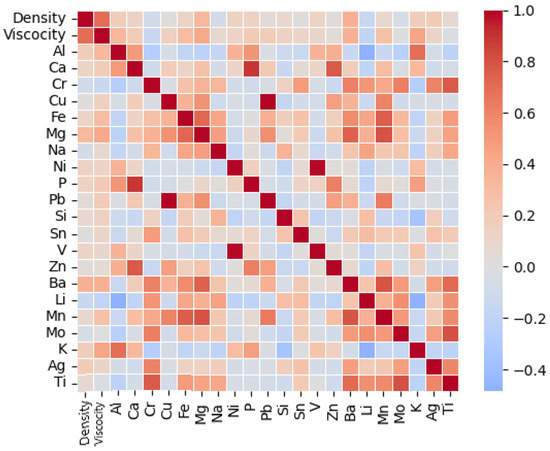
Figure 2.
Correlation matrix between the Density, the Viscosity, and the ions concentration.
It is evident that the most correlated ions are the Al, Ba, Ca, and their correlation coefficient is in the order of magnitude of 0.65. Most of the variables are positively correlated. However, some of them have negative correlation coefficients. This negative correlation does not have any practical meaning here, but it is given for result completeness. Despite this, the absolute value is less than 0.2 in most cases, subsequently these results indicate that insignificant negative correlation of some concentrations occurs which means that these variables are uncorrelated. Taking all these into account, the modelling of the ML models will be for the concentration of Al, Ba, Ca only and the rest of the ion’s concentration will be omitted hereinafter. These metals will be particles of the Particulate Matter (PM) emissions of the fuel. It should be noted that the model input and output parameters are considered time invariant.
Moreover, to obtain a reliable ML model, three possible model construction techniques were tested with the data in discussion. The FNN model with supervised learning for the training technique, which is discussed in chapter 2, the Random Forest Optimization method for the estimation of the model hyperparameters and the Extreme Gradient Boost Algorithm. The training dataset vector is of size 15 and the validation data is of size 15 which follows a common guide that from the total size of the dataset vector about a third of it should be used for the training dataset vector and another third of it shall be the validation dataset vector. The models were trained and the L2 error was calculated and compared for the models. The results are depicted in Table 1, where it can be clearly seen that the FNN modelling highly oversees the other two methods that are tested. Subsequently, for the three ions of Al, Ba, Ca, a set of FNN models will be formulated that predict the relation between the Density and Viscosity of the marine diesel as well as the aforementioned metal ions concentration in the marine diesel liquid.

Table 1.
L2 errors for the different modelling algorithms tested.
4. Results and Discussion
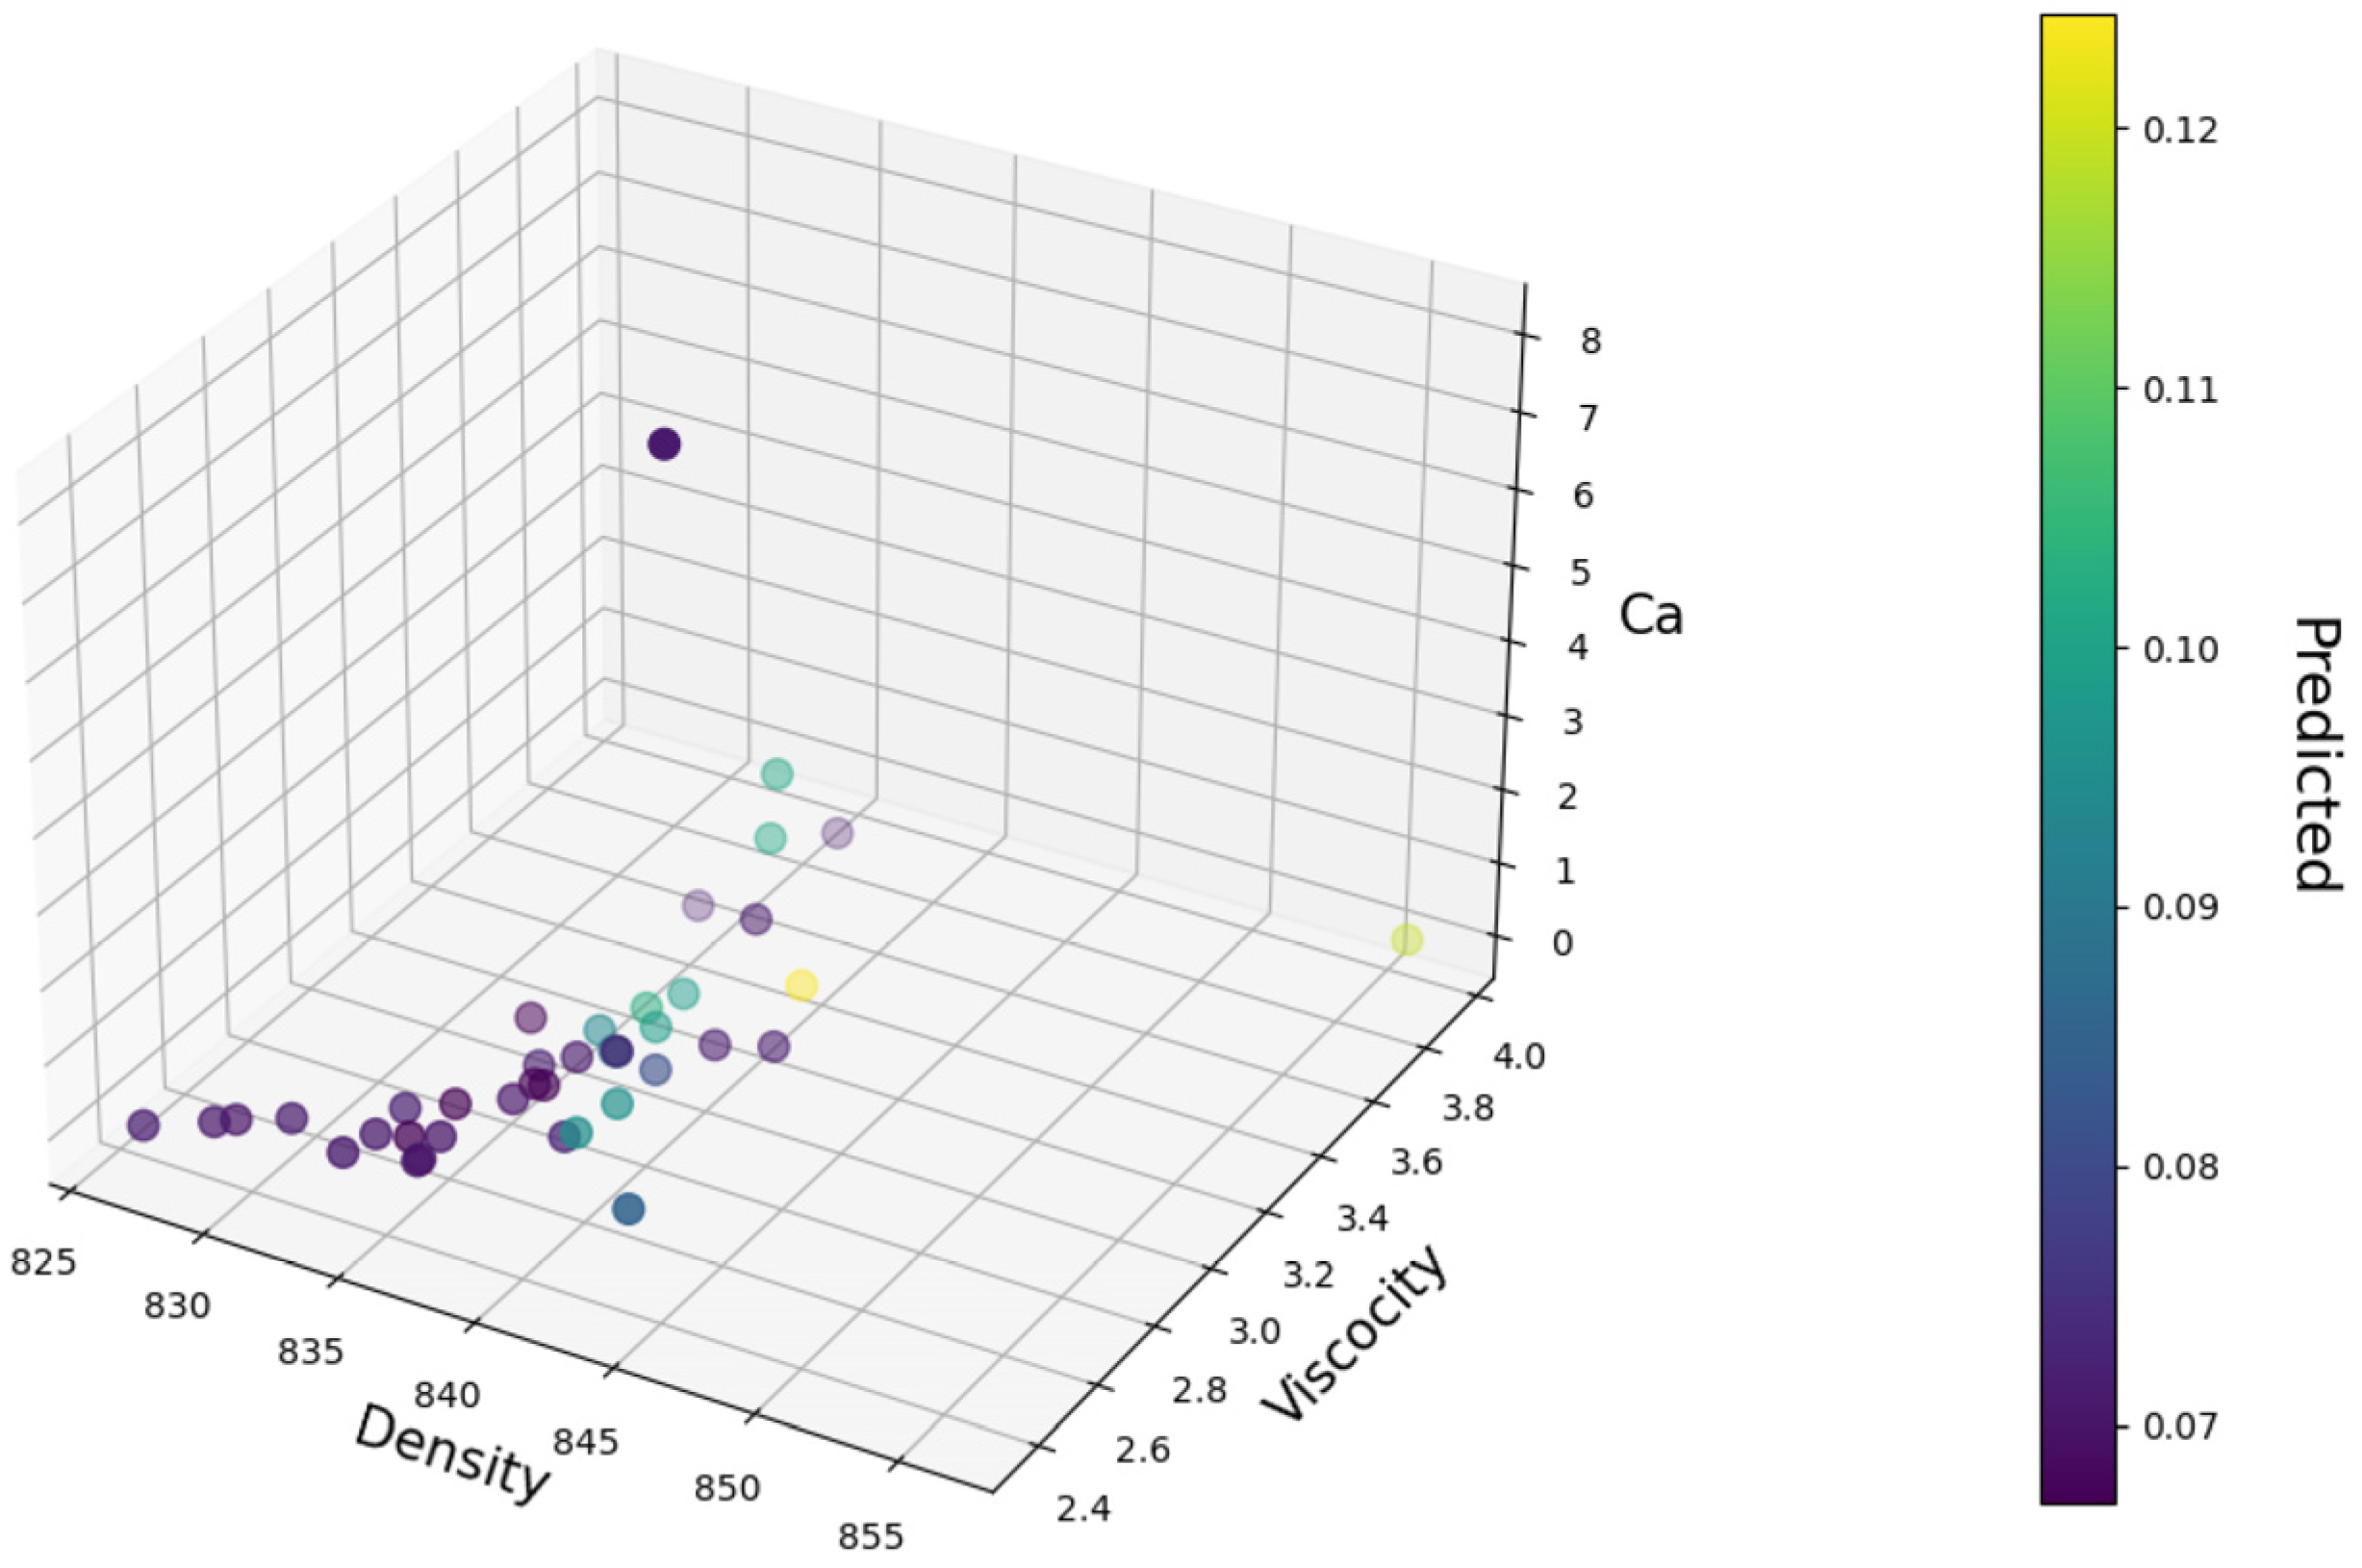
The main results are depicted in Figure 3, Figure 4, Figure 5, Figure 6, Figure 7, Figure 8, Figure 9, Figure 10 and Figure 11 and Table 2. In the aforementioned material, the three-dimensional representation of the FNN models, for the Al, Ba, Ca ingredients, are depicted alongside with the corresponding projections to Density/Concentration and Viscosity/Concentration planes. Moreover, the L2 errors and the corresponding epochs, that is the iterations of the training procedure, are given for the models with the initial dataset vector and the reduced dataset vector described in Section 3.1.
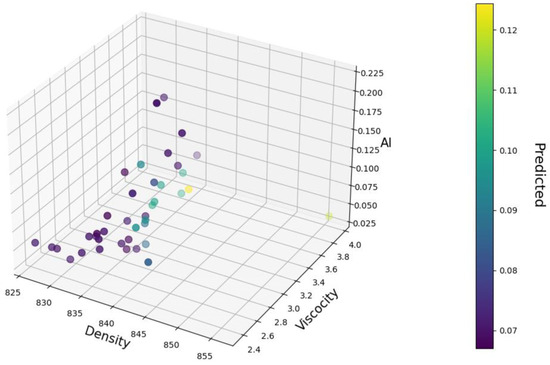
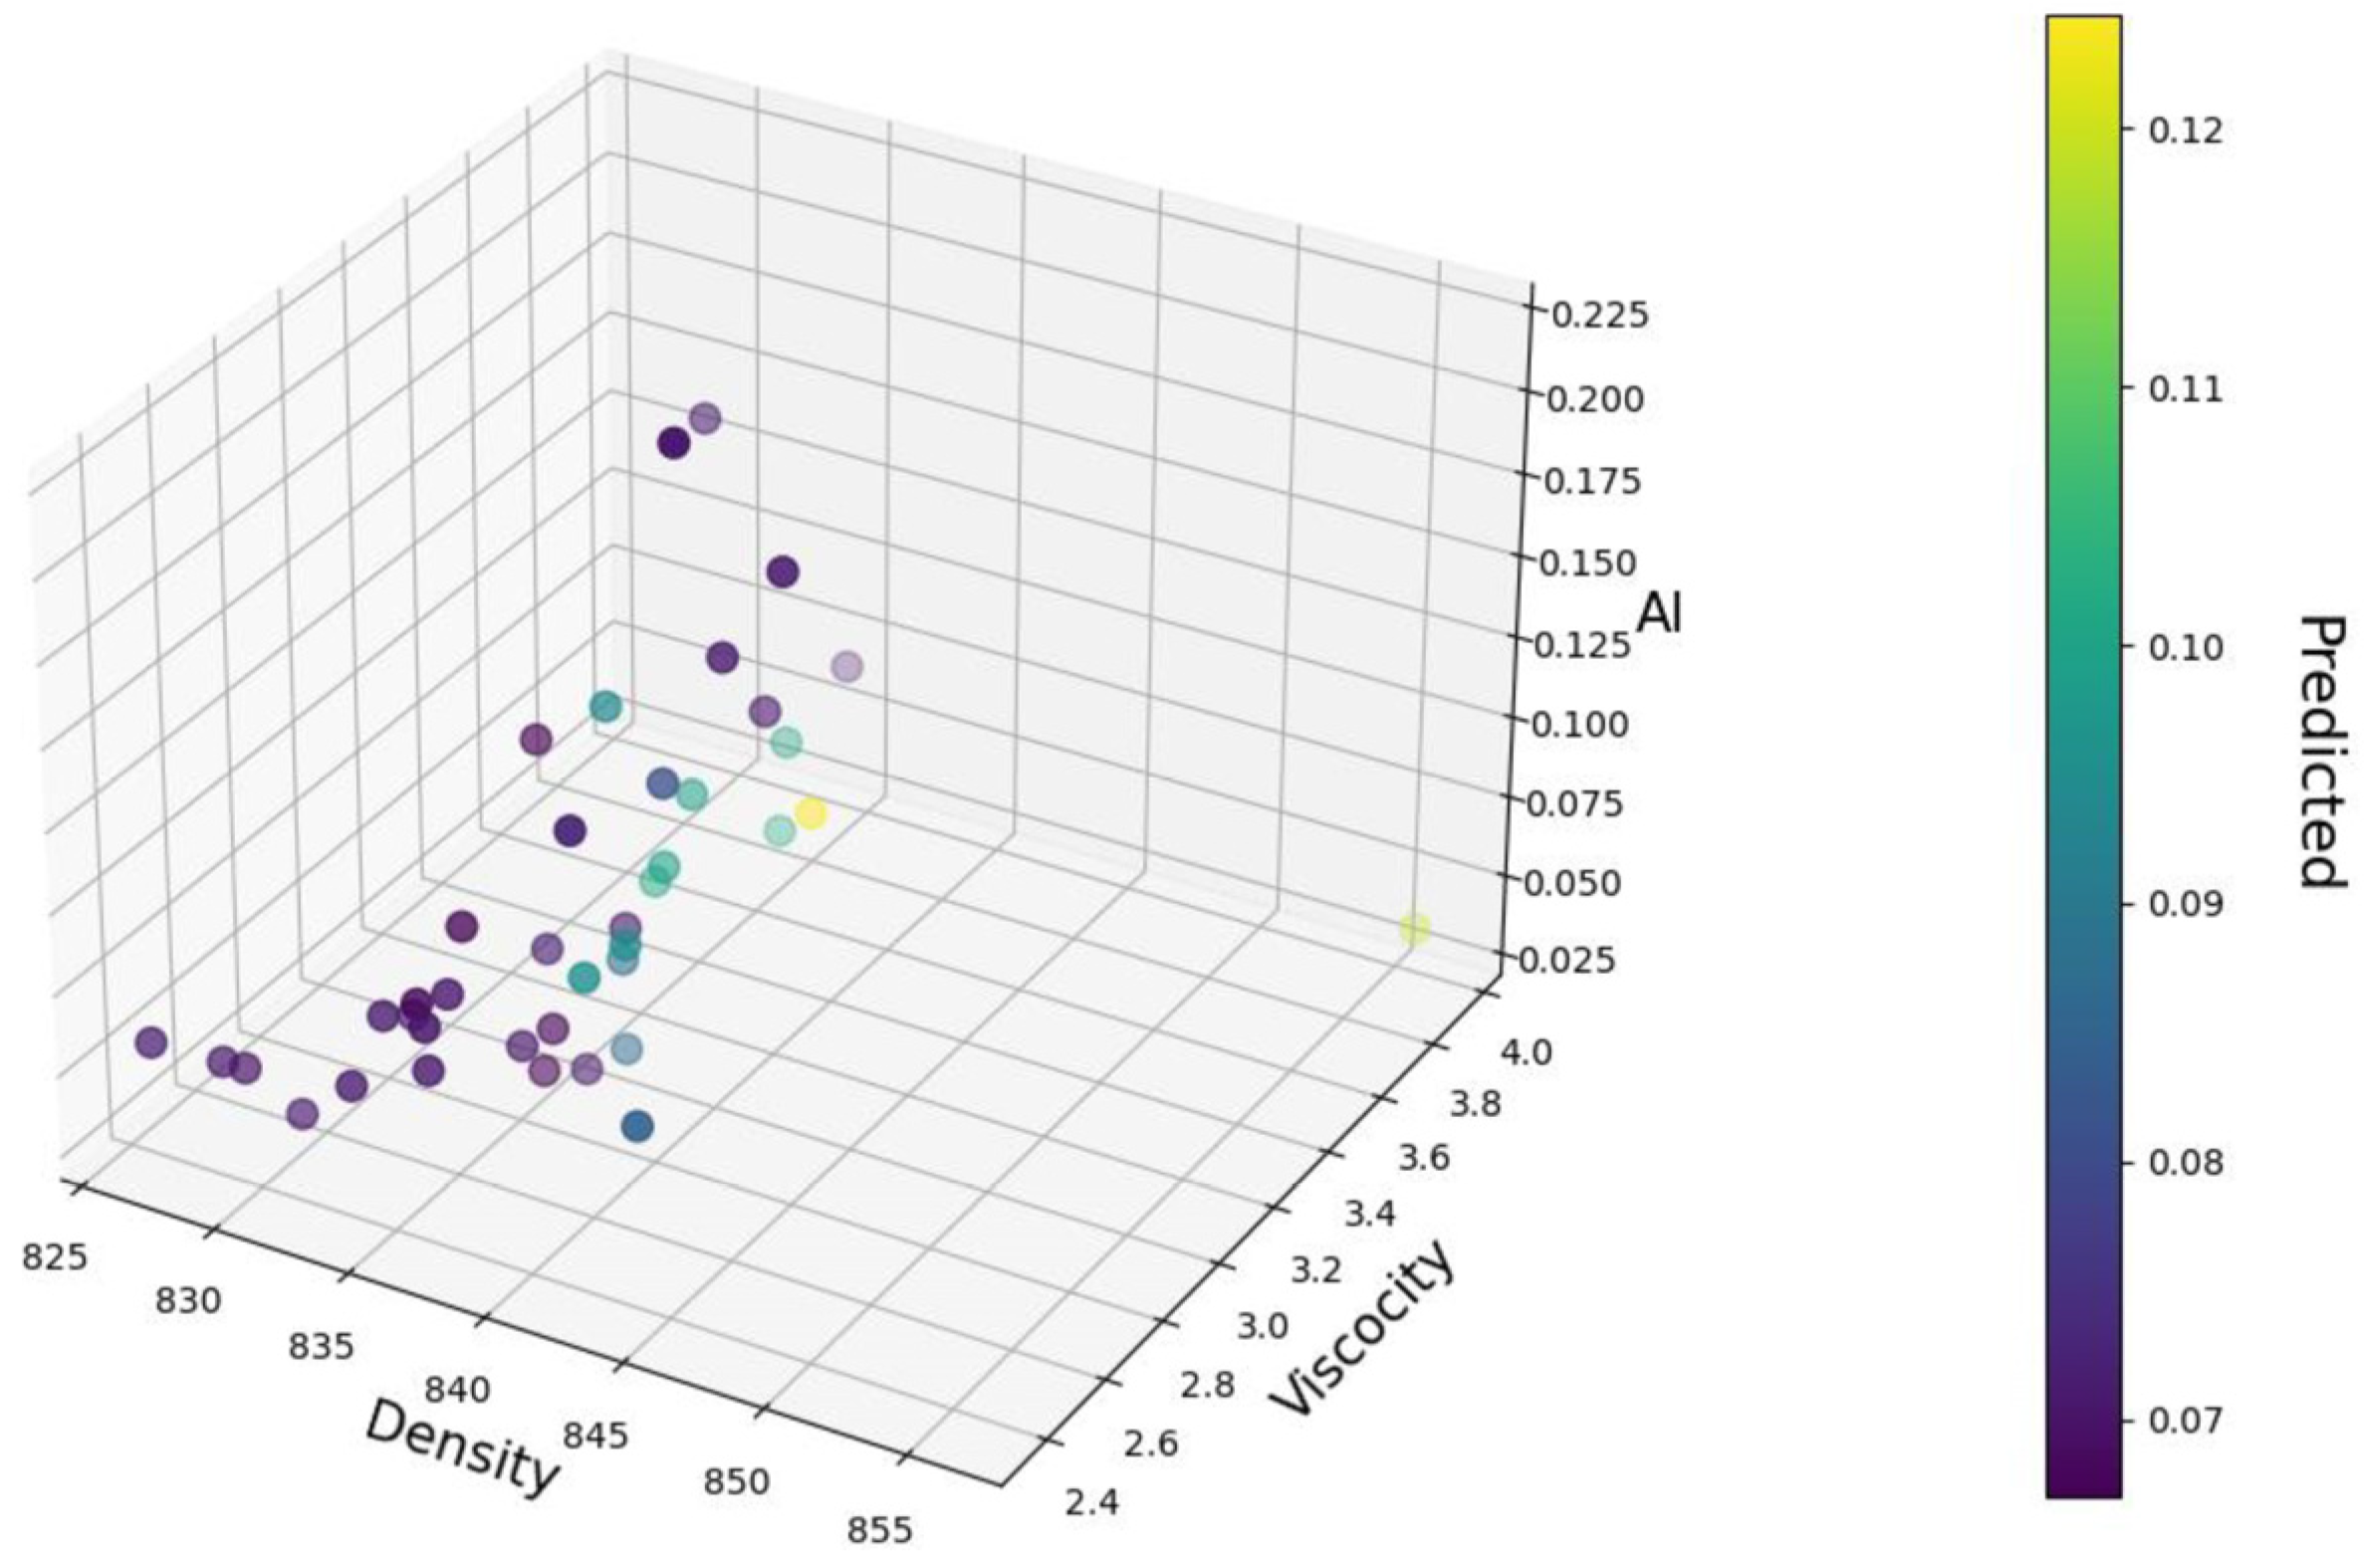
Figure 3.
Three-dimensional graphical representation of the FNN model of Al ion. Density unit is kg/m3. Viscosity unit is cSt and ion concentration is mg/kg.
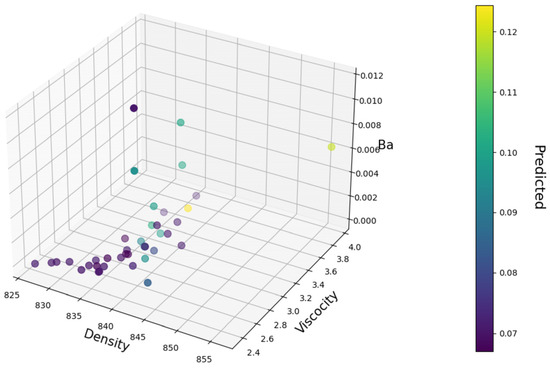
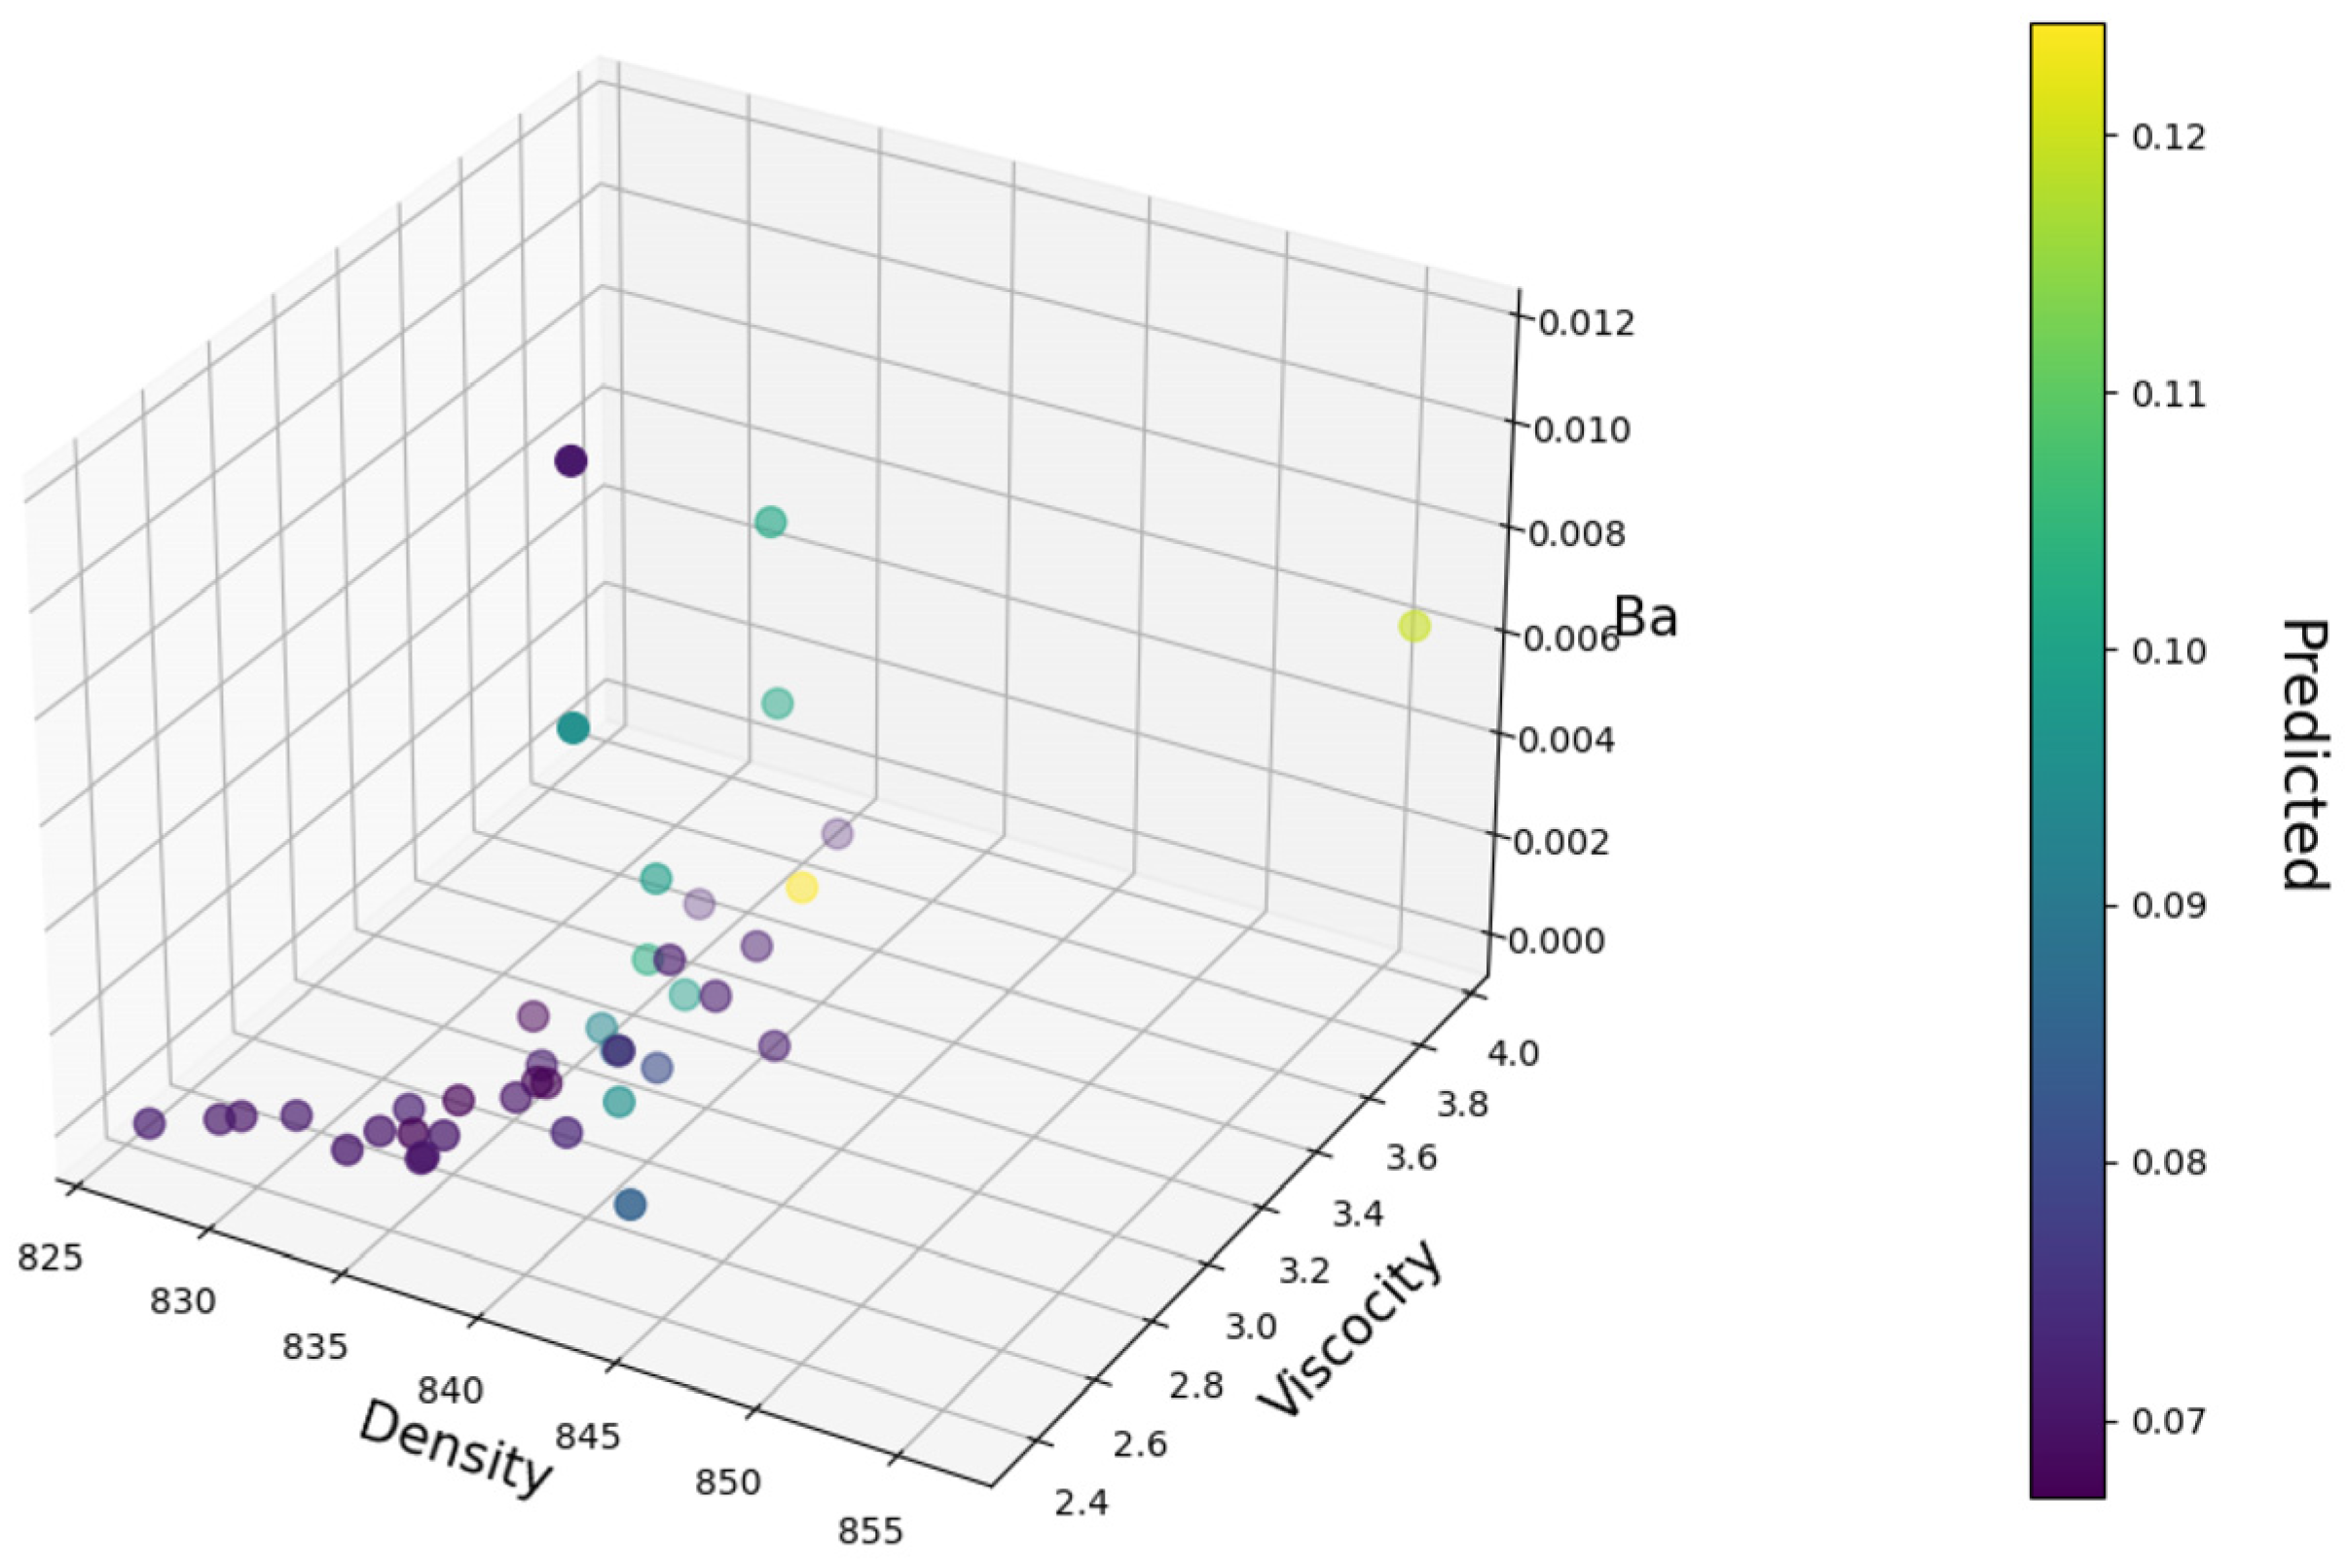
Figure 4.
Three-dimensional graphical representation of the FNN model of Ba ion. Density unit is kg/m3. Viscosity unit is cSt and ion concentration is mg/kg.

Figure 5.
Three-dimensional graphical representation of the FNN model of Ca ion. Density unit is kg/m3. Viscosity unit is cSt and ion concentration is mg/kg.
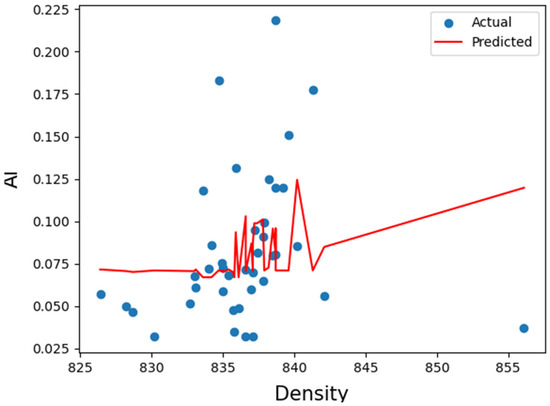
Figure 6.
Two-dimensional projection of the FNN model of Al ion in Density/Concentration plane. Density unit is kg/m3 and ion concentration is mg/kg.
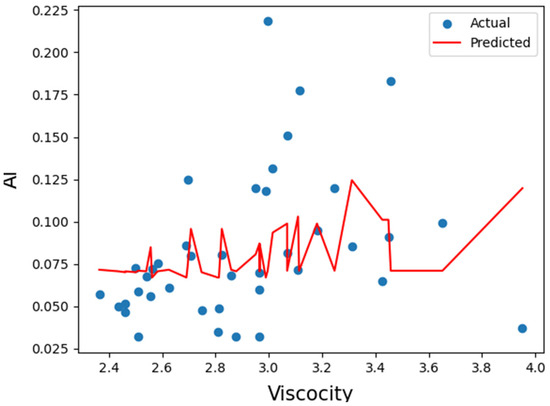
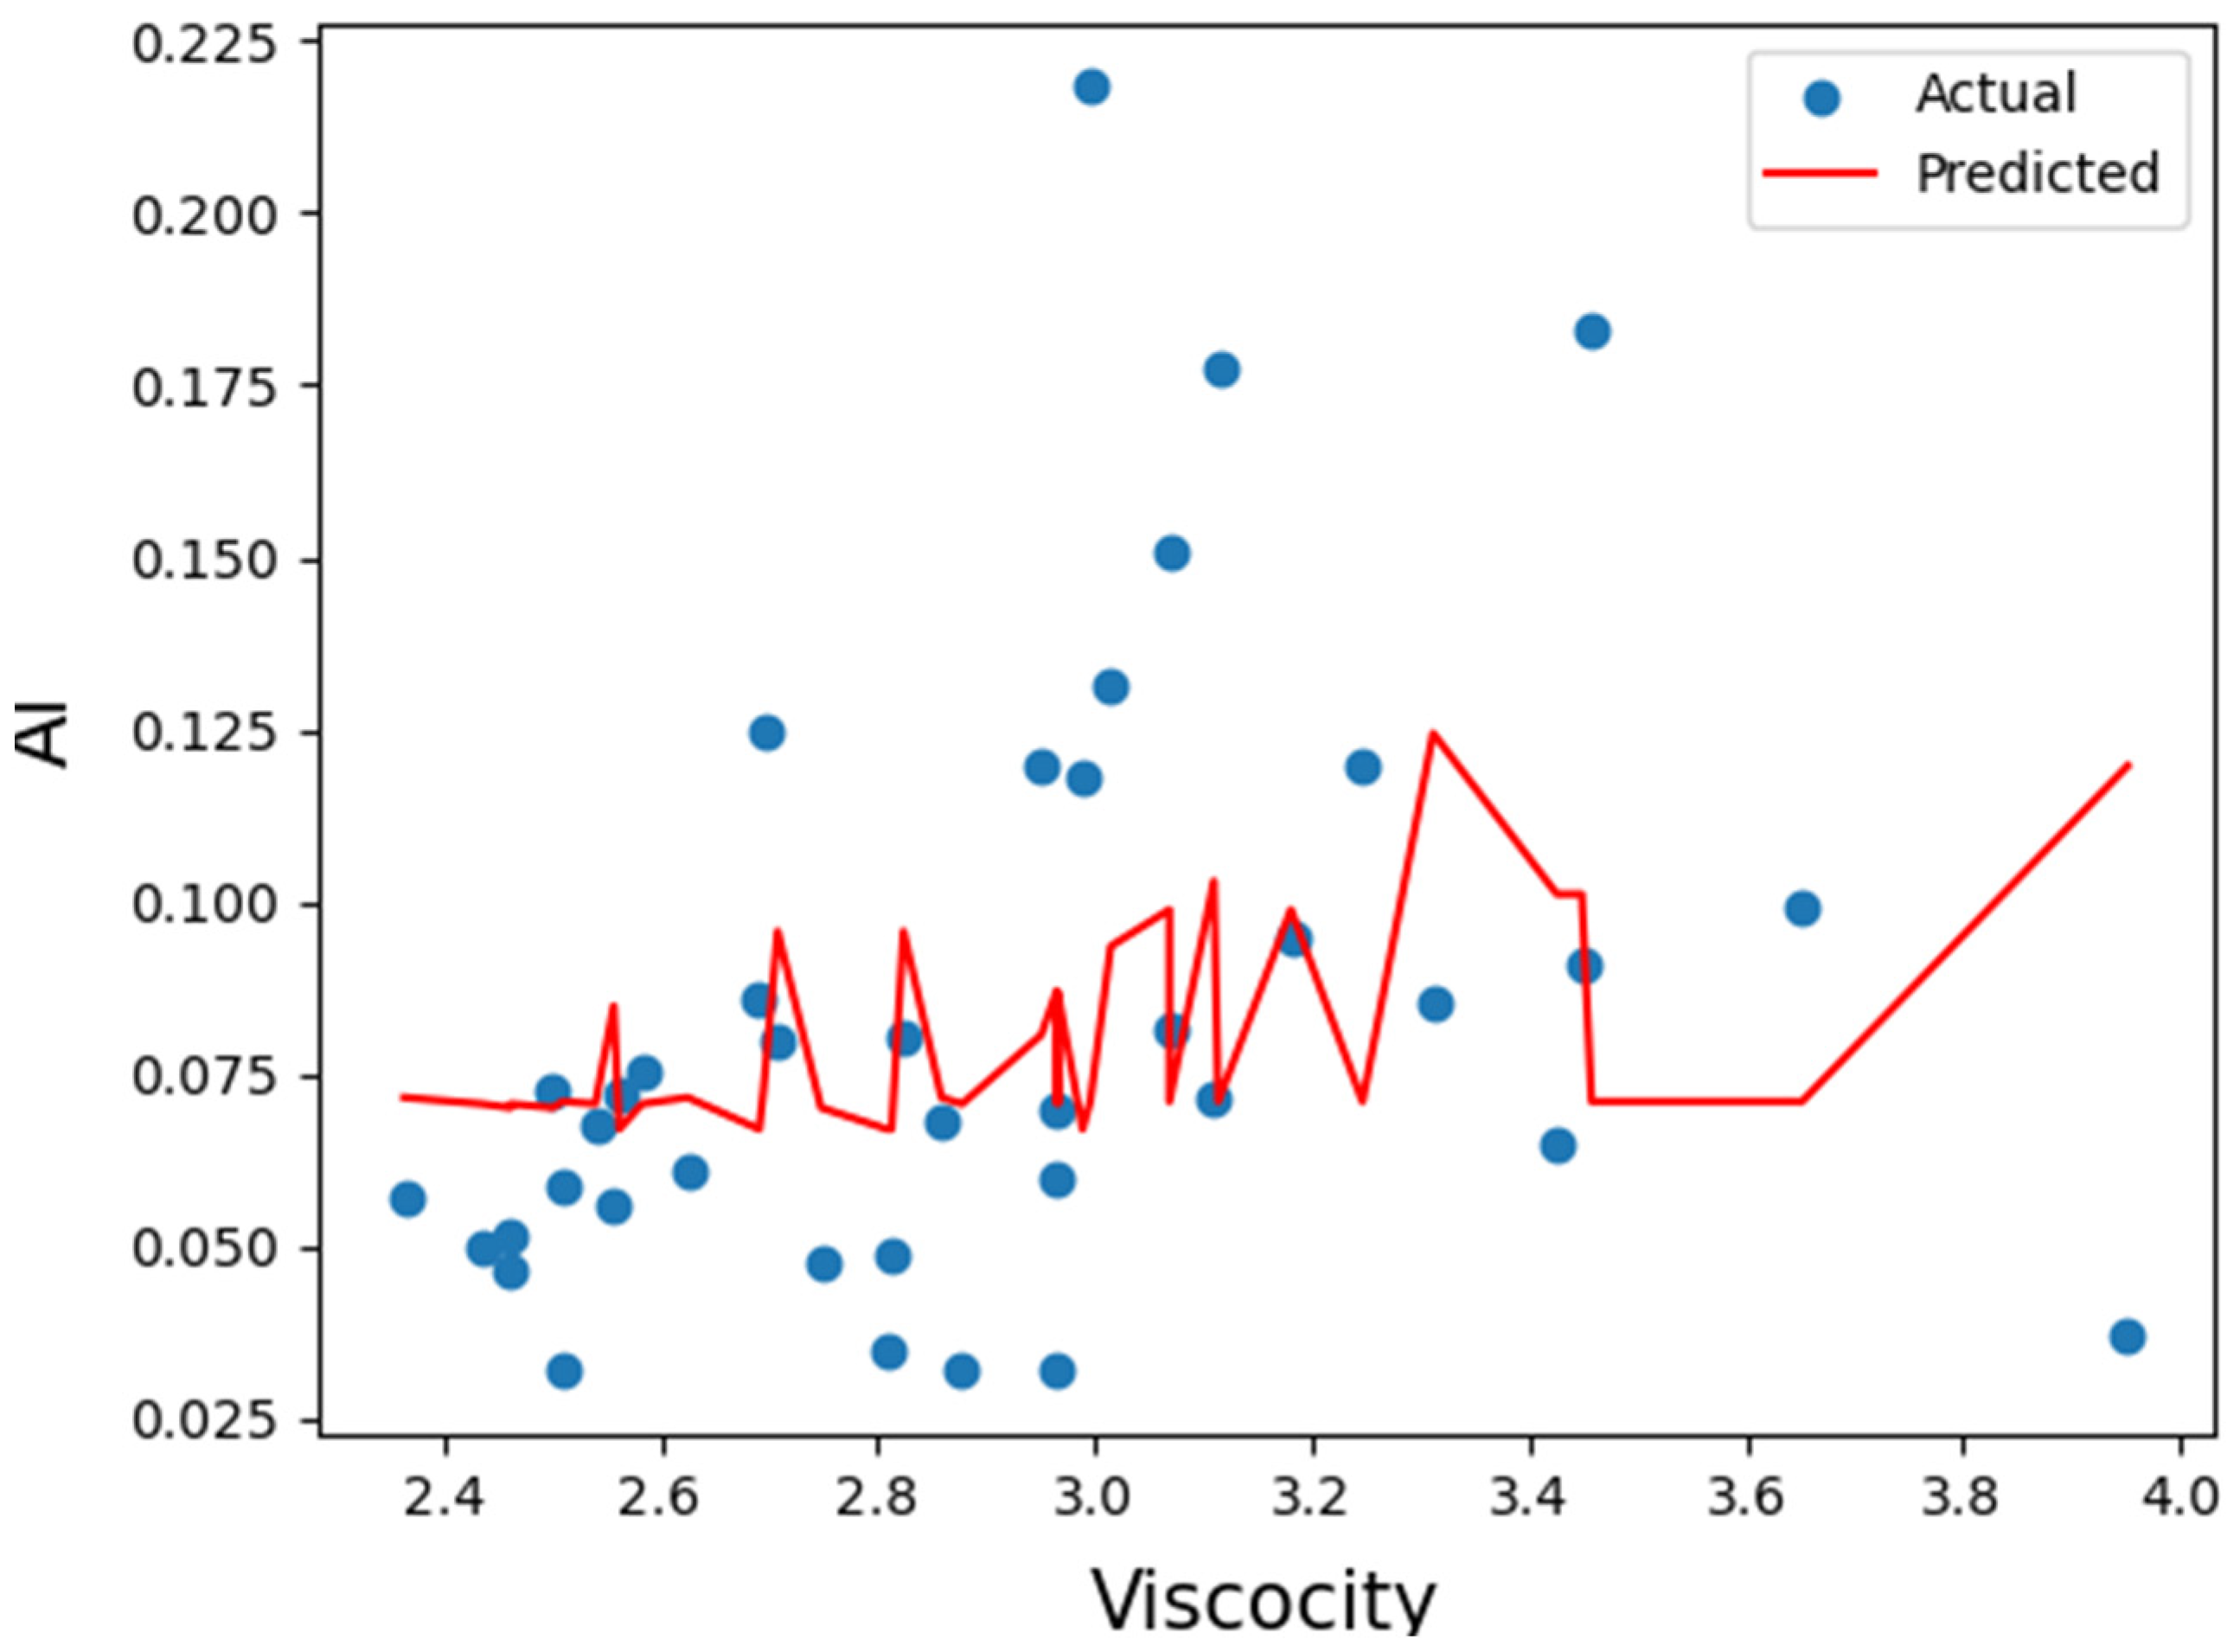
Figure 7.
Two-dimensional projection of the FNN model of Al ion in Viscosity/Concentration plane. Viscosity unit is cSt and ion concentration is mg/kg.

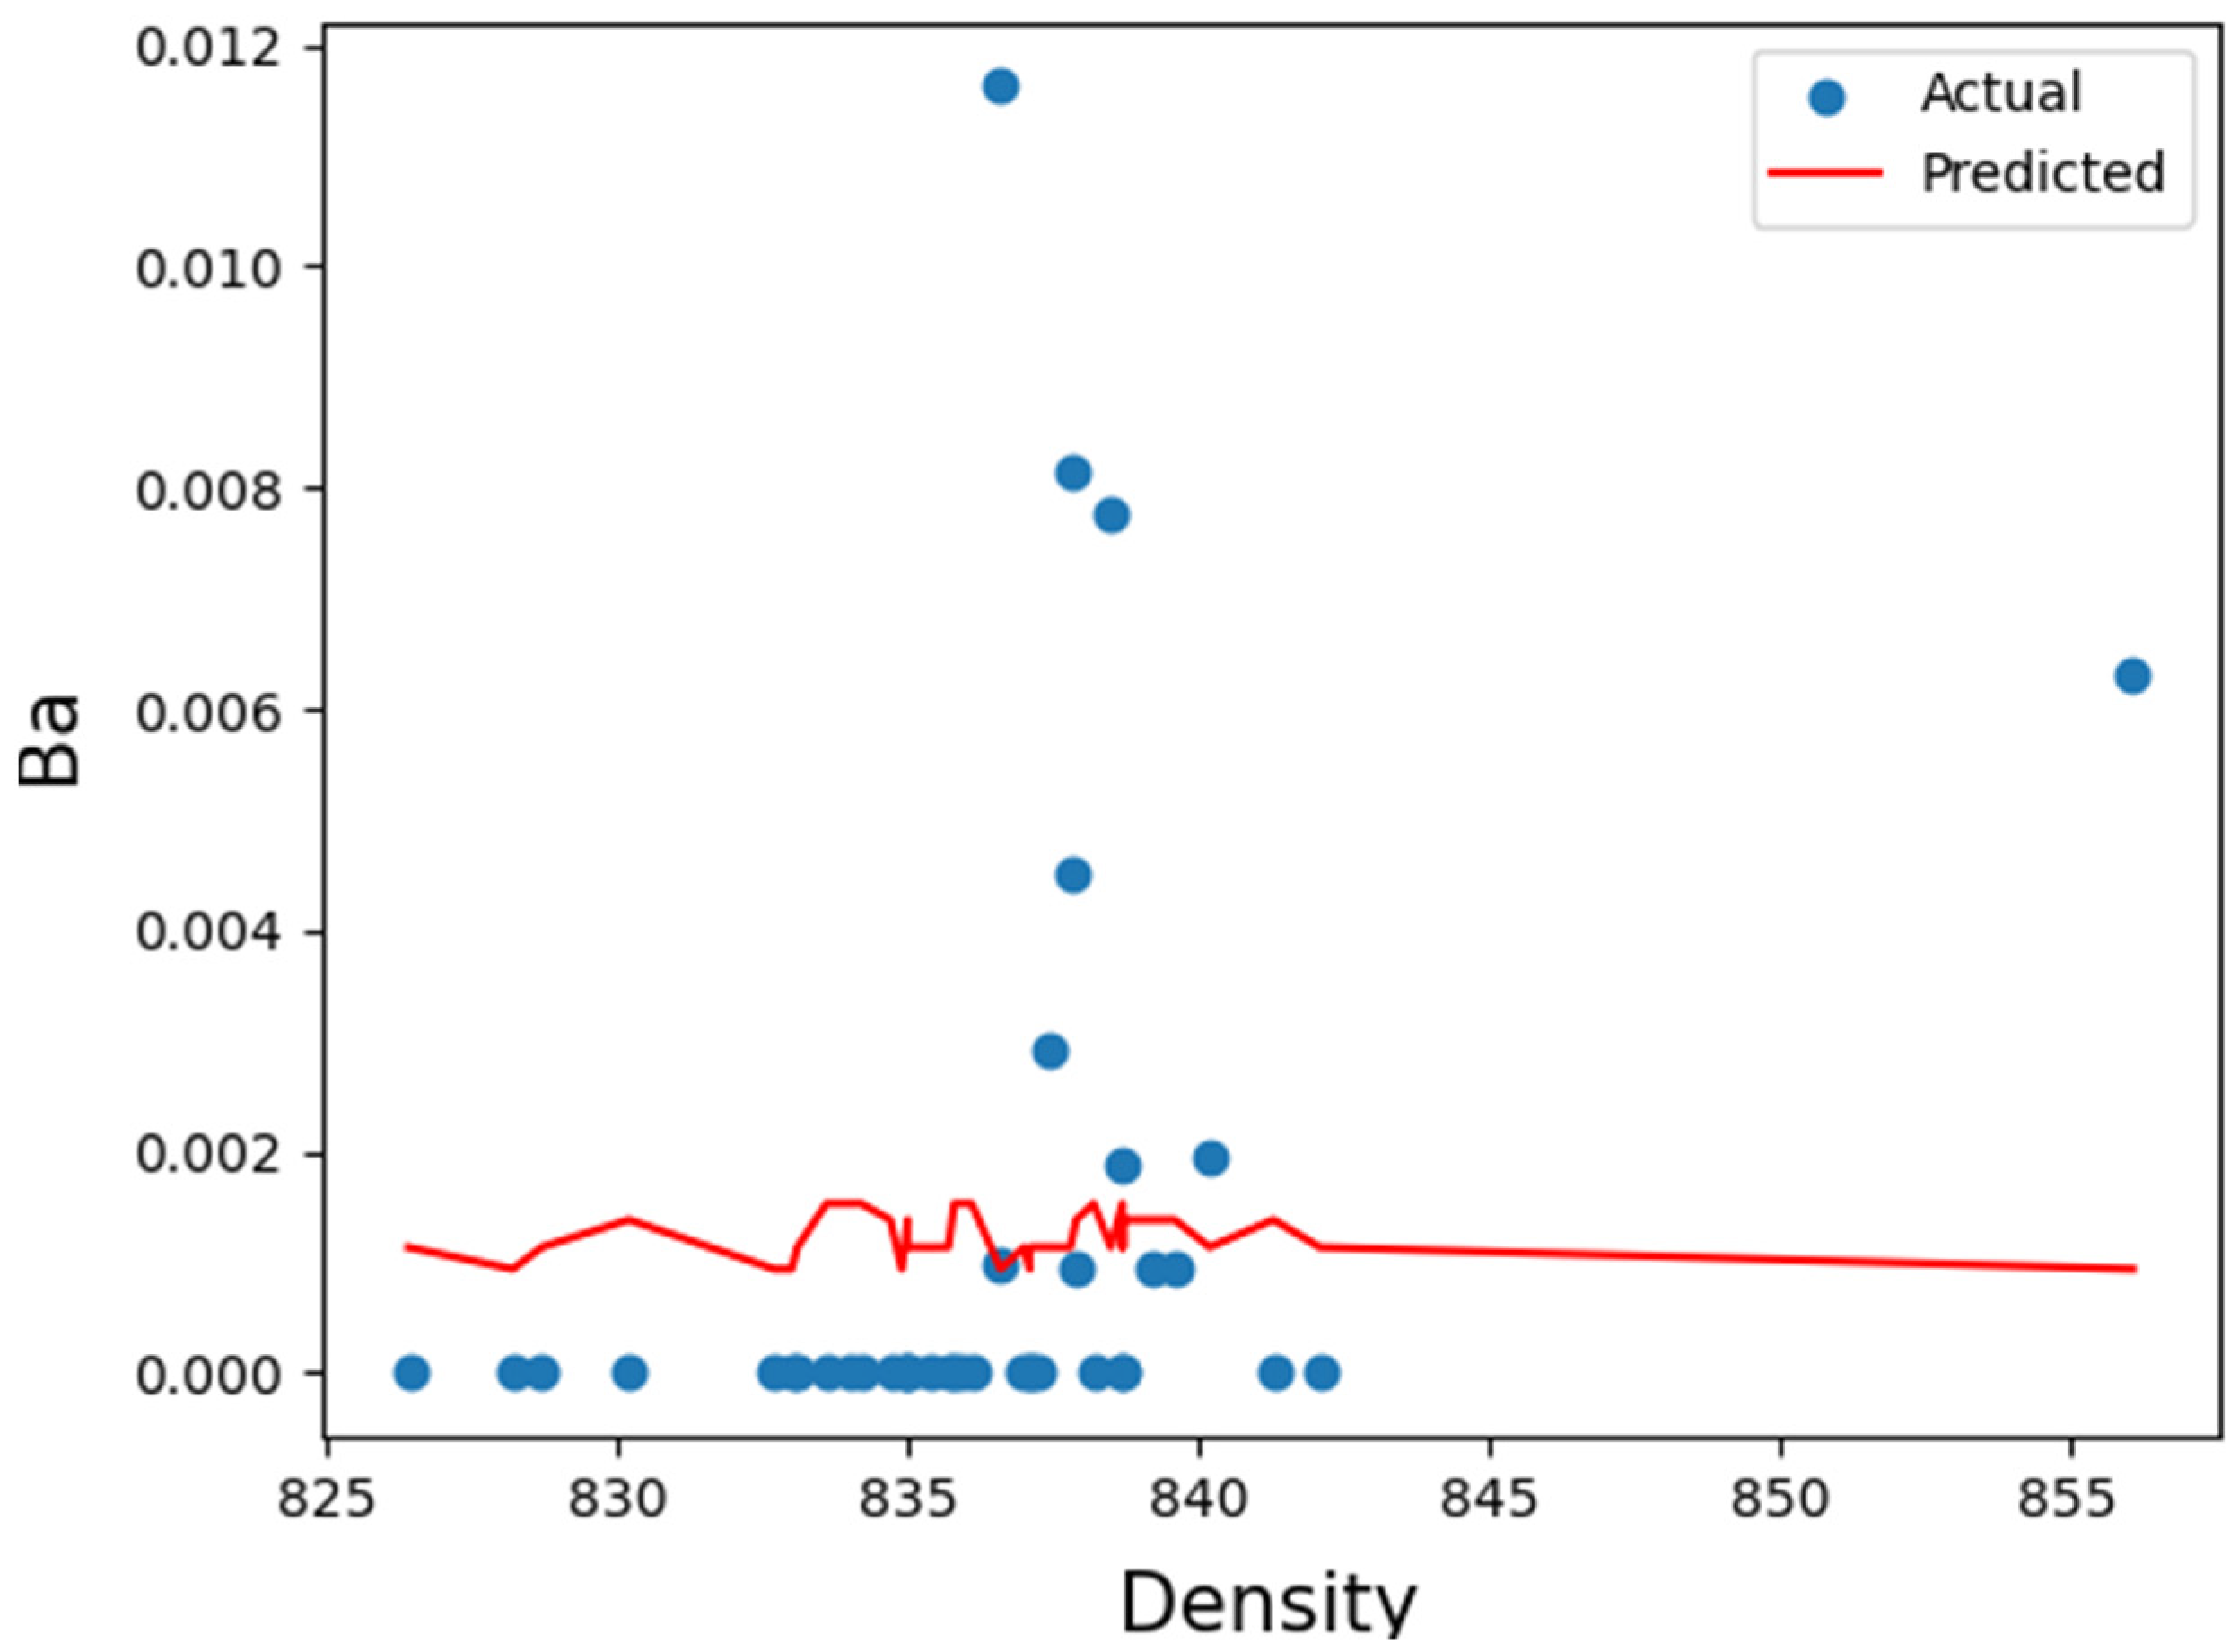
Figure 8.
Two-dimensional projection of the FNN model of Ba ion in Density/Concentration plane. Density unit is kg/m3 and ion concentration is mg/kg.
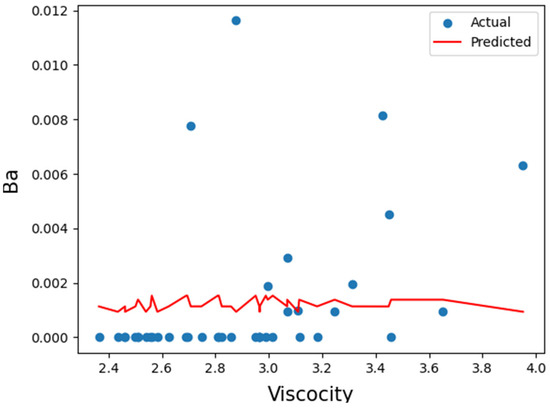
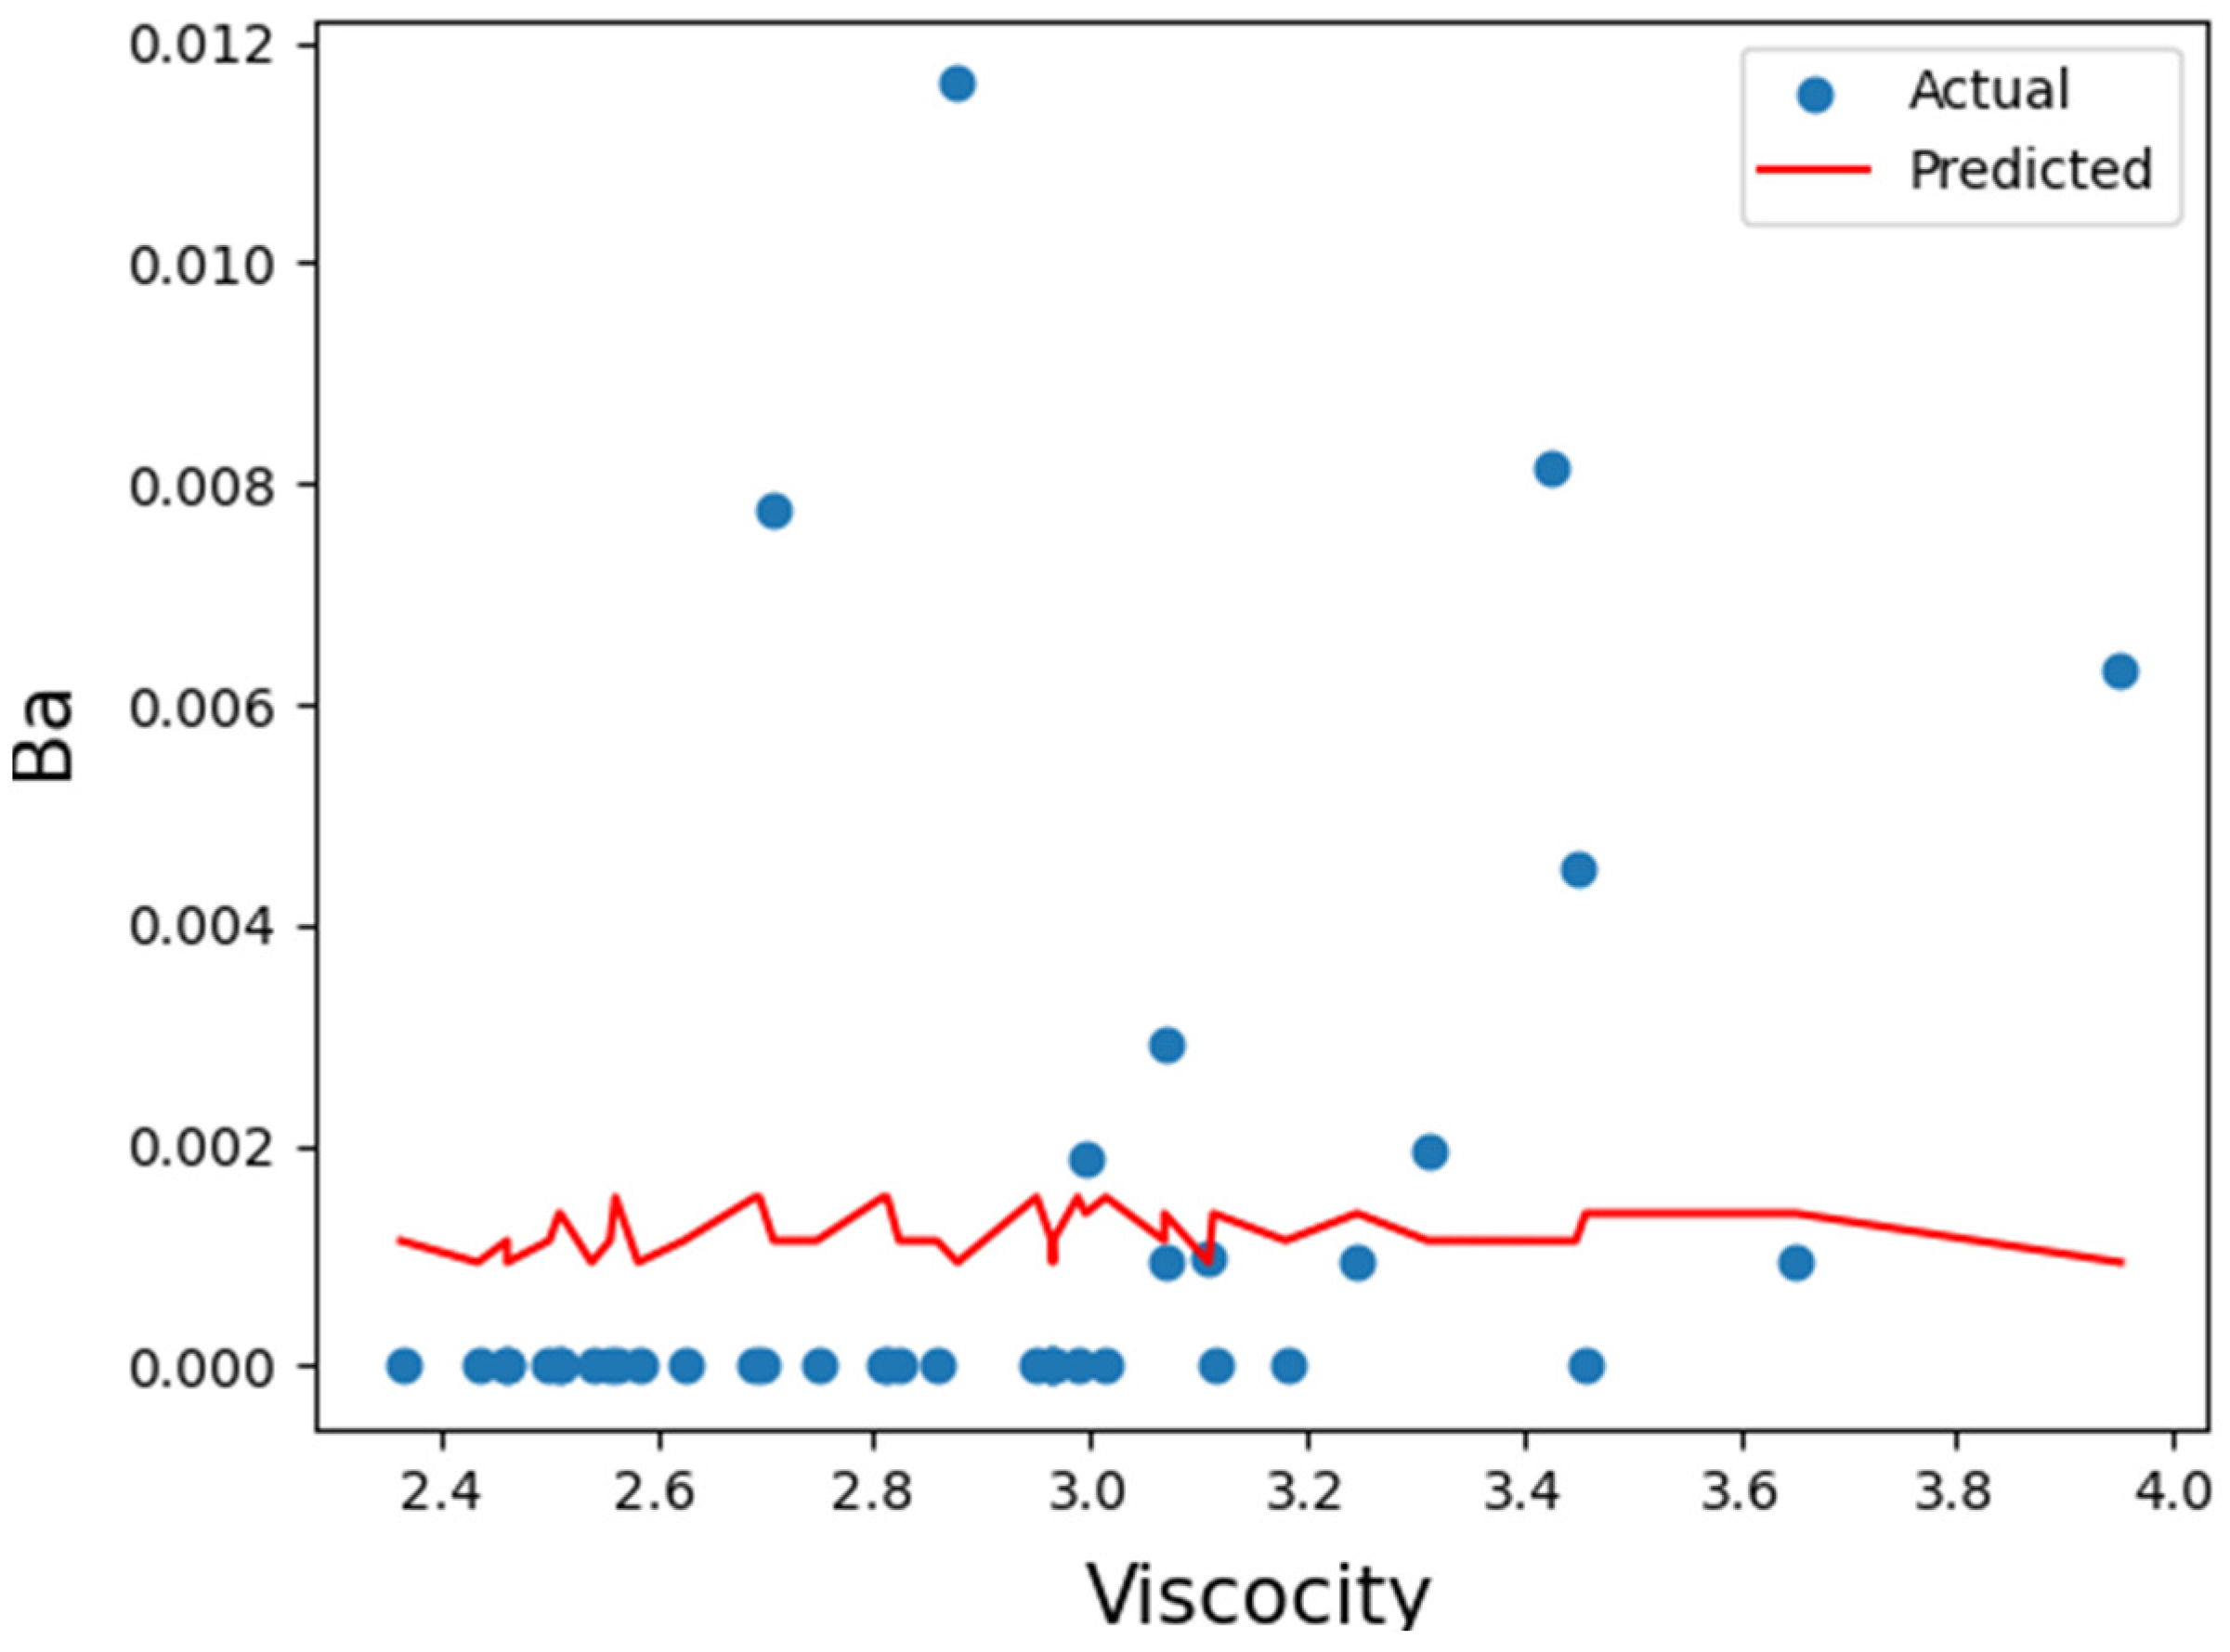
Figure 9.
Two-dimensional projection of the FNN model of Ba ion in Viscosity/Concentration plane. Viscosity unit is cSt and ion concentration is mg/kg.

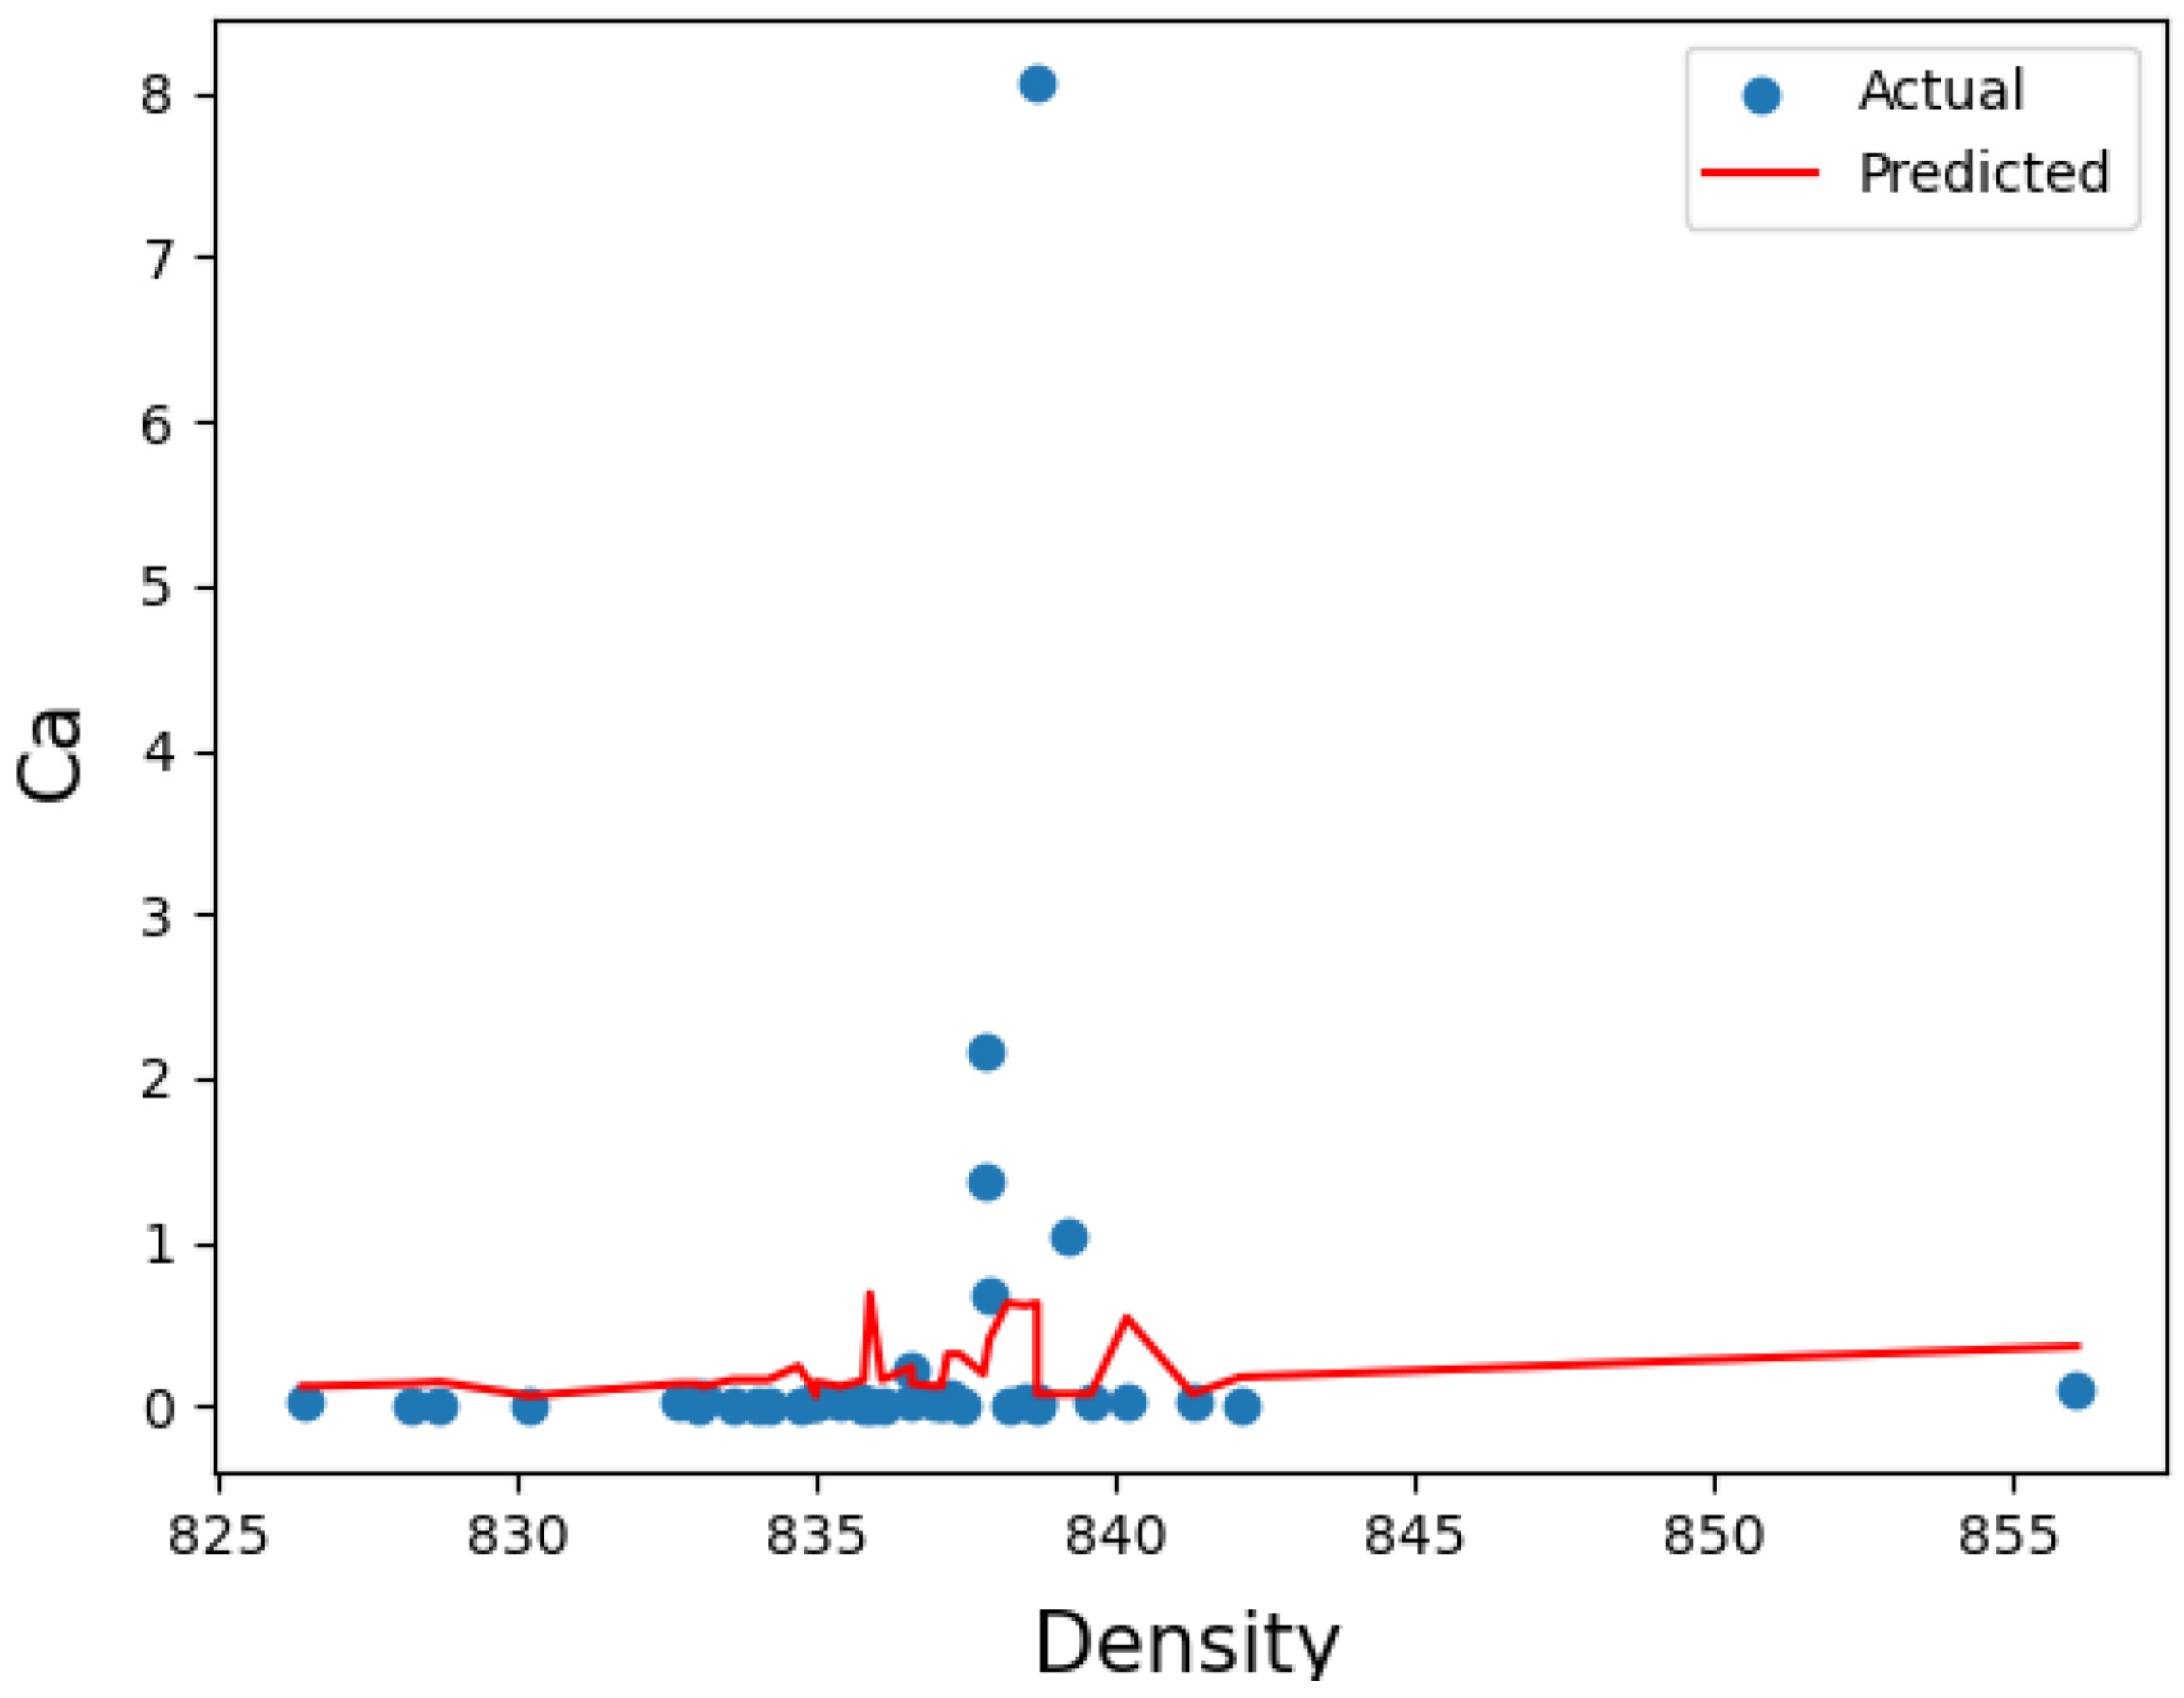
Figure 10.
Two-dimensional projection of the FNN model of Ca ion in Density/Concentration plane. Density unit is kg/m3 and ion concentration is mg/kg.
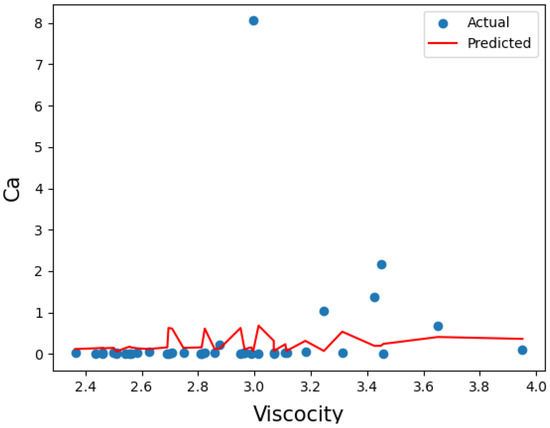
Figure 11.
Two-dimensional projection of the FNN model of Ca ion in Viscosity/Concentration plane. Viscosity unit is cSt and ion concentration is mg/kg.
Table 2.
L2 errors and epochs with the full dataset sample and with the reduced dataset sample.
From the portrayed results several deductions may be made. For the initial dataset vector of size 41, the convergence can be obtained with a relatively moderate number of epochs, for which the limit is considered for moderate characterization as 100,000.00. The L2 error is considered fairly large which is in the order of magnitude of 0.35 for all three correlated ions, namely Al, Ba, Ca. However, as can be observed from the dataset, there are two datapoints in each case that really diverge from the trend that occurred from the training procedure. Since the amount of datapoints is smaller than 10% of the initial dataset size, it can be concluded that this is merely a consequence of measurement error or by flaws in the maintenance of the diesel tank. If the aforementioned data points are removed, the models provided are far better with the epochs that amount to converge the training session to remain moderate but smaller than before. In addition, the error is drastically reduced to the vicinity of 0.05. That provides the result that the experimental procedure has provided a fairly unbiased dataset in terms of measurement bias.
In addition to the previous discussion, there is an indication of the importance of the correlation of the input variables to the output ones by introducing the correlation of the sum of the output variables, namely the ions concentration with the input variables, namely the Density and Viscosity as an overall estimation of the sensitivity of the input variables to the output ones. Subsequently, the correlation between the sum of the concentrations of the model in relation with the Density and Viscosity are, respectively, 0.15 and 0.29 which can be considered as feeble. This gives the deduction that the marine diesel ingredients are in general highly uncorrelated and only a small part of them do seem to have an important influence between each other and the diesel Density and Viscosity.
For the Aluminum ion, the relation between its concentration and the diesel Density appears to mainly be linearly related for Density less than 833 kg/m3. For denser liquid, the correlation is highly nonlinear and presents increased gradient values. The larger estimated value is 0.125 mg/kg. which is considered as moderate. Moreover, the regression between its concentration and the diesel Viscosity appears to be highly nonlinear in all range of estimations obtained from the experimental procedure. The gradients are fairly large in all subspaces which are increasing and decreasing. The larger estimated value is 0.125 mg/kg. which is considered as moderate. Subsequently, the optimum triad is (Density, Viscosity, Al) = (840, 3.35, 0.125).
For the Barium ion, the relation between its concentration and the diesel Density appears to mainly have a small nonlinear behavior throughout the range of experimental estimations. The gradients are smaller compared to the ones by Aluminum and it can be considered in some subspaces as quasi linear behavior. The larger estimated value is 0.0015 mg/kg. which is considered small. In addition, the regression between its concentration and the diesel Viscosity appears to mainly have a small nonlinear behavior throughout the range of experimental estimations. The gradients are smaller compared to the respective ones by Aluminum but compared to the gradients for the Barium and Density relation, the aforementioned gradients are greater. The larger estimated value is 0.0015 mg/kg. which is considered small. Subsequently, the maximum concentration vector is (Density, Viscosity, Ba) = (834, 2.8, 0.0015).
For the Calcium ion, the relation between its concentration and the diesel Density appears to mainly be nonlinearly related for Density in between 835 and 842 kg/m3. For liquids that are thinner, the correlation is linear, and the gradient values are in general small. The larger estimated value is 0.75 mg/kg. which is considered small. Adding to this, the regression between its concentration and the diesel Viscosity appears to be highly nonlinear in the range of estimations between 2.75 and 3.30 cSt. The gradients are fairly large in the aforementioned range of experimental measurements. The larger estimated value is 0.75 mg/kg. which is considered as moderate. Subsequently, the optimum set is (Density, Viscosity, Al) = (837, 2.72, 0.75).
5. Conclusions
In this work, a Machine Learning framework for the estimation of metal ions concentration in relation with the Density and the Viscosity in Marine Diesel is given. A substantial dataset vector from in situ measurements from Marine Diesel Storage tanks situated in and all-around Greece is constructed. The data curation has been employing all the classical regulation standards that hold in Greece. Feed Forward Neural Networks are formulated, after a precedent reliability analysis and model formulation algorithm investigation with the governing variable, the L2 error. Subsequently, for the more correlated ions concentration among themselves and corelated with Density and Viscosity, namely Al, Ba, Ca, Feed Forward Neural Networks are formulated and presented alongside with their convergence analysis, which states that the L2 error and the corresponding epochs iterations for convergence of the calculation of the model hyperparameters. The schematic illustration of the models is in three dimensions and in two dimensions projections.
The Feed Forward Neural Networks with the full dataset vector, have a significant error and in some selective positions diverge the dataset point with the trend trained by the algorithm. This can be attained by the fact that there may be a measurement error or deficient maintenance of the diesel tanks. By removing the two most divergent sample components, the error is drastically reduced to a substantial amount in the vicinity of 0.05. The epochs needed in both cases can be considered as moderate, since it is less than 100,000.00, leading to the fast convergence and the adaptivity of the model in order to take into consideration possible new experimental or in situ data. As proven, the selection of the aforementioned variables made the model have the most representative to realistic results since taking into consideration more concentrations would lead to less correlated model estimations thus leading to a deduction that this modelling approach provides the best possible reliable representation for the dataset given.
The Machine Learning models formulated have a weak correlation in all the output variables combined. That is demonstrated since the sum of the concentrations of the model in relation with the Density and Viscosity are, respectively, 0.15 and 0.29 which can be considered as feeble. Subsequently, from a more objective point of view, one would suggest that more data could reduce even more the error and diminish even more the measurement or experimental bias and error for increasing the model reliability. Moreover, larger subtests may be obtained such as the evaluation set and test set, which are important for calculating the model hyperparameters. However, it is considered that taking into account the literature review of similar model formulations and the dataset size in all similar applications, it can be concluded that the present work is a substantial effort of making a Machine Learning application which provides a significant numerical tool to make the predictions in discussion leading to a quick estimation which of course can be tested with an experiment when needed and with these new experimental tests to improve the estimation through data enrichment.
Author Contributions
A.-A.S.: conceptualization, model construction, model assessment, text writing. L.P.: model construction. G.I.: analysis of the fuel samples. S.K.: conceptualization, data analysis, sample planning, text writing. All authors have read and agreed to the published version of the manuscript.
Funding
This research received no external funding.
Data Availability Statement
Data are available on reasonable request to the corresponding author via email.
Acknowledgments
The authors wish to acknowledge Panagiotis Kotsokolos and Manousos Kotsifis Motor Oil Hellas Refinery Chemical Laboratory for their support to complete the study.
Conflicts of Interest
The authors declare no conflicts of interest.
References
- Elsaed, E.; Linjama, M. Evaluating the performance of machine learning CFD-based and hybrid analytical models for transient flow prediction in temperature-compensated digital flow units. Flow Meas. Instrum. 2024, 95, 102511. [Google Scholar] [CrossRef]
- Savvides, A.-A.; Papadopoulos, L. A Neural Network Model for Estimation of Failure Stresses and Strains in Cohesive Soils. Geotechnics 2022, 2, 1084–1108. [Google Scholar] [CrossRef]
- Wei, J.; Chammam, A.; Feng, J.; Alshammari, A.; Tehranian, K.; Innab, N.; Deebani, W.; Shutaywi, M. Power system monitoring for electrical disturbances in wide network using machine learning. Sustain. Comput. Inform. Syst. 2024, 42, 100959. [Google Scholar] [CrossRef]
- Thebelt, A.; Wiebe, J.; Kronqvist, J.; Tsay, C.; Misener, R. Maximizing information from chemical engineering data sets: Applications to machine learning. Chem. Eng. Sci. 2022, 252, 117469. [Google Scholar] [CrossRef]
- Raissi, M.; Perdikaris, P.; Karniadakis, G.E. Physics-informed neural networks: A deep learning framework for solving forward and inverse problems involving nonlinear partial differential equations. J. Comput. Phys. 2019, 378, 686–707. [Google Scholar] [CrossRef]
- Bemani, A.; Madani, M.; Kazemi, A. Machine learning-based estimation of nano-lubricants viscosity in different operating conditions. Fuel 2023, 352, 129102. [Google Scholar] [CrossRef]
- Li, S.; Babin, A.; Shutin, D.; Kazakov, Y.; Liu, Y.; Chen, Z.; Savin, L. Active hybrid journal bearings with lubrication control: Towards machine learning. Tribol. Int. 2022, 175, 107805. [Google Scholar] [CrossRef]
- Yuksel, O.; Bayraktar, M.; Sokukcu, M. Comparative study of machine learning techniques to predict fuel consumption of a marine diesel engine. Ocean Eng. 2023, 286, 115505. [Google Scholar] [CrossRef]
- Xu, X.; Zhao, Z.; Xu, X.; Yang, J.; Chang, L.; Yan, X.; Wang, G. Machine learning-based wear fault diagnosis for marine diesel engine by fusing multiple data-driven models. Knowl.-Based Syst. 2019, 190, 105324. [Google Scholar] [CrossRef]
- Aakko-Saksa, P.T.; Lehtoranta, K.; Kuittinen, N.; Järvinen, A.; Jalkanen, J.-P.; Johnson, K.; Jung, H.; Ntziachristos, L.; Gagné, S.; Takahashi, C.; et al. Reduction in greenhouse gas and other emissions from ship engines: Current trends and future options. Prog. Energy Combust. Sci. 2023, 94, 101055. [Google Scholar] [CrossRef]
- The International Council on Combustion Engines. Guideline for the Operation of Marine Engines on Low Sulphur Distillate Diesel; CIMAC: Frankfurt, Germany, 2013. [Google Scholar]
- Lion, S.; Vlaskos, I.; Taccani, R. A review of emissions reduction technologies for low and medium speed marine Diesel engines and their potential for waste heat recovery. Energy Convers. Manag. 2020, 207, 112553. [Google Scholar] [CrossRef]
- ELOT CEN/TR 15367-1:2020; Petroleum Products—Guidelines for Good Housekeeping—Part 1: Automotive Diesel Fuels. European Committee for Standardization, CEN-CENELEC Management Centre: Brussels, Belgium, 2020.
- ELOT CEN/TR 15367-2:2007; Petroleum Products—Guidelines for Good Housekeeping—Part 2: Automotive Petrol Fuels. European Committee for Standardization, CEN-CENELEC Management Centre: Brussels, Belgium, 2007.
- ELOT CEN/TR 15367-3:2009; Petroleum Products—Guidelines for Good Housekeeping—Part 3: Prevention of Cross-Contamination. European Committee for Standardization, CEN-CENELEC Management Centre: Brussels, Belgium, 2009.
- ELOT ISO 8217:2017; Petroleum Products—Fuels (Class F)—Specifications of Marine Fuels. ISO: Geneva, Switzerland, 2017.
- ELOT EN ISO 3170:2004; Petroleum Liquids—Manual Sampling (ISO 3170:2004). CEN-CENELEC Management Centre: Brussels, Belgium, 2004.
- ELOT ISO 13739:2020; Petroleum Products Procedures for the Transfer of Bunkers to Vessels. International Organization for Standardization (ISO): Geneva, Switzerland, 2020.
- ELOT EN ISO 12185:1996; Crude Petroleum and Petroleum Products—Determination of Density—Oscillating U-Tube Method. European Committee for Standardization, CEN-CENELEC Management Centre: Brussels, Belgium, 1996.
- ASTM D7042-21; Standard Test Method for Dynamic Viscosity and Density of Liquids by Stabinger Viscometer (and the Calculation of Kinematic Viscosity). ASTM International: West Conshohocken, PA, USA, 2021.
- Kingma, D.P.; Ba, J. A method for stochastic optimization. arXiv 2015, arXiv:1412.6980. [Google Scholar]
- Fletcher, R. Practical Methods of Optimization; Wiley and Sons: Hoboken, NJ, USA, 1987. [Google Scholar]


Disclaimer/Publisher’s Note: The statements, opinions and data contained in all publications are solely those of the individual author(s) and contributor(s) and not of MDPI and/or the editor(s). MDPI and/or the editor(s) disclaim responsibility for any injury to people or property resulting from any ideas, methods, instructions or products referred to in the content. |
© 2024 by the authors. Licensee MDPI, Basel, Switzerland. This article is an open access article distributed under the terms and conditions of the Creative Commons Attribution (CC BY) license (https://creativecommons.org/licenses/by/4.0/).