Article

Effect of Sodium Alkane Sulfonate Addition on Tribological Properties of Emulsion for Cold Rolling Strips: Experimental and Simulation Investigations

School of Materials Science and Engineering, University of Science and Technology Beijing, Beijing 100083, China
*
Author to whom correspondence should be addressed.
Lubricants 2024, 12(4), 135; https://doi.org/10.3390/lubricants12040135
Submission received: 22 February 2024 / Revised: 7 April 2024 / Accepted: 13 April 2024 / Published: 17 April 2024

Abstract

:
Cold rolling emulsion contains a variety of functional additives, which often exhibit complex interactions with each other. Sodium alkane sulfonate (SAS) is a common corrosion inhibitor used in cold rolling emulsions for temporary rust prevention. In this study, it was found that SAS would deteriorate the tribological properties of the emulsion. Emulsions containing SAS and different friction modifiers were prepared. Tribology tests were carried out on a four-ball friction and wear tester. White light interferometer was used to investigate the 3D morphology of the friction surface and wear volume. Microscopic morphology of friction surfaces was observed using a scanning electron microscope (SEM). The chemical activity and electrostatic potential of the molecules were calculated based on density functional theory (DFT). The adsorption energies of additives on metal surfaces were calculated via molecular dynamics (MD) simulation. The results indicate that the strong electrostatic force gives SAS an advantage in competitive adsorption with ester friction modifiers due to the positive charge on the metal surface. This results in the friction modifier not functioning properly and the tribological properties of the emulsion being significantly reduced.

1. Introduction

Tribology research has developed rapidly in recent years, and the scope of tribology is expanding [1]. Tribology research methods have gone through the stages of empirical science based on phenomena, theoretical science based on models, and computational science based on simulations [2]. Aymard et al. [3] proposed a surface design strategy to prepare dry rough interfaces and circumvent the multiscale challenge of tribology. Yang et al. [4] investigated the mechanism of amorphous wrapped nanolamellar heterostructure in the frictional self-lubricating behavior of pearlitic steel through experiments and molecular dynamics (MD) simulations. Guo et al. [5] optimized the V-shape textured bearings through the linear weighting summation method to improve the overall performance under fluid lubrication.
Cold rolling is one of the most important methods in metal forming. The strip cold rolling process is in a boundary lubrication state [6]. Good lubrication is required to reduce deformation resistance and provide cooling. Emulsion is a thermodynamically unbalanced system of oil and water mixed, which is widely used in rolling lubrication [7]. During the rolling process, water evaporates and cools, and the oil phase forms an oil film to provide lubrication. After the rolling is complete, the oil film on the surface is required to prevent rust until the strip enters the next processing step. In order to meet a variety of functional requirements, in addition to the base oil and emulsifier, the emulsion also contains extreme pressure agents, corrosion inhibitors, friction modifiers, pH regulators, antioxidants, bactericides, defoaming agents, etc. [8,9,10]. Among these additives, friction modifiers, corrosion inhibitors, and extreme pressure agents work directly on the metal surface. The extreme pressure agent chemically prevents surface welding in localized areas of intense friction. Friction modifiers and corrosion inhibitors are adsorbed on the surface to form a molecular film to reduce friction or prevent rust.
In order to make the lubrication system efficient, it is necessary to understand the action of additive molecules on surfaces. However, experimental methods have shown limitations in terms of adsorption mechanisms. Surface characterization can only analyze the substances present on the metal surface but cannot measure the adsorption strength. In addition, experimental methods are difficult to accurately control various factors and consume a lot of time and money. Quantum chemistry has made important contributions to the study of the electronic structure and chemical reactivity of organic molecules [11]. Tan et al. [12] used molecular orbital indexes as the criteria to study the interaction between lubricant polar end groups and metal surfaces. The results show that the interaction between esters and metal surfaces is significantly stronger than that of alcohols. For models with large numbers of atoms, quantum chemistry calculation takes a long time. MD simulations play a key role in describing the interactions of organic molecules with other molecules or surfaces, making up for the shortcomings of quantum chemistry. Si et al. [13] combined the advantages of quantum mechanics, MD simulations, and dissipative particle dynamics to study the molecular self-assembling structure and formation mechanism. The results show that the main driving force of the self-assembly of sodium stearate molecules in oil is electrostatic force. Shi et al. [14] used MD simulations to investigate the physisorption of friction modifiers. The results indicate that molecules form dense, tendentiously vertical monolayer films at low temperatures, but loose adsorption layers at high temperatures, particularly for molecules with weak polarity.
In recent years, numerous studies have been conducted on the influence of the structure of molecules on corrosion inhibition and tribological properties [15,16,17,18,19]. According to Verma, the length between C8 and C12 is projected to have the most anticorrosive properties for biosurfactants [20]. Some functional groups used in corrosion mitigation include –O–, glycidyl, –CONH2, –COOR, –SO3H, –COOH, –NH2, –NR3/–NHR2/–NH2R/–NH3, –OH, –CH2OH [21]. In Yu’s study, nine organic compounds were utilized as model lubricants to investigate the impact of functional groups on tribological performances. The lubricant with a low friction coefficient corresponded to high adsorption energy. The lubricant molecules in the adsorption film with higher surface energy are more likely to conduct chemical reaction in the friction process and form protective films, which lead to low wear rate [22]. A number of researchers have reported that the longer the molecular chain, the thicker the adsorption film and the better the lubrication effect [23,24]. Hirayama et al. [25] showed that more adsorbed additive layers contributed to a reduction in the coefficient of friction. In addition, the surface charge has a great influence on the adsorption of molecules [26,27,28,29]. Anionic surfactants are highly soluble in water, enabling them to interact effectively with positively charged surfaces [30]. Gao et al. applied a specific negative potential in cationic surfactant solution, and an extremely low friction state was observed on the gold surface [31].
Sodium alkane sulfonate (SAS) is a type of anionic surfactant composed of an alkyl chain and a sulfonic group. It has anti-rush [20,30], emulsification [32], and certain lubrication effects [29,33]. SAS is a classic corrosion inhibitor widely used in the industry for temporary rust prevention [34]. SAS molecules adsorb onto the metal surface, providing a barrier that keeps corrosive chemicals, like water and oxygen, from contacting the metal. The adsorption process is influenced by the nature and the surface charge of the metal, the chemical structure of the surfactant, and the nature of the electrolyte [35]. Zhu et al. showed that the monolayer is effective with respect to corrosion inhibition, and the formation of bilayers/multilayers/semi-micelles does not contribute considerably to more corrosion inhibition [36]. Some studies have shown that SAS can affect tribological properties by applying an external electric field [29,33]. However, the interaction between SAS and polar additives is rarely studied.
In this work, it was found through tribological tests that SAS inhibited the effect of several ester friction modifiers in emulsions. In order to analyze the mechanism, the chemical activity, active sites, and the charge distribution of molecules were calculated based on DFT. The effects of the interaction between the same molecules, surface charges, and competitive adsorption on the adsorption energy and adsorption film structure were investigated by MD simulation.

2. Materials and Methods

2.1. Preparation of Emulsions

The organic friction modifiers are pentaerythritol tetraoleate (PETO), butyl stearate (BST) and trimethylolpropane trioleate (TMPTO), provided by Shanghai Macklin Biochemical Technology Co., Ltd., Shanghai, China. SAS used as a corrosion inhibitor is a mixture containing C14–C18, provided by Jinan Jinhui Chemical Co., Ltd., Jinan, China. Sodium 1-hexadecanesulfonate was used to represent SAS in molecular simulations. The molecular structures of the above additives are shown in Figure 1. The nonionic surfactants Sorbitan mono-fatty acid ester (Span80) and polyoxyethylene Sorbitan mono-fatty acid ester (Tween80) as emulsifiers were provided by Beijing Jukeyuan Technology Co., Ltd., Beijing, China. The dibutyl phosphite used as an extreme pressure agent was provided by Zibo Huihua Chemical Co., Ltd., Zibo, China. The base oil is palm oil with a freezing point of 24 °C, provided by Jiangsu Hengfeng New Materials Manufacturing Co., Ltd., Jingjiang, China. The components of the oil phase in the emulsion are shown in Table 1. The functional additives in the emulsion that directly act on the metal surface mainly include friction modifiers, corrosion inhibitors, and extreme pressure agents.
The additives were added to the base oil and stirred continuously at 50 °C until the additives were dissolved. The oil phase was added to deionized water at room temperature while stirring at 800 rpm for 20 min. The concentration of the O/W emulsion was 4 wt.%. Basic emulsions without friction modifiers and SAS, emulsions with friction modifiers but without SAS, and emulsions with friction modifiers and SAS were prepared separately using the above method. The removed components were replaced with base oil, and the contents of other components remained unchanged, as shown in Table 1.

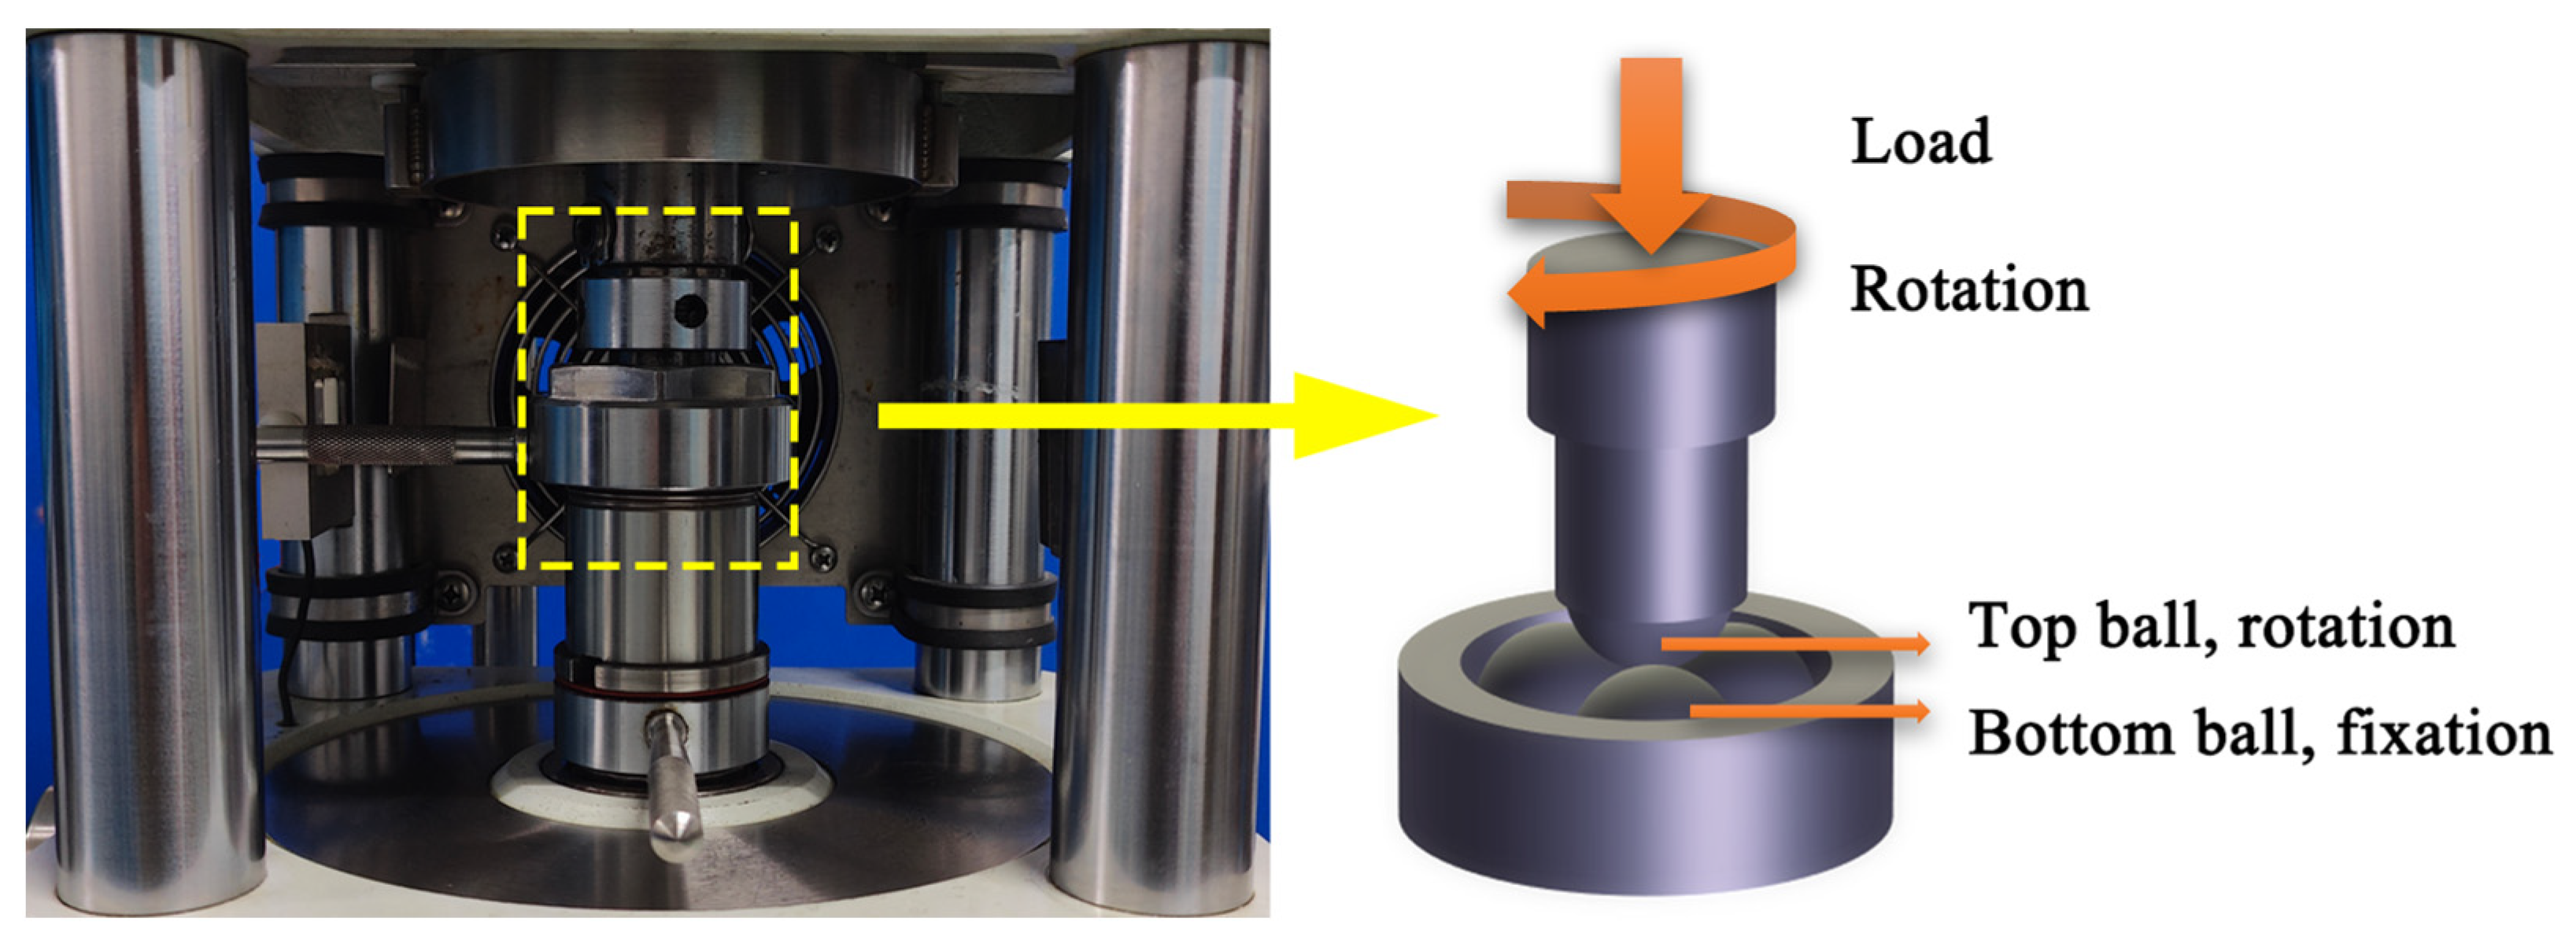
2.2. Tribology Tests and Characterizations

The tribological properties of emulsions were characterized by a four-ball friction and wear tester (MRS-10A, Xiamen Tenkey Automation Co., Ltd., Xiamen, China), and the schematic diagram is shown in Figure 2. The top ball was rotated, and the bottom balls were fixed. The bottom balls were completely submerged in the emulsion. The balls were made of AISI 52,100 bearing steel. The parameters of the tribology tests were set according to ASTM D4172-21 [37]. The initial temperature was lowered to match the application condition. The tribology tests were carried out under 392 N, 1200 rpm, and 25 °C for 30 min. Before the tribology tests, the steel balls were cleaned with ethanol and petroleum ether under ultrasonication. Each test must be repeated three times to ensure the reliability of the experiment.
The COF during the friction process was recorded. After the friction experiment was completed, the 3D morphology of the friction surface, wear volume, and roughness in the vertical friction direction were analyzed using the white light interferometer (DCM8, Leica Microsystems, Wetzlar, Germany). Microscopic morphology of friction surfaces was observed using a scanning electron microscope (SEM, ZEISS Sigma 500, Oberkochen, Germany).

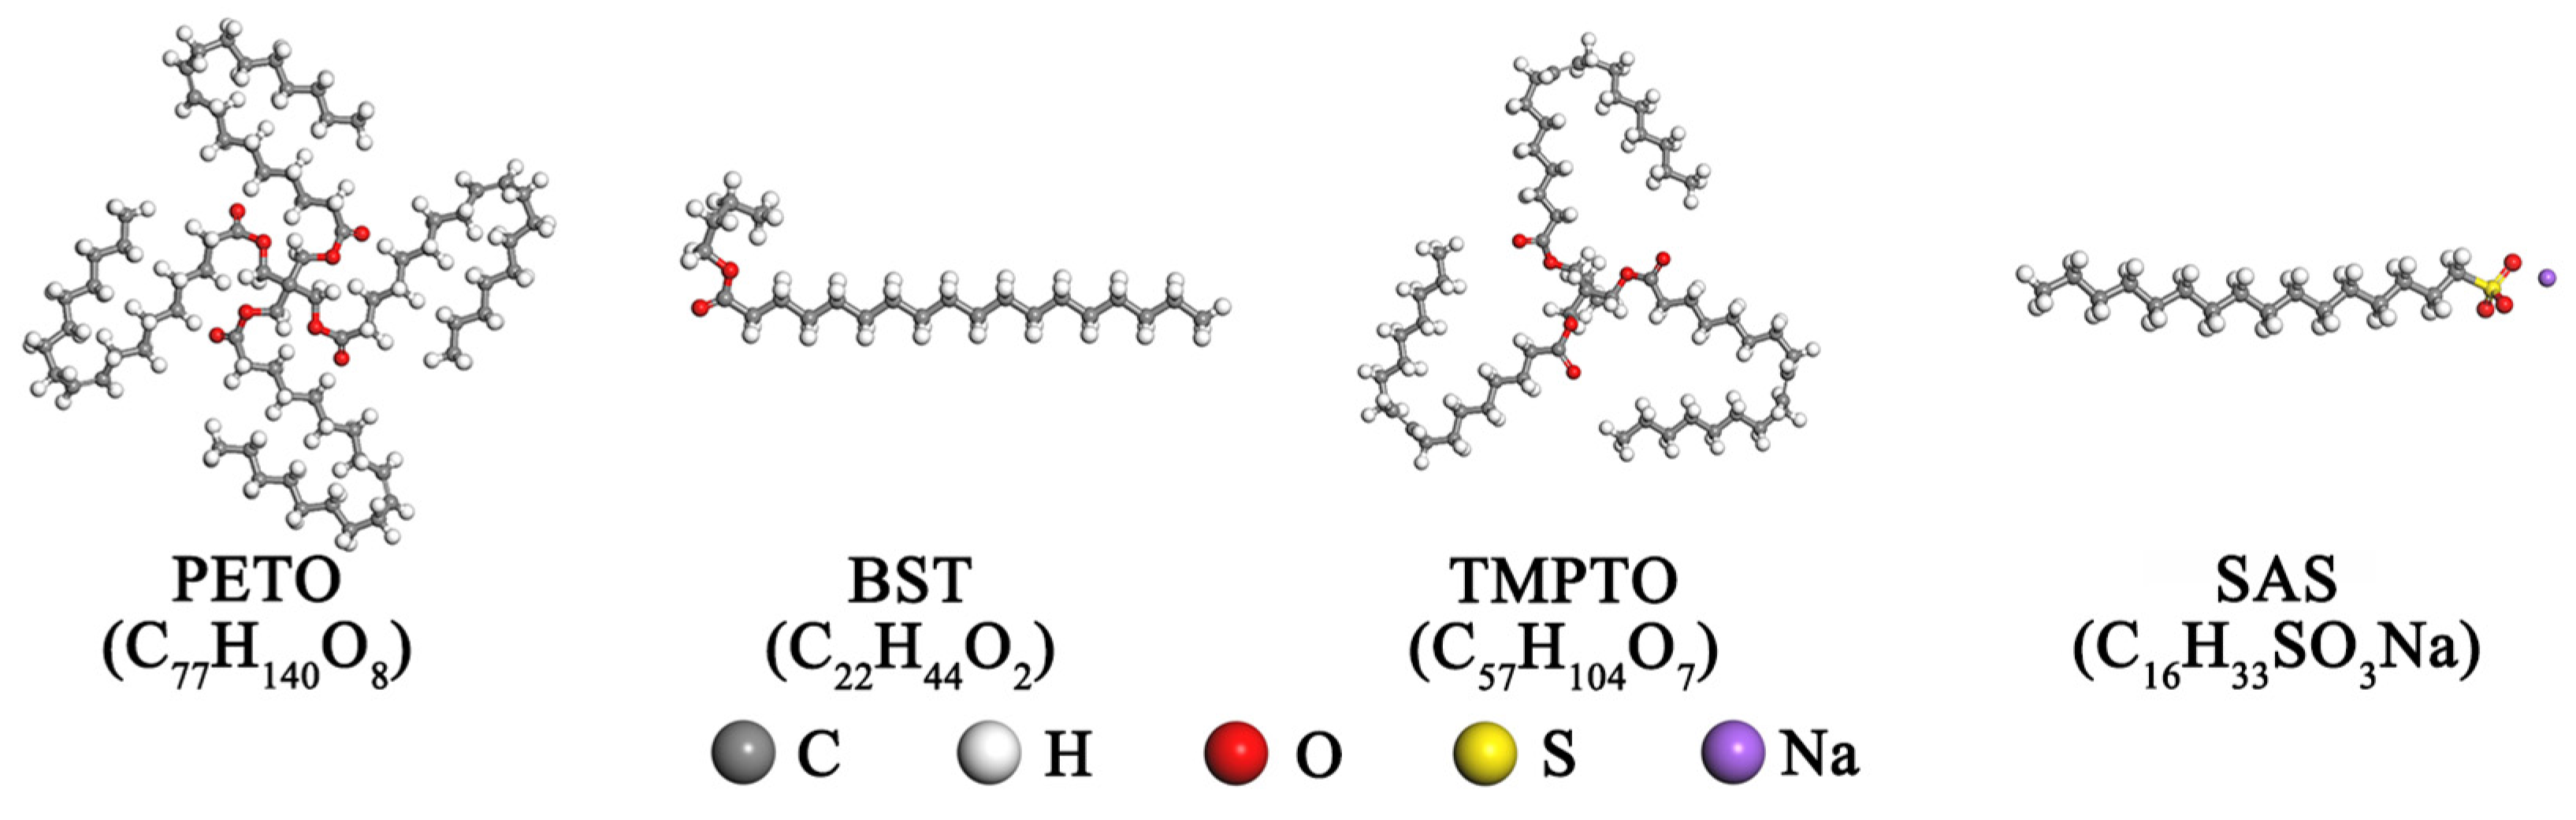
2.3. Quantum Chemical Calculations

The frontier molecular orbital, electron density, and electrostatic potentials of PETO, BST, and SAS were calculated based on DFT. The B3LYP hybrid functional was used to calculate properties, and the Grimme method was used for dispersion corrections. An all-electron relativistic method was used to deal with core electrons. The conductor-like screening model (COSMO) was employed for performing solvation effects in the calculations, and water worked as the solvent.
According to Koopmans’ theory, quantum chemical parameters were calculated using the following formulas:
Δ E = E LUMO E HOMO
I = E HOMO
A = E LUMO
X = 1 2 I + A
η = 1 2 I A
σ = 1 η
ω = X 2 2 η
where ΔE is the energy gap, EHOMO is the highest occupied molecular orbital energy, ELUMO is the lowest unoccupied molecular orbital energy, I is the ionization potential, A is the electronic affinity, χ is the electronegativity, η is the chemical hardness, σ is the chemical softness, and ω is the electrophilicity index.
The Fukui functions were calculated to analyze the local activity of molecules. Atoms with high electrophilic index (ƒk) are more susceptible to electrophilic attack. Atoms with high nucleophilic index (ƒk+) are more susceptible to nucleophilic attack. The electrostatic potential and electron density of PETO, BST, TMPTO and SAS molecules were calculated to analyze the polarity.

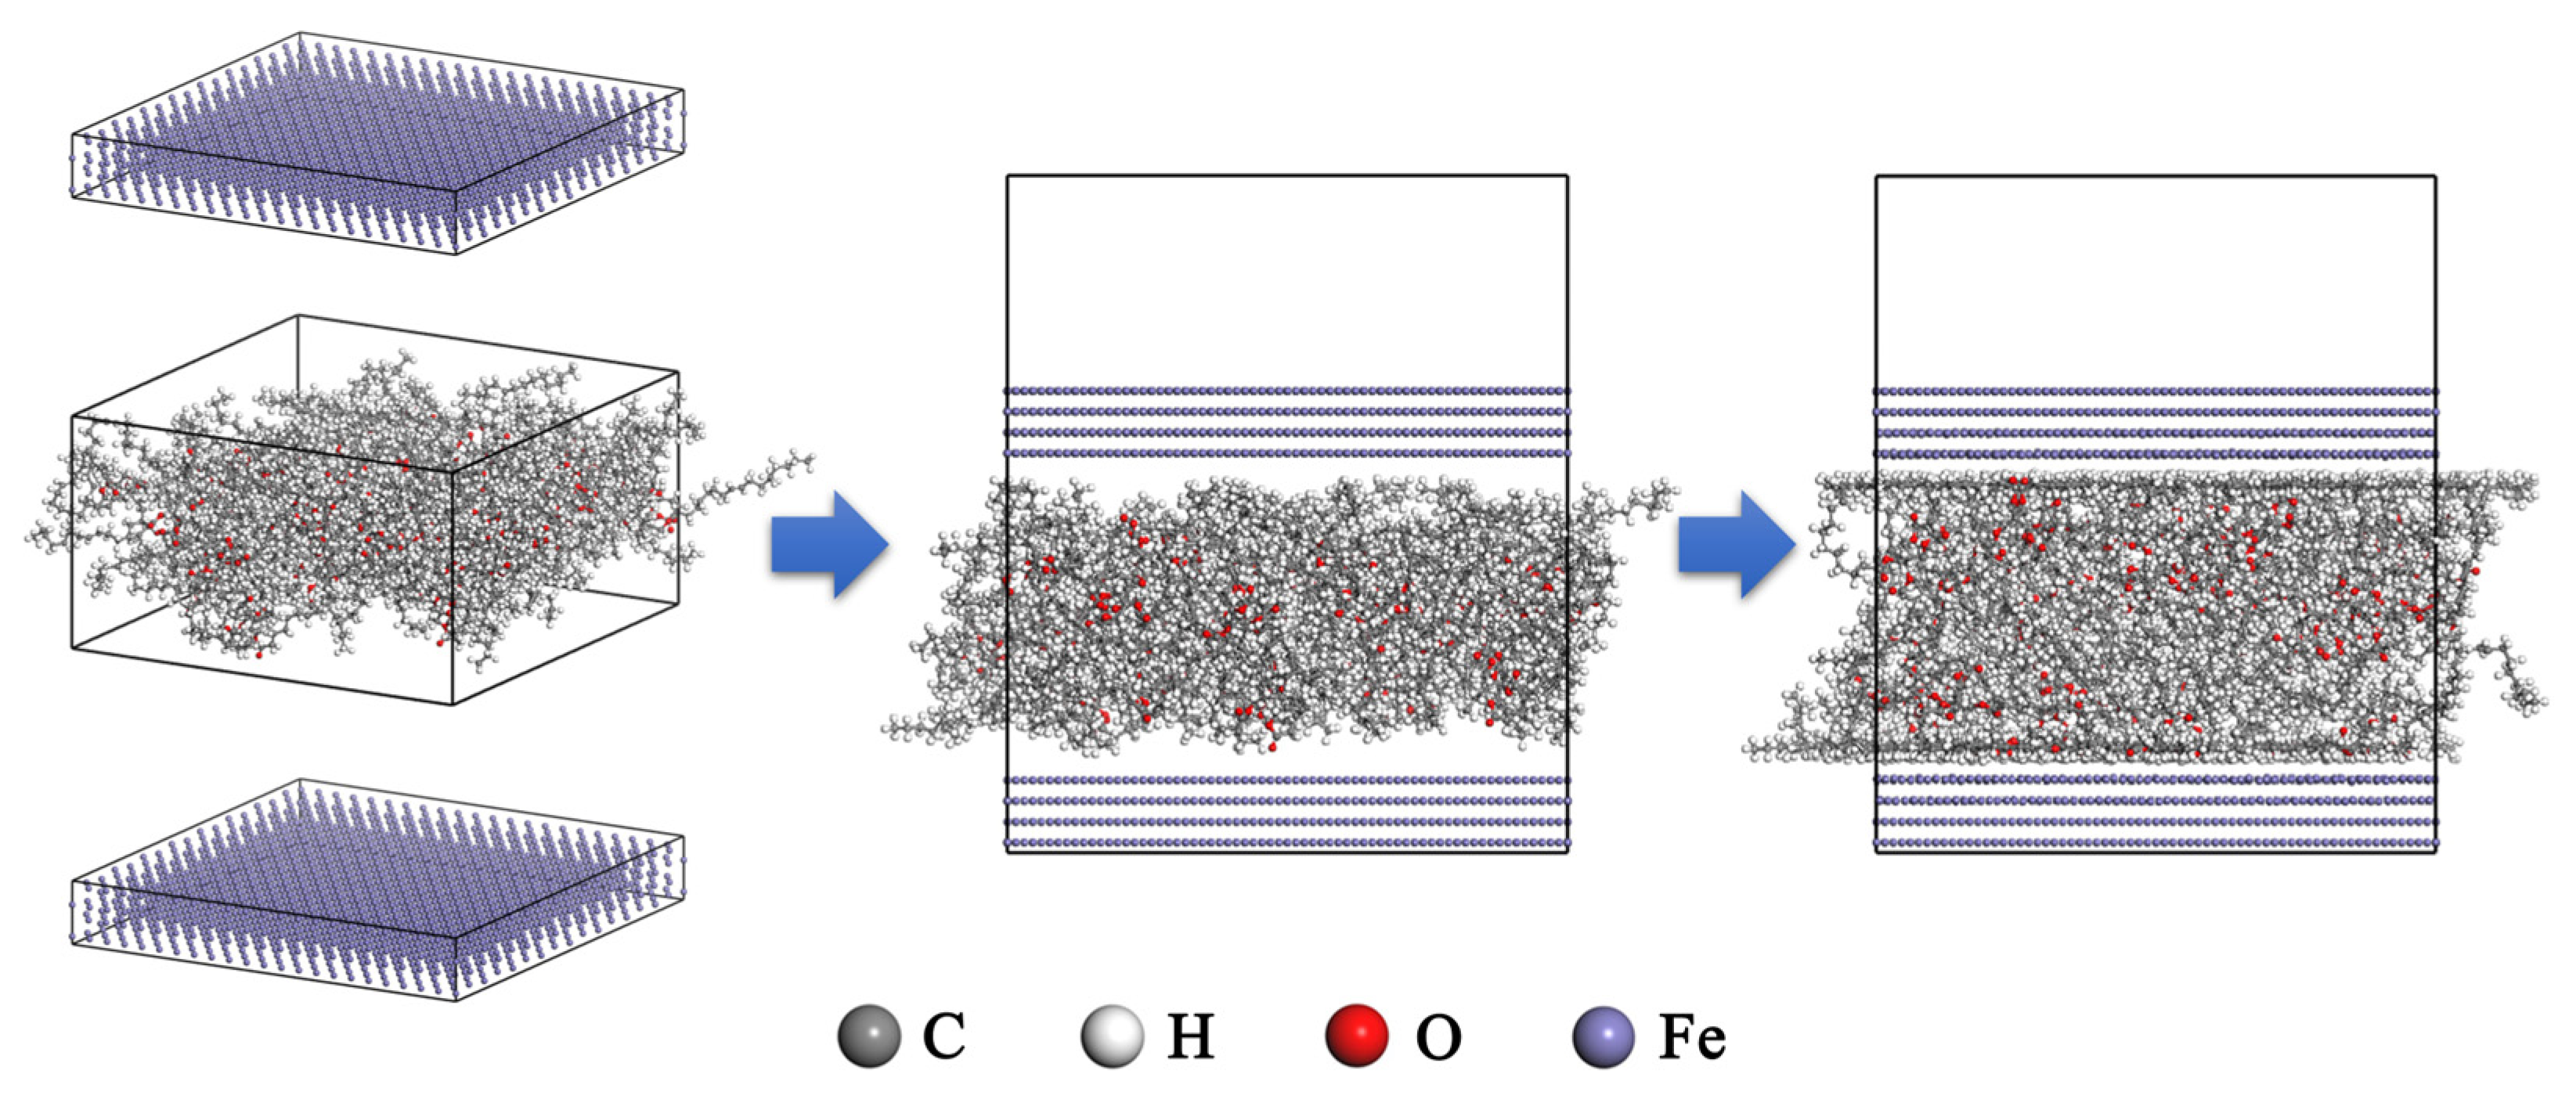
2.4. Molecular Dynamics Simulation

The proportion of new surfaces is very high in the cold rolling process with large deformation. Therefore, Fe(110) was used in the models to represent the surface of the steel. The adsorption energy of PETO, BST, TMPTO, and SAS on Fe(110) were calculated using MD simulation. The MD simulation consists of three steps: modeling, sufficient relaxation of the molecular system, and dynamic calculation.
Before modeling, it is necessary to calculate the density of the additives at 298 K and 1 atmosphere pressure. Fifty molecules were placed into a cube model with an initial density of 1 g/cm3. The model has been subjected to geometry optimization and the dynamic calculation for 50 ps in the NVT ensemble. Then, dynamic calculation was performed for 500 ps in the NPT ensemble. The density data for the last 100 ps of dynamic calculation were extracted and averaged to obtain the density. The reasonableness of the parameter settings can be verified by comparing the calculated and experimental values of the density.
Figure 3 shows the process of MD simulation. The modeling of additive adsorption on iron surfaces has four components. The upper and lower layers were 54.48 Å × 66.05 Å × 8.09 Å Fe(110) layers. The middle layer was a 54.48 Å × 66.05 Å × 29.87 Å molecular model. The density of additive molecules was derived from calculated values. And a 20 Å vacuum layer was added above the upper Fe layer.
After the initial constructure of the model, the energy of the system was too high. A series of optimizations were needed to make the system stable. All iron atoms were fixed during the relaxation stage. Geometry optimization, quench dynamics, and anneal dynamics were used to relax the system. First, the model was geometrically optimized. Afterward, the model was subjected to quench dynamics for 100 ps, and the structure with the lowest energy was extracted from frames. Then, the configuration was annealed in the NVT ensemble for five cycles (300–800 K), totaling 500 ps. Afterward, the models were relaxed adequately for 1000 ps to reach the equilibrium state under the NVT ensemble. The two layers of atoms on the iron surface were unfixed in the dynamic calculation. The COMPASS III force field was used to conduct the simulation calculation. The dynamic calculation was performed at 298 K. The Nose–Hoover thermostat was used to control temperature. The Ewald summation method was used to calculate electrostatic interactions.
In order to study the effect of the interaction between molecules on the adsorption energy, models containing a single additive molecule were built to compare with the multi-molecule models. The surface of iron was positively charged in emulsions. In order to study the effect of surface charge on the adsorption energy, ten positive charges were added to each of the two surfaces to compare with the uncharged surfaces. In order to investigate the competitive adsorption of SAS with the ester friction modifier molecules, hybrid models of friction modifier molecules with SAS molecules were built. Finally, the adsorption energy (Eads) of equilibrium state was calculated using the following equation:
Eads = Ecom − (Eadd + Esur)
where Eadd and Esur are the energy of the additives and Fe layers alone, respectively, and Ecom is the energy of the whole composition.

3. Results and Discussion

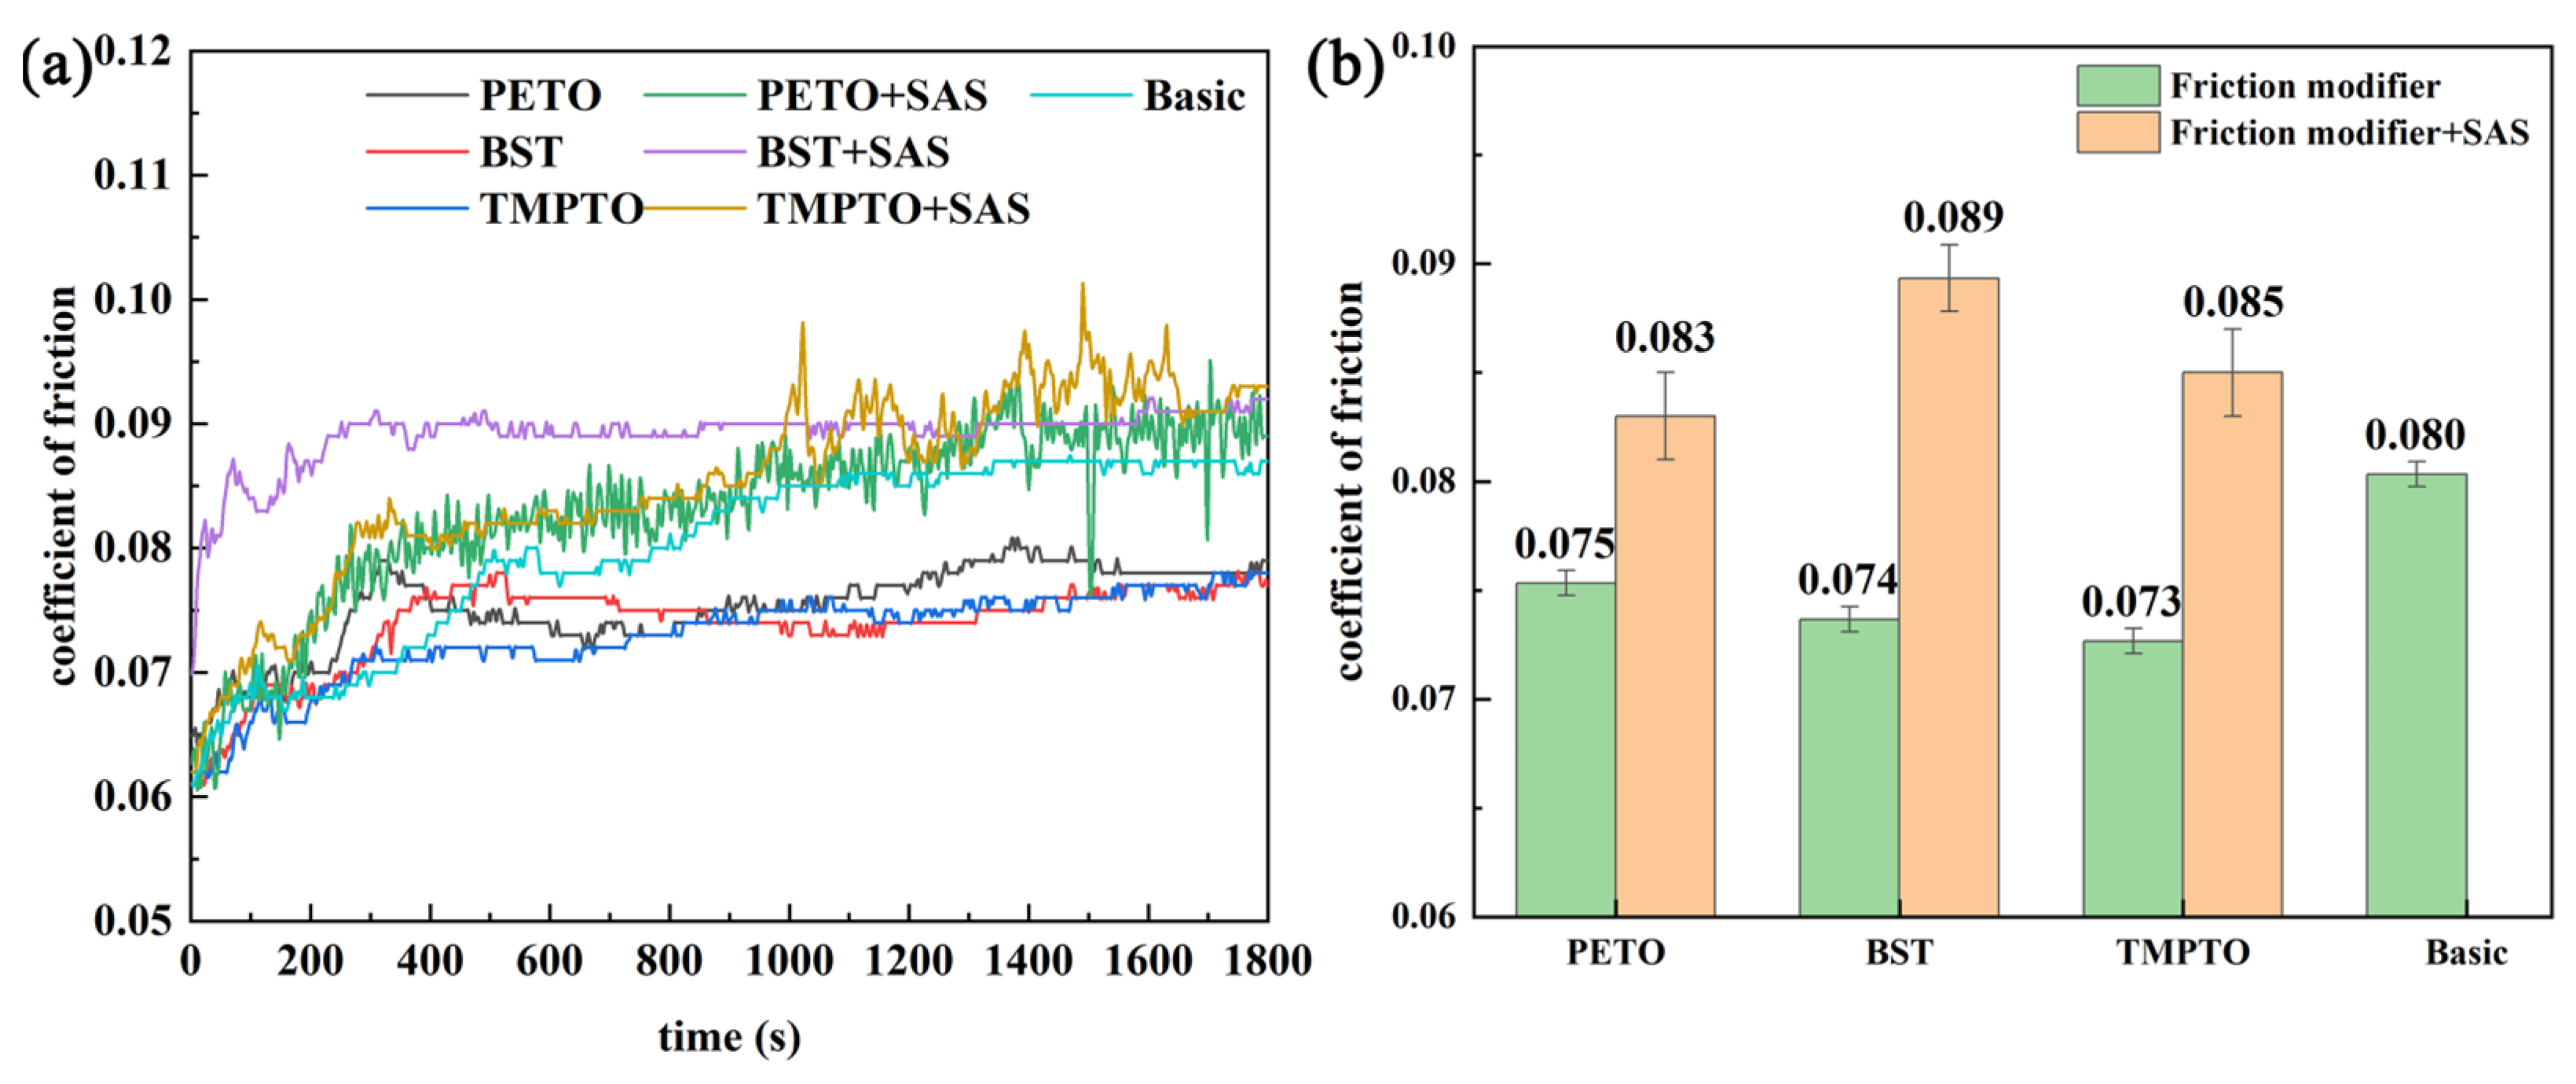
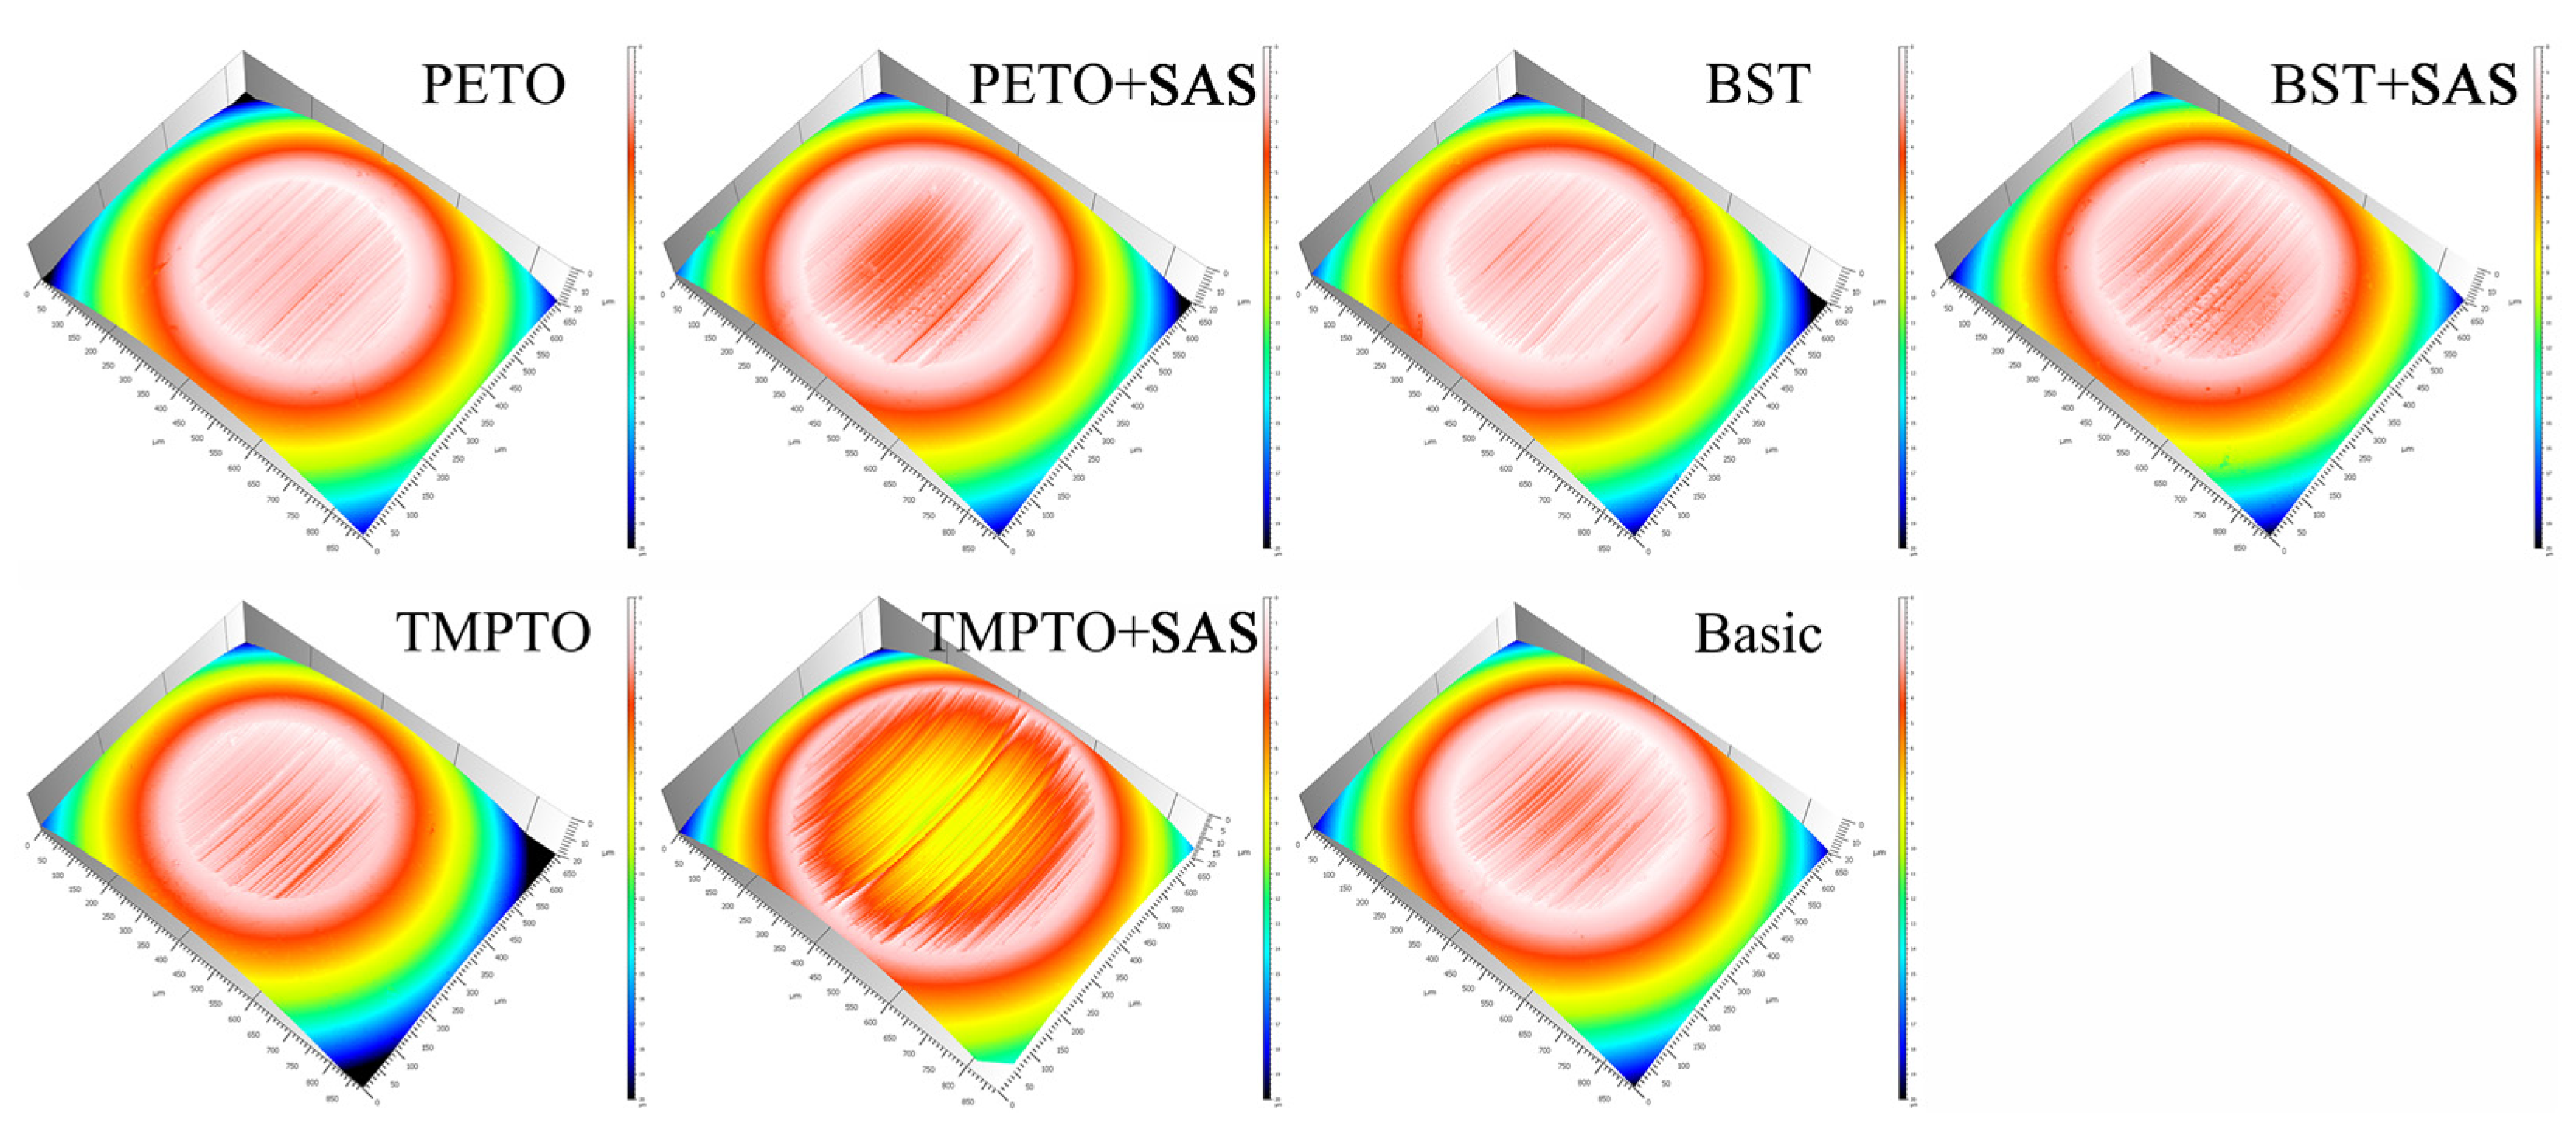
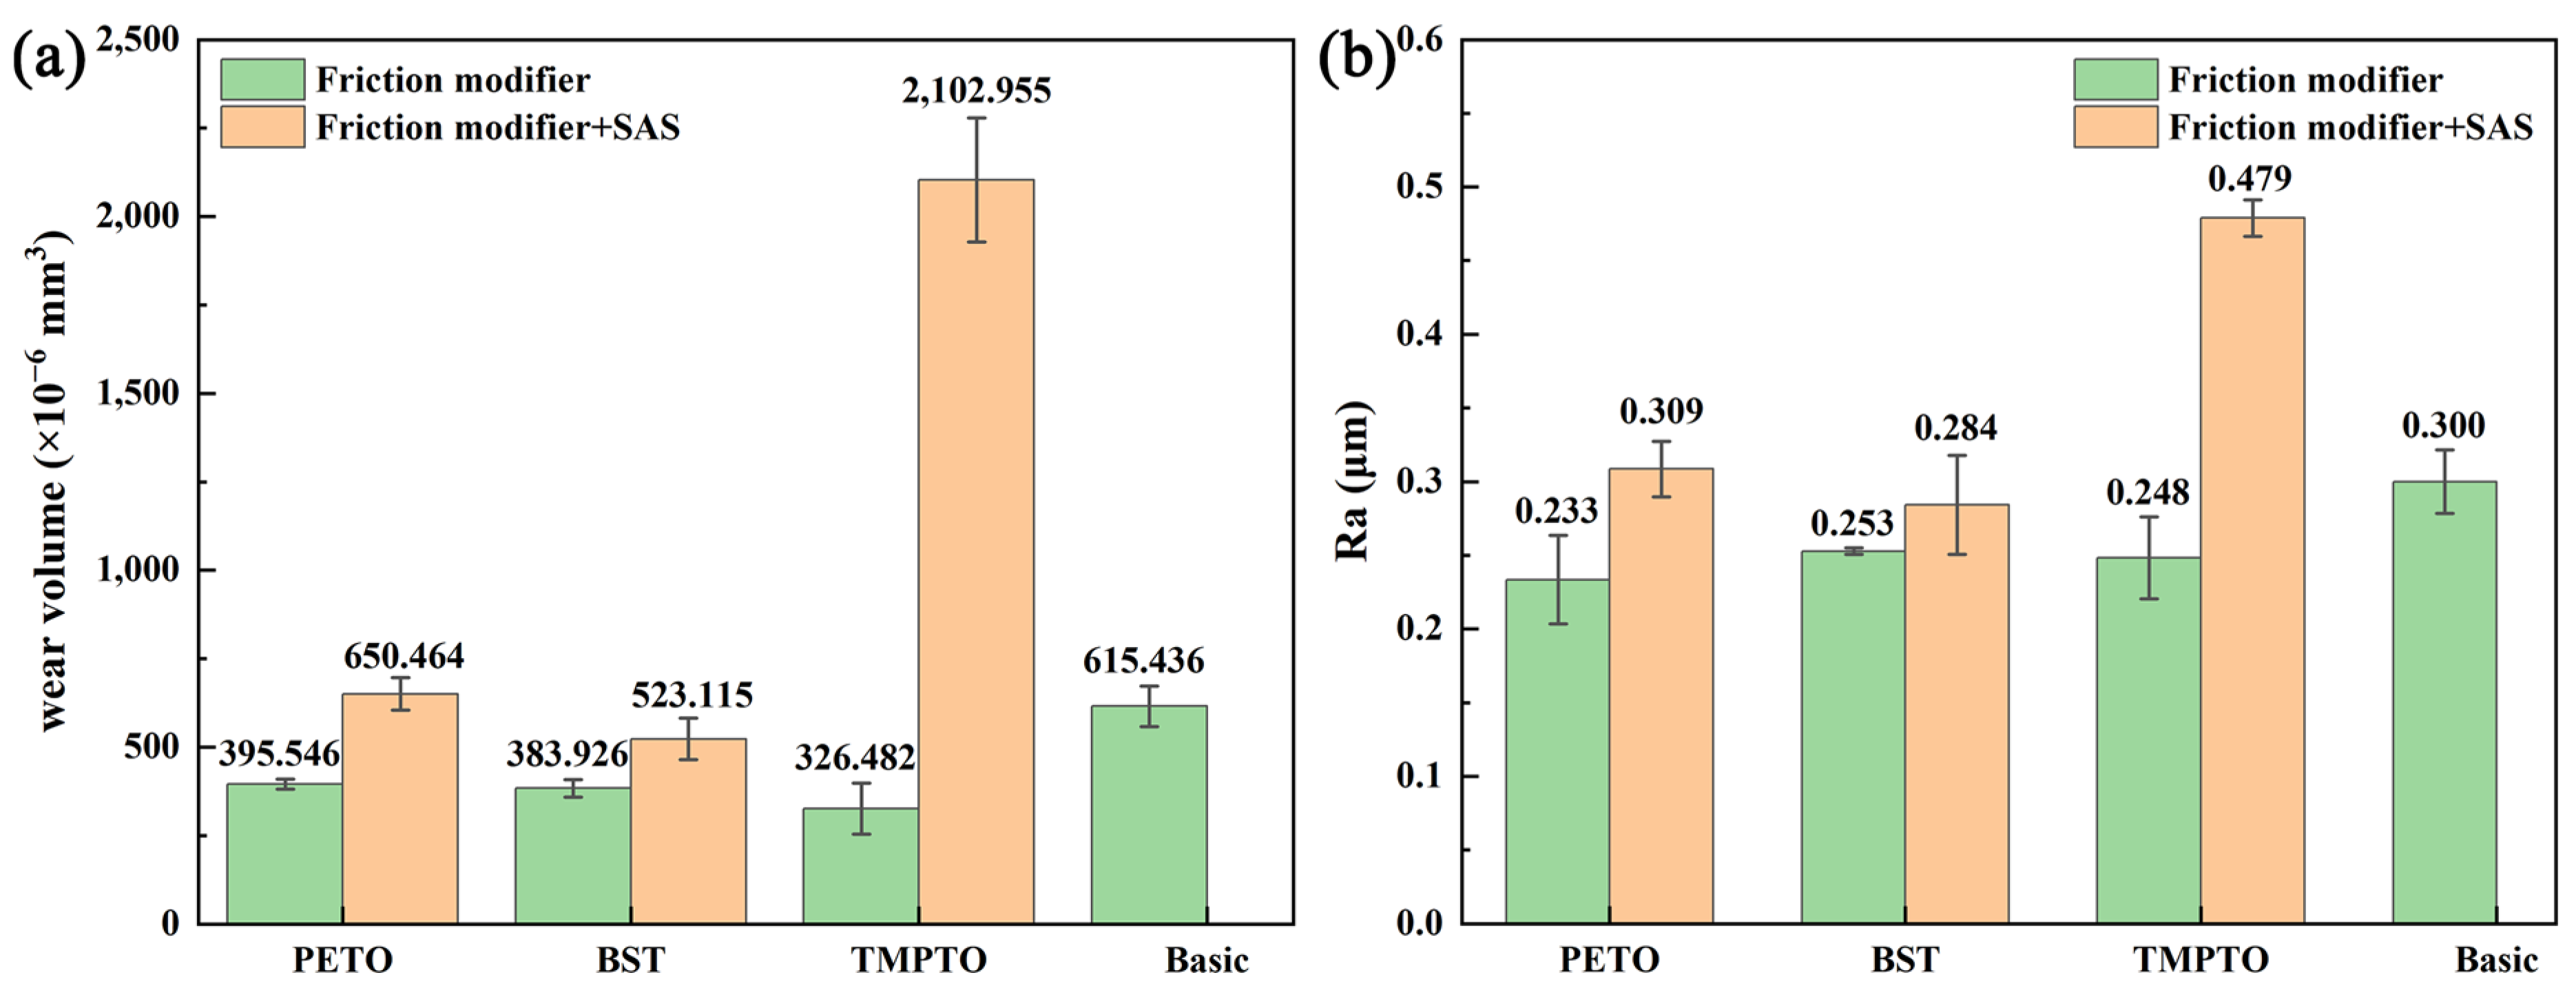
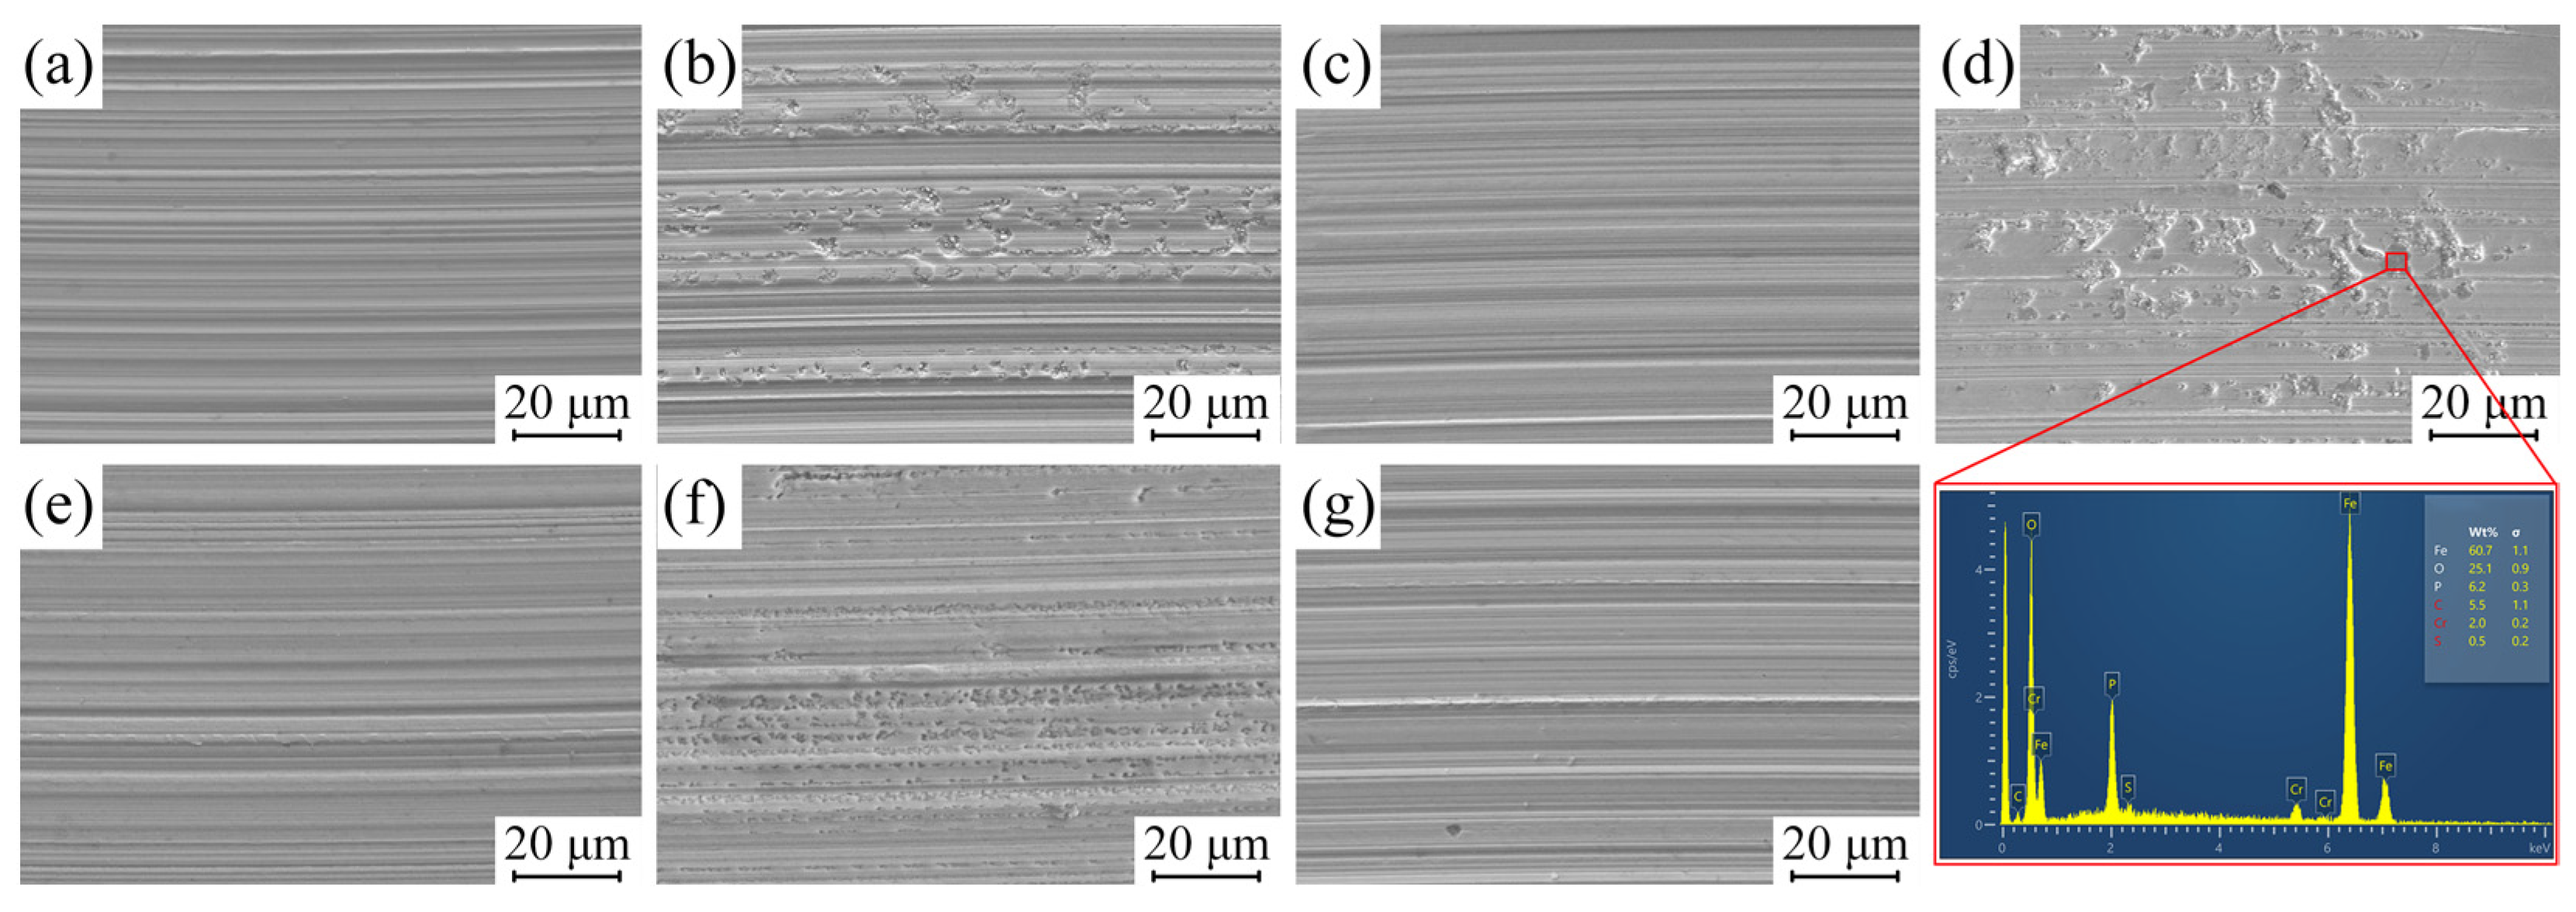
3.1. Tribological Properties

The coefficient of friction (COF) can reflect the friction-reducing ability of the emulsion. The COF for each emulsion is shown in Figure 4. The average COF of the basic emulsion is 0.080. The addition of friction modifiers can reduce the COF to about 0.074. The COF of emulsions containing three friction modifiers are close to each other. However, the addition of SAS caused the COF of the emulsion to increase to varying degrees. The curves of emulsions containing PETO+SAS and TMPTO+SAS become more volatile. The emulsion containing BST+SAS has a smooth curve but a higher COF value. The instability of the COF curve indicated the unstable lubrication state. The reason for this phenomenon may be related to the adsorption structure of molecules on the surface, which will be further analyzed in the simulation part.
The wear volume and 3D morphology can reflect the anti-wear performance of emulsions. Figure 5 shows the 3D topography of balls after the tribological tests using different lubricants. Figure 6a shows the wear volume of balls. The wear volume was calculated based on the 3D topography using Lexical Map 8.0 software, and the influence from the curvature of the sphere was taken into account. Figure 6b shows the roughness in the vertical friction direction. Compared with the basic emulsion, all three friction modifiers reduced the wear volume and improved the roughness of the friction surface. However, the wear volume of the emulsion increased significantly after the addition of SAS, and the surface quality of the friction surfaced deteriorated. Compared with the emulsion containing TMPTO, the wear volume of the emulsion containing TMPTO+SAS increased by about 544%, and the Ra increased by about 93%.
The SEM micrographs of the wear scar are shown in Figure 7. No significant defects were found on the surface lubricated by emulsions containing friction modifier, and the wear marks were smooth. There are some iron particles on the surface lubricated by basic emulsion, and the wear marks are deep. The addition of SAS caused many pits on the surface, and there were some iron particles in the pits. Phosphorus elements were detected in some locations around the pits (Figure 7d). Among the components of the emulsion used, only the extreme pressure agent contains the phosphorus element. This shows that serious friction has occurred in this area, and the extreme pressure agent has undergone the friction chemical reaction to prevent surface welding.
The results of the friction experiments show that friction modifiers can effectively improve the tribological properties of emulsions. However, the addition of SAS caused the increase in the COF, wear volume, roughness, and surface defect, even more than that of the basic emulsion. In order to analyze the mechanism of SAS affecting the tribological properties of emulsion, molecular simulations were performed on PETO, BST, TMPTO, and SAS molecules.

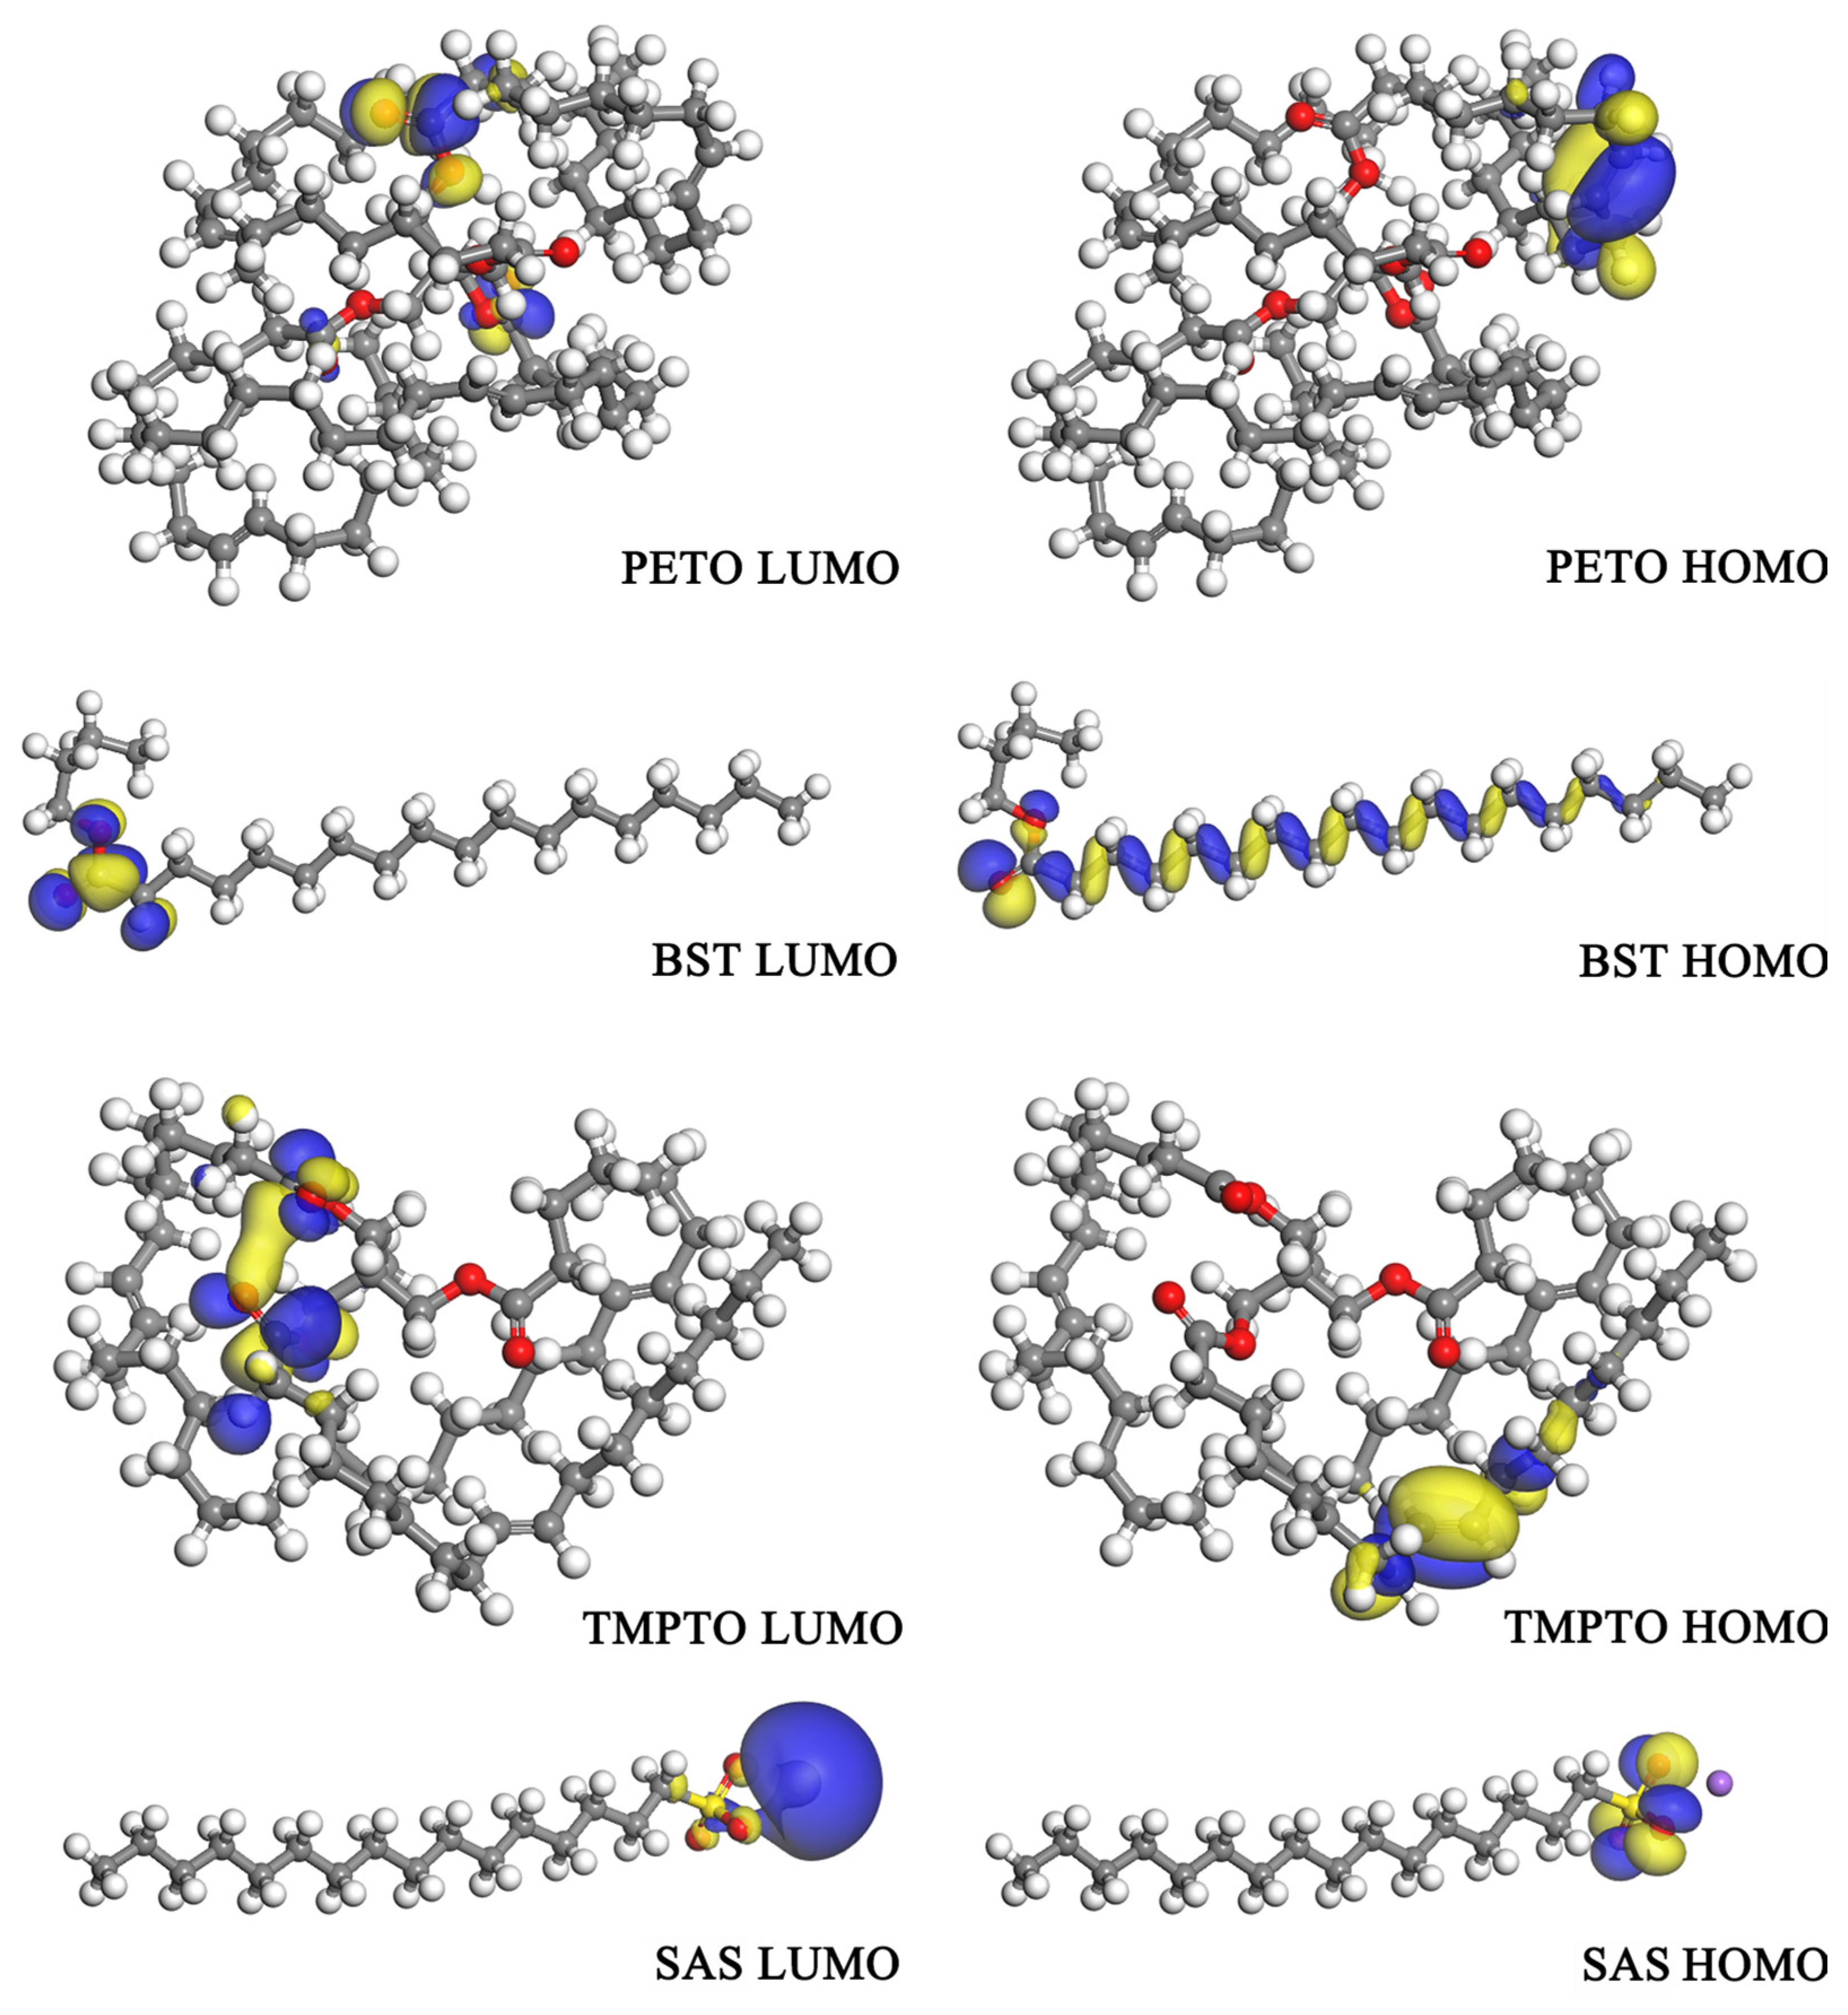
3.2. Chemical Activity and Electrostatic Potential

Molecular reactivity is closely related to its frontier molecular orbital. The highest occupied molecular orbital (HOMO) and lowest unoccupied molecular orbital (LUMO) play an important role in determining the most reactive regions in the molecule [38]. Figure 8 shows the HOMO and LUMO distributions of PETO, BST, TMPTO, and SAS molecules. The HOMO of PETO and TMPTO is distributed on the C=C bonds. BST does not have C=C bonds, and its HOMO is widely distributed on the ester group and carbon chain. The LUMO of PETO, BST, and TMPTO is distributed on the ester group. The HOMO of SAS is distributed on the sulfonate group, and the LUMO of SAS is on Na+. These C=C bonds, ester groups, and sulfonate groups are all expected to be involved in donor-acceptor interactions with the metal surface due to their high-dispersed density [39].
The quantum chemical parameters of PETO, BST, TMPTO, and SAS are shown in Table 2. EHOMO and ELUMO provided important information for evaluating the adsorption reactivity of organic molecules. The higher the EHOMO, the stronger the ability to donate electrons. The lower the ELUMO, the stronger the ability to accept electrons. In addition, lower values of ΔE, η and higher values of σ, ω tend to imply greater chemical activity of the molecule. Therefore, PETO and TMPTO molecules are more reactive. The chemical properties of the SAS molecule are relatively stable. Generally, additive molecules with greater chemical activity have better corresponding properties in metalworking fluids.
The Fukui functions of PETO, BST, TMPTO, and SAS molecules were calculated. It was found that the local active sites of the molecule have the same distribution as HOMO and LUMO. Table 3 shows the Fukui functions of these active groups. In the PETO, the atoms in the C64=O67 and C176=O179 bonds in the PETO molecule have large values of ƒk+. These atoms belong to the ester group. The atoms in the C195=C196 bond have a large value of ƒk. This suggests that the atoms in the C=C bonds contribute more to the electron donor, while the atoms in the C=O bond are mainly responsible for accepting electrons. There are no C=C bonds in the BST molecule. The carbon atoms in the C=O bond of BST have a larger value of ƒk+. The oxygen atom in the C=O bond of BST has both a large value of ƒk+ and ƒk. It indicates that this oxygen atom is susceptible to both electrophilic and nucleophilic attacks. The results of TMPTO are close to PETO. Atoms in C109=O125 and C3=C19 bonds have large values of ƒk+, and atoms in C158=C117 bonds have large values of ƒk. It means that the ester groups are more susceptible to nucleophilic attack and the C=C bonds are more susceptible to electrophilic attack. The oxygen atoms in the sulfonic group of SAS are susceptible to electrophilic attack. The ƒk+ value for sodium ion is as high as 0.0973. The active sites and reaction tendency of the molecule were further elucidated by analyzing the Fukui functions.
Figure 9 shows the mapping of the electrostatic potential of the molecules on the electron density surface. The more heavily colored region represents a higher density of electrons. Red areas indicate positively charged areas and blue areas represent negatively charged areas. In PETO, BST, and TMPTO molecules, negative charges are mainly concentrated on the oxygen atoms of the ester group, and the distribution of positive charges is dispersed. In the SAS molecule, the positive charge is distributed on Na+, which is the same as the distribution position of LUMO, and the negative charges are concentrated on the sulfonate group.
SAS is an ionic surfactant. In the emulsion, sodium ions are distributed in the water phase, and the rest are distributed at the oil–water interface. The metal surface in the emulsion is positively charged. Therefore, the metal surfaces may have electrostatic interactions with the sulfonate groups. The adsorption energy of PETO, BST, TMPTO, and SAS was calculated by MD simulation. Moreover, the effect of surface charge on adsorption energy was also studied.

3.3. Adsorption Energy of Molecules on the Surface

Table 4 shows the calculated and experimental values of additive density. The maximum density calculation error is 1.42%. It can prove to a certain extent that the parameter settings of the model are reasonable.
Figure 10 shows the adsorption model after MD simulation and the relative concentration distribution of atoms in the z direction for the middle layer. PETO and TMPTO have many long carbon chains. The branches of the molecules are intertwined with each other. The molecules of PETO and TMPTO adsorbed on the surface are not arranged neatly due to this steric hindrance. The BST has a short carbon chain and exhibits a multi-layer adsorption configuration in the model. The SAS molecules attached to the surface are arranged vertically, with the sulfonate groups facing the surface. SAS molecules far away from the surface are distributed chaotically and do not form a multi-layer adsorption configuration like the BST molecules.
In order to further analyze the interactions between the same molecules, the adsorption models of single molecules on the surface were established for comparison. The larger the absolute value of the adsorption energy, the tighter the binding between the molecule and the surface. This means that the functional additive molecules are more conducive to act on the surface. The comparison of adsorption energy refers to the comparison of absolute values in this work. Figure 11 shows the models of single-molecule adsorption. The adsorption energies of additives in the single-molecule model and multi-molecule model are shown in Figure 12. The adsorption energies of PETO and TMPTO are relatively large in the single-molecule model. However, in the multi-molecule model, PETO and TMPTO molecules cannot form regular structures on the surface due to steric hindrance, resulting in lower adsorption energy than BST. The adsorption energy of SAS appears to be small in both models, but the situation will be different when surface charge is considered.
In an environment with water, the metal surface is positively charged. Ten positive charges were added to each of the two surfaces of the iron, and then MD simulations were performed. Figure 13 shows the effect of surface charge on molecular adsorption energy. The adsorption energy of SAS is small when the surface is uncharged. However, when the surface is positively charged, the adsorption energy of SAS is significantly increased from −10,245 Kal/mol to −12,924 Kal/mol under the effect of electrostatic force. The surface charge has little effect on the adsorption energy of PETO, BST, and TMPTO. When SAS and friction modifiers are present in the same system, SAS will compete with friction modifier molecules for adsorption on the surface.
The hybrid models containing friction modifier molecules and SAS molecules were built and the surface charge was considered. The friction modifier molecules have twice the mass of SAS molecules in models, consistent with the ratio in the tribology tests. Figure 14 shows the contribution of friction modifier molecules and SAS molecules to the adsorption energy in the hybrid models. Figure 15 shows the hybrid model after MD simulation and the relative concentration distribution of molecules. A considerable part of the adsorption energy comes from SAS molecules, and SAS molecules tend to be more distributed on the surface than PETO, BST, and TMPTO molecules. It is obvious that there is a competitive adsorption effect between SAS and friction modifier, and the integrity of the friction modifier molecular film was destroyed. According to the contribution of adsorption energy, sparsely arranged PETO and TMPTO molecules are more susceptible to the influence of SAS molecules than closely arranged BST molecules. However, SAS molecules disrupt the multi-layer adsorption structure of the BST molecules. This results in a reduction in the effective thickness of the BST molecular film. It is the reason for the smooth COF curve but high values. PETO and TMPTO molecules have longer carbon chains and many branches. The monolayer molecules adsorbed on the surface can also have a large thickness. And this adsorption film will also be continuously destroyed by SAS molecules, resulting in the volatility of COF curves.

4. Conclusions

In this study, the mechanism by which SAS molecules affect the tribological properties of emulsions and the interaction between SAS and three ester friction modifiers were studied. Tribological properties were evaluated through a four-ball friction and wear tester. The friction surfaces were analyzed using a white light interferometer and SEM. The chemical activity, active sites, and charge distribution of PETO, BST, TMPTO, and SAS molecules were calculated based on DFT. The effects of interaction between the same molecules, surface charges, and competitive adsorption on the adsorption energy and adsorption film structure were investigated by MD simulation. The main conclusions are summarized as follows:
The friction modifiers can effectively improve the tribological properties of emulsions. However, the addition of SAS causes an increase in the COF, wear volume, roughness, and surface defect, even more than that of the basic emulsion.
The chemical reactivity of SAS is lower than PETO, BST, and TMPTO. The chemical active sites of ester friction modifiers are distributed on the ester group and C=C bond, while the chemical active sites of SAS are distributed on the sulfonate group. In PETO, BST, and TMPTO molecules, negative charges are mainly concentrated on the oxygen atoms of the ester group, and the distribution of positive charges is dispersed. In the SAS molecule, the negative charges are concentrated on the sulfonate group.
The molecules of PETO and TMPTO adsorbed on the surface are not arranged neatly due to steric hindrance. The BST molecules exhibit a multi-layer adsorption configuration. The SAS molecules attached to the surface are arranged vertically, with the sulfonate groups facing the surface.
Surface positive charges can significantly improve the adsorption capacity of SAS molecules under the action of electrostatic force. While surface charges have little effect on the PETO, BST, and TMPTO molecules, there is a competitive adsorption effect between SAS and friction modifier. The integrity of the friction modifier molecular film and the multi-layer adsorption structure of the BST molecules are disrupted by SAS molecules, which results in poorer tribological properties of the emulsions.

Author Contributions

Methodology, J.S. and E.M.; software, D.S.; validation, Y.X. and D.S.; writing—original draft preparation, D.S.; writing—review and editing, J.S. and M.Z. All authors have read and agreed to the published version of the manuscript.

Funding

This research was funded by the National Key R&D Program of China, grant number 2021YFB3701305; and the Kaifeng Science and Technology Development Plan Project in 2023, grant number 23ZDYF005.

Data Availability Statement

Data are contained within the article.

Conflicts of Interest

The authors declare no conflicts of interest.

References

  1. Meng, Y.; Xu, J.; Jin, Z.; Prakash, B.; Hu, Y. A Review of Recent Advances in Tribology. Friction 2020, 8, 221–300. [Google Scholar] [CrossRef]
  2. Yin, N.; Xing, Z.; He, K.; Zhang, Z. Tribo-Informatics Approaches in Tribology Research: A Review. Friction 2023, 11, 1–22. [Google Scholar] [CrossRef]
  3. Aymard, A.; Delplanque, E.; Dalmas, D.; Scheibert, J. Designing Metainterfaces with Specified Friction Laws. Science 2024, 383, 200–204. [Google Scholar] [CrossRef] [PubMed]
  4. Yang, C.; Yin, C.; Wu, Y.; Zhou, Q.; Liu, X. Atomic Insights into the Deformation Mechanism of an Amorphous Wrapped Nanolamellar Heterostructure and Its Effect on Self-Lubrication. J. Mater. Res. Technol. 2023, 26, 4206–4218. [Google Scholar] [CrossRef]
  5. Guo, J.; Ding, B.; Wang, Y.; Han, Y. Co-Optimization for Hydrodynamic Lubrication and Leakage of V-Shape Textured Bearings via Linear Weighting Summation. Phys. Scr. 2023, 98, 125218. [Google Scholar] [CrossRef]
  6. Wu, C.; Zhang, L.; Qu, P.; Li, S.; Jiang, Z. Multiscale Interface Stress Characterisation in Cold Rolling. Met. Mater. Int. 2021, 27, 1997–2013. [Google Scholar] [CrossRef]
  7. Yan, X.; Sun, J. Pitting Corrosion Behavior and Surface Microstructure of Copper Strips When Rolled with Oil-in-Water Emulsions. Materials 2021, 14, 7911. [Google Scholar] [CrossRef]
  8. Tang, Z.; Li, S. A Review of Recent Developments of Friction Modifiers for Liquid Lubricants (2007–Present). Curr. Opin. Solid State Mater. Sci. 2014, 18, 119–139. [Google Scholar] [CrossRef]
  9. Spikes, H. Friction Modifier Additives. Tribol. Lett. 2015, 60, 5. [Google Scholar] [CrossRef]
  10. Doll, K.M.; Sharma, B.K. Emulsification of Chemically Modified Vegetable Oils for Lubricant Use. J. Surfactants Deterg. 2011, 14, 131–138. [Google Scholar] [CrossRef]
  11. Onodera, T.; Martin, J.M.; Minfray, C.; Dassenoy, F.; Miyamoto, A. Antiwear Chemistry of ZDDP: Coupling Classical MD and Tight-Binding Quantum Chemical MD Methods (TB-QCMD). Tribol. Lett. 2013, 50, 31–39. [Google Scholar] [CrossRef]
  12. Tan, Y.; Huang, W.; Wang, X. Molecular Orbital Indexes Criteria for Friction Modifiers in Boundary Lubrication. Tribol. Int. 2002, 35, 381–384. [Google Scholar] [CrossRef]
  13. Si, R.; Ren, Q.; He, Y.; Long, J. Molecular Self-Assembling Structure and Formation Mechanism of Lubricating Grease: A Computational Simulation Approach. Tribol. Int. 2023, 179, 108150. [Google Scholar] [CrossRef]
  14. Shi, J.; Zhou, Q.; Sun, K.; Liu, G.; Zhou, F. Understanding Adsorption Behaviors of Organic Friction Modifiers on Hydroxylated SiO2 (001) Surfaces: Effects of Molecular Polarity and Temperature. Langmuir 2020, 36, 8543–8553. [Google Scholar] [CrossRef] [PubMed]
  15. Cañellas, G.; Emeric, A.; Combarros, M.; Navarro, A.; Beltran, L.; Vilaseca, M.; Vives, J. Tribological Performance of Esters, Friction Modifier and Antiwear Additives for Electric Vehicle Applications. Lubricants 2023, 11, 109. [Google Scholar] [CrossRef]
  16. Acero, P.N.; Mohr, S.; Bernabei, M.; Fernández, C.; Domínguez, B.; Ewen, J.P. Molecular Simulations of Surfactant Adsorption on Iron Oxide from Hydrocarbon Solvents. Langmuir 2021, 37, 14582–14596. [Google Scholar] [CrossRef] [PubMed]
  17. Verma, C.; Olasunkanmi, L.O.; Ebenso, E.E.; Quraishi, M.A. Substituents Effect on Corrosion Inhibition Performance of Organic Compounds in Aggressive Ionic Solutions: A Review. J. Mol. Liq. 2018, 251, 100–118. [Google Scholar] [CrossRef]
  18. Shayesteh, H.; Raji, F.; Kelishami, A.R. Influence of the Alkyl Chain Length of Surfactant on Adsorption Process: A Case Study. Surf. Interfaces 2021, 22, 100806. [Google Scholar] [CrossRef]
  19. Gattinoni, C.; Ewen, J.P.; Dini, D. Adsorption of Surfactants on α-Fe2O3(0001): A Density Functional Theory Study. J. Phys. Chem. C 2018, 122, 20817–20826. [Google Scholar] [CrossRef]
  20. Verma, C.; Hussain, C.M.; Quraishi, M.A.; Alfantazi, A. Green Surfactants for Corrosion Control: Design, Performance and Applications. Adv. Colloid Interface Sci. 2023, 311, 102822. [Google Scholar] [CrossRef]
  21. Verma, C.; Goni, L.K.M.O.; Yaagoob, I.Y.; Vashisht, H.; Mazumder, M.A.J.; Alfantazi, A. Polymeric Surfactants as Ideal Substitutes for Sustainable Corrosion Protection: A Perspective on Colloidal and Interface Properties. Adv. Colloid Interface Sci. 2023, 318, 102966. [Google Scholar] [CrossRef] [PubMed]
  22. Yu, H.; Chen, H.; Zheng, Z.; Qiao, D.; Feng, D.; Gong, Z.; Dong, G. Effect of Functional Groups on Tribological Properties of Lubricants and Mechanism Investigation. Friction 2023, 11, 911–926. [Google Scholar] [CrossRef]
  23. Huang, G.; Fan, S.; Ba, Z.; Cai, M.; Qiao, D. Insight into the Lubricating Mechanism for Alkylimidazolium Phosphate Ionic Liquids with Different Alkyl Chain Length. Tribol. Int. 2019, 140, 105886. [Google Scholar] [CrossRef]
  24. Cyriac, F.; Yamashita, N.; Hirayama, T.; Yi, T.X.; Poornachary, S.K.; Chow, P.S. Mechanistic Insights into the Effect of Structural Factors on Film Formation and Tribological Performance of Organic Friction Modifiers. Tribol. Int. 2021, 164, 107243. [Google Scholar] [CrossRef]
  25. Hirayama, T.; Maeda, M.; Sasaki, Y.; Matsuoka, T.; Komiya, H.; Hino, M. Growth of Adsorbed Additive Layer for Further Friction Reduction. Lubr. Sci. 2019, 31, 171–178. [Google Scholar] [CrossRef]
  26. Liu, C.; Tian, Y.; Khan, Z.A.; Meng, Y. Mitigation of Tribocorrosion of Metals in Aqueous Solutions by Potential-Enhanced Adsorption of Surfactants. Friction 2023, 11, 801–819. [Google Scholar] [CrossRef]
  27. Correia, E.L.; Thakur, S.; Ervin, A.; Shields, E.; Razavi, S. Adsorption of Surfactant Molecules onto the Surface of Colloidal Particles: Case of like-Charged Species. Colloids Surf. A Physicochem. Eng. Asp. 2023, 676, 132142. [Google Scholar] [CrossRef]
  28. He, S.; Meng, Y.; Tian, Y. Correlation Between Adsorption/Desorption of Surfactant and Change in Friction of Stainless Steel in Aqueous Solutions Under Different Electrode Potentials. Tribol. Lett. 2011, 41, 485–494. [Google Scholar] [CrossRef]
  29. Yang, X.; Meng, Y.; Tian, Y. Potential-Controlled Boundary Lubrication of Stainless Steels in Non-Aqueous Sodium Dodecyl Sulfate Solutions. Tribol. Lett. 2014, 53, 17–26. [Google Scholar] [CrossRef]
  30. Lavanya, M.; Machado, A.A. Surfactants as Biodegradable Sustainable Inhibitors for Corrosion Control in Diverse Media and Conditions: A Comprehensive Review. Sci. Total Environ. 2024, 908, 168407. [Google Scholar] [CrossRef]
  31. Gao, T.; Li, J.; Wang, W.; Luo, J. Extremely Low Friction on Gold Surface with Surfactant Molecules Induced by Surface Potential. Friction 2023, 11, 513–523. [Google Scholar] [CrossRef]
  32. Zhang, S.; Peng, B.; Liu, Q.; Liu, Z. The Effect of Sodium Carbonate on Reducing the Interfacial Tension of Petroleum Sulfonate. J. Pet. Sci. Eng. 2021, 200, 108255. [Google Scholar] [CrossRef]
  33. Liu, C.; Fang, J.; Wen, X.; Tian, Y.; Meng, Y. Active Control of Boundary Lubrication of Ceramic Tribo-Pairs in Sodium Dodecyl Sulfate Aqueous Solutions. Tribol. Lett. 2021, 69, 144. [Google Scholar] [CrossRef]
  34. Saji, V.S. Temporary Rust Preventives—A Retrospective. Prog. Org. Coat. 2020, 140, 105511. [Google Scholar] [CrossRef]
  35. Migahed, M.A.; Al-Sabagh, A.M. Beneficial Role of Surfactants as Corrosion Inhibitors in Petroleum Industry: A Review Article. Chem. Eng. Commun. 2009, 196, 1054–1075. [Google Scholar] [CrossRef]
  36. Zhu, Y.; Free, M.L.; Yi, G. The Effects of Surfactant Concentration, Adsorption, Aggregation, and Solution Conditions on Steel Corrosion Inhibition and Associated Modeling in Aqueous Media. Corros. Sci. 2016, 102, 233–250. [Google Scholar] [CrossRef]
  37. ASTM D4172-21; Standard Test Method for Wear Preventive Characteristics of Lubricating Fluid (Four-Ball Method). ASTM International: West Conshohocken, PA, USA, 2022. [CrossRef]
  38. Singh, R.N.; Kumar, A.; Tiwari, R.K.; Rawat, P. A Combined Experimental and Theoretical (DFT and AIM) Studies on Synthesis, Molecular Structure, Spectroscopic Properties and Multiple Interactions Analysis in a Novel Ethyl-4-[2-(Thiocarbamoyl)Hydrazinylidene]-3,5-Dimethyl-1H-Pyrrole-2-Carboxylate and Its Dimer. Spectrochim. Acta A. Mol. Biomol. Spectrosc. 2013, 112, 182–190. [Google Scholar] [CrossRef]
  39. Montero, J.M.; Isaacs, M.A.; Lee, A.F.; Lynam, J.M.; Wilson, K. The Surface Chemistry of Nanocrystalline MgO Catalysts for FAME Production: An in Situ XPS Study of H2O, CH3OH and CH3OAc Adsorption. Surf. Sci. 2016, 646, 170–178. [Google Scholar] [CrossRef]
Figure 1. Molecular structures of additives.
Lubricants 12 00135 g001
Figure 2. Schematic diagram of the tribology test.
Lubricants 12 00135 g002
Figure 3. MD simulation process.
Lubricants 12 00135 g003
Figure 4. (a) The COF curves of emulsions; (b) Average COF values.
Lubricants 12 00135 g004
Figure 5. Three-dimensional topography of balls after the tribological tests under different lubrication conditions.
Lubricants 12 00135 g005
Figure 6. (a) Wear volume of balls; (b) Roughness in the vertical friction direction.
Lubricants 12 00135 g006
Figure 7. SEM micrographs of the wear scar: (a) PETO, (b) PETO+SAS, (c) BST, (d) BST+SAS, (e) TMPTO, (f) TMPTO+SAS, (g) Basic.
Lubricants 12 00135 g007
Figure 8. Distribution of HOMO and LUMO.
Lubricants 12 00135 g008
Figure 9. Mapping of the electrostatic potential of the molecules on the electron density surface.
Lubricants 12 00135 g009
Figure 10. (a) Adsorption model after MD simulation; (b) Relative concentration distribution of atoms in the z direction for the middle layer.
Lubricants 12 00135 g010
Figure 11. Models of single molecule adsorption.
Lubricants 12 00135 g011
Figure 12. Adsorption energy of additives in single-molecule and multi-molecule models.
Lubricants 12 00135 g012
Figure 13. Molecular adsorption energy under different surface states.
Lubricants 12 00135 g013
Figure 14. Contribution of friction modifier molecules and SAS molecules to the adsorption energy in the hybrid models.
Lubricants 12 00135 g014
Figure 15. (a) Hybrid adsorption model after MD simulation; (b) Relative concentration distribution of atoms in the z direction for different kinds of molecules.
Lubricants 12 00135 g015
Table 1. Components of the oil phase in the emulsion.
ComponentIngredientContent (wt.%)
EmulsifierSpan 802.34
EmulsifierTween 802.36
Ester friction modifiersPETO/BST/TMPTO4.00
Corrosion inhibitorSAS2.00
Extreme pressure agentDibutyl Phosphite3.00
Antioxidants, pH regulators and bactericides, etc.-6.00
Base oilPalm oilRemainder
Table 2. Quantum chemical parameters.
MoleculePETOBSTTMPTOSAS
EHOMO (eV)−6.361−7.619−6.457−7.676
ELUMO (eV)−0.363−0.101−0.308−0.315
ΔE (eV)5.9987.5186.1497.991
I (eV)6.3617.6196.4577.676
A (eV)0.3630.1010.308−0.315
χ (eV)3.3623.8603.3833.680
η (eV)2.9993.7593.0743.995
σ (eV−1)0.3330.2660.3250.250
ω (eV)1.8851.9821.8611.695
Table 3. Fukui indices for the nucleophilic and electrophilic attacks.
MoleculeAtomƒk+ƒkAtomƒk+ƒk
PETOO650.018−0.001O1210.0010.002
C640.085−0.001C1200.0130.000
O670.082−0.002O1230.0200.008
C83−0.0020.021C1390.0010.001
C84−0.0030.019C1400.0060.002
O1770.026−0.002O90.0060.001
C1760.1310.000C80.0270.000
O1790.1230.003O110.025−0.001
C1950.0030.153C270.0010.016
C196−0.0010.114C280.0110.011
BSTO10.0620.033C0.3170.054
O20.2380.207
TMPTOO1080.0420.000O550.0020.002
C1090.165−0.001C560.0120.001
O1250.1310.001O720.013−0.002
C1580.0000.064C1050.0000.036
C1170.0010.093C64−0.0010.038
O20.0260.000C30.0900.000
O190.0990.001C520.0020.005
C11−0.0020.042
SASS0.0110.067O1−0.0150.255
O2−0.0160.253O30.0050.229
Na0.9730.056
Table 4. Additive density.
Data SourcesPETO
(g/cm3)
BST
(g/cm3)
TMPTO
(g/cm3)
SAS
(g/cm3)
Calculation0.9130.8550.9051.046
Experiment0.9260.8610.9181.055
Disclaimer/Publisher’s Note: The statements, opinions and data contained in all publications are solely those of the individual author(s) and contributor(s) and not of MDPI and/or the editor(s). MDPI and/or the editor(s) disclaim responsibility for any injury to people or property resulting from any ideas, methods, instructions or products referred to in the content.

