Article

Pin-on-Plate vs. Pin-on-Disk Wear Tests: Theoretical and Numerical Observations on the Initial Transient Phase

Dipartimento di Ingegneria Civile e Industriale, Università di Pisa, 56122 Pisa, Italy
*
Author to whom correspondence should be addressed.
Lubricants 2024, 12(4), 134; https://doi.org/10.3390/lubricants12040134
Submission received: 9 March 2024 / Revised: 8 April 2024 / Accepted: 11 April 2024 / Published: 17 April 2024

Abstract

:
Pin-on-plate and pin-on-disk wear tests are typically used for assessing the wear behavior of a given material coupling and estimating its wear coefficient using the Archard wear law. This study investigates differences in the Archard law for pin-on-plate and pin-on-disk cases, particularly for flat-ended pins. Both analytical and finite element models of the two tests were developed, assuming a 21 N normal load and a 50π mm sliding distance. In pin-on-disk simulations three different distances between pin and disk axes were considered, i.e., 1.25–2.5–5 times the pin radius (5 mm). For the results, wear volumes, pressure and wear depth maps were compared. Some interesting aspects arose: (i) the rotational effect in pin-on-disk tests causes higher wear volumes (up to 13%) with respect to pin-on-plate tests: the nearer the pin to the disk axis, the higher the wear volume; (ii) a simple quadratic formula is defined to correct the wear volume estimation for pin-on-disk tests; (iii) pressure redistribution occurs with higher values closer to disk axis, opposite to the wear depth trend. Due to the high computational costs, only the running-in phase of wear tests was considered. Numerical strategies are currently under investigation to extend this study to the steady state phase.

1. Introduction

Wear is a phenomenon as complex as it is widespread in everyday life. It can be observed in shoes, teeth, brakes and in many other elements. From an engineering point of view, it is important to consider wear when designing mechanical components and this requires an estimation of their wear resistance. Experimental tests are carried out for this purpose. Since this phenomenon is affected by many factors such as materials properties, kinematic and loading conditions and so on, which can hardly be reproduced in a laboratory, such tests most frequently apply simplified conditions. The two most common wear tests are performed on pin-on-plate (PoP) or pin-on-disk (PoD) apparatus.
Pin-on-plate wear tests are used to study reciprocating sliding wear and fretting. In both cases, a pin is loaded against a flat surface in the presence of a reciprocating motion; depending on the stroke length, sliding and fretting conditions are distinguished, the former having a wide stroke much longer than the contact width, and the latter a small stroke, typically of the order of magnitude of the contact width. A schematic view of the two wear tests is given in Figure 1a. These tests are well described in the ASTM G99 [1] and ASTM D4170-16 [2], and ASTM G133 [3], respectively.
Pin-on-disk wear tests reproduce continuous sliding contact conditions between a rotating disk and pin located at a given distance from the disk axis, as represented in Figure 1b. For PoD wear tests, the standard commonly adopted is ASTM G99 [1].
In both PoP and PoD tests, two cases can occur: only one body wears out, i.e., the pin or the plate/disk, or both contact surfaces wear. According to the standards, the test’s outputs are the wear volumes of each component measured directly (by means of gravimetric method) or, more often, computed from measurements of the worn scar and initial unworn pin geometry [1,2,3].
These experimental wear volumes are used to compute the wear coefficient k that characterizes the wear rate of the tribo-pair and is useful to compare material couplings, and also to calibrate numerical wear models [4,5,6,7]. The wear coefficient is commonly estimated according to the Archard wear law in its global form [8,9], i.e.,
V = k   F   s ,
stating that the wear volume V is proportional to the normal load F and the sliding distance s. In wear tests, F and s are imposed whilst the worn mass or volume is measured, so that the wear coefficient can be calculated as
k = V / ( F   s ) .
In the literature, Equation (2) is used to estimate k from PoP and PoD wear tests, as reported in very recent experimental studies both on unilateral [4,10,11,12] and bilateral [5,6,13] wear. However, Equation (2) holds only for a translating body under constant load, and thus while it is correct for PoP wear tests, it provides only an approximation of k for PoD tests where a relative rotation occurs. Nevertheless, to the best of authors’ knowledge, such an equation has never been revised for the case of PoD wear tests.
This study compares PoP and PoD wear tests by means of both analytical and numerical FE models considering the Archard wear law in its local instantaneous form. The final aim is to investigate how the rotational effect in PoD tests affects the estimation of k by varying the distance between the pin and disk axes.

2. Materials and Methods
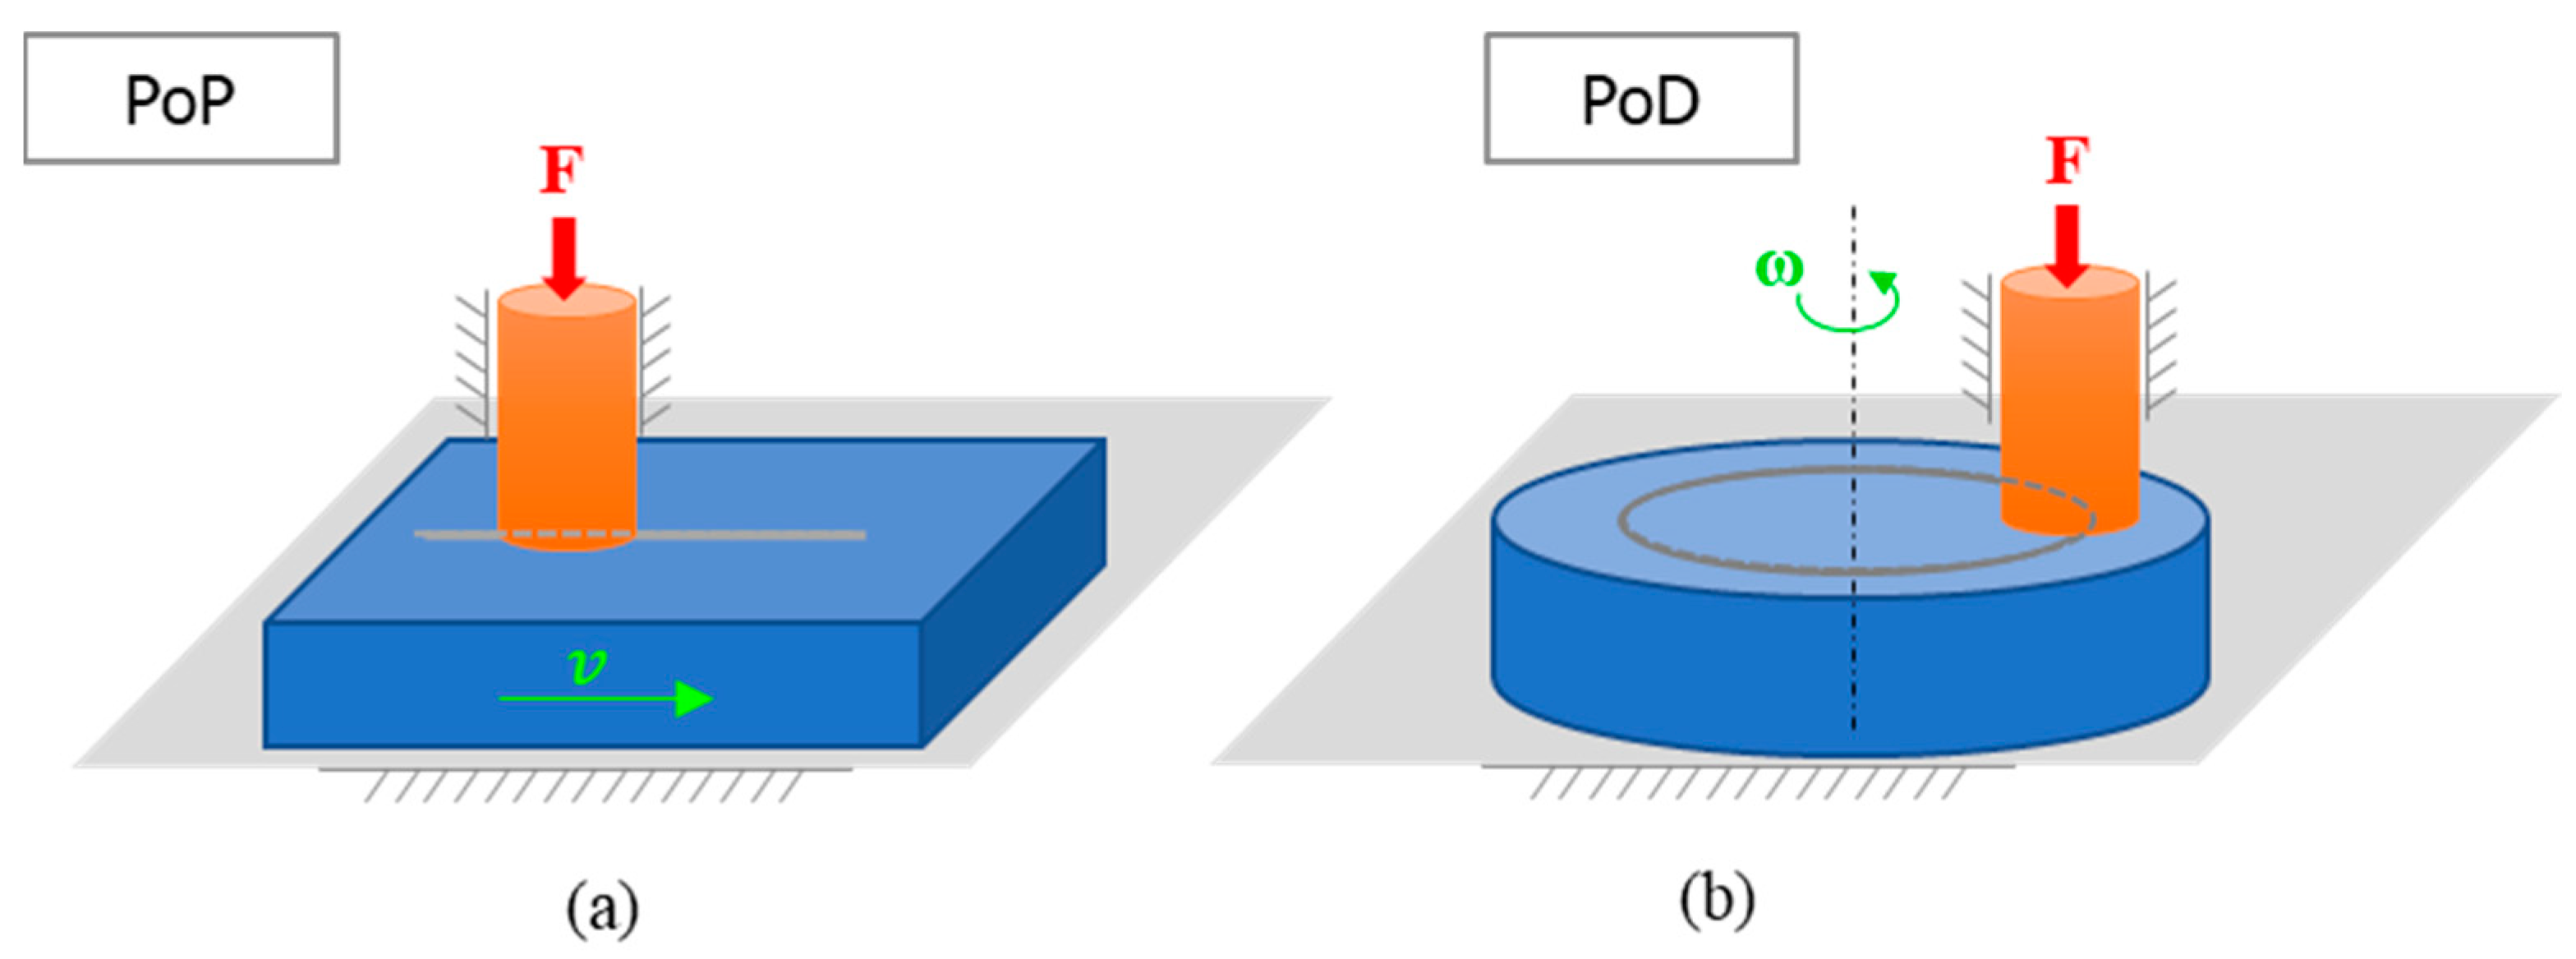
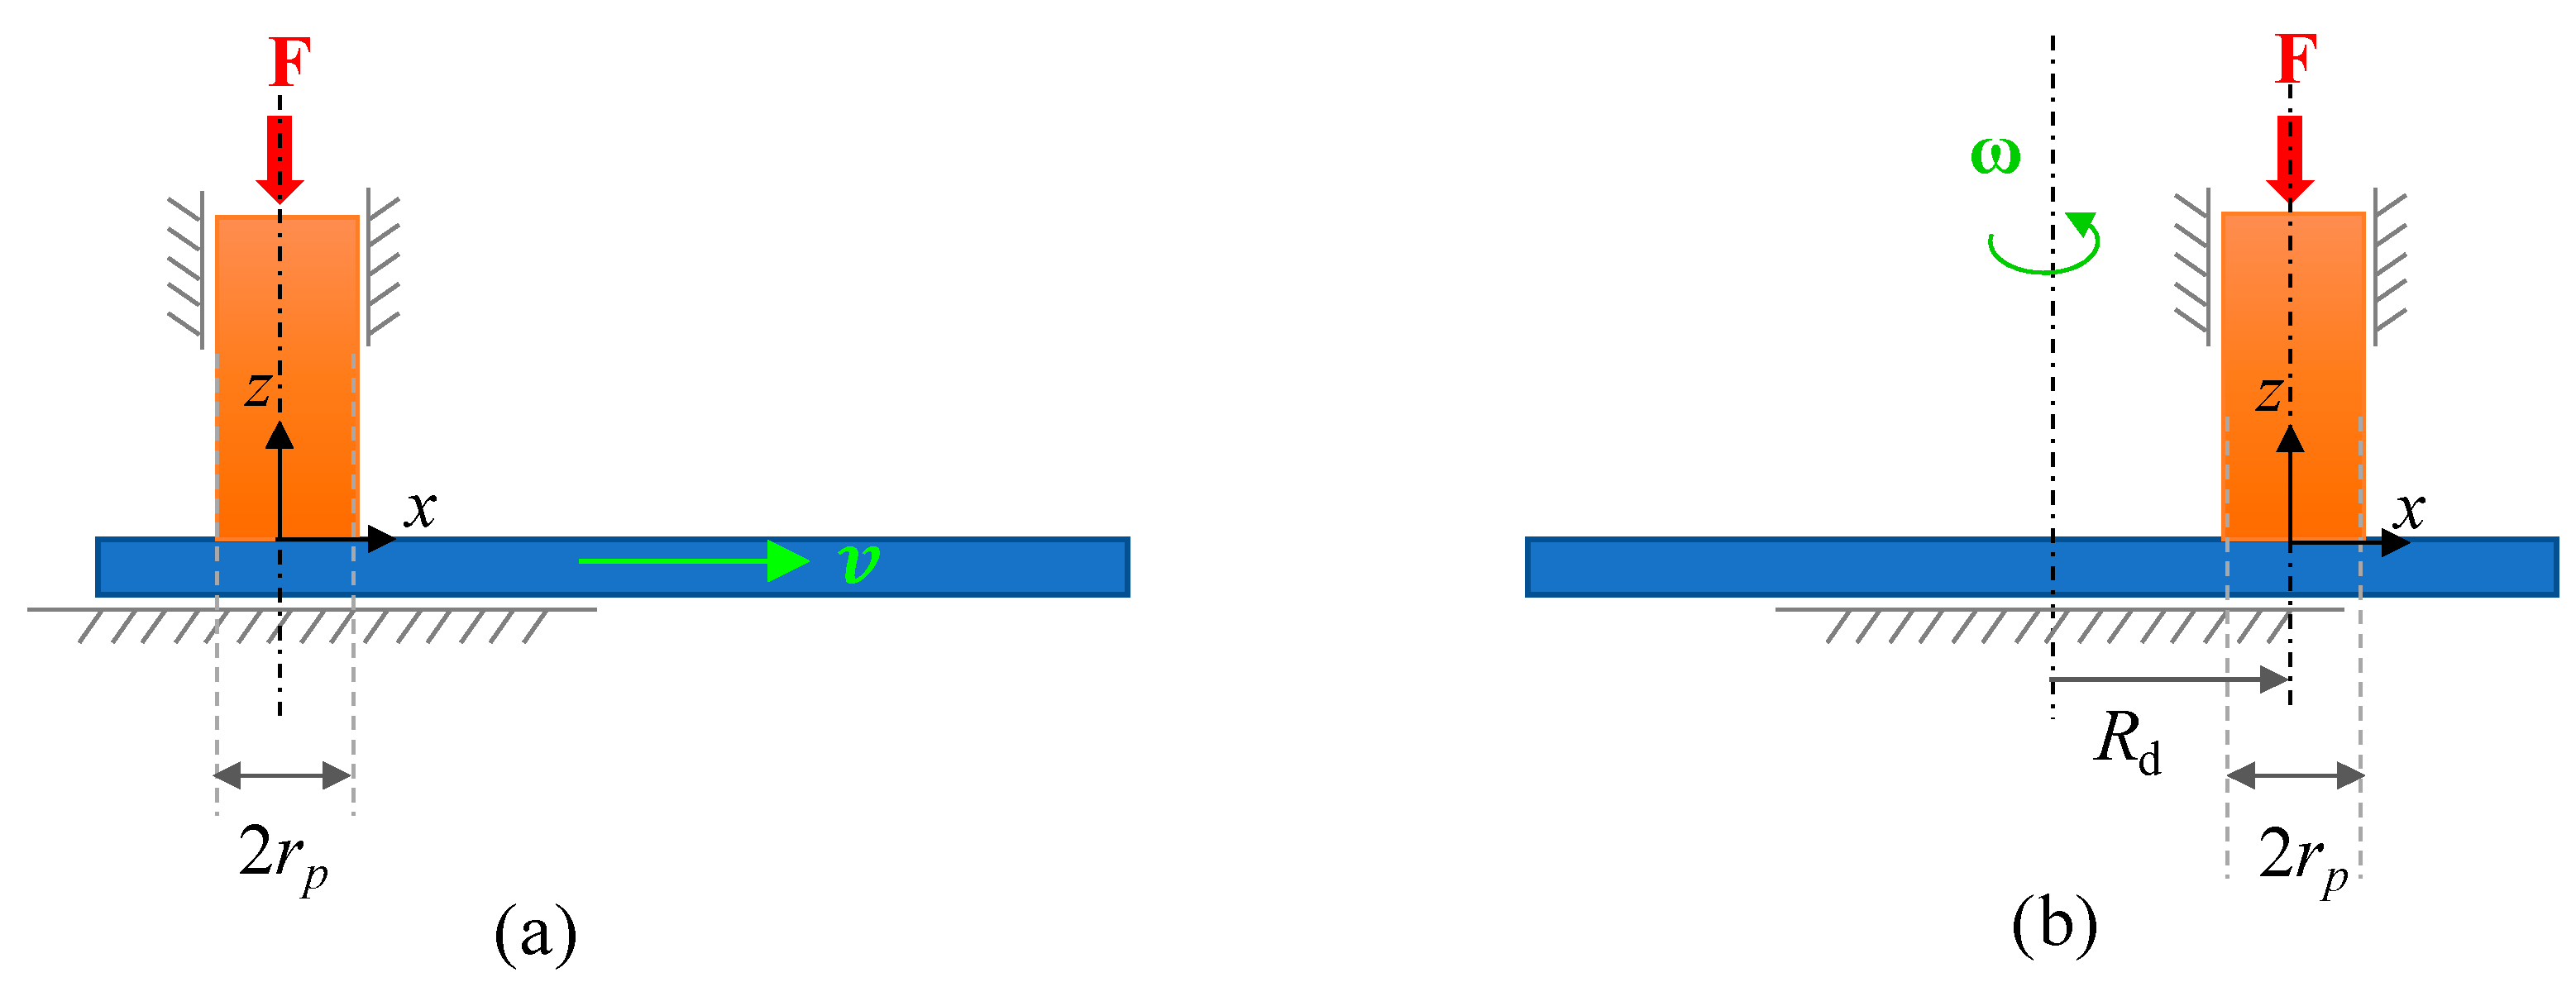
To compare the PoP and PoD wear tests, firstly, finite element (FE) models were developed in Ansys® Workbench 2023 R2. Then, to clarify and generalize numerical results, the pertinent analytical relationships were formulated and solved in Matlab® R2023b.

2.1. Test Cases

In the examined test cases, a cylindrical flat pin having a radius rp = 5 mm was assumed to be in contact with the plane surface of a plate or a disc (Figure 1 and Figure 2). The pin radius was taken in accordance with ASTM G99 [1] and the study [14], the latter taken as a reference. For the PoD test, three configurations were examined differing in the distance Rd between the pin and disk axes, i.e., Rd = 1.25–2.5–5 rp. These configurations were selected to span different kinematic conditions: while in PoP tests the sliding speed v is the same in every point, in PoD tests the point nearest to the disk axis has the minimum velocity ω(Rdrp) while the farthest has the maximum one, ω(Rd + rp). The difference between the maximum and minimum speeds (2ωrp) compared to the average speed (2ωrpRd = 2 rp/Rd) gives a measure of the rotational vs. translatory components of the velocity field. Thus, the case Rd = 1.25 rp = 7.5 mm, i.e., with the pin very close to the disk axis, corresponds to the major influence of the rotational effects, while Rd = 5 rp = 25 mm to the minimum one. The intermediate value Rd = 2.5 rp = 12.5 mm was selected to reproduce a wear track diameter in agreement with ASTM G99 [1]. Pin and disc were assumed to be made of structural steel, with a Young modulus of 200 GPa and Poisson ratio equal to 0.3, and hardened to HV = 4.6 GPa and HV = 3 GPa, respectively [14]. Consequently, only the pin was considered as affected by wear, with a wear coefficient k = 1.25 × 10⁻⁷ mm2/N, as estimated for similar test conditions [14]. In all tests, a normal load of 21 N was applied to the pin [14] and the same final sliding distance sf corresponding to 1 round of the highest Rd (sf = 10π rp = 157.08 mm) was simulated for both PoP and PoD cases. This small displacement was considered to limit the computational time.

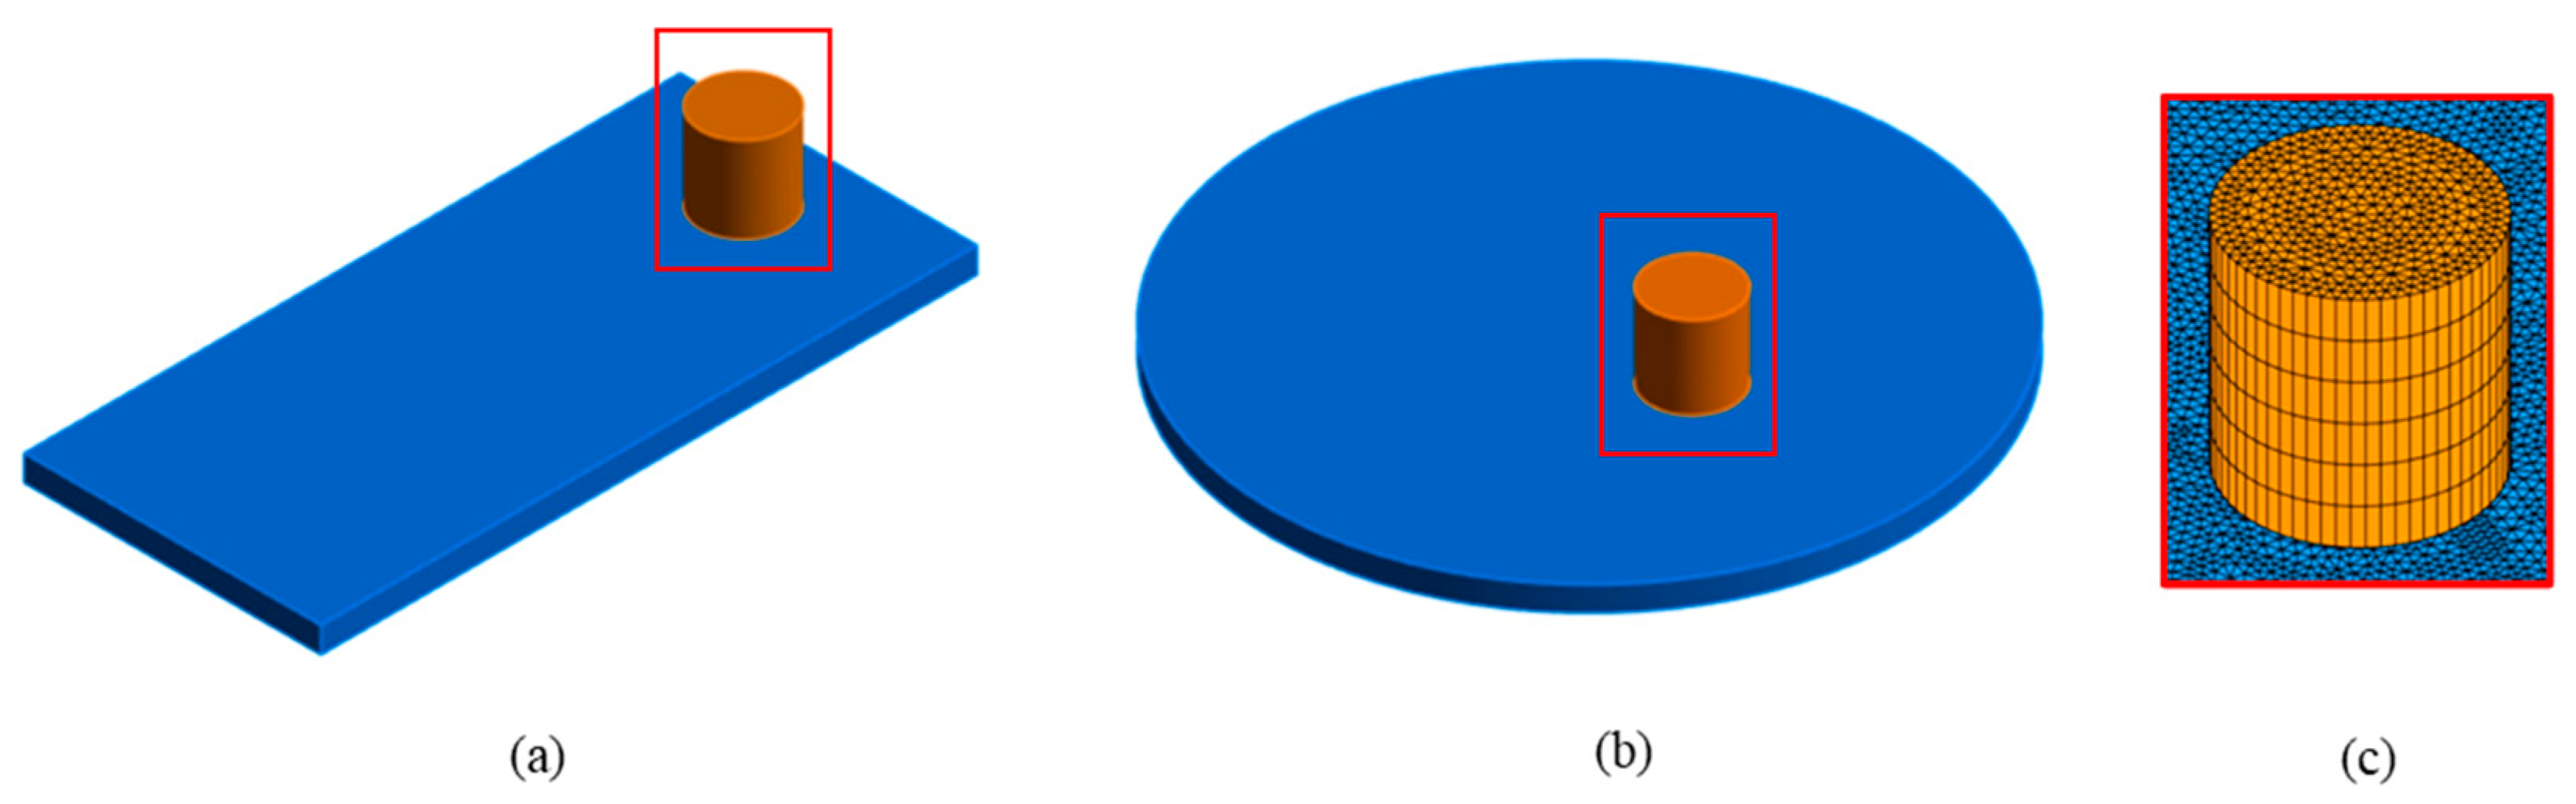
2.2. Finite Element Models

The FE simulations were performed in Ansys Workbench® 2023, taking advantage of the dedicated tool for wear assessment.

2.2.1. Geometry and Materials

To simplify the analyses, the plate and the disk were treated as rigid bodies; only the pin was considered deformable and affected by wear.

2.2.2. Mesh

The cylinder was meshed with 3D prism (WED6) elements by employing the “Sweep method” while the plate/disc surface was meshed with TRI3 (3 nodes linear triangle) 2D elements; both the pin and disk mesh size was 0.5 mm (Figure 3). The contact surfaces were meshed with CONTA174 and TARGE170 elements (see Section 2.2.3).

2.2.3. Contact and Wear Conditions

The contact was assumed as asymmetric as in this case only one body wears out. Moreover, the contact was simulated as frictionless, since the effect of the friction on wear is negligible as demonstrated in [15]. The analysis was solved by means of an Augmented Lagrange algorithm and the nodal-projected normal from contact was adopted as the detection method with the cylinder and plate/disk as the contact and target body, respectively.
The wear behavior was activated through an APDL command script inserted in the contact section and through calling the Ansys tool which applies the Archard’s wear law in the generalized form
h ˙   =   k H p m v n ,
where H is the material hardness, k is the wear coefficient, and m and n exponents of pressure and sliding velocity, respectively. In particular, the command TB WEAR with the option ARCD was used for applying Equation (3); the TBDATA command was used to set the parameters of Equation (3) and the TBFIELD command for selecting the time instants during which activate or deactivate wear. Parameters were set as H = m = n = 1, so that the traditional form of the Archard wear law was adopted according to Equation (1).

2.2.4. Boundary Conditions

The vertical load of 21 N was applied to the pin, which could only translate in the vertical direction to keep the contact with the counterpart. The motion was applied to the plate and the disk, as a translation of sf in the first case and a rotation Θ = sf/Rd in the second one. The computational time was about 4 h using a processor Intel(R) Xeon(R) Silver 4214R CPU @ 2.40 GHz with 64 GB RAM.

2.2.5. Analysis Settings

The time increment was set to 10−4 to 2.5 × 10⁻² s which allowed us to discretize the arc length with the chord along the node trajectories with a maximum error of 0.1%, making the computational time affordable.

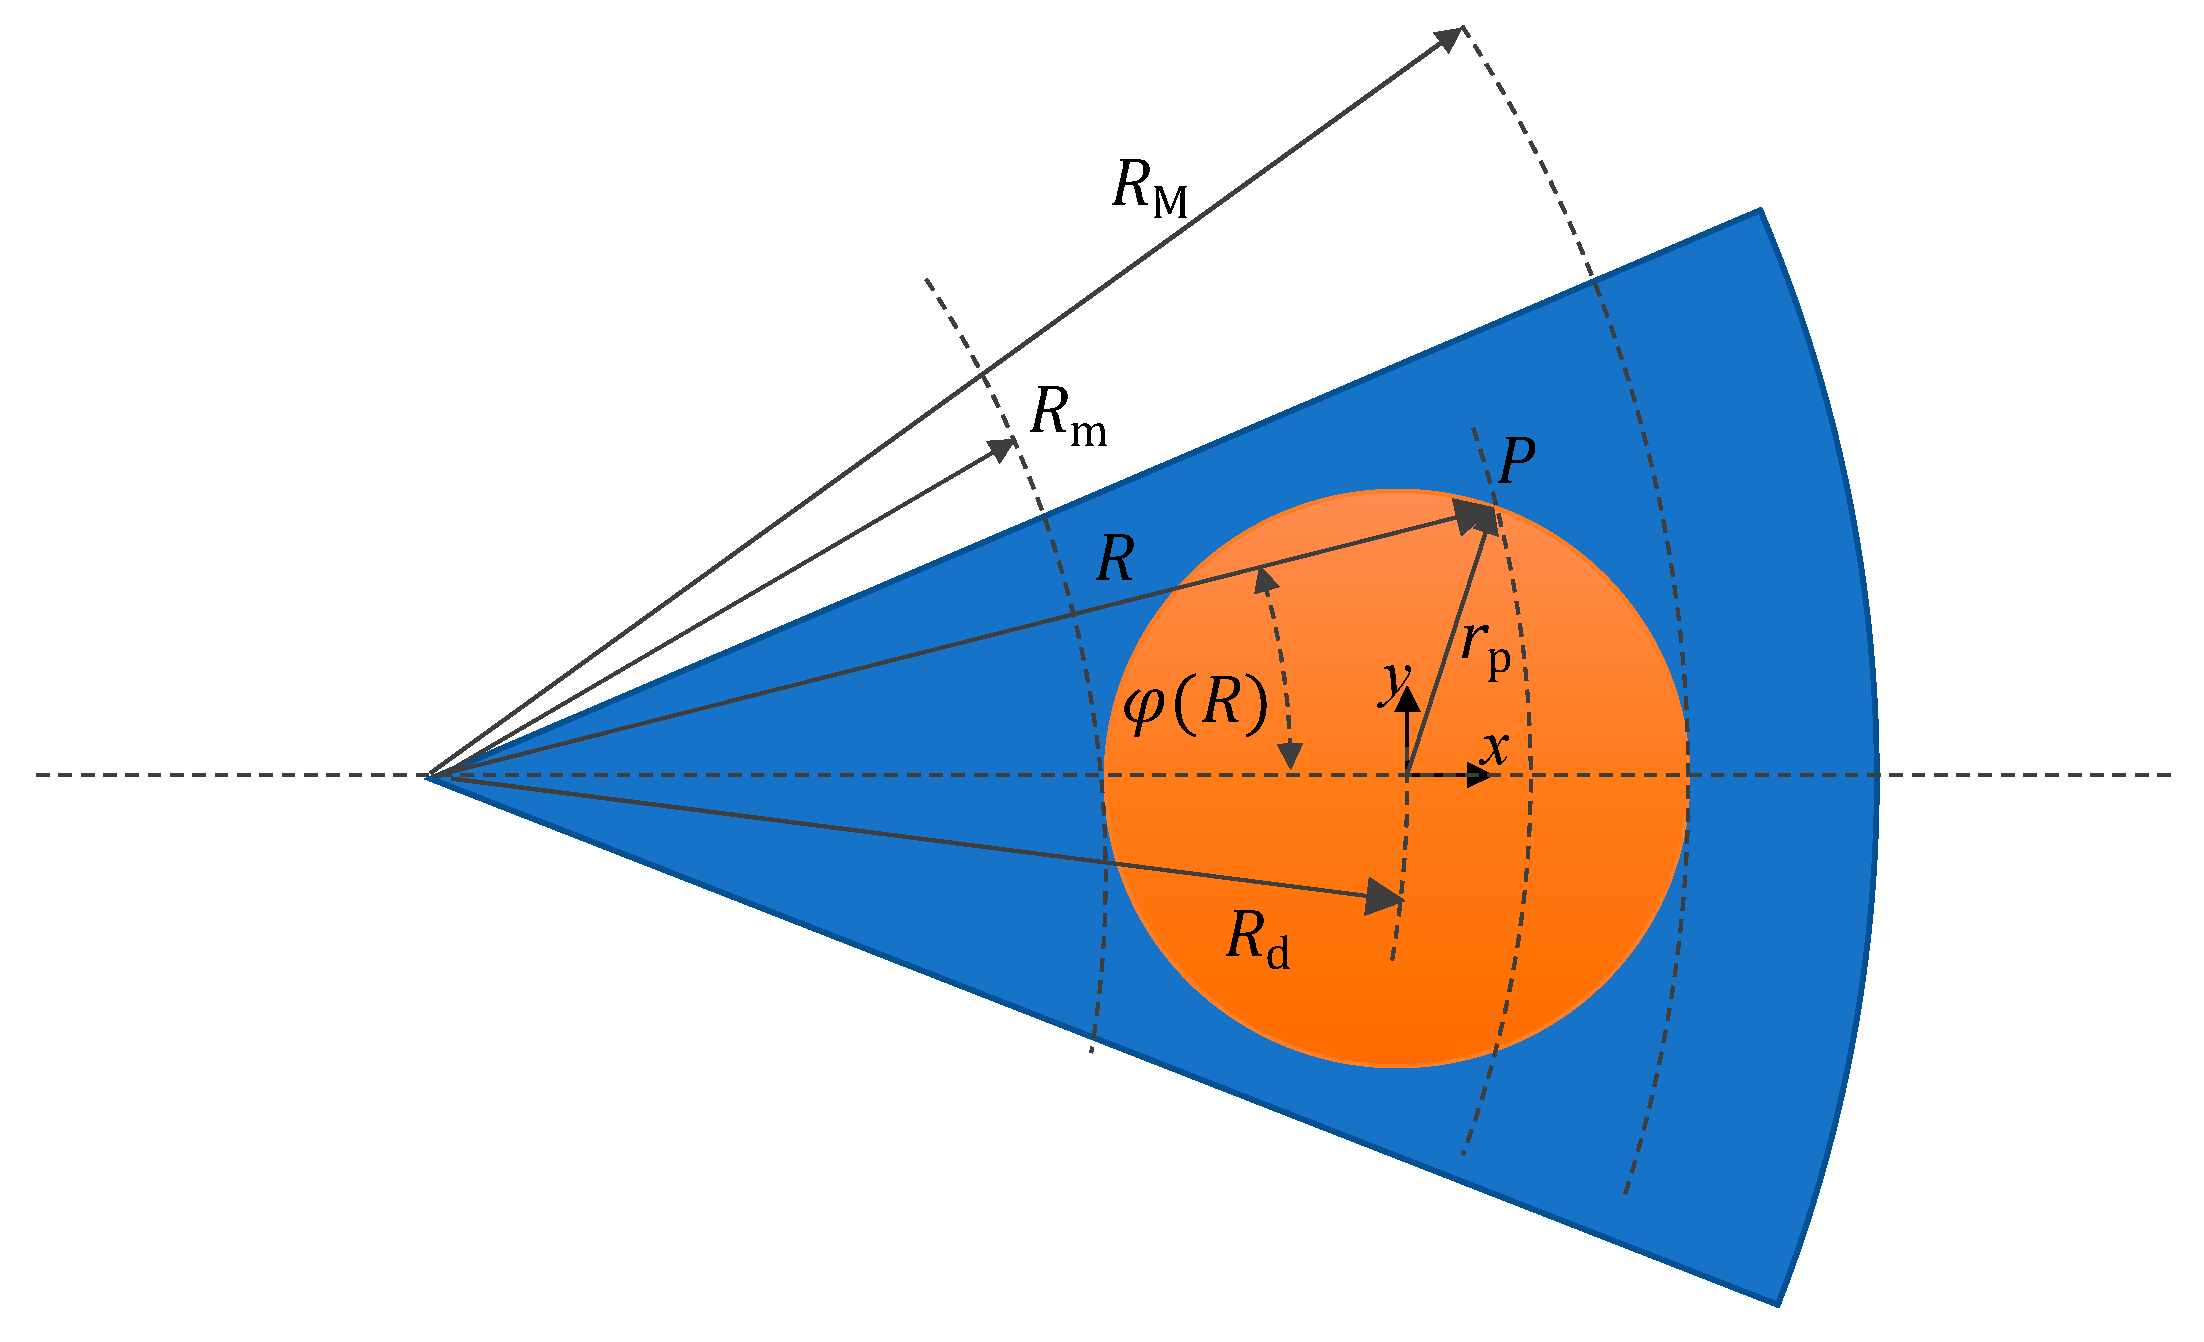
2.3. Analytical Approach

The analytical description of both tests moves from the local instantaneous form of the Archard’s law that can be rewritten as
h ˙ P , t = k   p P , t   v P , t ,
relating the wear depth rate at a point P to the pressure p and sliding speed v both varying with time and point. The wear depth at a given instant is simply obtained through integrating Equation (4)
h P , t = k   0 t p P , τ   v P , τ   d τ .
Accordingly, the wear volume is calculated as
V = k     A   0 t p P , τ   v P , τ   d τ   d A = k   0 t A ( t )   p P , τ v P , τ     d A   d τ .
In PoP tests, we can neglect the wear produced when reversing the motion and consider that the speed v is uniform and constant, therefore it can be written as:
V P o P = k   v   A   0 t p P , τ   d τ   d A = k   F   v   t = k   F   s .
Rather interestingly, the wear volume in PoP tests does not depend on pressure distribution, i.e., on the shape of the pin, flat-ended or hemispherical.
On the other hand, when we consider a PoD test, the relative motion of the pin with respect to the disk is a rotation about the disk axis of an angle Θ . Therefore, the sliding distance of each point P, s P , is proportional to the radial distance R of P from the disk axis (Figure 4), i.e.,
s P = R   Θ .
Introducing the angular speed of the disc ω , assumed constant for simplicity, and substituting Θ = ω t , Equation (5) becomes
h P , t = k   ω 0 t R   p P , τ   d τ .
Another difference between PoP and PoD models is that in the latter the wear volume depends on pressure distribution, as Equation (7) cannot be exploited:
V P o D = k   ω A   0 t R   p P , τ   d τ   d A = k   ω   0 t A ( t )   R   p P , τ   d A   d τ ,
In the present study, for a flat ended pin and a low friction, we assumed that in the initial part of the test, pressure remained almost uniform p _ = F / r p 2 π and the contact area constant. Therefore, the main difference between the two tests lies in the sliding distance.
Thus, we can write:
V P o D = k F r p 2 π   ω   0 t A   R   d A   d τ = k   F r p 2 π   ω t A   R   d A   = k   F r p 2 π   Θ A   R   d A ,
Θ = s / R d with s being equal to the arc described by the center of the pin.
Equation (11) requires further manipulation of the integral
A   R   d A = R m R M φ ( R ) φ ( R ) R   R   d φ   d R ,
with
φ ( R ) = a c o s R d 2 + R 2 r p 2 2   R d   R ,   R m = R d r p ,   R M = R d + r p .
With a few passages being
A   R   d A = 2   R m R M R 2   a c o s R d 2 + R 2 r p 2 2   R d   R d R ,
we obtain
V P o D = k   F s     2   R m R M R 2 a c o s R d 2 + R 2 r p 2 2   R d   R   d R R d     r p 2 π  
The last term on the right is dimensionless, dependent on the geometry of the system and is typically omitted in the literature, for example, when using PoD tests for evaluating k. We can consider that g γ as the ratio between the PoD and PoP wear volumes, when a uniform pressure distribution is considered. It can be expressed as a function of a dimensionless geometric parameter γ = r p / R d
g γ = 2   1 γ 1 + γ ρ 2 a c o s 1 + ρ 2 γ   2 2   ρ   d ρ γ 2 π   ,             ρ = R R d
Its trend is shown is Figure 5 for 0 < γ < 1 , which is a limited range of practical values of γ . It is preferred to its inverse R d r p that should be considered in the field [1,∞). It is worth stressing that when γ 0 , i.e., R d r p , the PoD → PoP.
From Equation (16), it can be observed that the ratio is maximum when γ = 1 and when g(1) = 32/(9π) ≅ 1.132, meaning that the PoD produced higher wear volumes than PoP over the same sliding distance when the pressure is considered uniform, as in the initial part of a test, up until wear affects the geometry of the contact surface.
The above equations were implemented in a Matlab® (R2023b) script for estimating the wear volumes with a constant pressure approximation and were compared with FE results in a short sliding distance.

3. Result and Discussion

The FE simulations of the four cases, one PoP and three track radii PoD, were completed and the results of the wear volumes, the maps of the contact pressure and the wear depth over the contact area were analyzed. They are discussed for increasing values of the parameter γ, i.e., with the reduction in the distance between the pin and the disk axis, considering that γ 0 represents the PoP test, and γ = 0.2 ,   0.4   and   0.8 represents the PoD cases with decreasing Rd = 5, 2.5 and 1.25 rp, respectively.
Figure 6 shows the trends of the wear volumes over the sliding distance, obtained from FE analyses. It can be observed that volumes at the end of the test were different, increasing with γ from 4.09, 4.14, 4.18 to 4.36 × 10⁻⁴ mm3 for the same load and sliding distance. However, for all tests the trend of the wear volume was almost linear.
Analytical predictions were in good agreement with the FE ones, with differences lower than 2.4% and increasing with γ .
These findings raise two main issues discussed in the following: (i) the validity of Equation (2) for PoD tests (Section 3.1); (ii) the effect of the sliding distance on contact pressure distribution (Section 3.2).

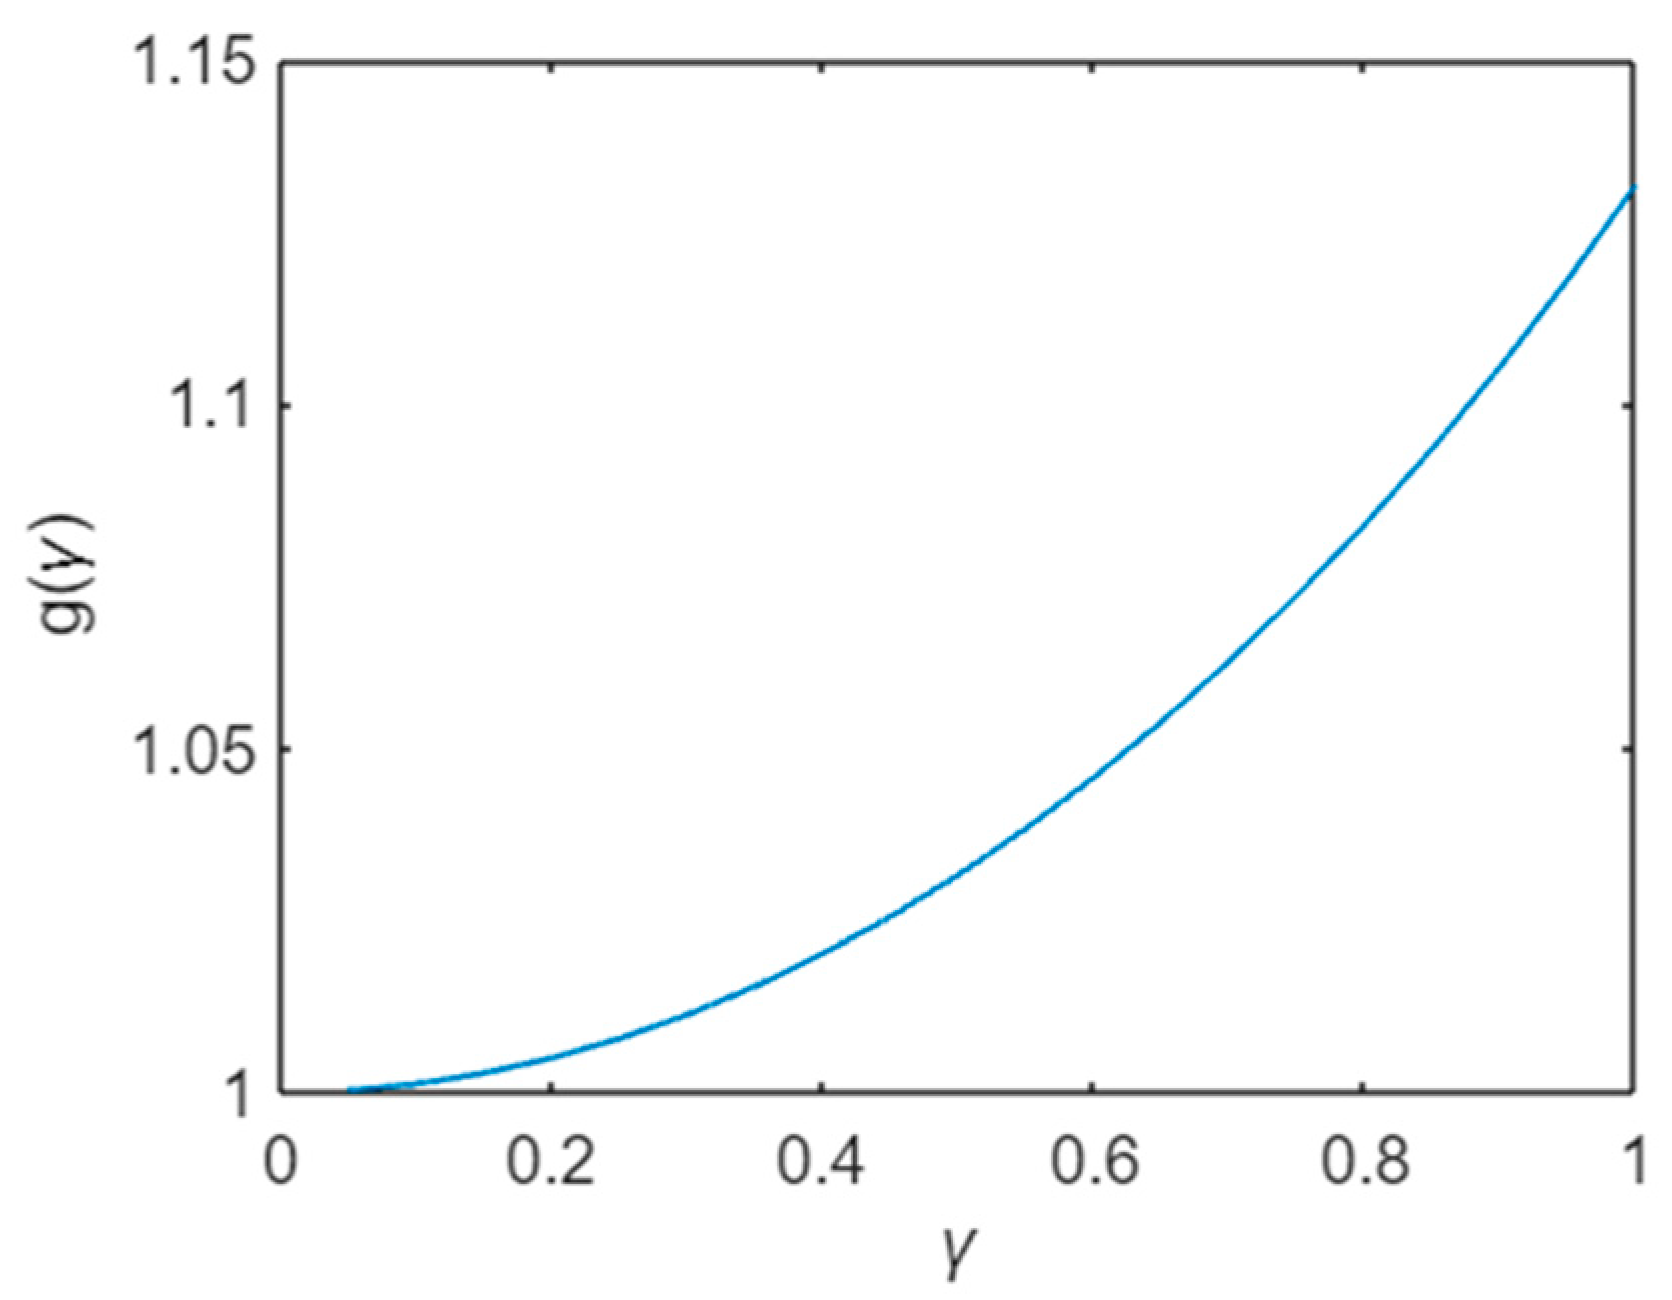
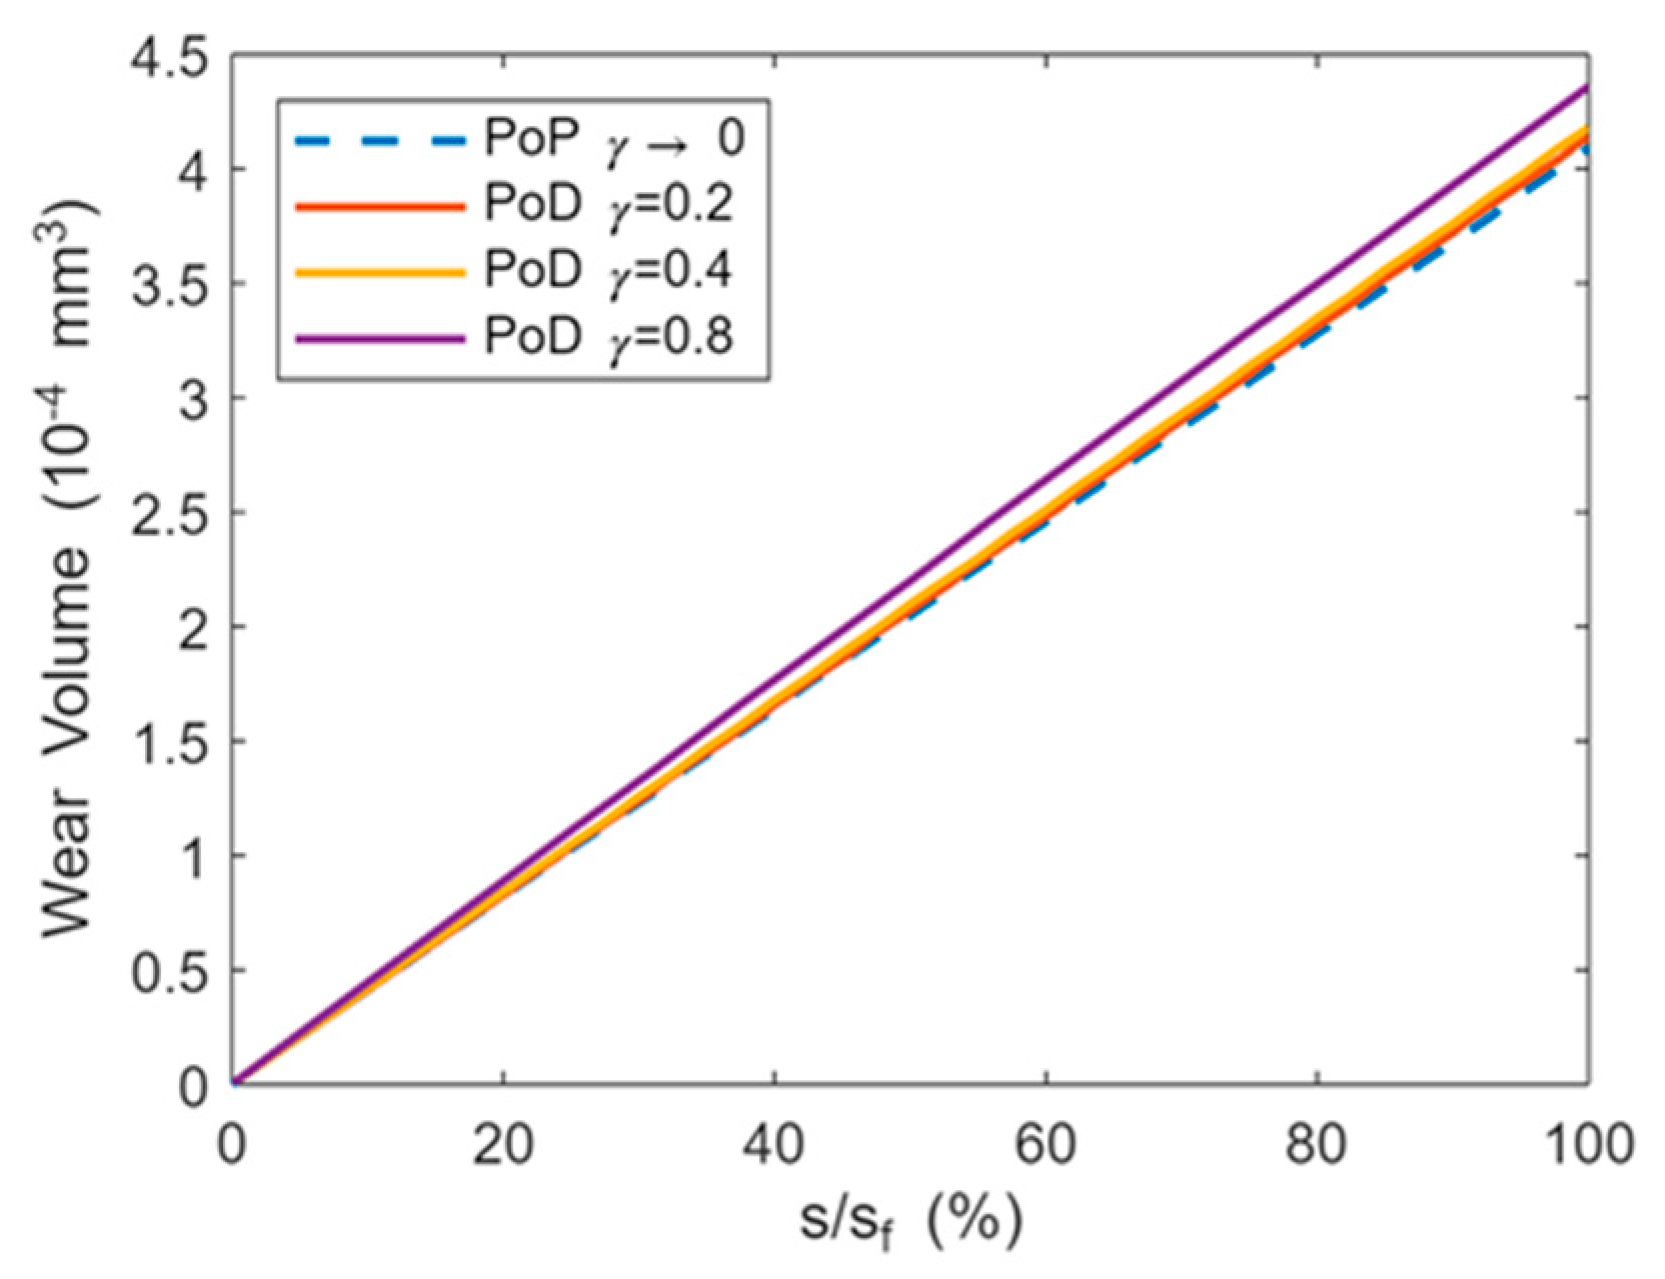
3.1. Corrective Fucntion for Wear Volume in PoD Tests

The differences between the wear volumes predicted for different γ values, both using FE and analytical models, demonstrate that the Archard law in the global form V = k F s (Equation (1)) holds only for a translating body under constant load; thus, while it is correct for PoP wear tests, it can provide only an approximation for PoD tests where a relative rotation pin-disk occurs. To capture the effect of such a rotational effect, the application of the Archard law in local instantaneous is required, i.e., h ˙ P , t = k   p P , t   v P , t (Equation (4)). From a quantitative point of view, the adoption of Equations (1) and (2) for PoD tests introduces an error which increases by reducing the distance between the pin and the disk axis up to 6% for γ = 0.8 , whilst it tends to zero when the pin is far away from the disk axis, i.e., in conditions similar to the PoP. By means of an analytical approach, assuming a uniform pressure distribution also for PoD cases in the transient phase, a nondimensional function g( γ ) was introduced in Equation (16), given the ratio between the wear volume in PoD and in PoP for the same load and sliding distance. To estimate such an error, g( γ ) can be approximated with the following quadratic function
g γ 1 + 32 9   π 1 γ 2       f o r     0 γ 1
stating that the ratio is higher for higher γ , i.e., when the pin is closer to the disk axis.

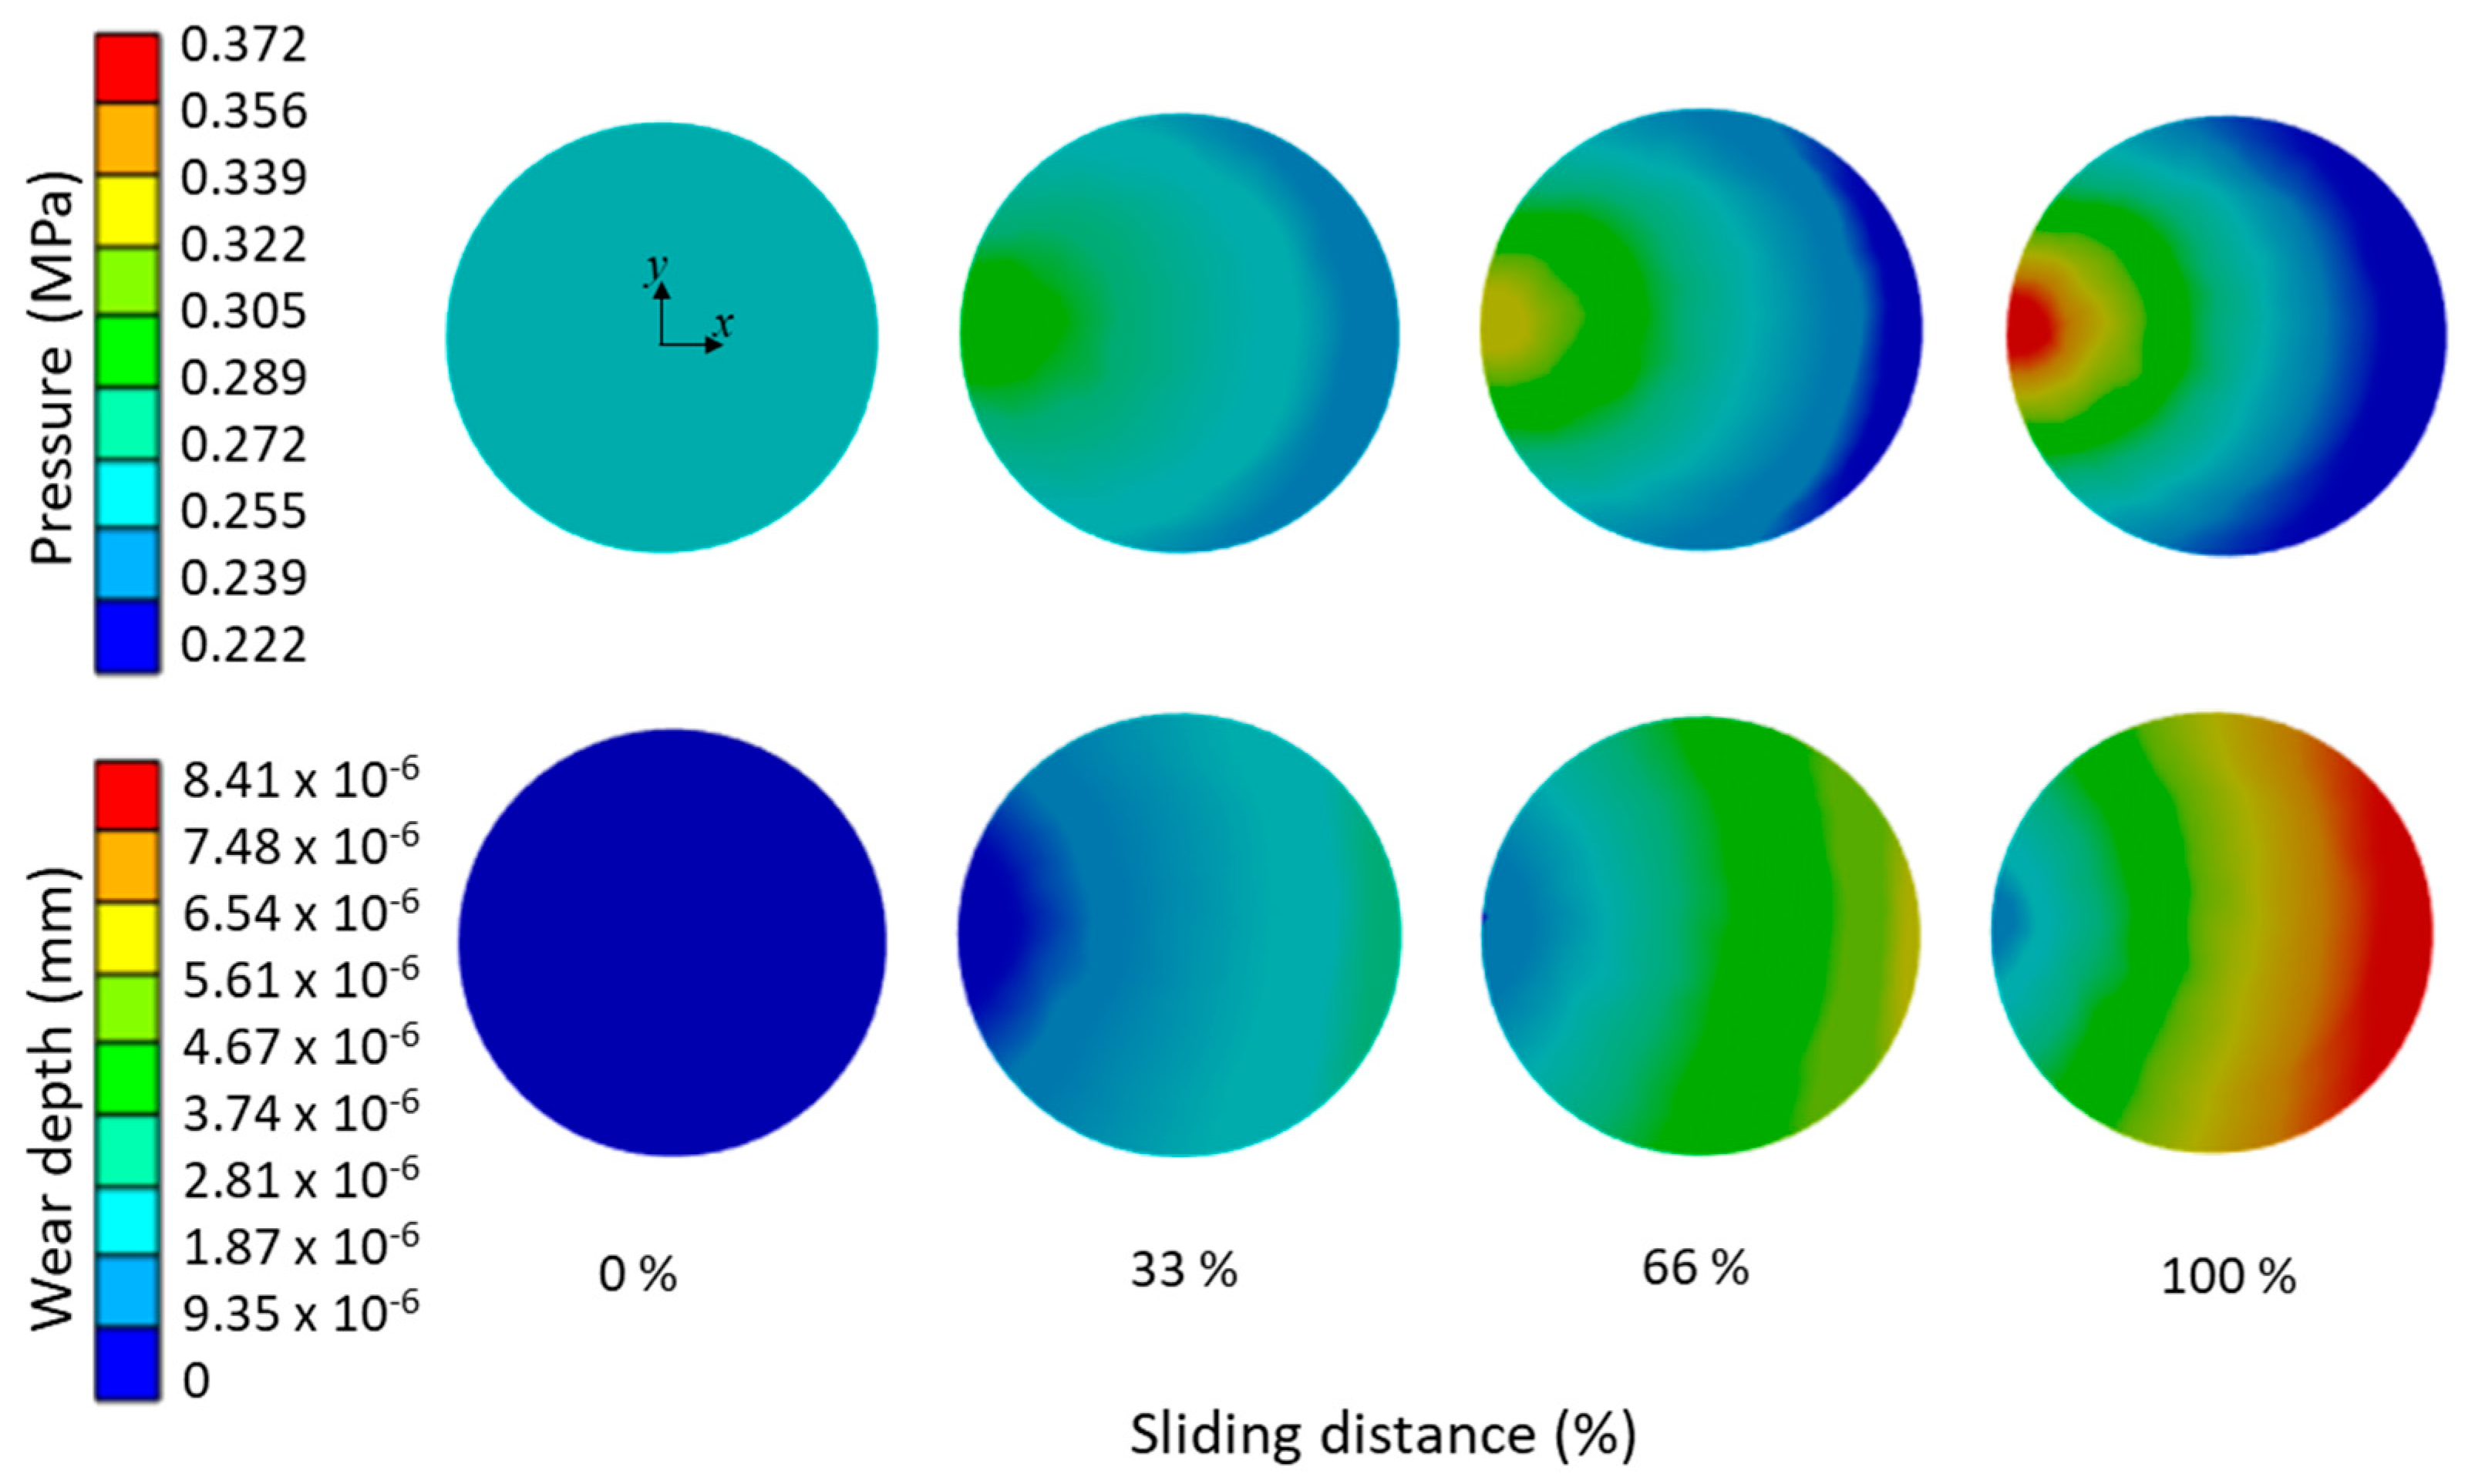
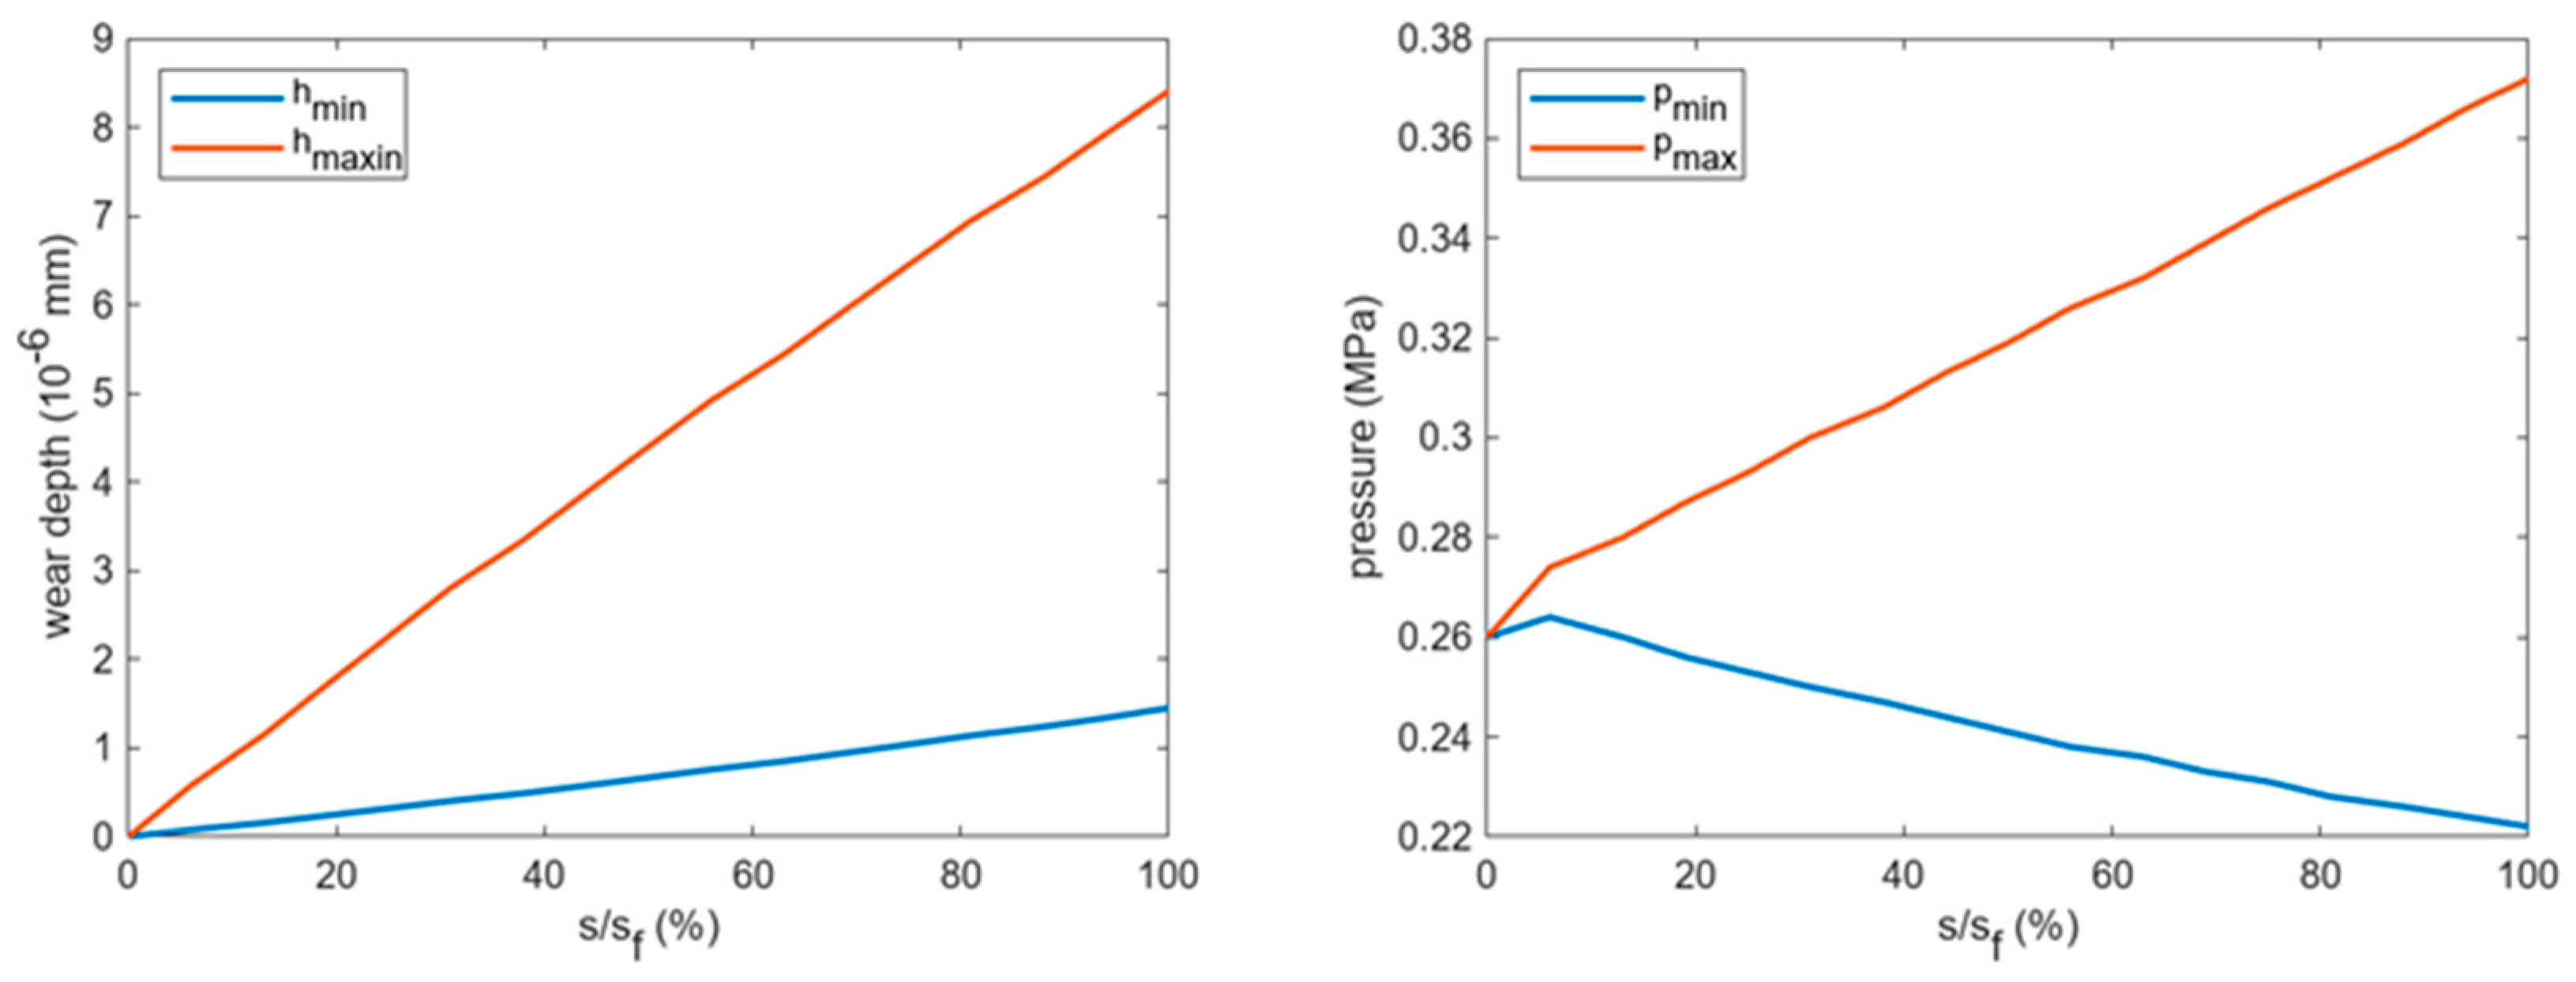
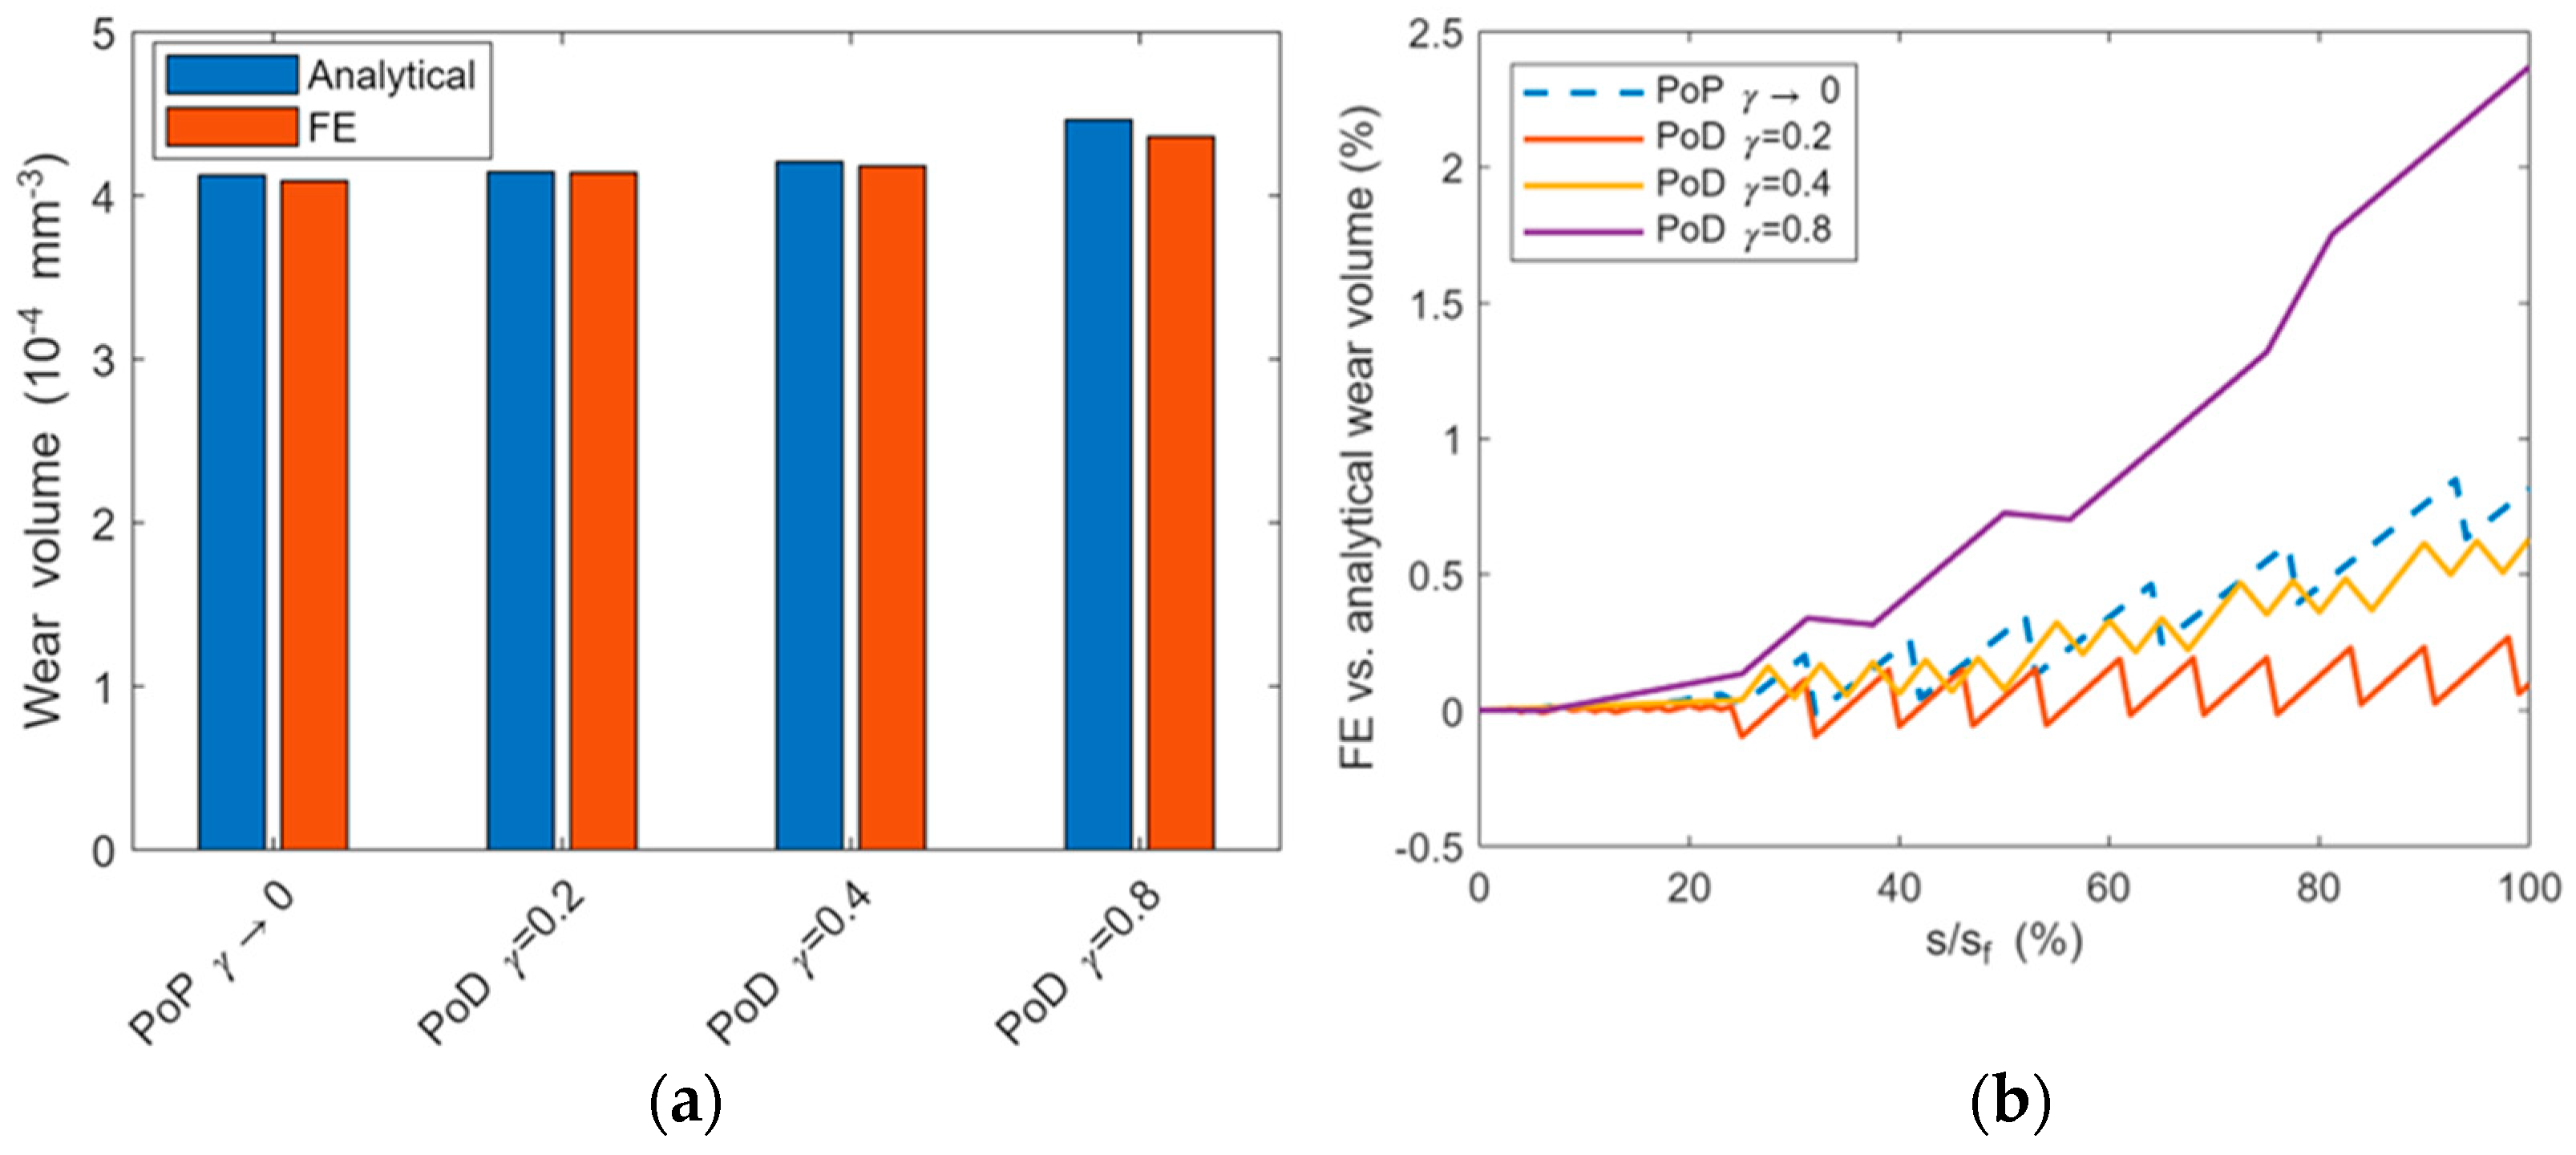
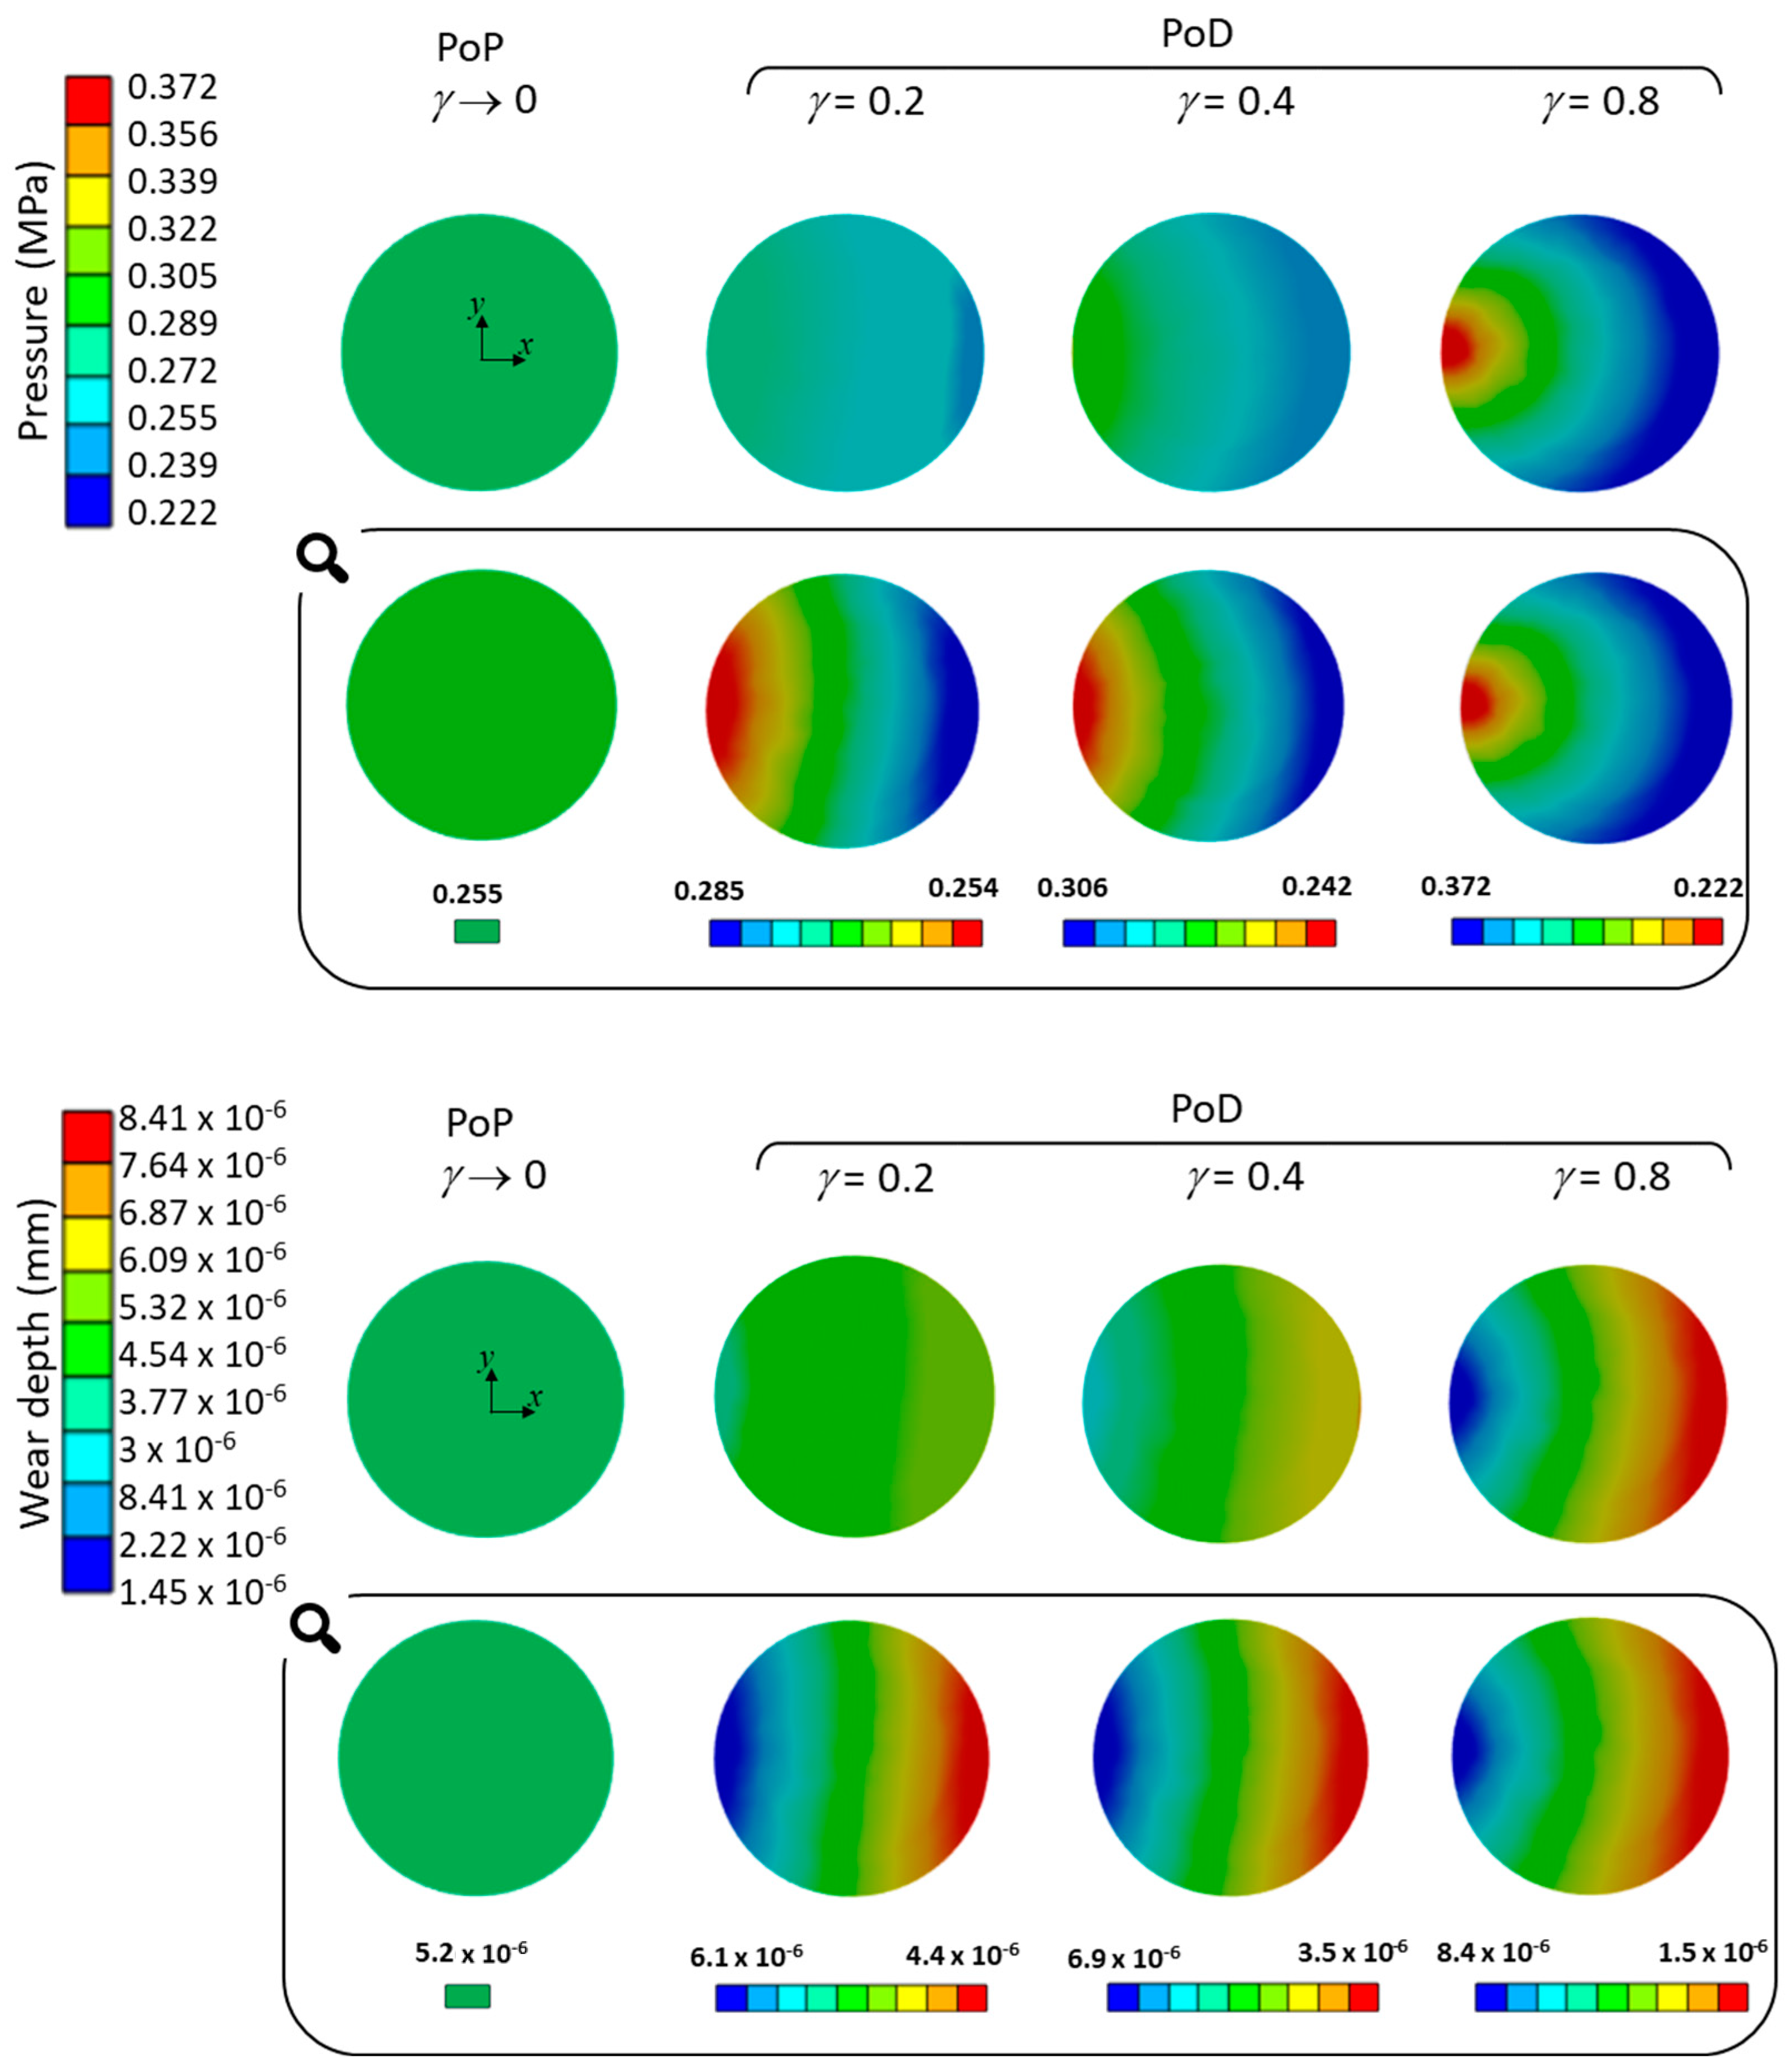
3.2. Effect of the Sliding Distance on Wear and Contact Pressure Distribution

Differences in FE and analytical volumes can be easily appreciated from histograms in Figure 7a, where the final wear volumes are compared. A good agreement between the two approaches can be observed with differences below 0.8%, with the exception of the case γ = 0.8 for which we obtained a 2.4% deviation. Figure 7b shows that the error increases with the sliding distance, particularly for the PoD case with γ = 0.8, i.e., the lowest track radius.
This error can be explained with the approximation of uniform contact pressure at the base of the analytical approach, as cleared below. The maps of the contact pressure at the same final sliding distance for the four examined cases are reported at the top of Figure 8. The maps of each case are shown both on the same scale (first row) and in their own full scale (second row) to highlight the main characteristics and ease the discussion. For the PoP test, the contact pressure was uniform over the contact area (with p = 0.255 MPa) whilst this was not so in the PoD cases, which showed a pressure gradient as the pressure was higher in the region closer to the disk axis (at Rm) and lower when farther from it (at RM). The results are in agreement with the literature studies on brakes, e.g., [11]. Additionally, the pressure gradient was more marked for higher values of γ , which means that the pin was closer to the disk axis.
In the case of PoP, the uniform contact pressure combined to uniform sliding velocity/distance over the pin surface, caused a uniform wear depth, as shown at the bottom of Figure 8. Differently, a gradient of the wear depth was predicted in all PoD cases as the opposite to the pressure one, with the minimum values at Rm and the maximum ones at RM. As for the pressure, the gradient of the wear depth increased with γ values. At the end of the test, the surface was no longer planar.
In order to fully understand the contact pressure and wear maps for the PoD tests, it is necessary to consider what happens during the wear tests, and thus their evolution with the sliding distance. For brevity, only the case γ = 0.8 is detailed, being the most interesting and peculiar one. The evolution of pressure and wear depth during the simulation are reported in Figure 9 for four instants; in addition to the initial/unworn and final conditions, data at 1/3 and 2/3 sf were considered. It can be observed that initially, pressure was uniformly distributed, as in the PoP case. During the test, a redistribution of contact pressure occurred, which can be explained considering the different sliding distance of the pin points: those farther from the disk axis describe a longer trajectory with respect to those nearer to the axis. It must be noted that while pressure distribution evolves, its integral remains the same, corresponding to the external load. Consequently, the wear rate is higher on the outer part of the pin surface, which becomes curved, and this causes a pressure reduction. The trend of the maximum and minimum values of the contact pressure (pmax, pmin) and the wear depth (hmax, hmin) with the sliding distance is well depicted in Figure 10. It can be observed that at the final sliding distance, the percentage pressure difference (pmaxpmin) with respect to the initial value p was of 57.6%, while the percentage difference in the wear depth (hmaxhmin) with respect to its average value (hmax + hmin)/2 was 141%.
Similar considerations hold for all the PoD cases but in a more limited way, as proven via data in Table 1.
This effect for which a higher sliding distance causes a reduction in pressure is expected to reach an equilibrium in a kind of stationary wear evolution that is not caught in the present simulation.
It is worth stressing that the standard ASTM G99 [1] suggests a track radius R d within the range of 12.5–17.5 mm for a pin with r p = 5   m m , as in the present case, corresponding to 0.286 γ 0.4. Actually, the standard suggests a spherical head for the pin so that the contact area is very small (initially) and the case is equivalent to γ 0 . Until wear causes an important increment of the contact area, for a PoD test with a spherical pin, Equation (2) can be applied. An estimation of the extension of the contact area may be obtained through the simple formulation proposed by the authors in [16].

4. Conclusions

The present study provides analytical proof that a different form of the Archard wear law should be considered for PoP and PoD tests, particularly for flat-ended pins. Thus, while the equation k = V/(F s) is correctly applied to the PoP case, i.e., a translational relative motion, a rotational effect is observed in PoD tests which varies with the distance between the pin and disk axes. This effect should be considered when estimating k. To this purpose, a simple quadratic corrective factor g( γ ) , where γ = r p / R d , is proposed in this study. It is worth stressing that this effect is present also in spherical headed pins, for which the contact area, thus also γ , increases with wear.
In conclusion, the present study highlights the need to deepen the methodology for k estimation, currently not even described in the ASTM standards [1,3]. The errors introduced through neglecting the rotational effect in PoD tests could explain in part the high data dispersion of the k values reported in experimental studies. The hypothesis of a constant k should be taken with caution, even for metallic materials traditionally used in tribo-couples, and the real contact conditions should be considered in its estimation, particularly for plastic materials such as the UHMWPE characterized by cross-shearing [17,18]. Such aspects will be tackled in future studies.
The present study is focused on the initial transient phase of the wear process, because of the high computational costs; indeed, very small time increments were necessary to describe the circular trajectories of contact points with a good accuracy. However, a steady phase is expected to be achieved at a longer sliding distance, characterized by a constant contact wear rate and thus also a constant contact pressure distribution. This phase is going to be investigated in future studies where an accelerated procedure for wear simulations is going to be pursued to reduce the computational costs [19,20].

Author Contributions

Conceptualization, F.D.P. and L.M.; methodology, F.D.P. and L.M.; software, A.D.P.; validation, F.D.P.; formal analysis, F.D.P. and L.M.; data curation, A.D.P.; writing—review and editing, F.D.P. and L.M.; funding acquisition, F.D.P. All authors have read and agreed to the published version of the manuscript.

Funding

National Recovery and Resilience Plan (PNRR), Mission 4, Component 2, Investment 1.4, “National Centre for HPC, BigData and Quantum Computing”, European Union-Next Generation EU.

Data Availability Statement

The data presented in this study are available on request from the corresponding author.

Conflicts of Interest

The authors declare no conflicts of interest. The funders had no role in the design of the study; in the collection, analyses, or interpretation of data; in the writing of the manuscript; or in the decision to publish the results.

References

  1. ASTM G99; Test Method for Wear Testing with a Pin-on-Disk Apparatus. ASTM: West Conshohocken, PA, USA, 2017.
  2. ASTM D4170-16; Standard Test Method for Fretting Wear Protection by Lubricating Greases. ASTM: West Conshohocken, PA, USA, 2017.
  3. ASTM G133; Standard Test Method for Linearly Reciprocating Ball-on-Flat Sliding Wear. ASTM: West Conshohocken, PA, USA, 2016.
  4. Liu, H.; Chen, Y.; Wang, X.; Guo, Y.; Xue, W.; Li, D.; Chen, X.-Q. Correlating Numerical Modelling with Experimental Studies to Quantify the Wear Resistance of High-Carbon Chromium Bearing Steel in Mixed Lubrication. Tribol. Int. 2023, 188, 108819. [Google Scholar] [CrossRef]
  5. Bastola, A.; McCarron, R.; Shipway, P.; Stewart, D.; Dini, D. Experimental and Numerical Investigations of Sliding Wear Behaviour of an Fe-Based Alloy for PWR Wear Resistance Applications. Wear 2024, 540–541, 205186. [Google Scholar] [CrossRef]
  6. Bastola, A.; Stewart, D.; Dini, D. Three-Dimensional Finite Element Simulation and Experimental Validation of Sliding Wear. Wear 2022, 504–505, 204402. [Google Scholar] [CrossRef]
  7. Mattei, L.; Di Puccio, F. How Accurate Is the Archard Law to Predict Wear of UHMWPE in Hard-on-Soft Hip Implants? A Numerical and Experimental Investigation. Tribol. Int. 2023, 187, 108768. [Google Scholar] [CrossRef]
  8. Archard, J.F. Contact and Rubbing of Flat Surfaces. J. Appl. Phys. 1953, 24, 981–988. [Google Scholar] [CrossRef]
  9. Lancaster, J.K. The Influence of Substrate Hardness on the Formation and Endurance of Molybdenum Disulphide Films. Wear 1967, 10, 103–117. [Google Scholar] [CrossRef]
  10. Matkovič, S.; Pogačnik, A.; Kalin, M. Wear-Coefficient Analyses for Polymer-Gear Life-Time Predictions: A Critical Appraisal of Methodologies. Wear 2021, 480–481, 203944. [Google Scholar] [CrossRef]
  11. Borawski, A. Testing Passenger Car Brake Pad Exploitation Time’s Impact on the Values of the Coefficient of Friction and Abrasive Wear Rate Using a Pin-on-Disc Method. Materials 2022, 15, 1991. [Google Scholar] [CrossRef] [PubMed]
  12. Hatam, A.; Khalkhali, A. Simulation and Sensitivity Analysis of Wear on the Automotive Brake Pad. Simul. Model. Pract. Theory 2018, 84, 106–123. [Google Scholar] [CrossRef]
  13. Reichelt, M.; Cappella, B. Large Scale Multi-Parameter Analysis of Wear of Self-Mated 100Cr6 Steel—A Study of the Validity of Archard’s Law. Tribol. Int. 2021, 159, 106945. [Google Scholar] [CrossRef]
  14. Põdra, P.; Andersson, S. Simulating Sliding Wear with Finite Element Method. Tribol. Int. 1999, 32, 71–81. [Google Scholar] [CrossRef]
  15. Mattei, L.; Di Puccio, F. Frictionless vs. Frictional Contact in Numerical Wear Predictions of Conformal and Non-Conformal Sliding Couplings. Tribol. Lett. 2022, 70, 115. [Google Scholar] [CrossRef]
  16. Di Puccio, F.; Mattei, L. Simple Analytical Description of Contact Pressure and Wear Evolution in Non-Conformal Contacts. Tribol. Int. 2023, 178, 108084. [Google Scholar] [CrossRef]
  17. Liu, F.; Galvin, A.; Jin, Z.; Fisher, J. A New Formulation for the Prediction of Polyethylene Wear in Artificial Hip Joints. Proc. Inst. Mech. Eng. H 2011, 225, 16–24. [Google Scholar] [CrossRef] [PubMed]
  18. Liu, F.; He, Y.; Gao, Z.; Jiao, D. Enhanced Computational Modelling of UHMWPE Wear in Total Hip Joint Replacements: The Role of Frictional Work and Contact Pressure. Wear 2021, 482–483, 203985. [Google Scholar] [CrossRef]
  19. Joshi, V.; Ramkumar, P. Transient Wear FEA Modelling Using Extrapolation Technique for Steel-on-Steel Dry Sliding Contact. Tribol. Online 2022, 17, 162–174. [Google Scholar] [CrossRef]
  20. Yan, L.; Guan, L.; Wang, D.; Xiang, D. Application and Prospect of Wear Simulation Based on ABAQUS: A Review. Lubricants 2024, 12, 57. [Google Scholar] [CrossRef]
Figure 1. Schemes of pin-on-plate (PoP) (a) and pin-on-disk (PoD) (b) wear tests.
Lubricants 12 00134 g001
Figure 2. Schemes of the simulated PoP (a) and PoD (b) wear tests with the boundary conditions adopted in respective FE models.
Lubricants 12 00134 g002
Figure 3. FE model of PoP (a) and PoD (b) wear tests and details on the mesh (c).
Lubricants 12 00134 g003
Figure 4. Main geometrical parameters used in Equations (9)–(15).
Lubricants 12 00134 g004
Figure 5. Trend of the function g γ of Equation (14).
Lubricants 12 00134 g005
Figure 6. Wear volumes predicted via the FE vs. sliding distance, sf = 157.08 mm.
Lubricants 12 00134 g006
Figure 7. Comparison of the wear volumes predicted via the FE wear models and analytical formulations: (a) histograms of the final wear volumes, (b) errors in volume estimations between FE and analytical results. Final sliding distance sf = 157.08 mm.
Lubricants 12 00134 g007
Figure 8. Maps of the contact pressure and wear depth in the four examined cases at the final sliding distance sf = 157.08 mm. For both pressure and wear depth, first row: all the cases are plotted with the same color band; second row: each plot in its color band. ( γ = 0.2 ,   0.4   a n d   0.8 correspond to decreasing Rd = 5, 2.5 and 1.25 rp, respectively).
Lubricants 12 00134 g008
Figure 9. Evolution of the contact pressure (first row) and the wear depth (second row) over the contact area, with increasing sliding distance, from the left to the right. The final sliding distance sf = 157.08 mm corresponds to 100%. (PoD case with γ = 0.8).
Lubricants 12 00134 g009
Figure 10. Evolution of the minimum and maximum wear depth and contact pressure with the sliding distance. Pressure is maximum when the wear depth is minimum and vice versa. (PoD case with γ = 0.8).
Lubricants 12 00134 g010
Table 1. Gradient of pressure and wear depth at the end of the simulation for PoD cases. p is the initial contact pressure.
γ p m a x p m i n p _ 100 2   h m a x h m i n h m a x + h m i n 100
0.212.1%32.5%
0.425%66.4%
0.857.6%141%
Disclaimer/Publisher’s Note: The statements, opinions and data contained in all publications are solely those of the individual author(s) and contributor(s) and not of MDPI and/or the editor(s). MDPI and/or the editor(s) disclaim responsibility for any injury to people or property resulting from any ideas, methods, instructions or products referred to in the content.

