Article

Thermal Stability and High-Temperature Super Low Friction of γ-Fe2O3@SiO2 Nanocomposite Coatings on Steel

Key Laboratory of Education Ministry for Modern Design and Rotor-Bearing System, Xi’an Jiaotong University, Xi’an 710049, China
Lubricants 2024, 12(6), 223; https://doi.org/10.3390/lubricants12060223
Submission received: 6 April 2024 / Revised: 8 June 2024 / Accepted: 15 June 2024 / Published: 17 June 2024
(This article belongs to the Collection Rising Stars in Tribological Research)

Abstract

:
The thermal stability of the γ-Fe2O3@SiO2 nanocomposites and super low friction of the γ-Fe2O3@SiO2 nanocomposite coatings in ambient air at high temperature are investigated in this paper. X-ray diffraction, scanning electron microcopy, transmission scanning electron microcopy, high-temperature tribometer, thermogravimetric analysis and differential scanning calorimetry were used to investigate the microstructure, surface morphology and high-temperature tribological properties of the γ-Fe2O3@SiO2 nanocomposite coatings, respectively. The results show that the γ-Fe2O3@SiO2 nanocomposite with the core–shell structure has excellent thermal stability because the SiO2 shell inhibits the phase transition of the γ-Fe2O3 phase to the α-Fe2O3 phase in the nanocomposites. The temperature of the phase transition in γ-Fe2O3 can be increased from 460 to 829 °C. The γ-Fe2O3@SiO2 nanocomposite coatings exhibit super low friction (0.05) at 500 °C. A high-temperature super low friction mechanism is attributed to γ-Fe2O3 and the tribochemical reactions during sliding.

1. Introduction

Solid lubricants are usually applied to minimize tribology under conditions including a simultaneous occurrence of high temperature in mechanical systems [1,2,3,4,5,6,7,8]. There are multi-functional compounds (DLC films, WS2, h-BN, MXens, etc.) as solid lubricants offering self-lubrication at elevated temperatures [9,10,11,12,13,14]. However, it is well known that it is difficult for a single solid lubricant to meet the requirements of equipment in applications that span a wide range of temperatures. Instead, it is necessary to fabricate the novel coatings with self-lubricating properties as well as high hardness and high wear resistance compactness [15,16]. Nanocomposites are promising candidate materials for high-temperature lubrication [17,18,19,20,21,22,23,24]. The high-performance and low-cost Fe2O3-based nanocomposites are intensively investigated for the potential applications at elevated temperature [25]. For example, high temperature is a typical operating condition for aerospace [26,27,28,29,30]. Our previous work reported high-temperature superlubricity due to an in situ γ-Fe2O3@SiO2 nanocomposite [19,21]. However, there are a few questions regarding the transition mechanism and transition temperature of the γ to α-phase in the γ-Fe2O3@SiO2 nanocomposites as well as the consistency of the mechanical properties and tribological properties of the γ-Fe2O3@SiO2 nanocomposites. Therefore, this paper investigates the thermal stability of nanocomposites. Many researchers have shown that doping improves the mechanical and tribological properties of nanocomposites [31,32,33,34]. Silver is one of the doping elements in the coatings. The nanocomposite coatings exhibit a low coefficient of friction (CoF) [35,36]. The research shows that the Ag element in the coatings is helpful to reduce the CoF of the Ag–Cr2AlC coatings from 25 to 700 °C [37]. However, the mechanical properties of the coatings are relatively low due to the soft metal Ag. Excessive Ag not only reduces the hardness and elastic modulus of Ag-doped coatings but also reduces the adhesion between the coating and the substrate [38,39]. Rare earth not only improves the high-temperature hardness of the coatings but also increases the bonding strength of the reinforcements [40]. Ceria (CeO2) is widely used in many applications, and it is a favorable material in nanocomposites based on the remarkable tribological properties [41,42,43,44,45]. For example, the Cr3C2-NiCrCoMo/nano-CeO2 composite coatings achieve high temperature and a low CoF [43]. Therefore, Ag and CeO2 are used to dope the γ-Fe2O3@SiO2 nanocomposites, and the high-temperature tribological properties and thermal stability of the Ag and CeO2 combined doping of γ-Fe2O3@SiO2 nanocomposite is investigated. The sol–gel technology is useful for the preparation of the magnetic nanocomposites. Firstly, the Ag and CeO2 combined doping of γ-Fe2O3@SiO2 coatings was deposited on steel. Then, the tribological properties of the Ag and CeO2 combined doping of γ-Fe2O3@SiO2 coatings are studied at 500 °C in open air, and the high-temperature antifriction mechanism of the γ-Fe2O3@SiO2 nanocomposite coating is also studied. The aim and novelty of the present work is to investigate the thermal behavior and stability of the high temperature and super low friction of the nanocomposite coatings with the doping of Ag and CeO2, enabling comparisons with our previous paper.

2. Experimental Details

The chemical solvents are Fe(NO3)3·9H2O (98.5 wt%), tetraethyl orthosilicate (TEOS, 98%), HCl (36%), AgNO3 (99.8%) and Ce(NO3)3•6H2O for the preparation of the nanocomposites. The solvents were C2H6O (99.7%) and distilled water. HNO3 (69.2%) is the catalytic agent. All reactants and solvents used in this paper are analytical grade.
We used the following preparation process for the γ-Fe2O3 xerogel. Fe(NO3)3·9H2O was firstly dissolved in EtOH (ethanol, the content of ethanol is 99.7%). Few quantities of nitric acid (HNO3) were introduced to the beaker containing the solution of the mixtures. After 10 h, the sol was packed in a PTFE tube and covered and kept in an oven at 50 °C to obtain γ-Fe2O3 gel. Fe(NO3)3·9H2O was dissolved in ethanol. TEOS was introduced into solution. HNO3 was added until the pH reached 2. After 24 h, AgNO3 solution and Ce(NO3)3•6H2O were poured into sol, and a sol with Ag and CeO2 was achieved.
The sol was prepared on the steel surface by a spray photoresist coating device (EVG101CS, EV Group, Salzburg, Austria). The steel is high-speed tool steel. The sol was vibrated by an ultrasonic machine (YL-31s, Taizhou, China). And then, it was dropped on the surface of the steel. After that, the coatings were dried in a vacuum dry cabinet at 50 °C for 4 h, at 60 °C for 2 h and finally at 80 °C for 2 h, respectively. The coated steel was treated at 200 °C for 1 h and finally at 400 °C for 2 h. The thicknesses of the coatings are 2.2 μm for γ-Fe2O3@SiO2 nanocomposite coatings, 2.9 μm for γ-Fe2O3@SiO2-Ag nanocomposite coatings and 3.3 μm forγ-Fe2O3@SiO2-Ag-CeO2 nanocomposite coatings.
The phase and microstructure of the nanocomposites and the nanocomposite coatings were investigated by D8-Advance X-ray diffraction (XRD) (D8-Advance, Bruker, Saarbrucken, Germany) in the range of 2θ = 10°~90°, using a Cu target (Kα) ceramic tube. The wavelength is adjusted to λ = 0.15406 nm, where the maximum power of the X-ray generator is 3 KW, the voltage is 60 KV, and the rated current is 60 mA. The scanning speed is 8°/min. Subsequently, XRD analysis software (Jade software, 6.0) was used to determine the phase composition of the crystal by searching the JCPDS-Joint Commeette of Power Diffraction Standards. The crystal size can be calculated from Scherrer’s formula: D = 0.89 λ / B cos θ where D—crystal size/nm; λ—wavelength of incident X-ray/λ = 0.15406 nm; θ—diffraction Angle/°; B—corrected diffraction peak half-height width/rad. The microstructure of the nanocomposite coatings was measured by Raman spectroscopy (HR800, Horiba Jobin Yvon, Pairs, France) using a laser with a wavelength of 532 nm. The morphology and composition of the coatings were studied by scanning electron microscope (SEM, S-3000N, Hitachi, Tokyo, Japan) with an energy-dispersive spectroscopy (EDS) system and transmission electron microscope (TEM, G2F300, FEI, Hillsboro, OR, USA). The mechanical tests of the prepared composites are carried out to understand the mechanical properties of the nanocomposites. In this paper, the hardness of the nanocomposite coating was measured by a micro-Vickers hardness tester. The test conditions are as follows: 4.9 g of load was selected, and the force loading time was 15 s. Five different points were selected on the sample for testing, the microhardness was calculated and the average value was taken as the microhardness of the sample. The hardnesses of the γ-Fe2O3@SiO2 nanocomposite coatings, γ-Fe2O3@SiO2-Ag nanocomposite coatings and γ-Fe2O3@SiO2-Ag-CeO2 nanocomposite coatings are about 808 HV, 547 HV and 953 HV.
Thermogravimetric analysis (TG) and differential scanning calorimetry (DSC) were used to conduct synchronous thermal analysis. The relevant information of the change in sample weight with temperature can be obtained from the TG curve, and the weight loss rate of the sample in different temperature ranges can be obtained. The thermal information of the samples at different temperatures can be obtained from the DSC curve. The melting and crystallization processes, glass transition, phase transition, solidification and oxidation stability of samples can be investigated by DSC. By using the same sample in one measurement, synchronous thermal analysis can simultaneously obtain relevant information such as sample mass change with temperature and heat absorption and release. In this study, the TG-DSC curve of the sample was determined by a STA449F5 synchronous thermal analyzer produced by Netsch, Germany. The temperature rise rate was 10 °C/min in atmosphere air, and the test temperature range was from 30 to 1000 °C.
The tribological behaviors of coatings were investigated at 500 °C in open air. The number of the tested samples is three for each group testing. The disc was slid against a ball with the diameter of 9.5 mm at a speed of 0.05 m/s and load of 2 N. The worn surfaces of the samples were studied by optical microscopy. XRD was also applied to observe the microstructure of the worn surfaces of the disc. The material of the ball is ZrO2 and the sliding distance is about 150 m during friction coefficient measurement.

3. Results and Discussion

3.1. Microstructure of Coatings

Figure 1 shows the TEM image and element composites of γ-Fe2O3@SiO2 nanocomposites. The core–shell structures were found in the nanocomposite. The profile of the nanocomposite is close to a cotton-like shape. It can be seen that the color of the outer edge of the composite particle is light, while the inner color is dark. This is because SiO2 and γ-Fe2O3 magnetic nanoparticles do not have the same degree of electron absorption, so there is a relatively obvious contrast and boundary between light and dark. The γ-Fe2O3 nanoparticles are scattered in the amorphous structure of SiO2 in the γ-Fe2O3@SiO2 nanocomposite. This can also indicate that the nanocomposite forms a typical cladding structure with amorphous shells covering nuclei. There are a few elements, including Fe, Si and O, according to the analysis results. The chromium present in the EDS results may come from the substrate of the high-speed tool steel.
Figure 2 shows the XRD and Raman spectra of the γ-Fe2O3@SiO2 nanocomposite coatings. There are three obvious bands at 675 cm−1, 1330 cm−1 and 1585 cm−1. Raman results show that there is SiO2 and γ-Fe2O3. There are peaks of 35.63°, 43.28°and 53.73°, which are all typical bands of γ-Fe2O3 [46]. Two characteristic peaks at 43.28° and 51.69° were observed that can be indexed to (400) and (421). Moreover, the XRD peak at 25° corresponds to amorphous SiO2 shells surrounding γ-Fe2O3 nanoparticles. There is Fe, γ-Fe2O3 and SiO2 in the γ-Fe2O3@SiO2 nanocomposite. We found that there is no other impurity phase in the coatings. The particle sizes of γ-Fe2O3 are between 1 and 100 nm, which belong to the nano-level particles, and the average particle size is about 14.2 nm, so the prepared composite coatings belong to the nanocomposite coatings.
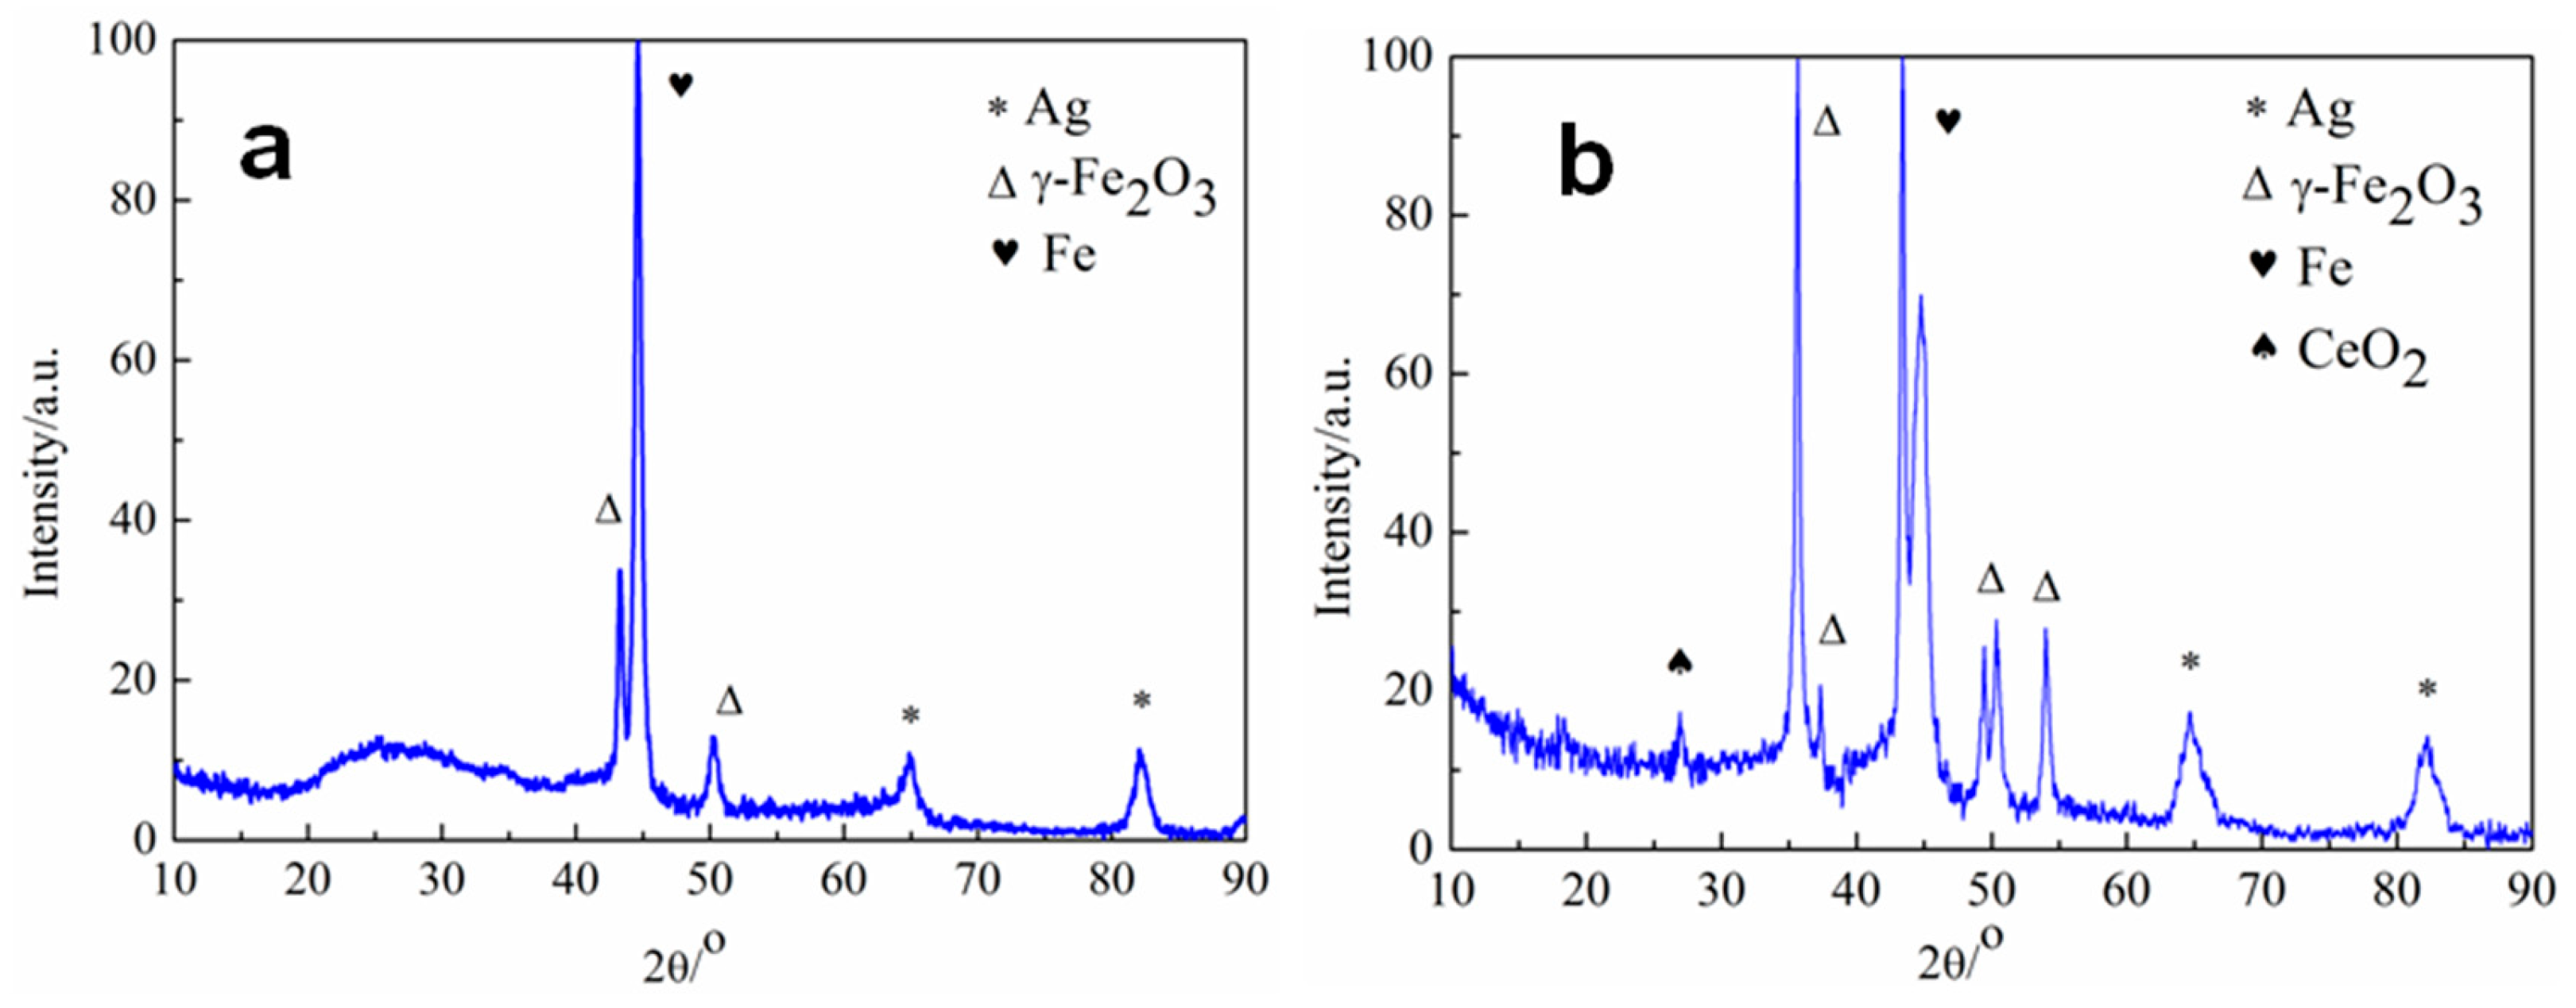
Figure 3 shows the Raman spectra of the Ag and CeO2 doped γ-Fe2O3@SiO2 nanocomposite coatings. The XRD measurement results show that there is SiO2 and γ-Fe2O3. The nanocomposite coating contains γ-Fe2O3, Ag and amorphous SiO2. According to Scherrer’s formula, the average particle sizes of γ-Fe2O3 and Ag in the coating are 14.4 nm and 19.8 nm, respectively, which are slightly different from the average particle size of the γ-Fe2O3@SiO2 nanocomposite coatings. The results show that Ag doping the nanocomposite coatings slightly affects the particle size of γ-Fe2O3. The average particle sizes of the γ-Fe2O3 grains and Ag in CeO2 nanocomposite coating are 9.5 nm and 14.2 nm. Comparing with the γ-Fe2O3@SiO2-Ag nanocomposite coatings, the average particle sizes of γ-Fe2O3 and Ag decrease, indicating that CeO2 is useful to refine the grains [47,48].

3.2. Thermal Stability Analysis of Nanocomposite Coatings

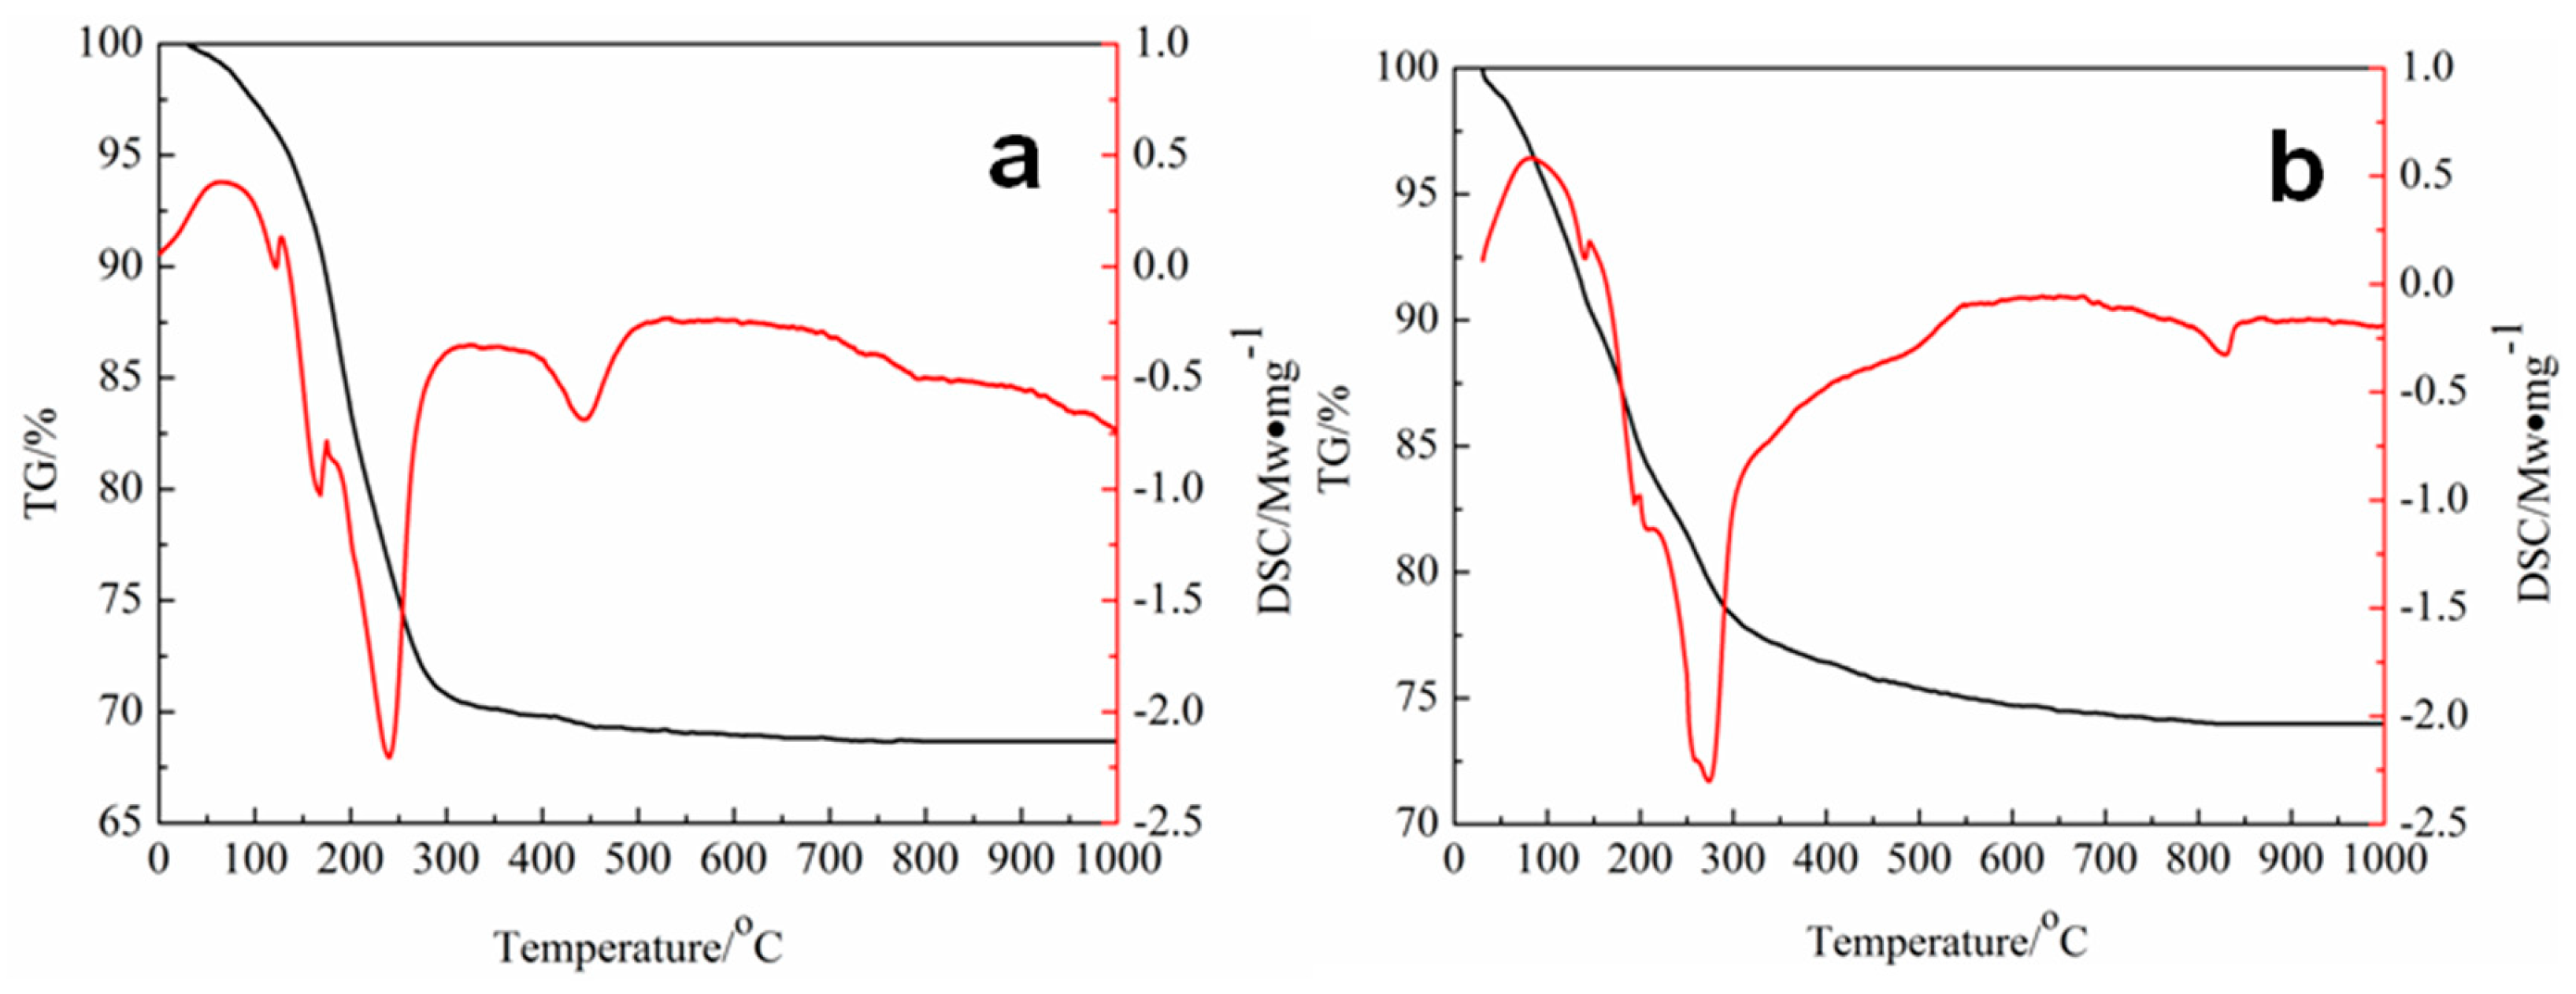
Figure 4 shows the TG/DSC thermal analysis curves of γ-Fe2O3 xerogel and γ-Fe2O3@SiO2 xerogel, respectively. The thermal stability of γ-Fe2O3 is low, and it is in a metastable state. The γ-Fe2O3 is usually transformed into stable α-Fe2O3 when the temperature exceeds 400 °C. A layer of amorphous SiO2 is coated on the surface of γ-Fe2O3 to improve the thermal stability of γ-Fe2O3 [49,50]. The effect of amorphous SiO2 on the phase transition temperature of γ-Fe2O3 is investigated, and γ-Fe2O3 xerogel and γ-Fe2O3@SiO2 xerogel were analyzed by TG/DSC.
It can be seen from Figure 4 that there are five endothermic peaks in the DSC curves of (a) and (b). The positions of the four endothermic peaks are almost the same. The first exothermic peak appears around 84 °C in Figure 4a and around 94 °C in Figure 4b. This endothermic peak is produced by the exothermic heat of organic reagents such as ethanol in the gel network. The second exothermic peak appears around 147 °C in Figure 4a and around 137 °C in Figure 4b. This endothermic peak is caused by disengagement of the desorption water in γ-FeOOH•xH2O. The third endothermic peak is shown around 193 °C in Figure 4a and around 206 °C in Figure 4b. This endothermic peak is caused by the decomposition of nitrate radicals in the gel system. The fourth endothermic peak appears around 263 °C in Figure 4a and around 271 °C in Figure 4b. This endothermic peak corresponding to the dehydroxylation of γ-FeOOH to form γ-Fe2O3, and both absorption peaks are wide. There is also a significant weight loss step corresponding to the TG curve. The weight loss temperature ranges are 217~308 °C and 202~350 °C, respectively. The position of the fifth endothermic peak of the absorption is very different from Figure 4a,b. The fifth endothermic peak appears around 460 °C in Figure 4a and around 829 °C in Figure 4b. Under the TG curve, there are almost no weight loss steps, which indicates that the endothermic peak corresponds to the transition of γ-Fe2O3 to the more stable α-Fe2O3. It is also inferred that the thermal phase transition of the dry gel is γ-FeOOH·xH2O γ-FeOOH γ-Fe2O3 α-Fe2O3 [51]. Comparing Figure 4a,b, it is known that SiO2-coated γ-Fe2O3 has relatively high thermal stability compared with single γ-Fe2O3, and the phase transition temperature of the γ-Fe2O3 phase to the α-Fe2O3 phase increases from 460 to 829 °C.
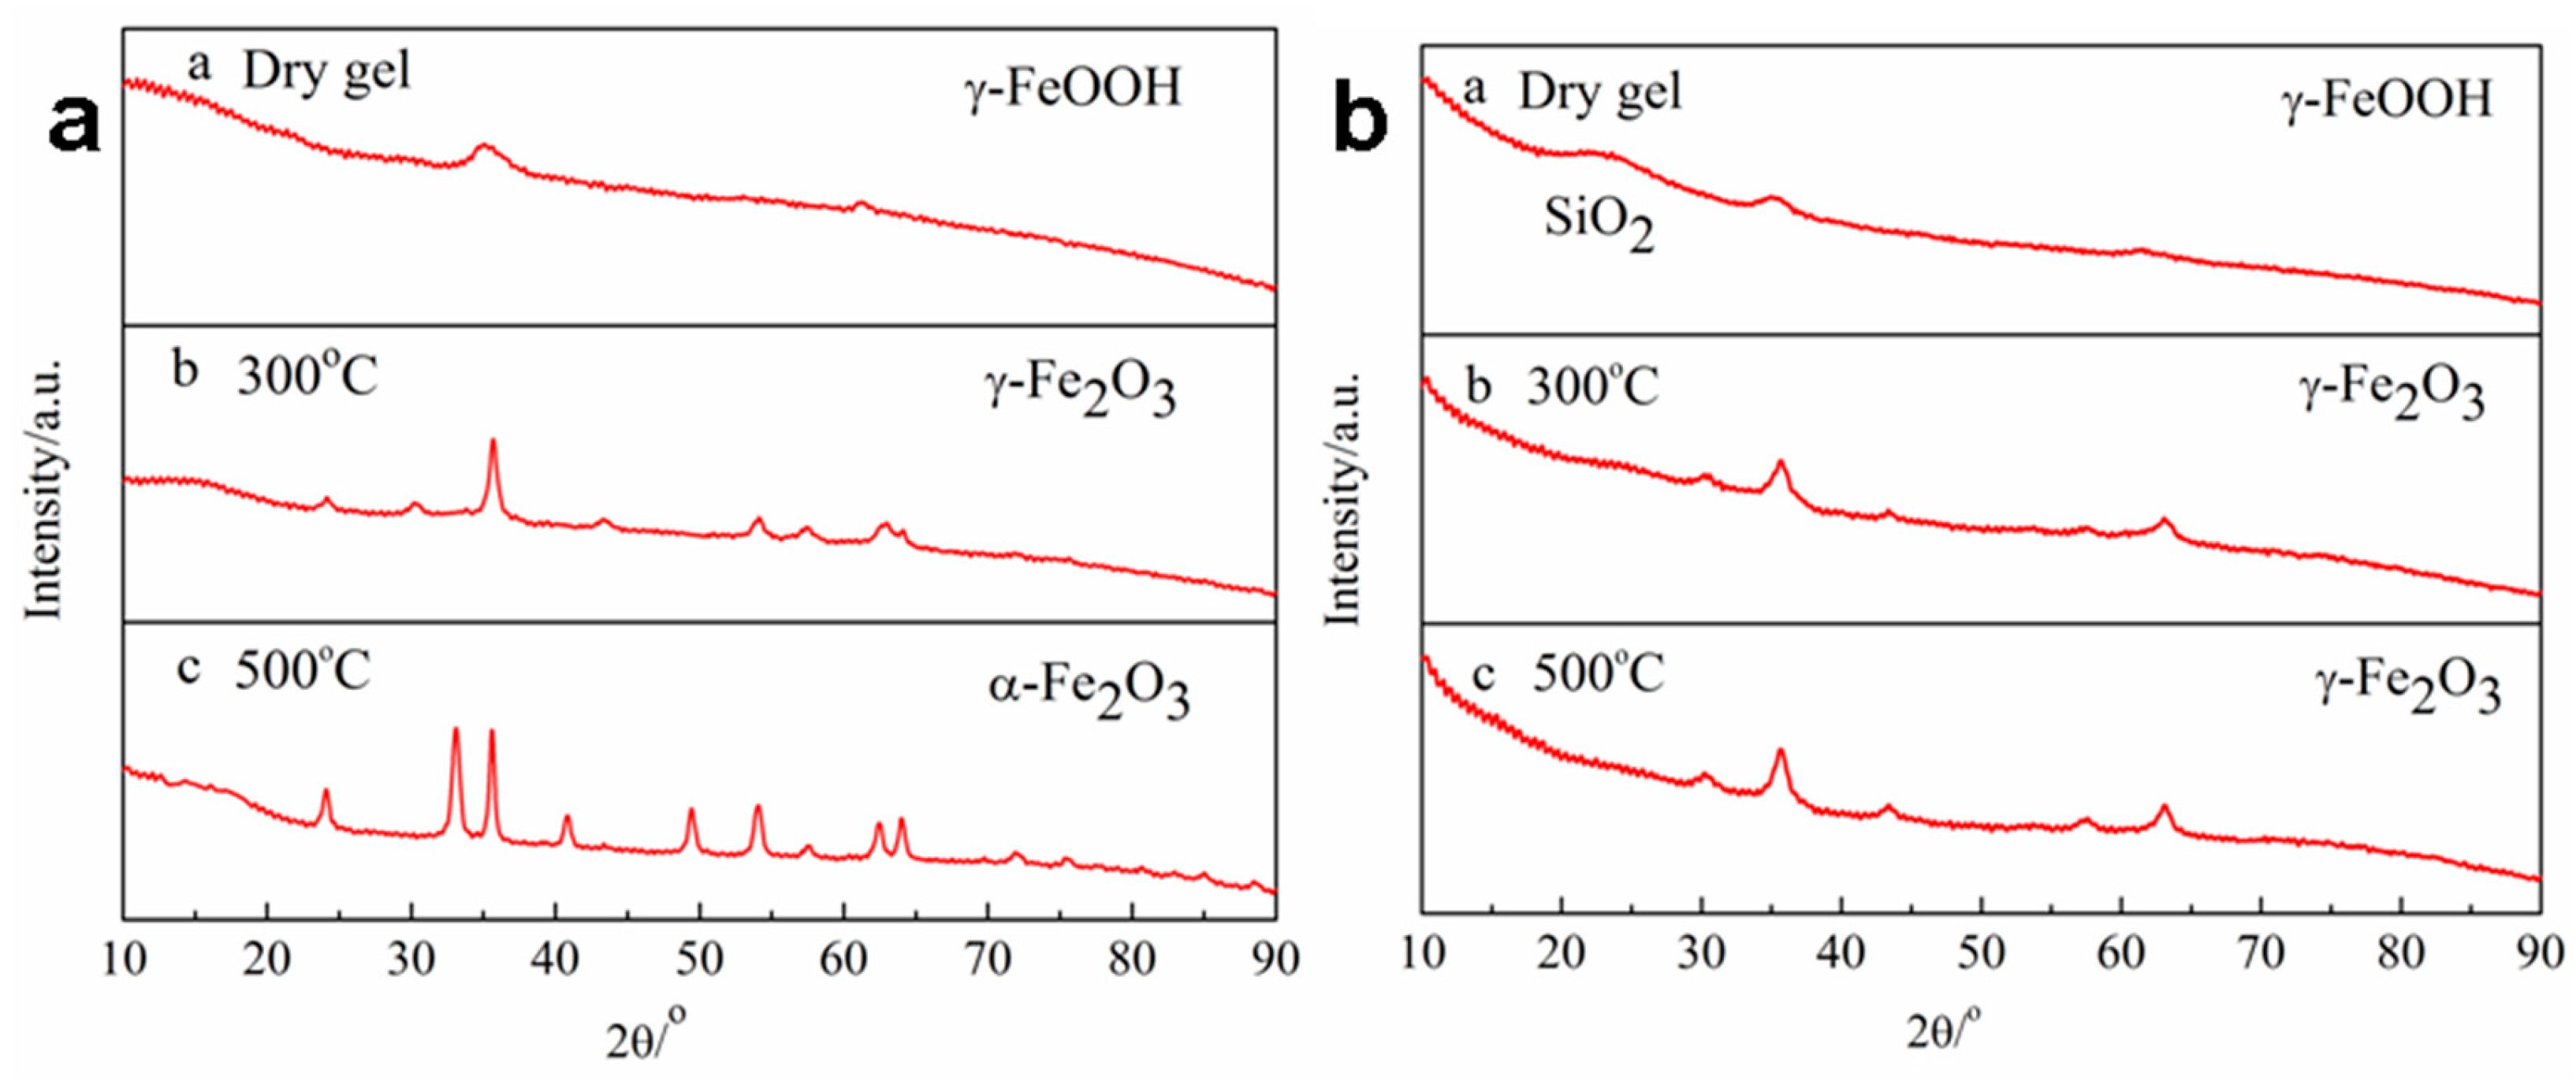
Figure 5 shows the XRD of γ-FeOOH, γ-Fe2O3 and α-Fe2O3 under different heat-treated temperatures, respectively. Figure 5a shows an XRD pattern of a powder sample dried at 50 °C in a drying cabinet. There are two diffraction peaks appearing at 36.39° and 60.67°, which indicates the characteristic peak of γ-FeOOH. The diffraction peak is wide, indicating that the crystallinity of γ-FeOOH is low. Figure 5b shows the XRD pattern of the samples after heat treatment at 300 °C for 2 h. The values of the diffraction peak on the spectrum are 2θ = 24.02°, 30.21°, 35.70°, 43.39°, 53.95°, 57.48°, 63.04°, and 64.16°, which is consistent with the values on the PDF card JCPDS 39-1346, indicating that the samples are decomposed to obtain γ-Fe2O3. The average particle size is given as the geometric mean diameter, expressed in mm or microns (µm), and the range of variation is described by geometric standard deviation [52]. We used the Scherrer equation to calculate the average particle size of the crystals. The Scherrer equation relates to the diffraction peak [53,54]. The instrumental broadening and physical broadening of the sample were measured through the full width half maximum. By utilizing the correction of physical broadening, it will be possible to conduct a follow-up calculation on the crystal size with the Scherrer equation. The average particle size of the γ-Fe2O3 crystal is 13 nm, which is calculated according to the Scherrer formula at this temperature. The heat treatment temperature increases to 500 °C, and the diffraction peak values on the XRD pattern are 2θ = 24.13°, 33.08°, 35.59°, 40.86°, 49.41°, 54.06°, 57.46°, 62.42°, 64.01°, 71.86°, and 75.29°, respectively, consistent with the values on the PDF card JCPDS 33-0664, indicating that γ-Fe2O3 has completely transformed into α-Fe2O3, and the particle crystal form is a hexahedral structure. The Scherrer formula calculates that the average particle size of α-Fe2O3 crystal is 17.1 nm. With the increase in heat treatment temperature, the Fe2O3 particles prepared by the sol–gel method are converted from γ-Fe2O3 to α-Fe2O3, which is also consistent with the thermal analysis results of Fe2O3. In addition, the average particle size of α-Fe2O3 is also larger than that of γ-Fe2O3.
In Figure 3a, a peak appears near 2θ = 25°, indicating the presence of amorphous SiO2 in the sample. In addition, a weak diffraction peak of γ-FeOOH is shown in Figure 5b. After the sample was heat treated at 300 °C for 2 h, the diffraction peaks appeared at 2θ = 30.26°, 35.70°, 43.29°, 57.38°, and 63.14°, which coincided with the values on the PDF card JCPDS 39-1346, indicating that the sample contained γ-Fe2O3, and the average crystal was calculated according to the Scherrer formula. The particle size is 11.9 nm. Figure 5c shows the XRD pattern of the sample after heat treatment at 500 °C for 2 h. The position of the diffraction peak is the same as that of Figure 5b, but the peak intensity becomes slightly high, indicating that the sample has no phase change in γ-Fe2O3. According to Scherrer’s formula, the average crystal grain size is calculated to be 13 nm, indicating that as the temperature increases, the crystal grains are further grown, corresponding to the enhancement of the peak intensity of the XRD pattern. When the heat treatment temperature is 500 °C, the phase change in γ-Fe2O3 in the sample does not occur, which is also consistent with the thermal analysis result of γ-Fe2O3@SiO2.
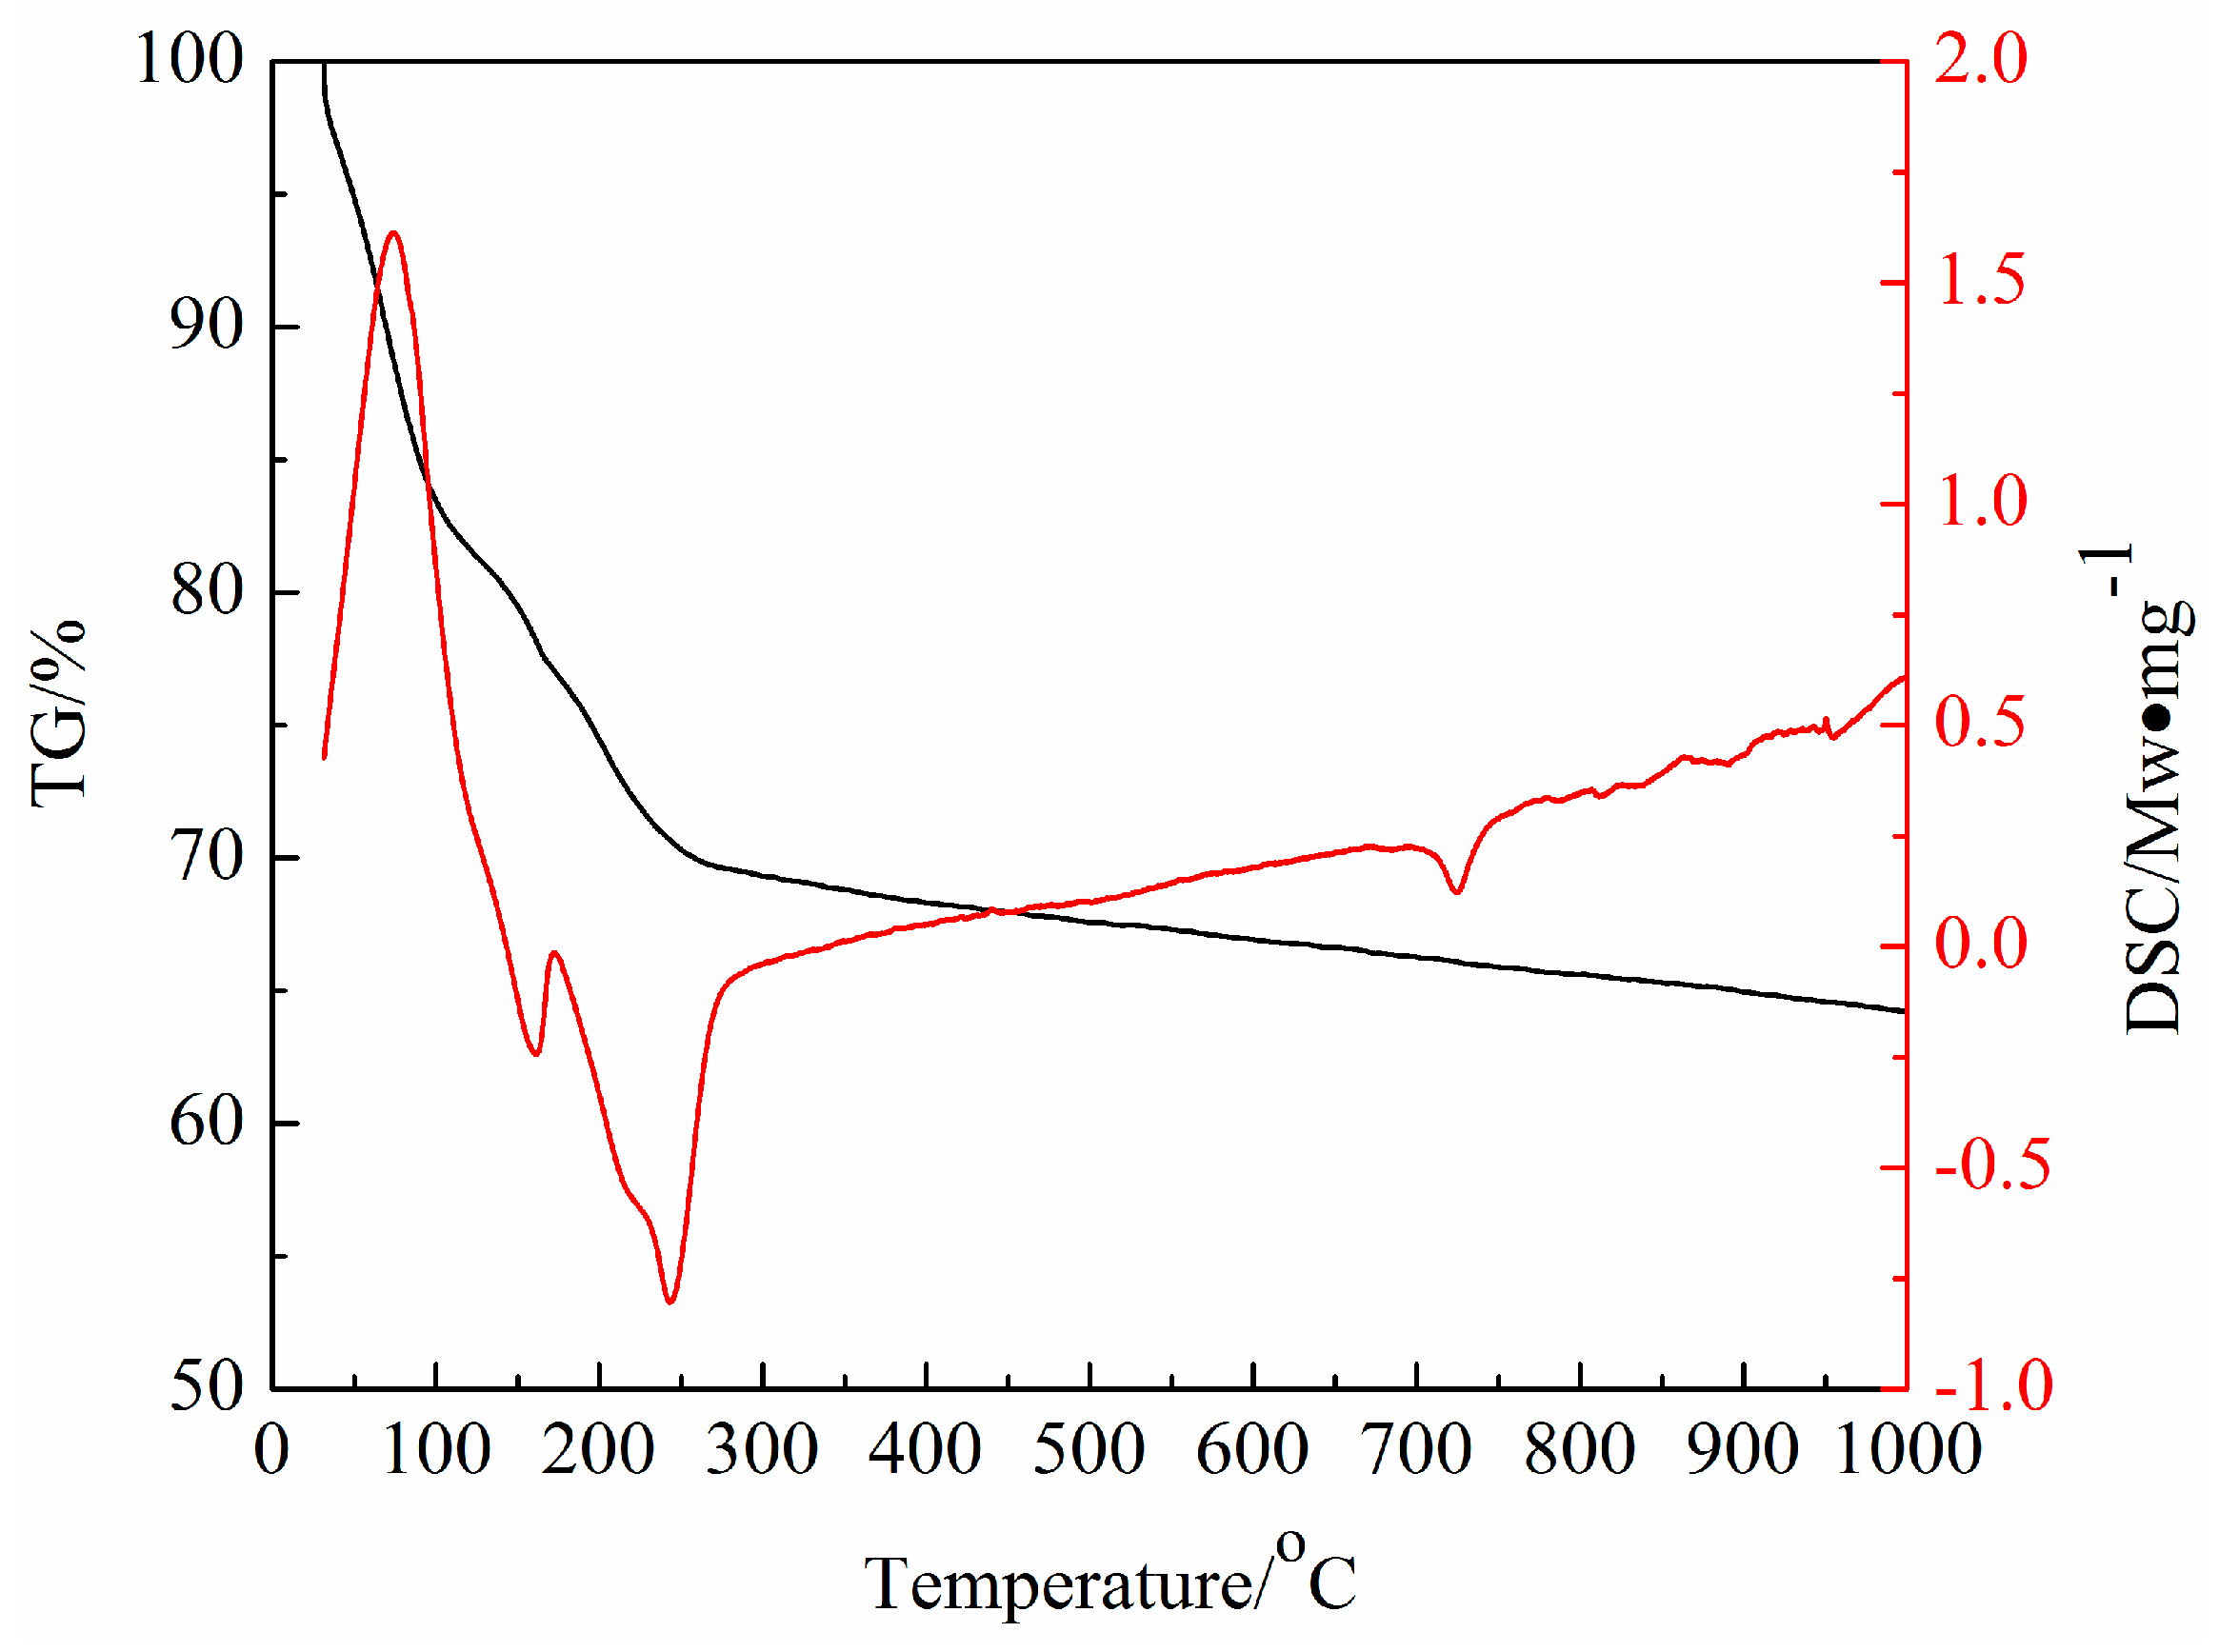
The rare earth element Ce has strong chemical activity and large atomic radius, which can be used as a heterogeneous nucleation point to inhibit grain growth. CeO2 was added to improve the thermal stability of γ-Fe2O3 in γ-Fe2O3@SiO2 nanocomposites. Thermal analysis of the CeO2-doped γ-Fe2O3@SiO2-Ag composite dry gel is studied. Figure 6 shows a TG-DSC curve of γ-Fe2O3@SiO2 gel doped with Ag and CeO2. There are also four stages from Figure 6 during the thermal decomposition process. The weight loss temperature range of the first stage is 30~103 °C. The weight loss rate is 17%, which corresponds to the DSC curve showing an exothermic peak around 74 °C, which is caused by the combustion exotherm of organic reagents such as ethanol in the gel network. The weight loss interval in the second stage is 103~167 °C. The weight loss rate is 6%. In this temperature zone, the DSC curve has an endothermic peak near 161 °C, which corresponds to the decomposition of nitrate in the sample. The third stage weight loss interval is 167~281 °C, and the weight loss rate is 8%, which corresponds to the dehydroxylation of iron oxyhydroxide (FeOOH) producing γ-Fe2O3 in the sample. The fourth stage is 281 °C, where the TG curve becomes almost horizontal, indicating that the sample has almost no weight loss after this temperature. The endothermic peak at 725 °C corresponds to the conversion of γ-Fe2O3 to the stable α-Fe2O3. CeO2 is helpful to refine the grains of the nanocomposites. The average particle size of γ-Fe2O3 in γ-Fe2O3@SiO2-Ag-CeO2 nanocomposite coatings is smaller than that of undoped CeO2 nanocomposite coatings. After when the γ-Fe2O3 grain reduces, the surface energy increases, the energy of the phase change decreases, and the phase transition temperature decreases. It is concluded that the phase transition temperature of γ-Fe2O3 in nanocomposites decreases from 829 to 725 °C after doping CeO2.

3.3. High-Temperature Tribological Properties of Nanocomposite Coatings

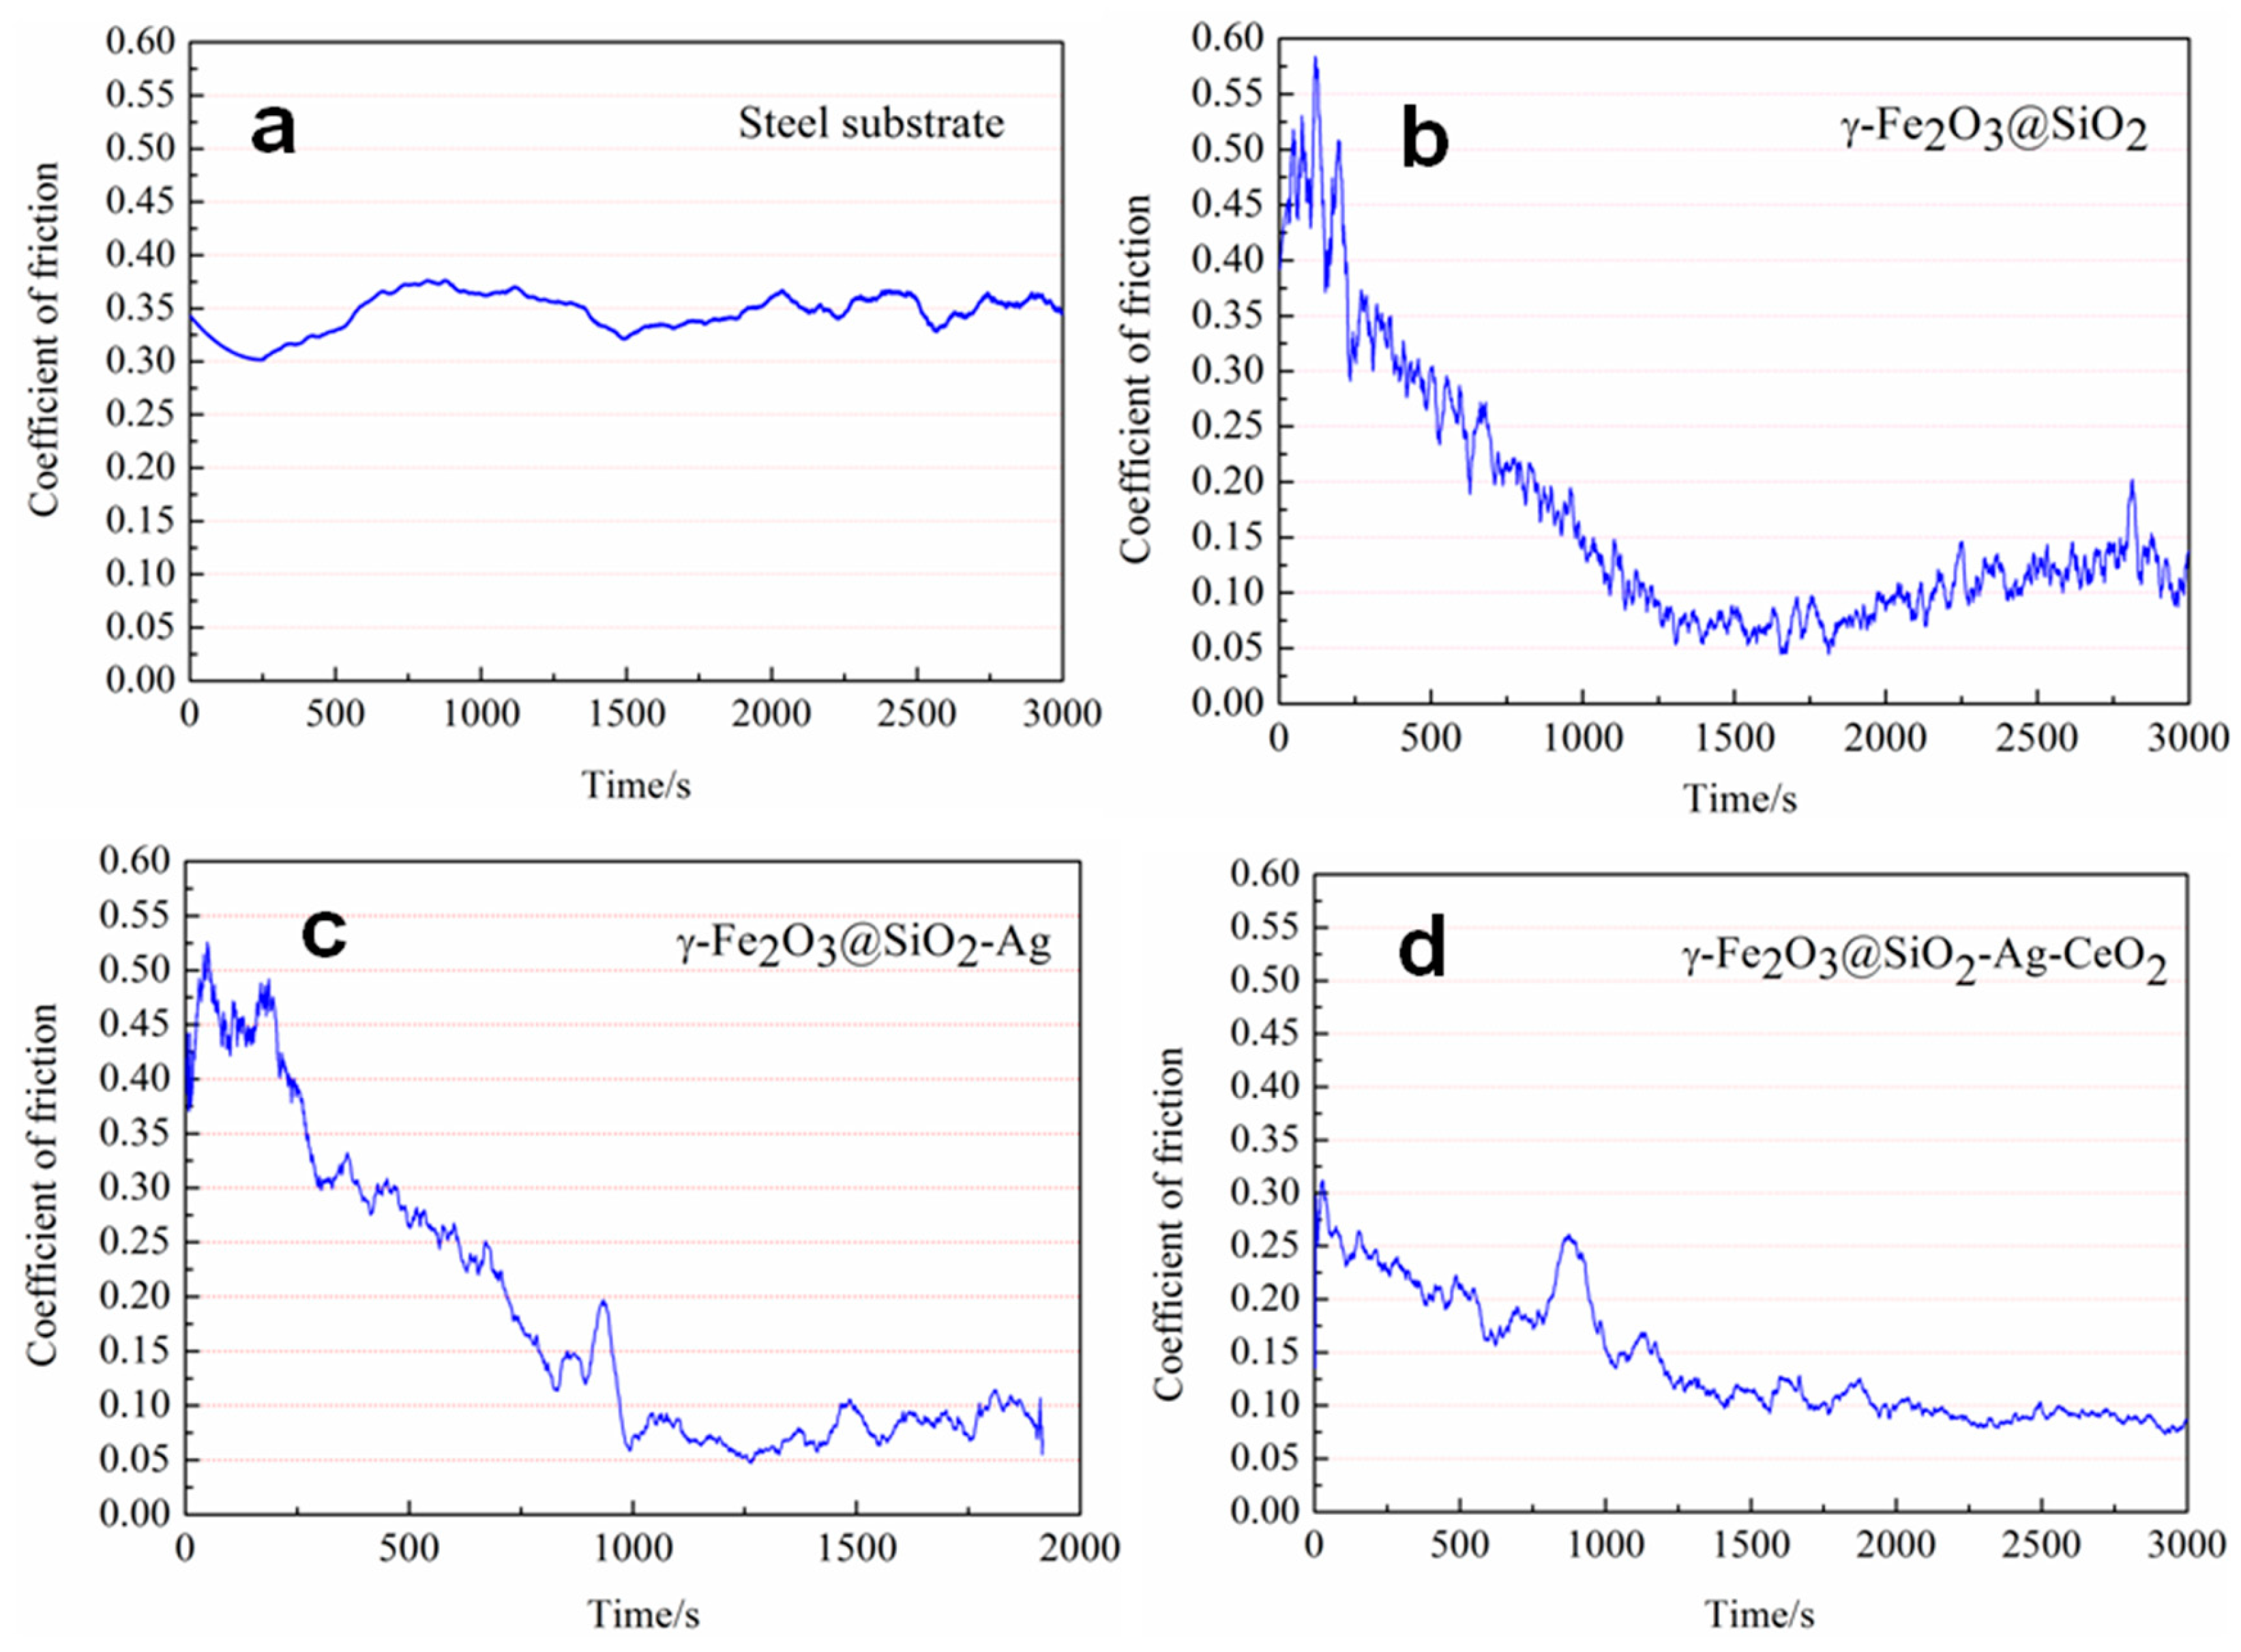
Figure 7 shows the CoF of the nanocomposite coatings in ambient air at 500 °C. The CoF of the steel substrate is 0.34 initially and then fluctuates around 0.35 along with the sliding time. The CoF of the γ-Fe2O3@SiO2 nanocomposite coatings is about 0.44 at the initial stage and then decreases slightly, although CoF increases finally. It is found surprisingly that at the stable stage, the CoF of the nanocomposite coatings is about 0.05, which exhibits super low friction. The CoF of the γ-Fe2O3@SiO2-Ag nanocomposite coatings increases to the maximum value and then decreases. The applied test time to study the CoF values is about 3000 s, because the CoF of the friction pair becomes stable at about 1000 s. The CoF of the γ-Fe2O3@SiO2-Ag nanocomposite coatings is about 0.39 at the initial stage and then decreases to 0.05 after 1500 s; finally, CoF increases slowly to the end of the tribotest. The CoF of the γ-Fe2O3@SiO2-Ag-CeO2 nanocomposite coatings is about 0.3 at initial stage; then, the CoF decreases slightly to 0.06 at the stable stage. During the sliding, there are few periods in the CoF values. CoF firstly increases and then decreases. From the previous work [19,21], it is found that the suggested composite can have a good CoF at high temperature, especially at 500 °C, not only at high temperature.
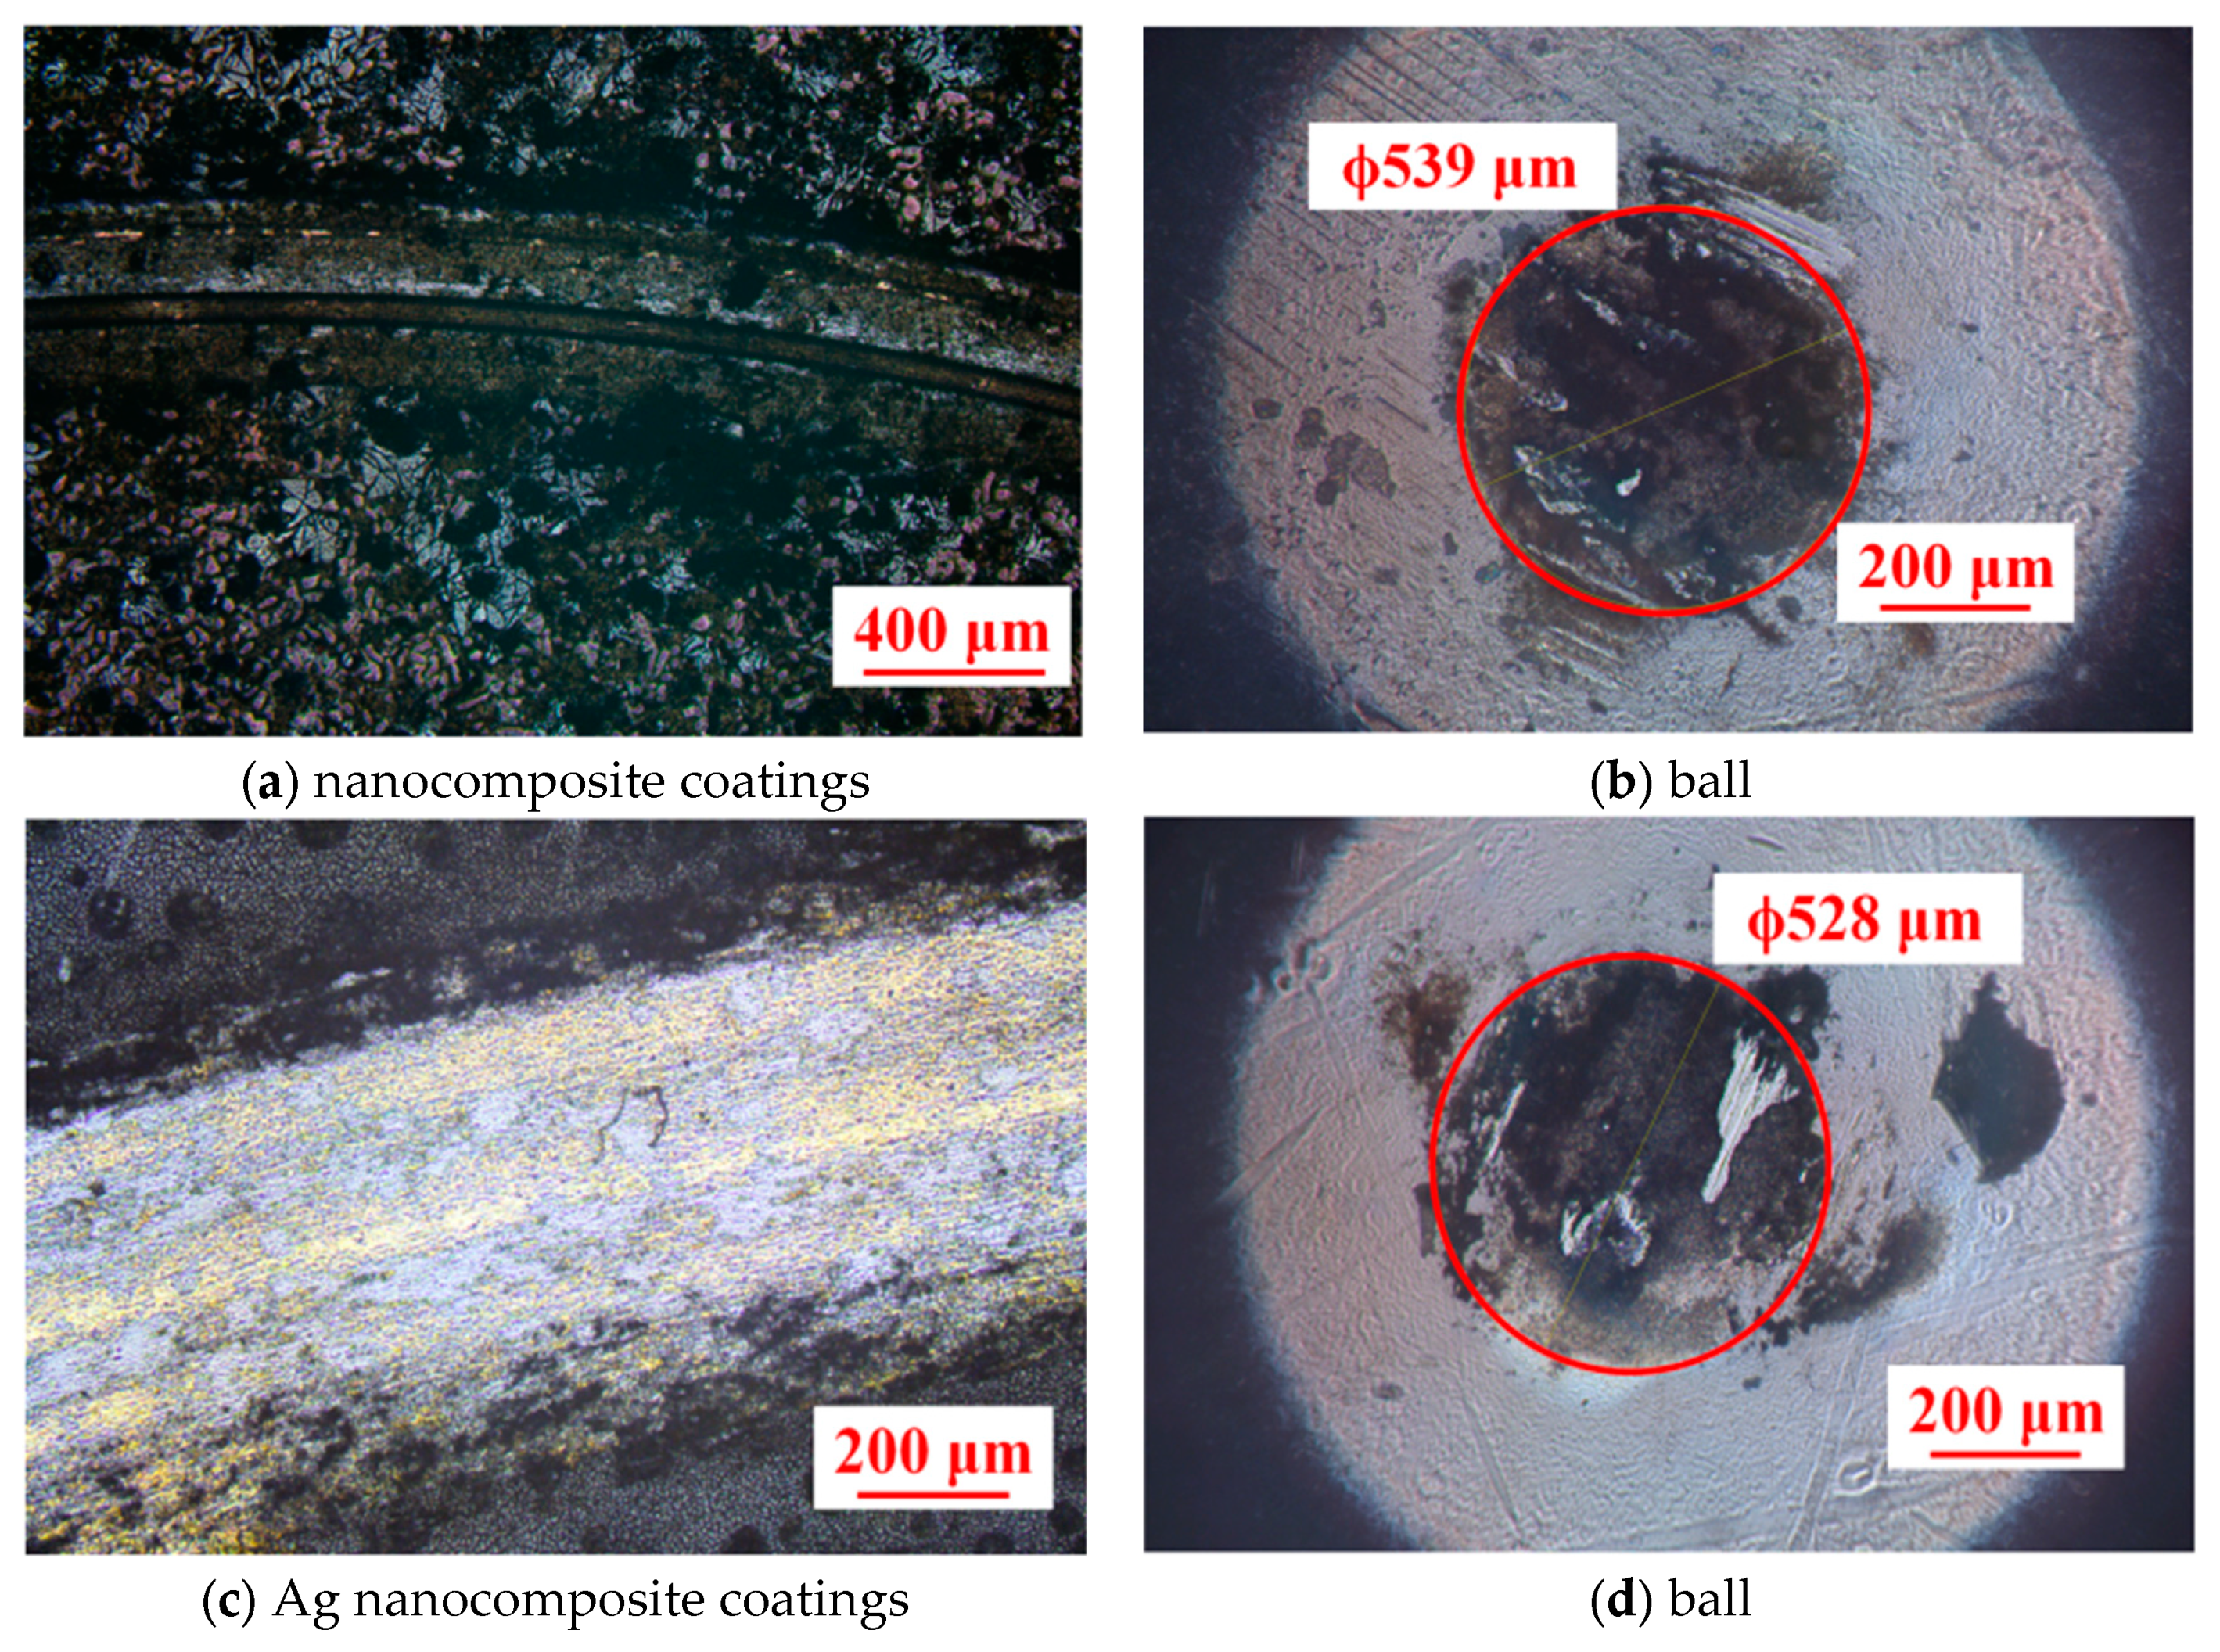
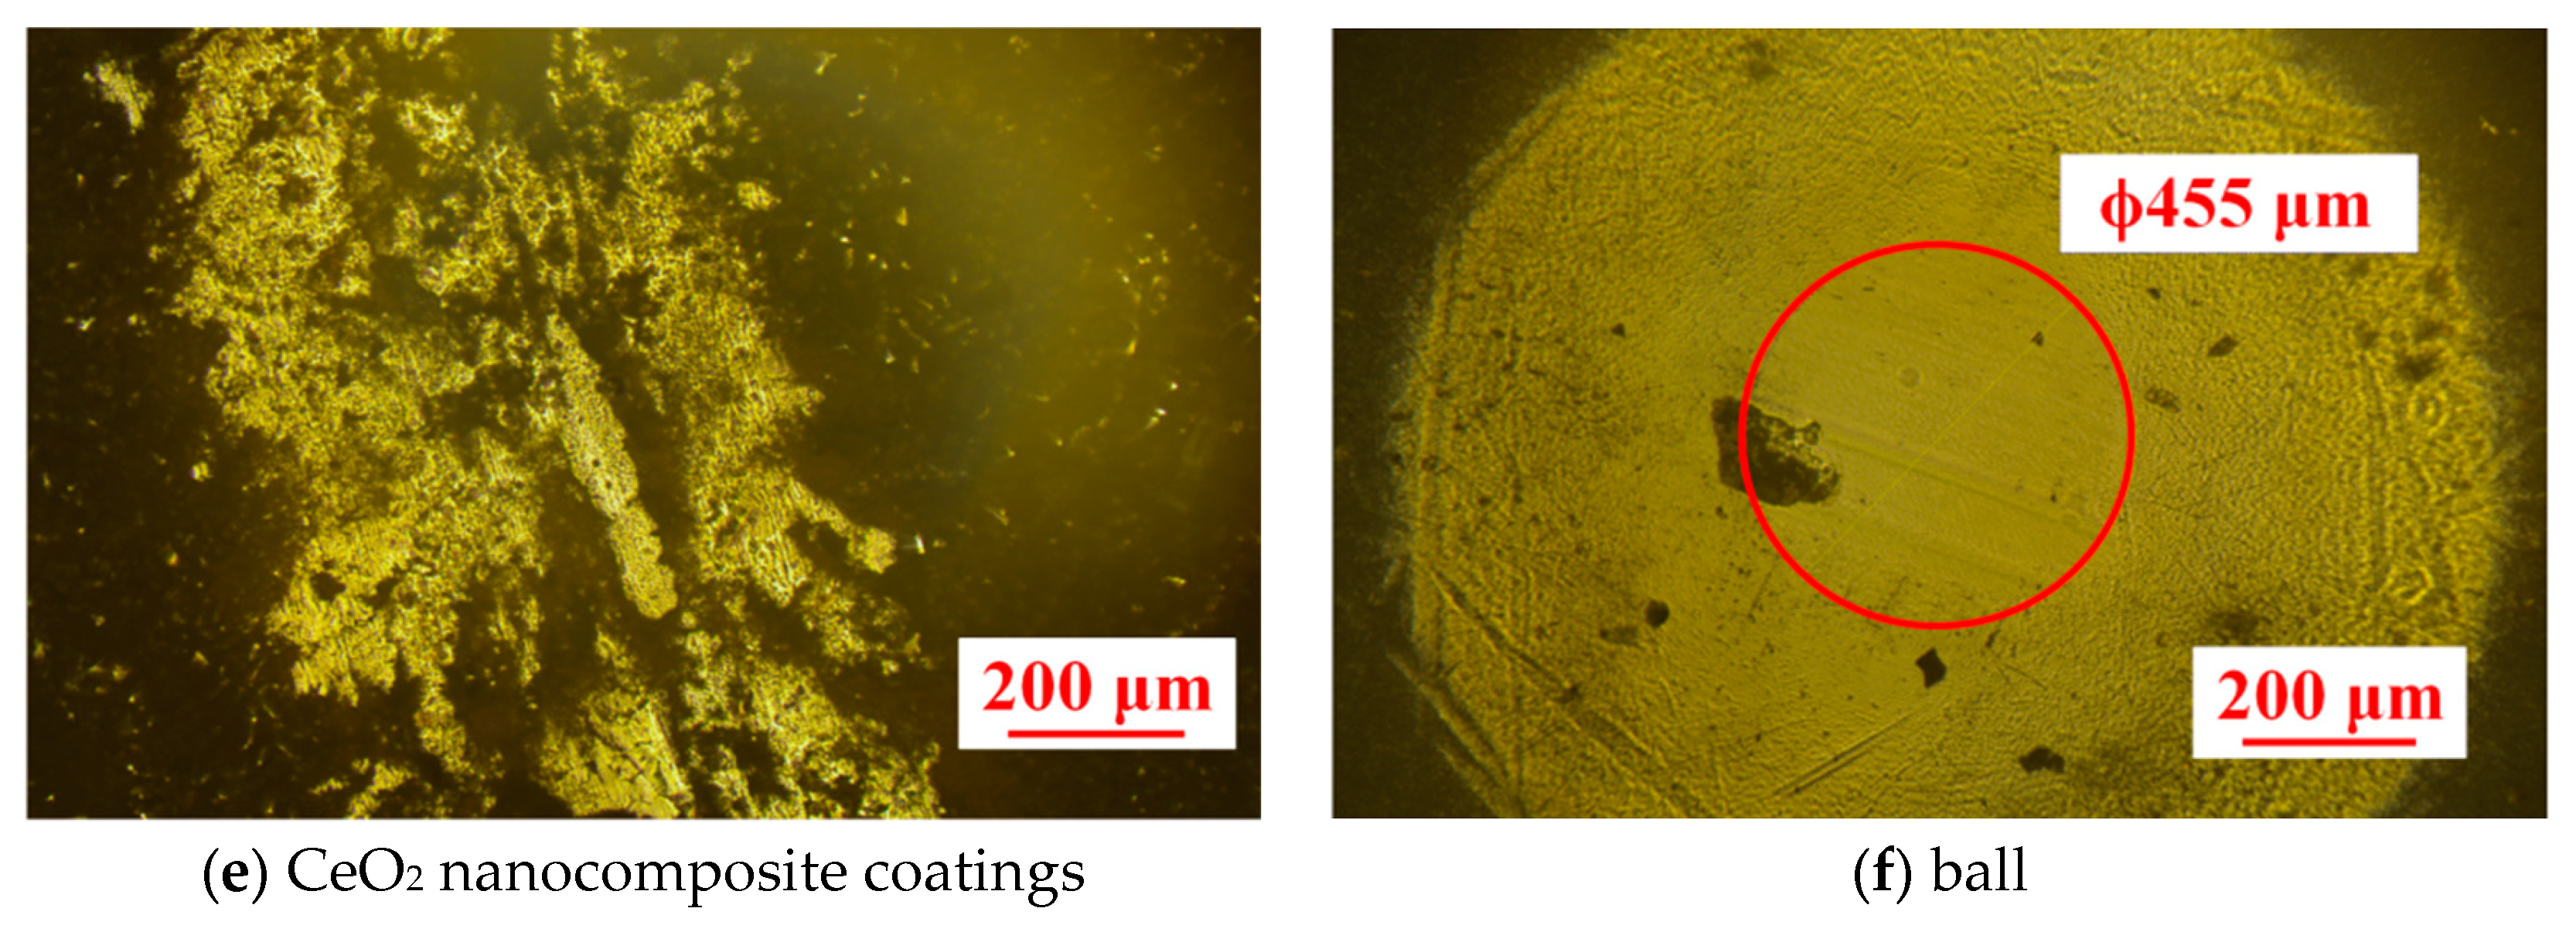
Figure 8 shows the wear morphology of the nanocomposite coatings and ball. For the γ-Fe2O3@SiO2 nanocomposite coatings, a smooth and continuous transfer film appears on the ball, corresponding to the micro-plough on the wear surface of the γ-Fe2O3@SiO2 nanocomposite coating. According to the wear morphology and friction curve, it can be concluded that the CoF is high at the beginning of friction, and then γ-Fe2O3 becomes soft. In addition, there is the formation of the lubrication film with a continuous oxide film on the wear surface under the combined action of ambient temperature and friction heat. Because γ-Fe2O3 is easy to shear at high temperature, the CoF of the nanocomposite coating is significantly reduced to 0.05. For the γ-Fe2O3@SiO2-Ag nanocomposite coatings, t the lubrication films on the wear marks of the nanocomposite coatings are smooth, there is only a small amount of wear debris on the wear surface, and the wear mechanism is adhesive wear. The transfer films are distributed continuously on the wear spots of the ball, which plays a good lubricating role on the wear surface and effectively reduces the CoF of the nanocomposite coatings. For the γ-Fe2O3@SiO2-Ag-CeO2nanocomposite coatings, a non-continuous lubricating film appears on the wear surface of the nanocomposite coating, and the worn surface of ball is almost smooth, resulting in high CoF relatively. The volume wear rate of the γ-Fe2O3@SiO2 nanocomposite coatings, γ-Fe2O3@SiO2-Ag nanocomposite coatings and γ-Fe2O3@SiO2-Ag-CeO2 nanocomposite coatings are about 15.02 × 10⁻⁵ mm3 (Nm)−1, 4.32 × 10⁻⁵ mm3 (Nm)−1 and 8.65 × 10⁻⁵ mm3 (Nm)−1.
During the sliding, there are a few periods in the CoF values. The CoF firstly increases and then decreases. From the previous work [19,21], it is found that the suggested composite can have a good CoF at high temperature, especially at 500 °C, not only at high temperature. CoF decreases slightly with the increase in sliding time. In the initial stage of friction, the nanocomposite material is broken to form abrasive chips distributed on the friction surface, and the friction surface becomes rough, which may result in the high CoF, and the CoF firstly increased and then decreased. At this time, a small amount of the abrasive chips is transferred to the ball to form the initial transfer film. As the friction and wear process continues, under the combined action of friction and high temperature, γ-Fe2O3 is formed on the friction surface on the ball, forming a layer of lubrication film with low shear strength, and a continuous smooth transfer film is formed on the surface of the ball, so the friction between the friction pairs can be effectively reduced. Therefore, the γ-Fe2O3@SiO2 nanocomposite coating has good high-temperature lubrication performance.
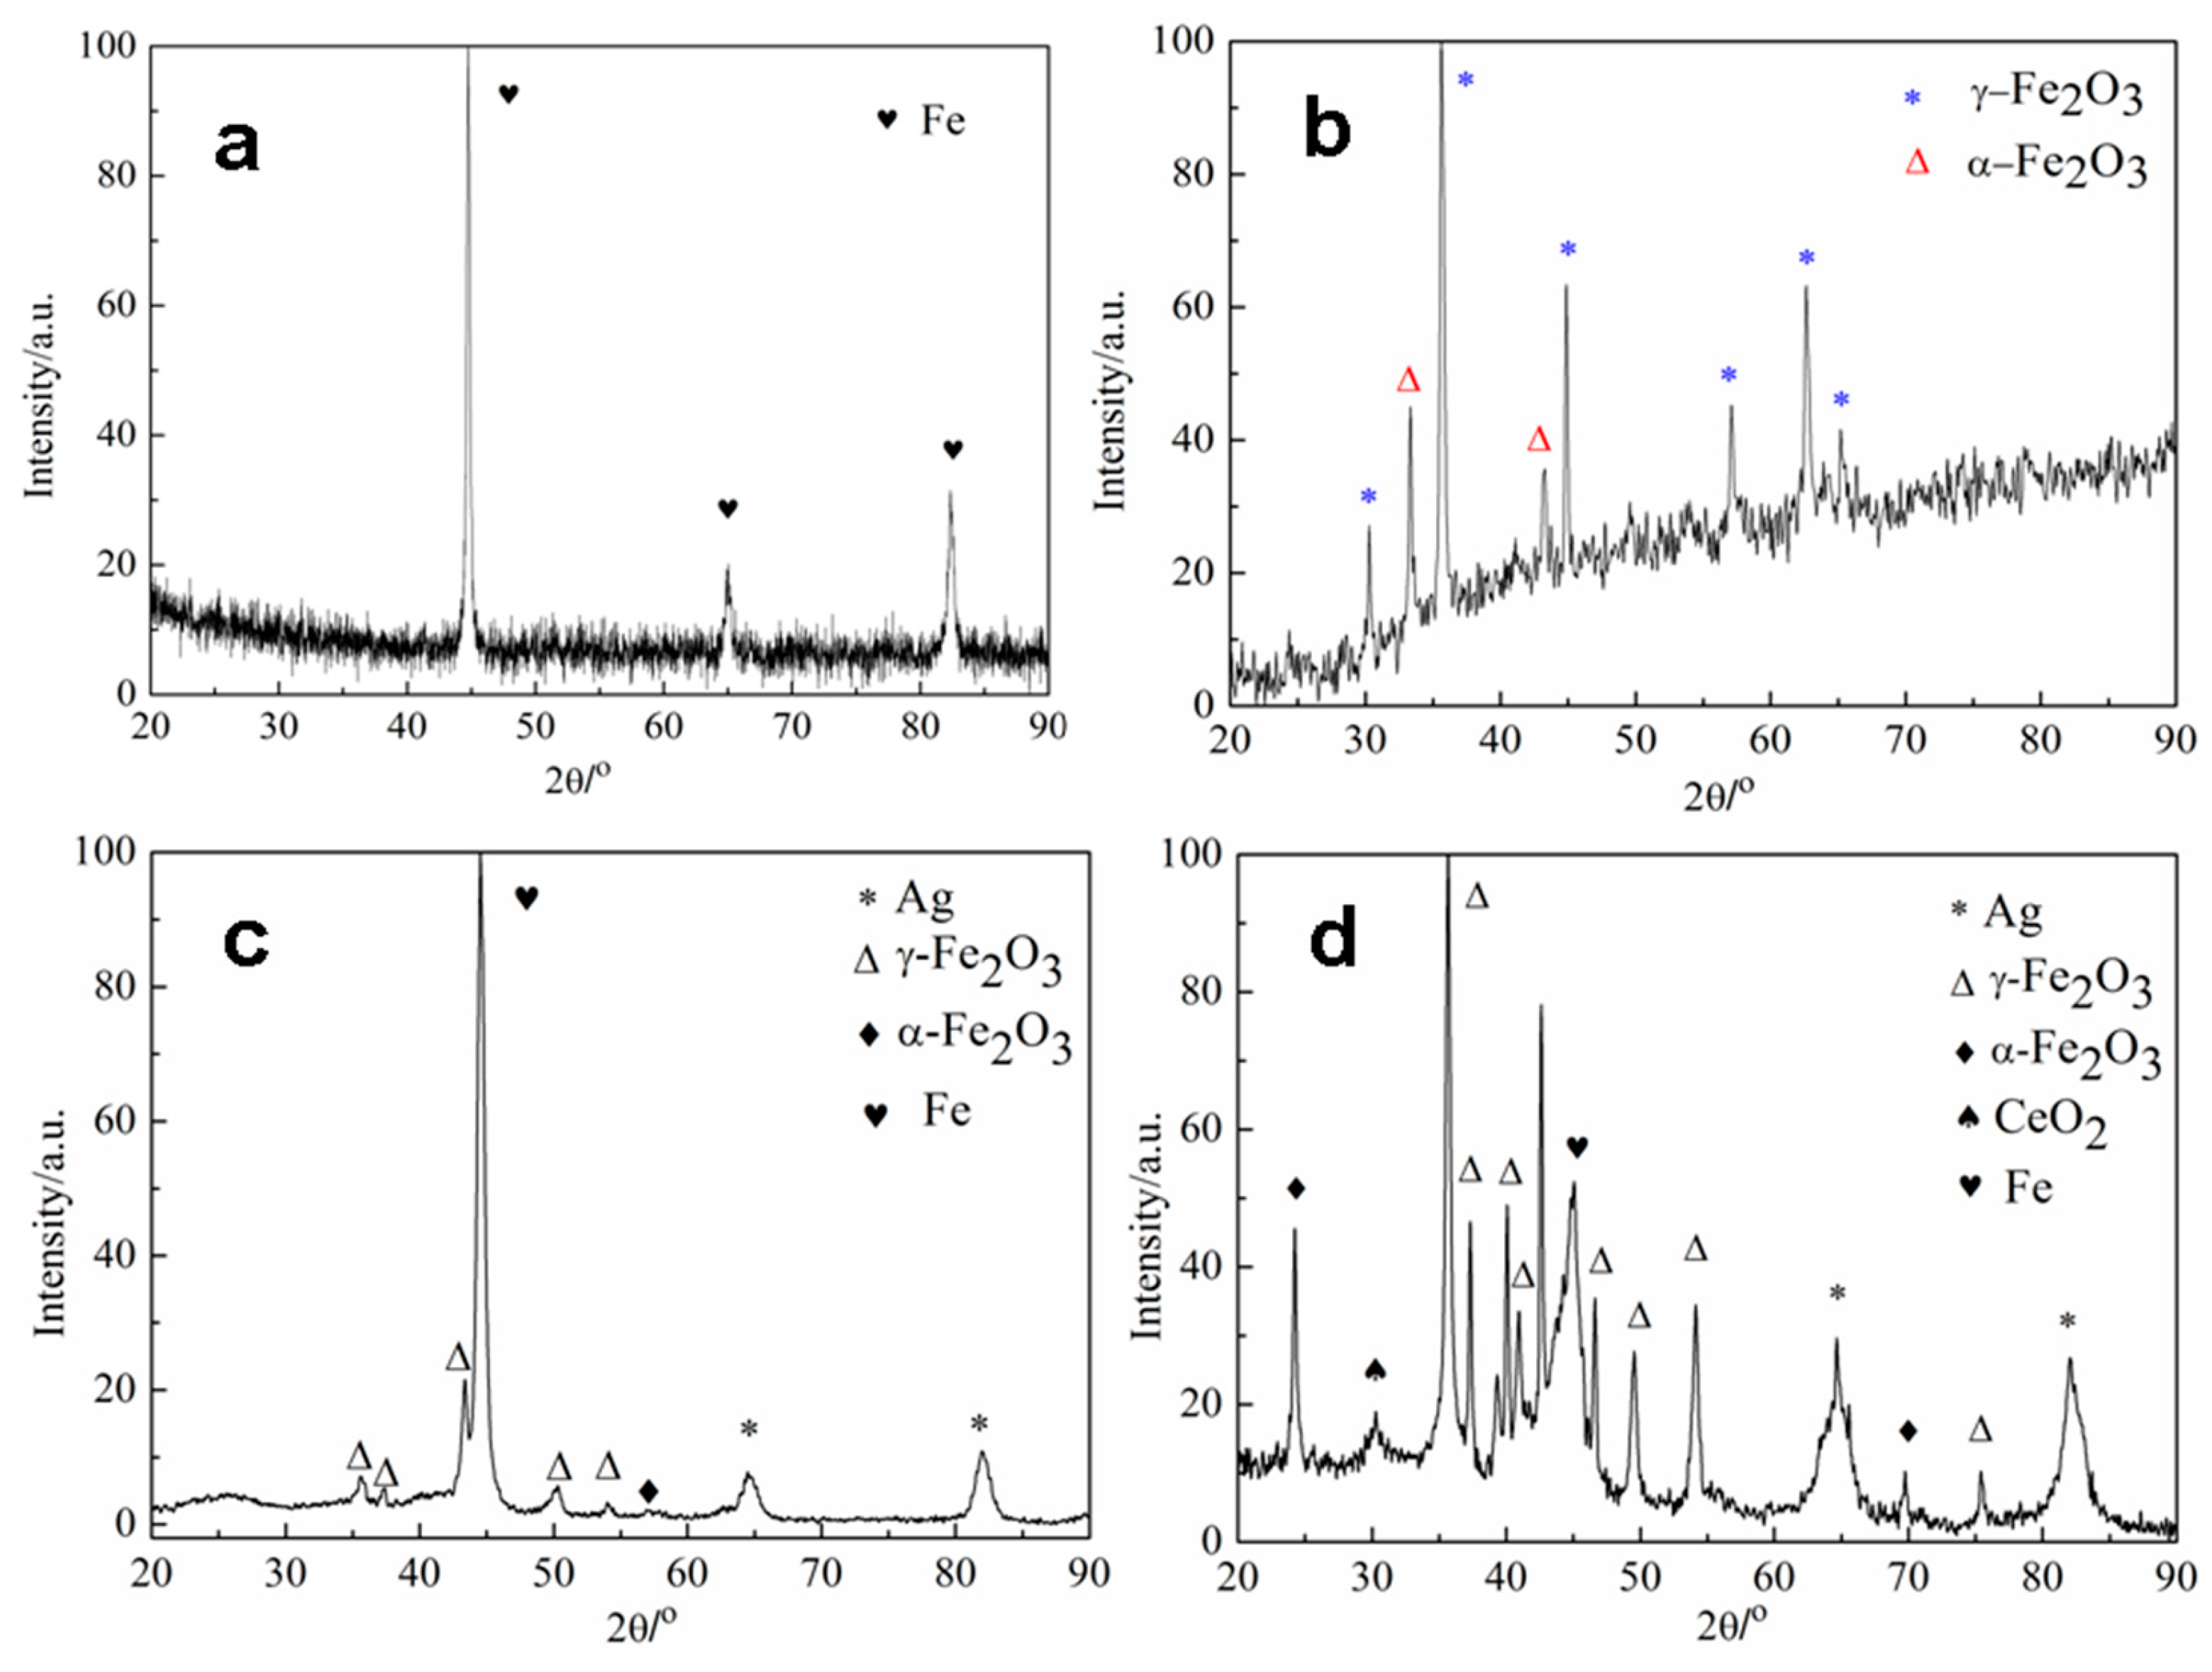
Figure 9 shows XRD results of the worn surfaces of the nanocomposite coatings after the tribo tests. XRD results of the nanocomposite coatings show that Fe, α-Fe2O3 and γ-Fe2O3 are on the worn surface of the disc.
The γ-Fe2O3@SiO2 nanocomposite coatings have good tribological properties. The CoF of the γ-Fe2O3@SiO2 nanocomposite coatings is low compared to the uncoated steel disk. The CoF of the γ-Fe2O3@SiO2 coatings decreases to the minimum value (about 0.05). The low friction behavior is attributed to oxidation and phase change accord to the analysis and results. At 500 °C, the oxides were formed on the contact area. Super low friction is obtained due to the γ-Fe2O3 and high load capacity of amorphous SiO2. The soft phase γ-Fe2O3 has a high plasticity performance at elevated temperature. The soft phase of γ-Fe2O3 would melt under the localized heating and high pressure at the friction interface, releasing molten material. The mechanism is a major contributor to the low friction that occurred under high temperature. The solid lubricant is added to the nanocomposite coating to improve the lubrication performance of the nanocomposite coating. Silver has a face-centered cubic structure, which is prone to intergranular slip and has low shear force. And the thermochemical properties of silver are stable, and it can maintain good anti-friction properties. The γ-Fe2O3 and Ag are relatively soft, resulting in the long run-in time of the Ag-γ-Fe2O3@SiO2 nanocomposite coatings and reducing the surface hardness of the coatings. It leads to a large initial CoF, and γ-Fe2O3 and Ag are transferred to the worn surface of the ball. The nanocomposite coatings with the Ag doping reach a low CoF because γ-Fe2O3 has a low shear performance and plays a synergistic lubrication role with Ag in the nanocomposite coatings. The chemical activity of rare earth element Ce is strong, the atomic radius is large, and it is used as a heterogeneous nucleation particle, inhibiting the grain growth of the material, thus refining the coating grain, making the coating structure dense and uniform, and improving the compatibility of the lubricating component of the lubrication system. The microhardness and binding properties of the nanocomposite coatings become high. The addition of CeO2 refines Ag grains, the density of nanocomposite coatings increases, and the hardness also increases. The wear resistance of the CeO2 nanocomposite coating is improved. The average particle size of γ-Fe2O3 in the γ-Fe2O3@SiO2-Ag-CeO2 nanocomposite coating is smaller than that of the undoped CeO2 nanocomposite coating. When the particle size of γ-Fe2O3 decreases, the surface energy increases and the energy required for phase transition decreases, so the structural phase transition temperature decreases. The γ-Fe2O3@SiO2-Ag-CeO2 nanocomposite coatings also have the characteristic peak of α-Fe2O3 appearing in the wear scar. For the γ-Fe2O3@SiO2-Ag-CeO2 nanocomposite coating, Ag in the coatings mainly acts to reduce friction. The lubricating films formed on the worn surface of the coatings are non-continuous due to the addition of the CeO2 toughening phase, the fluctuation of the friction curve reduces and the wear is reduced. Although the CoF of the nanocomposite coatings increases slightly, the wear becomes low compared with the undoped CeO2 coating. The novelty of the work is that the thermal behavior and the stability of the high-temperature super low friction of the nanocomposite coatings are improved by Ag and CeO2; the mechanism is also provided according to the experimental results.

4. Conclusions

The γ-Fe2O3@SiO2 nanocomposite coatings with Ag and CeO2 were prepared, and the tribological properties and thermal stability of the nanocomposite coatings were investigated. The conclusions of this work are summarized as follows:
(1)
Amorphous SiO2 in coatings is coated with crystal particles of γ-Fe2O3 due to the core–shell structures found by TEM. The microstructure of coatings can improve the thermal stability of γ-Fe2O3, and the temperature of the phase transition in γ-Fe2O3 can be increased from 460 to 829 °C according to the results of TG/DSC thermal analysis.
(2)
At 500 °C, the γ-Fe2O3@SiO2 nanocomposite coating can reach a stable super low friction coefficient of 0.05. The CoF of Ag coatings is about 0.05. The run-in time of nanocomposite coatings can be reduced with the doping of Ag. The CoF achieved by the γ-Fe2O3@SiO2-Ag-CeO2 nanocomposite coating is 0.06.
(3)
The volume wear rates of the γ-Fe2O3@SiO2 nanocomposite coatings, γ-Fe2O3@SiO2-Ag nanocomposite coatings and γ-Fe2O3@SiO2-Ag-CeO2 nanocomposite coatings are about 15.02 × 10⁻⁵ mm3 (Nm)−1, 4.32 × 10⁻⁵ mm3 (Nm)−1 and 8.65 × 10⁻⁵ mm3 (Nm)−1.
(4)
The high-temperature self-lubrication mechanism of coatings is attributed to the high-temperature soft phase of γ-Fe2O3 with low shear strength and the stability of Ag and CeO2 doping.

Funding

The present work is financially supported by the Liaoning Key Laboratory of Aero-engine Materials Tribology (LKLAMTF202401) and the National Natural Science Foundation of China (51675409).

Data Availability Statement

The data that support the findings of this study are available from the corresponding author upon reasonable request. The data are not publicly available due to privacy.

Conflicts of Interest

The authors declare no conflicts of interest.

References

  1. Dohda, K.; Boher, C.; Rezai-Aria, F.; Mahayotsanun, N. Tribology in metal forming at elevated temperatures. Friction 2015, 3, 1–27. [Google Scholar] [CrossRef]
  2. Zhu, S.; Cheng, J.; Qiao, Z.; Yang, J. High temperature solid-lubricating materials: A review. Tribol. Int. 2019, 133, 206–223. [Google Scholar] [CrossRef]
  3. Zeng, Q.; Zhang, W. A systematic review of the recent advances in superlubricity research. Coatings 2023, 13, 1989. [Google Scholar] [CrossRef]
  4. Zeng, Q. High-temperature superlubricity performance of h-BN coating on the textured inconel X750 alloy. Lubricants 2023, 11, 258. [Google Scholar] [CrossRef]
  5. Zeng, Q.; Qi, W. High temperature superlubricity behaviors achieved by AlSiN coatings against WS2 coatings at 600 °C. Ceram. Int. 2024, 50, 3787–3796. [Google Scholar] [CrossRef]
  6. Kumar, R.; Hussainova, I.; Rahmani, R.; Antonov, M. Solid lubrication at high-temperatures—A review. Materials 2022, 15, 1695. [Google Scholar] [CrossRef] [PubMed]
  7. Ouyang, J.; Li, Y.; Zhang, Y.; Wang, Y.; Wang, Y. High-temperature solid lubricants and self-lubricating composites: A critical review. Lubricants 2022, 10, 177. [Google Scholar] [CrossRef]
  8. Sarkar, M.; Mandal, N. Solid lubricant materials for high temperature application: A review. Mater. Today Proc. 2022, 66, 3762–3768. [Google Scholar] [CrossRef]
  9. Zeng, Q.; Eryilmaz, O.; Erdemir, A. Superlubricity of the DLC films-related friction system at elevated temperature. RSC Adv. 2015, 5, 93147–93154. [Google Scholar] [CrossRef]
  10. Zhu, J.; Zeng, Q.; He, W.; Yan, C.; He, W. Elevated-temperature super-lubrication performance analysis of dispersion-strengthened WSN coatings: Experimental research and first-principles calculation. Surf. Coat. Technol. 2021, 406, 126651. [Google Scholar] [CrossRef]
  11. Zeng, Q. High temperature low friction behavior of h-BN coatings against ZrO2. Coatings 2022, 12, 1772. [Google Scholar] [CrossRef]
  12. Rosenkranz, A.; Righi, M.; Sumant, A.; Anasori, B.; Mochalin, V. Perspectives of 2D MXene tribology. Adv. Mater. 2023, 35, 2207757. [Google Scholar] [CrossRef] [PubMed]
  13. Boidi, G.; F de Queiróz, J.C.; Profito, F.J.; Rosenkranz, A. Ti3C2Tx MXene manosheets as lubricant additives to lower friction under high loads, sliding ratios, and elevated temperatures. ACS Appl. Nano Mater. 2022, 6, 729–737. [Google Scholar] [CrossRef]
  14. Chhattal, M.; Kaihuan, Y.; Ali, S.; Zambrano, D.; Rosenkranz, A.; Grutzmacher, P.; Gong, Z.; Zhang, J. Solid lubrication performance of Ti2CTx coatings with reduced friction and extended durability. Tribol. Int. 2024, 194, 109535. [Google Scholar] [CrossRef]
  15. Cui, G.; Feng, X.; Han, W.; Liu, Y.; Kou, Z. Microstructure and high temperature wear behavior of in-situ synthesized carbides reinforced Mo-based coating by laser cladding. Surf. Coat. Technol. 2023, 467, 129713. [Google Scholar] [CrossRef]
  16. Gong, H.; Yu, C.; Zhang, L.; Xie, G.; Guo, D.; Luo, J. Intelligent lubricating materials: A review. Compos. Part B Eng. 2020, 202, 108450. [Google Scholar] [CrossRef]
  17. Jin, B.; Zhao, J.; Chen, G.; He, Y.; Huang, Y.; Luo, J. In situ synthesis of Mn3O4/graphene nanocomposite and its application as a lubrication additive at high temperatures. Appl. Surf. Sci. 2021, 546, 149019. [Google Scholar] [CrossRef]
  18. Cao, H.; Momand, J.; Syariati, A.; Wen, F.; Rudolf, P.; Xiao, P.; De Hosson, J.; Pei, Y. Temperature-adaptive ultralubricity of a WS2/a-C nanocomposite coating: Performance from room temperature up to 500 °C. ACS Appl. Mater. Interfaces 2021, 13, 28843–28854. [Google Scholar] [CrossRef]
  19. Zeng, Q.; Cai, S.; Li, S. High-temperature low-friction behaviors of γ-Fe2O3@SiO2 nanocomposite coatings obtained through sol–gel method. J. Sol-Gel Sci. Technol. 2018, 85, 558–566. [Google Scholar] [CrossRef]
  20. Bondarev, A.; Kvashnin, D.; Shchetinin, I.; Shtansky, D. Temperature-dependent structural transformation and friction behavior of nanocomposite VCN-(Ag) coatings. Mater. Des. 2018, 160, 964–973. [Google Scholar] [CrossRef]
  21. Zeng, Q.; Cai, S. Low-friction behaviors of Ag-doped γ-Fe2O3@SiO2 nanocomposite coatings under a wide range of temperature conditions. J. Sol-Gel Sci. Technol. 2019, 90, 271–280. [Google Scholar] [CrossRef]
  22. Wilhelmsson, O.; Råsander, M.; Carlsson, M.; Lewin, E.; Sanyal, B.; Wiklund, U.; Eriksson, O.; Jansson, U. Design of nanocomposite low-friction coatings. Adv. Funct. Mater. 2007, 17, 1611–1616. [Google Scholar] [CrossRef]
  23. Mallakpour, S.; Khadem, E. Carbon nanotube–metal oxide nanocomposites: Fabrication, properties and applications. Chem. Eng. J. 2016, 302, 344–367. [Google Scholar] [CrossRef]
  24. Okpala, C. Nanocomposites—An overview. Int. J. Eng. Res. Dev. 2013, 8, 17–23. [Google Scholar]
  25. Yin, L.; Pan, Y.; Li, M.; Zhao, Y.; Luo, S. Facile and scalable synthesis of α-Fe2O3/γ-Fe2O3/Fe/C nanocomposite as advanced anode materials for lithium/sodium ion batteries. Nanotechnology 2020, 31, 155402. [Google Scholar] [CrossRef] [PubMed]
  26. Yang, J.; Jiang, Y.; Hardell, J.; Fang, Q. Influence of service temperature on tribological characteristics of self-lubricant coatings: A review. Front. Mater. Sci. 2013, 7, 28–39. [Google Scholar] [CrossRef]
  27. Aouadi, S.; Paudel, Y.; Luster, B.; Stadler, S.; Kohli, P.; Muratore, C. Adaptive Mo2N/MoS2/Ag tribological nanocomposite coatings for aerospace applications. Tribol. Lett. 2008, 29, 95–103. [Google Scholar]
  28. Voevodin, A.; Zabinski, J. Nanocomposite and nanostructured tribological materials for space applications. Compos. Sci. Technol. 2005, 65, 741–748. [Google Scholar] [CrossRef]
  29. Voevodin, A.; O’neill, J.; Zabinski, J. Nanocomposite tribological coatings for aerospace applications. Surf. Coat. Technol. 1999, 116, 36–45. [Google Scholar] [CrossRef]
  30. Wang, X.; Gao, X.; Zhang, Z.; Cheng, L.; Ma, H.; Yang, W. Advances in modifications and high-temperature applications of silicon carbide ceramic matrix composites in aerospace: A focused review. J. Eur. Ceram. Soc. 2021, 41, 4671–4688. [Google Scholar] [CrossRef]
  31. Ji, Z.; Zhang, L.; Xie, G.; Xu, W.; Guo, D.; Luo, J.; Prakan, B. Mechanical and tribological properties of nanocomposites incorporated with two-dimensional materials. Friction 2020, 8, 813–846. [Google Scholar] [CrossRef]
  32. Su, Y.; Huang, W.; Cai, L.; Gong, X.; Zhang, T.; Hu, R.; Zhang, P.; Ruan, H. Microstructural evolution and tribology of Mo-doped diamond like carbon nanocomposite film. Tribol. Int. 2022, 174, 107774. [Google Scholar] [CrossRef]
  33. Ding, J.; Cheng, Y.; Zhang, S.; Wang, Q.; Zhang, T. Microstructure, mechanical and tribological properties of Ti doped ta-C films deposited by a hybrid coating system. Diam. Relat. Mater. 2023, 131, 109565. [Google Scholar] [CrossRef]
  34. Grenadyorov, A.; Solovyev, A.; Oskirko, V.; Oskomov, V.; Semenov, V.; Sypchenko, V.; Saraev, A. Structure, mechanical and tribological properties of Ti-doped and Cr-doped aC: H: SiOx coatings. Vacuum 2024, 219, 112706. [Google Scholar] [CrossRef]
  35. Xu, X.; Sun, J.; Su, F.; Li, Z.; Chen, Y.; Xu, Z. Microstructure and tribological performance of adaptive MoN–Ag nanocomposite coatings with various Ag contents. Wear 2022, 488, 204170. [Google Scholar] [CrossRef]
  36. Chen, Y.; Sun, J.; Liu, Y.; Li, Q.; Xiao, S.; Su, F. Microstructure, mechanical and high-temperature tribological properties of MoS2-Cr-Ag composite films. Surf. Coat. Technol. 2023, 452, 129135. [Google Scholar] [CrossRef]
  37. Dong, Y.; Wang, Z.; Yuan, J.; Wang, Z.; Zhang, Y.; Ma, G.; Wang, A. Temperature-adaptive lubrication of Ag doped Cr2AlC nanocomposite coatings. Wear 2024, 540, 205221. [Google Scholar] [CrossRef]
  38. Huang, K.; Cao, X.; Kong, L.; Lu, Z.; Ding, Q.; Hu, H. Effect of Ag content on friction and wear properties of Ag and V co-doped CrN coatings at 25–700 °C. Ceram. Int. 2021, 47, 35021–35028. [Google Scholar] [CrossRef]
  39. Patnaik, L.; Maity, S.R.; Kumar, S. Comprehensive structural, nanomechanical and tribological evaluation of silver doped DLC thin film coating with chromium interlayer (Ag-DLC/Cr) for biomedical application. Ceram. Int. 2020, 46, 22805–22818. [Google Scholar] [CrossRef]
  40. Wang, X.; Liu, S.; Zhang, M.; Qu, K. Effect of rare earth oxide on the microstructure and wear properties of in situ–synthesized ceramics-reinforced Fe-based laser cladding coatings. Tribol. Trans. 2020, 63, 345–355. [Google Scholar] [CrossRef]
  41. Gupta, P.; Ahamad, N.; Kumar, D.; Gupta, N.; Chaudhary, V.; Gupta, S.; Khanna, V.; Chaudhary, V. Synergetic effect of CeO2 doping on structural and tribological behavior of Fe-Al2O3 metal matrix nanocomposites. ECS J. Solid State Sci. Technol. 2022, 11, 117001. [Google Scholar] [CrossRef]
  42. Du, J.; Li, F.; Li, Y.; Lu, H.; Qi, X.; Yang, B.; Li, C.; Yu, P.; Cao, Y. High temperature oxidation behavior and interface diffusion of Cr3C2-NiCrCoMo/nano-CeO2 composite coatings. J. Alloys Compd. 2022, 905, 164177. [Google Scholar] [CrossRef]
  43. Du, J.; Li, F.; Li, Y.; Lu, H.; Qi, X.; Yang, B.; Li, C.; Yu, P.; Wang, J.; Gao, L. The influence of nano-CeO2 on tribological properties and microstructure evolution of Cr3C2-NiCrCoMo composite coatings at high temperature. Surf. Coat. Technol. 2021, 428, 127913. [Google Scholar] [CrossRef]
  44. Min, C.; He, Z.; Song, H.; Liu, D.; Jia, W.; Qian, J.; Yu, H.; Guo, L. Fabrication of novel CeO2/GO/CNTs ternary nanocomposites with enhanced tribological performance. Appl. Sci. 2019, 9, 170. [Google Scholar] [CrossRef]
  45. Kumar, S.; Kumar, D. Role of CeO2 doping on tribological behavior of Al2O3 coated AZ91 alloy. Surf. Coat. Technol. 2018, 349, 462–469. [Google Scholar] [CrossRef]
  46. Zhou, Y.; Zhang, Z.; Yue, Y. Synthesis and self-organization of γ-Fe2O3 nanoparticles by hydrothermal chemical vapor deposition. Mater. Lett. 2005, 59, 3375–3377. [Google Scholar] [CrossRef]
  47. Bi, Q.; Luo, X.; Guo, L.; Zuo, X.; Huang, B.; Yi, J.; Zhou, Y. Effects of in-situ reaction, extrusion ratio and CeO2 on the performance of Al-Ti-C-(Ce) grain refiners for refining pure aluminum grains. Materials 2023, 16, 4481. [Google Scholar] [CrossRef] [PubMed]
  48. You, S.; Xing, S.; Jiang, C. The influence of CeO2 particle with various sizes on the microstructure and properties of electrodeposited Ni-CeO2 composite coatings. Mater. Charact. 2023, 205, 113327. [Google Scholar] [CrossRef]
  49. Stagi, L.; De Toro, J.A.; Ardu, A.; Cannas, C.; Casu, A.; Lee, S.; Ricci, P. Surface effects under visible irradiation and heat treatment on the phase stability of γ-Fe2O3 nanoparticles and γ-Fe2O3−SiO2 core–shell nanostructures. J. Phys. Chem. C 2014, 118, 2857–2866. [Google Scholar]
  50. Yu, X.; Liu, S.; Yu, J. Superparamagnetic γ-Fe2O3@SiO2@TiO2 composite microspheres with superior photocatalytic properties. Appl. Catal. B Environ. 2011, 104, 12–20. [Google Scholar] [CrossRef]
  51. Guo, H.; Barnard, A.S. Modeling the iron oxides and oxyhydroxides for the prediction of environmentally sensitive phase transformations. Phys. Rev. B 2011, 83, 094112. [Google Scholar] [CrossRef]
  52. Monshi, A.; Foroughi, M.; Monshi, M. Modified Scherrer equation to estimate more accurately nano-crystallite size using XRD. World J. Nano Sci. Eng. 2012, 2, 154–160. [Google Scholar] [CrossRef]
  53. Fatimah, S.; Ragadhita, R.; Al Husaeni, D.; Nandiyanto, A. How to calculate crystallite size from X-ray diffraction (XRD) using Scherrer method. ASEAN J. Sci. Eng. 2022, 2, 65–76. [Google Scholar] [CrossRef]
  54. Rabiei, M.; Palevicius, A.; Monshi, A.; Nasiri, S.; Vilkauskas, A.; Janusas, G. Comparing methods for calculating nano crystal size of natural hydroxyapatite using X-ray diffraction. Nanomaterials 2020, 10, 1627. [Google Scholar] [CrossRef]
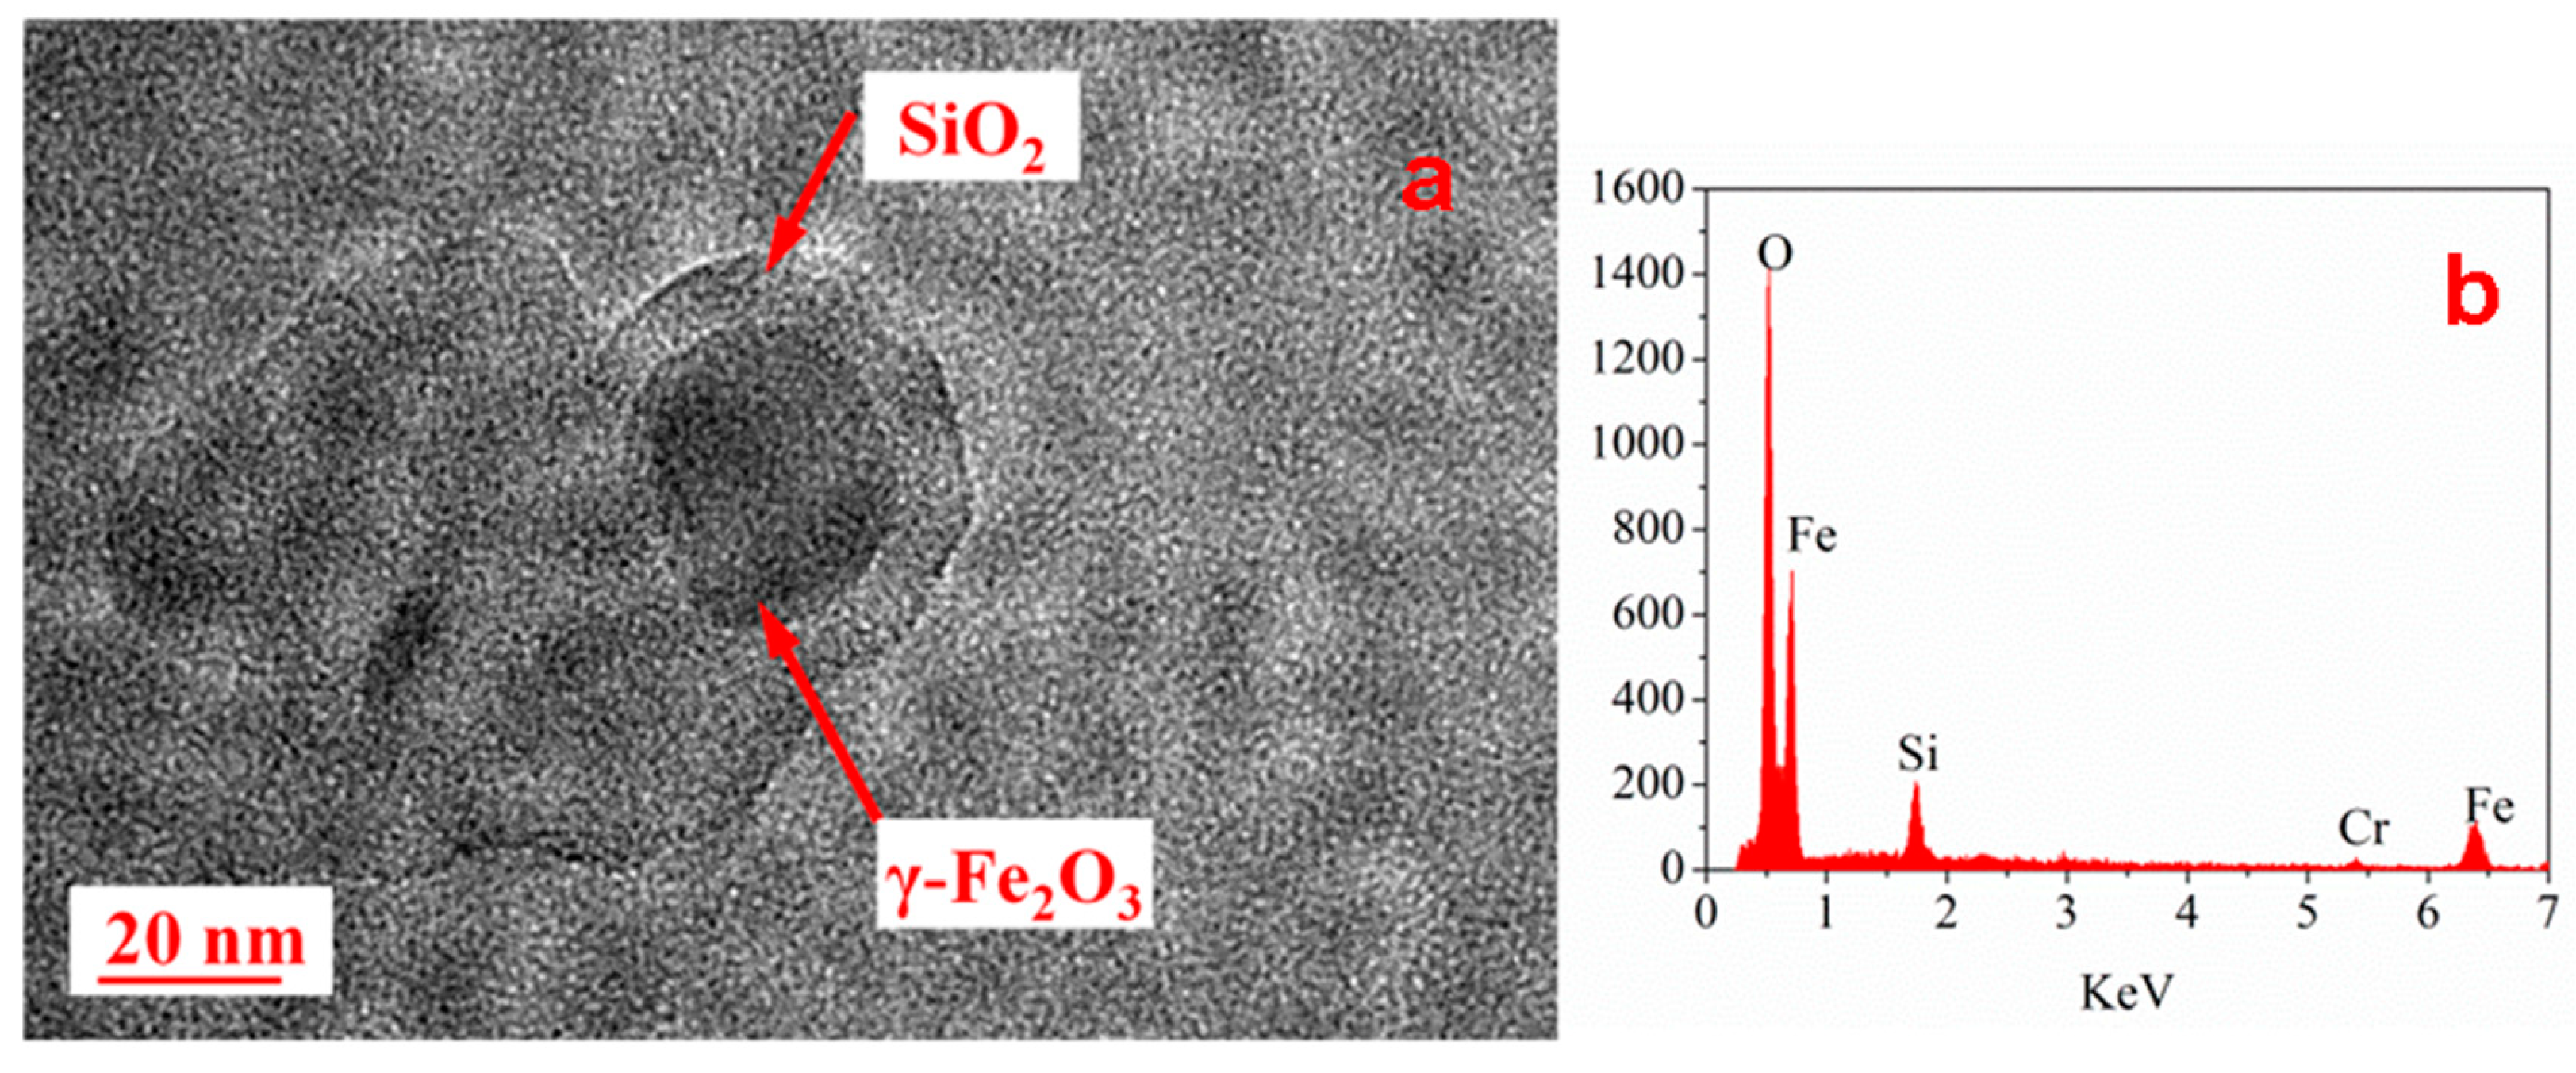
Figure 1. Morphology and microstructure of the γ-Fe2O3@SiO2 nanocomposites. (a) TEM image; (b) EDS of γ-Fe2O3@SiO2 nanocomposites.
Lubricants 12 00223 g001
Figure 2. Raman spectroscopy and XRD of γ-Fe2O3@SiO2 nanocomposite coatings: (a) Raman and (b) XRD.
Lubricants 12 00223 g002
Figure 3. XRD of coatings: (a) Ag doping γ-Fe2O3@SiO2; (b) Ag and CeO2 doping γ-Fe2O3@SiO2.
Lubricants 12 00223 g003
Figure 4. TG/DSC curve of (a) γ-Fe2O3 dry gel and (b) γ-Fe2O3@SiO2 dry gel.
Lubricants 12 00223 g004
Figure 5. XRD of (a) Fe2O3 dry gel: (a) 50 °C, (b) 300 °C and (c) 500 °C; (b) γ-Fe2O3@SiO2 dry gel: (a) 50 °C, (b) 300 °C and (c) 500 °C.
Lubricants 12 00223 g005
Figure 6. TG-DSC curve of γ-Fe2O3@SiO2 gel doped with Ag and CeO2.
Lubricants 12 00223 g006
Figure 7. The CoF of the steel substrate and nanocomposite coatings: (a) steel substrate; (b) γ-Fe2O3@SiO2 nanocomposite coatings; (c) Ag doping γ-Fe2O3@SiO2; (d) Ag and CeO2 doping γ-Fe2O3@SiO2.
Lubricants 12 00223 g007
Figure 8. Wear morphology of nanocomposite coatings and ball: (a) γ-Fe2O3@SiO2coatings, (b) ball, (c) Ag-γ-Fe2O3@SiO2 coatings, (d) ball, (e) CeO2-Ag-γ-Fe2O3@SiO2 nanocomposite coatings and (f) ball.
Lubricants 12 00223 g008aLubricants 12 00223 g008b
Figure 9. XRD of the wear scar of the steel substrate and nanocomposite coatings: (a) steel substrate; (b) γ-Fe2O3@SiO2 nanocomposite coatings; (c) Ag doping γ-Fe2O3@SiO2; (d) Ag and CeO2 doping γ-Fe2O3@SiO2.
Lubricants 12 00223 g009
Disclaimer/Publisher’s Note: The statements, opinions and data contained in all publications are solely those of the individual author(s) and contributor(s) and not of MDPI and/or the editor(s). MDPI and/or the editor(s) disclaim responsibility for any injury to people or property resulting from any ideas, methods, instructions or products referred to in the content.