Impact of Interatomic Potentials on Atomic-Scale Wear of Graphene: A Molecular Dynamics Study


Abstract
:1. Introduction
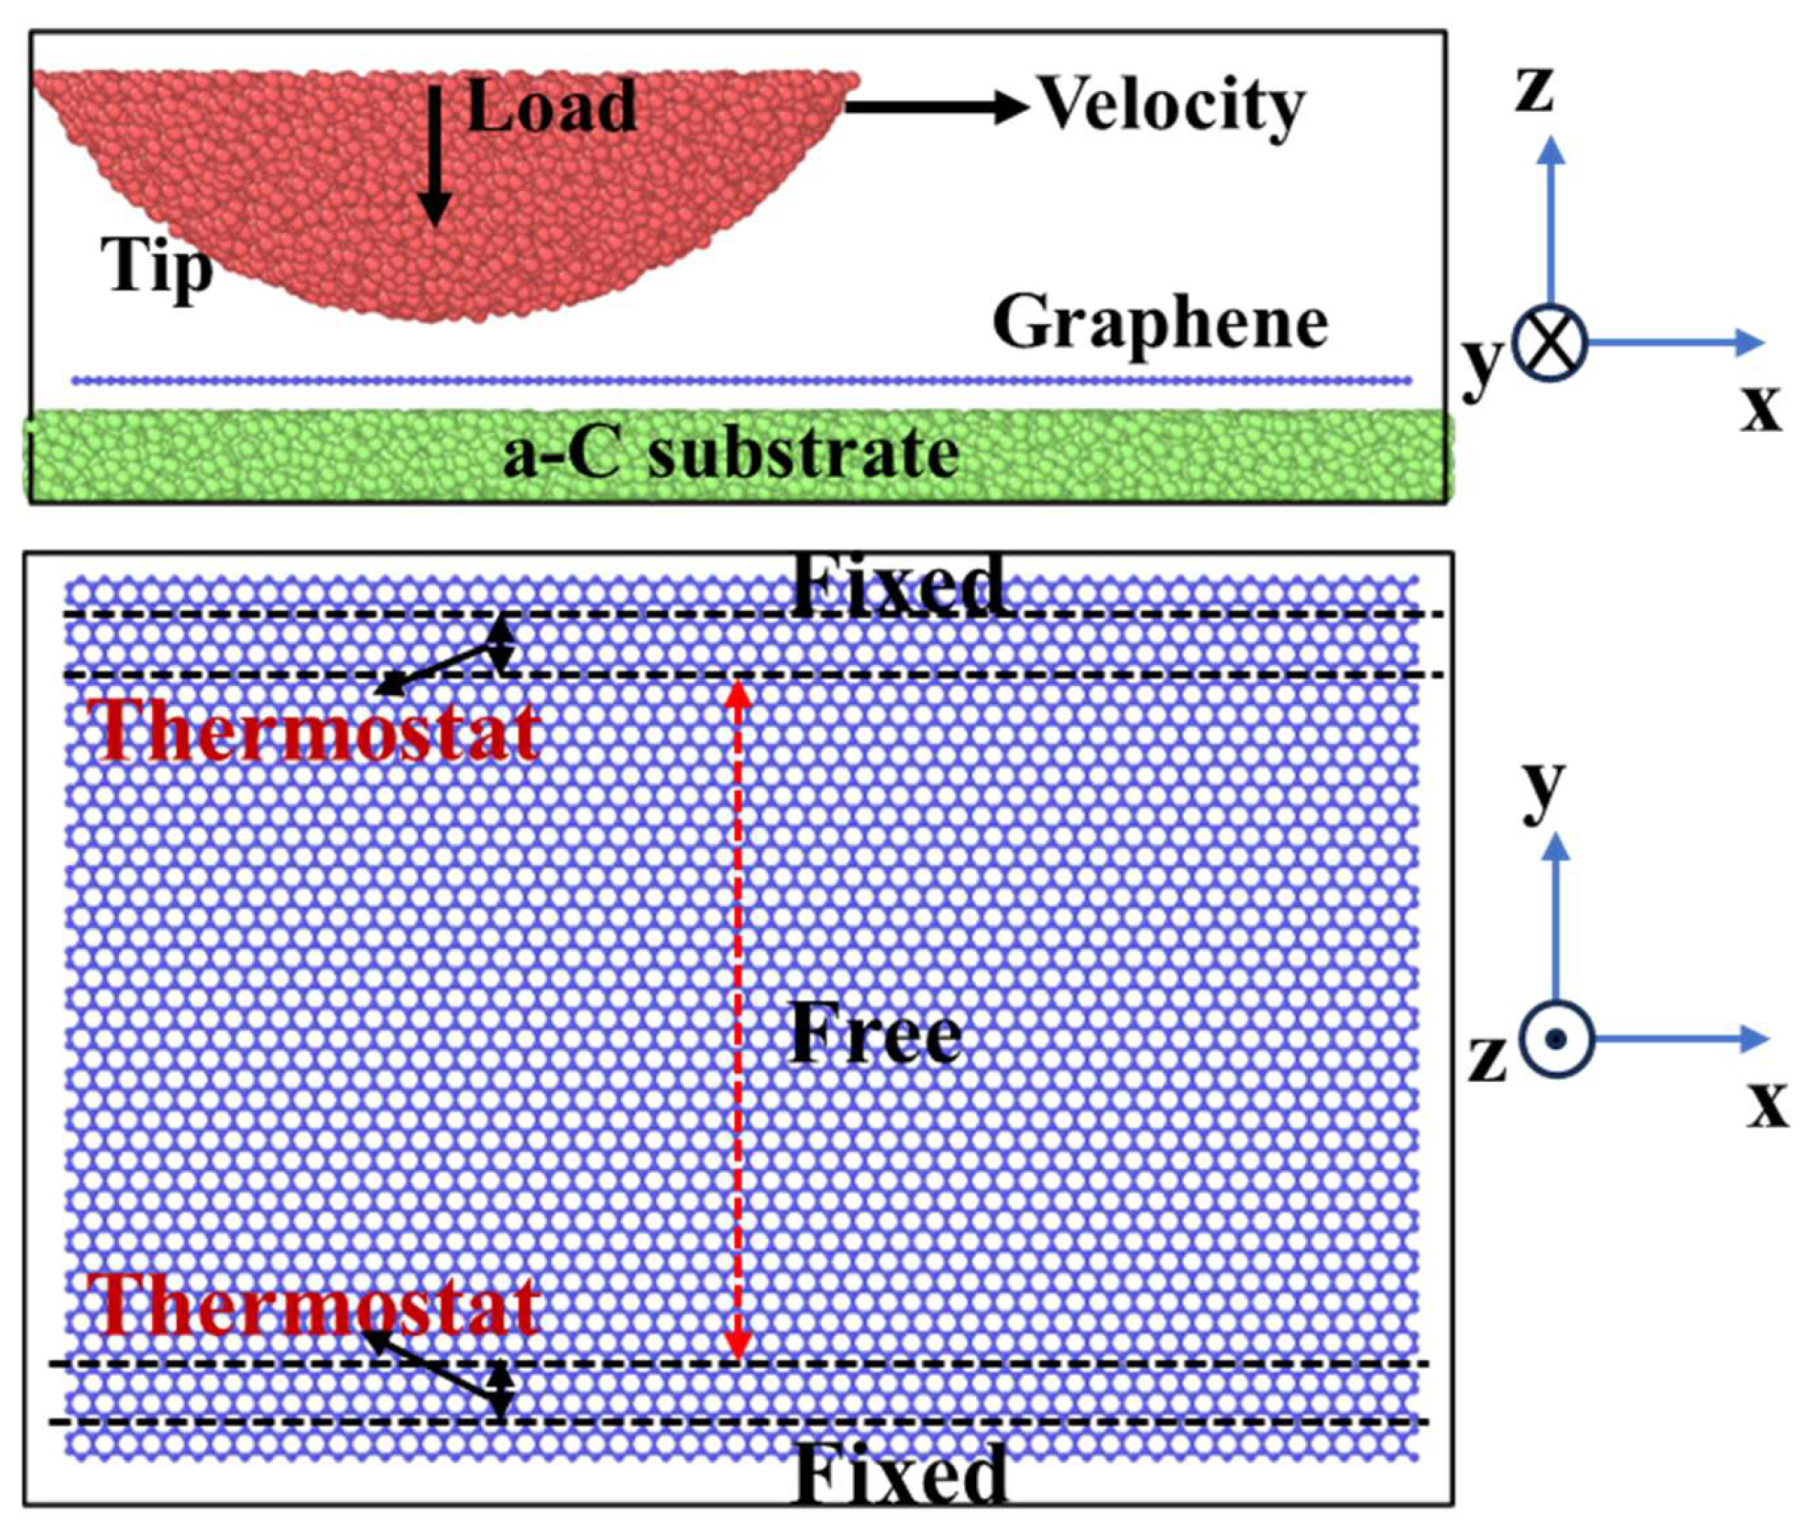
2. Methods
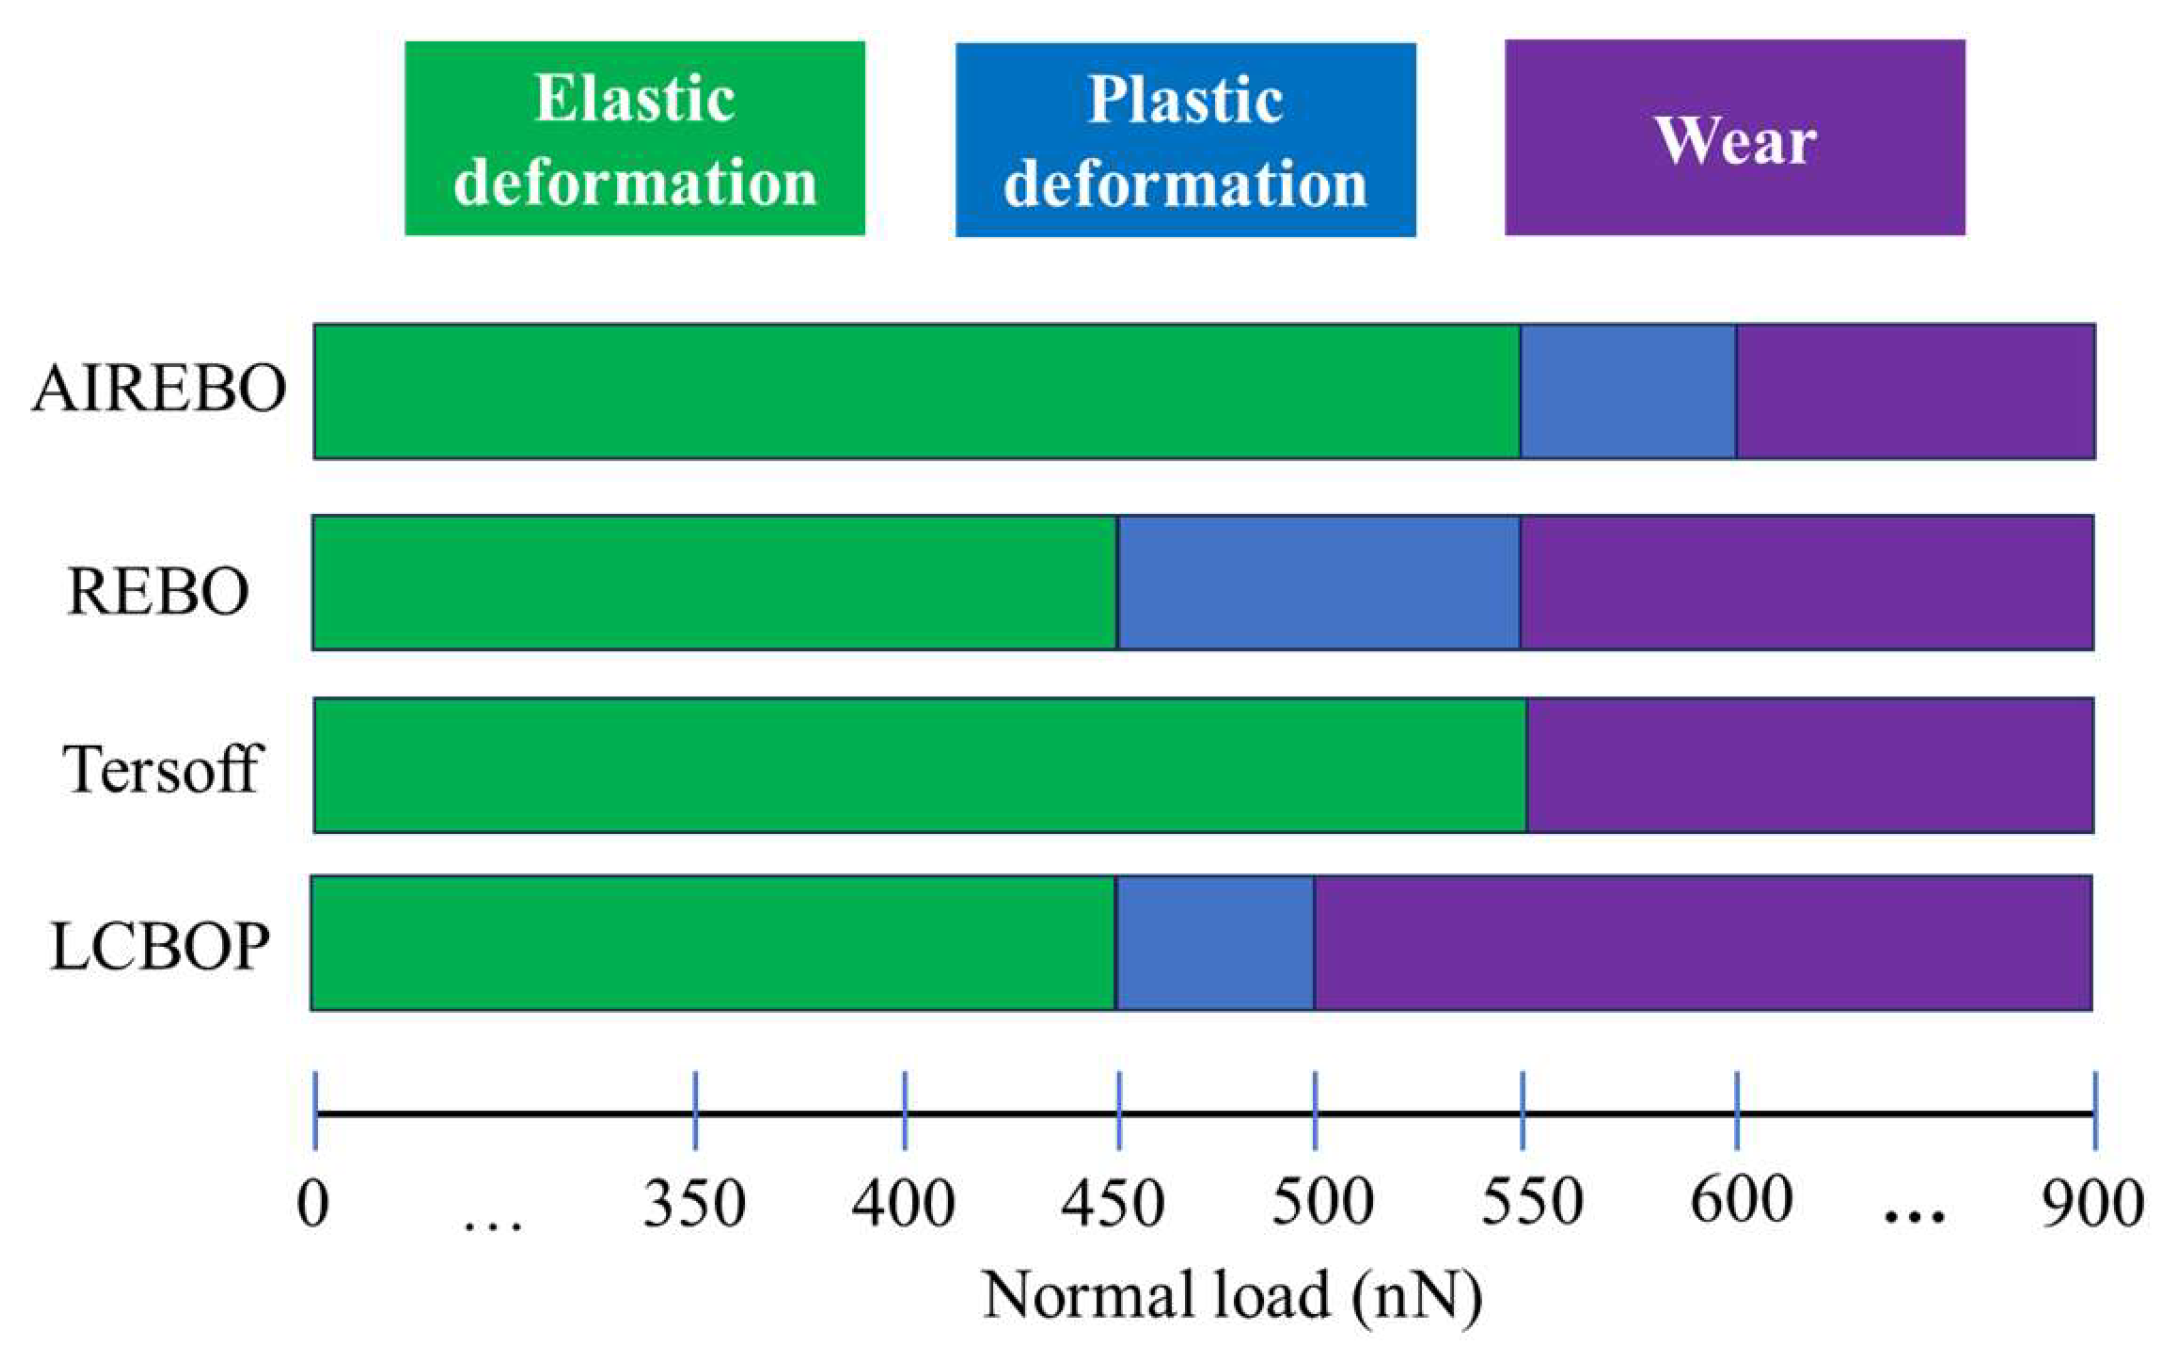
3. Results and Discussion
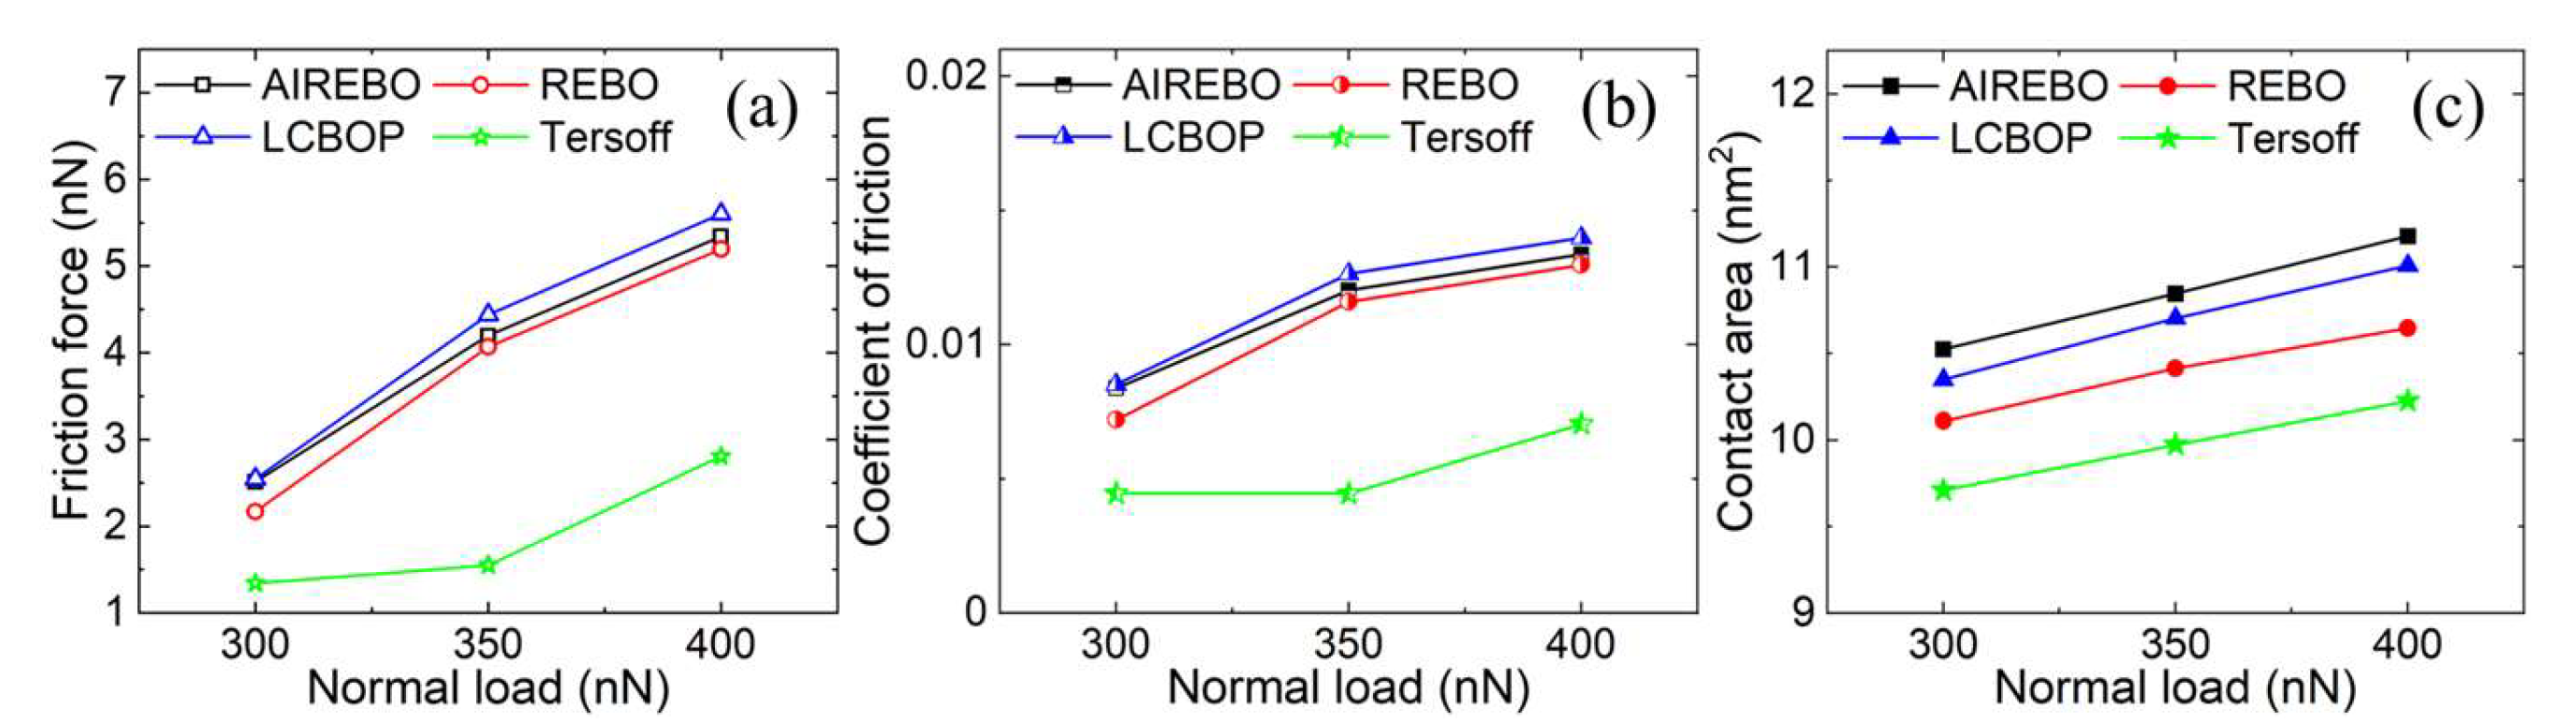
3.1. Elastic Deformation Phase
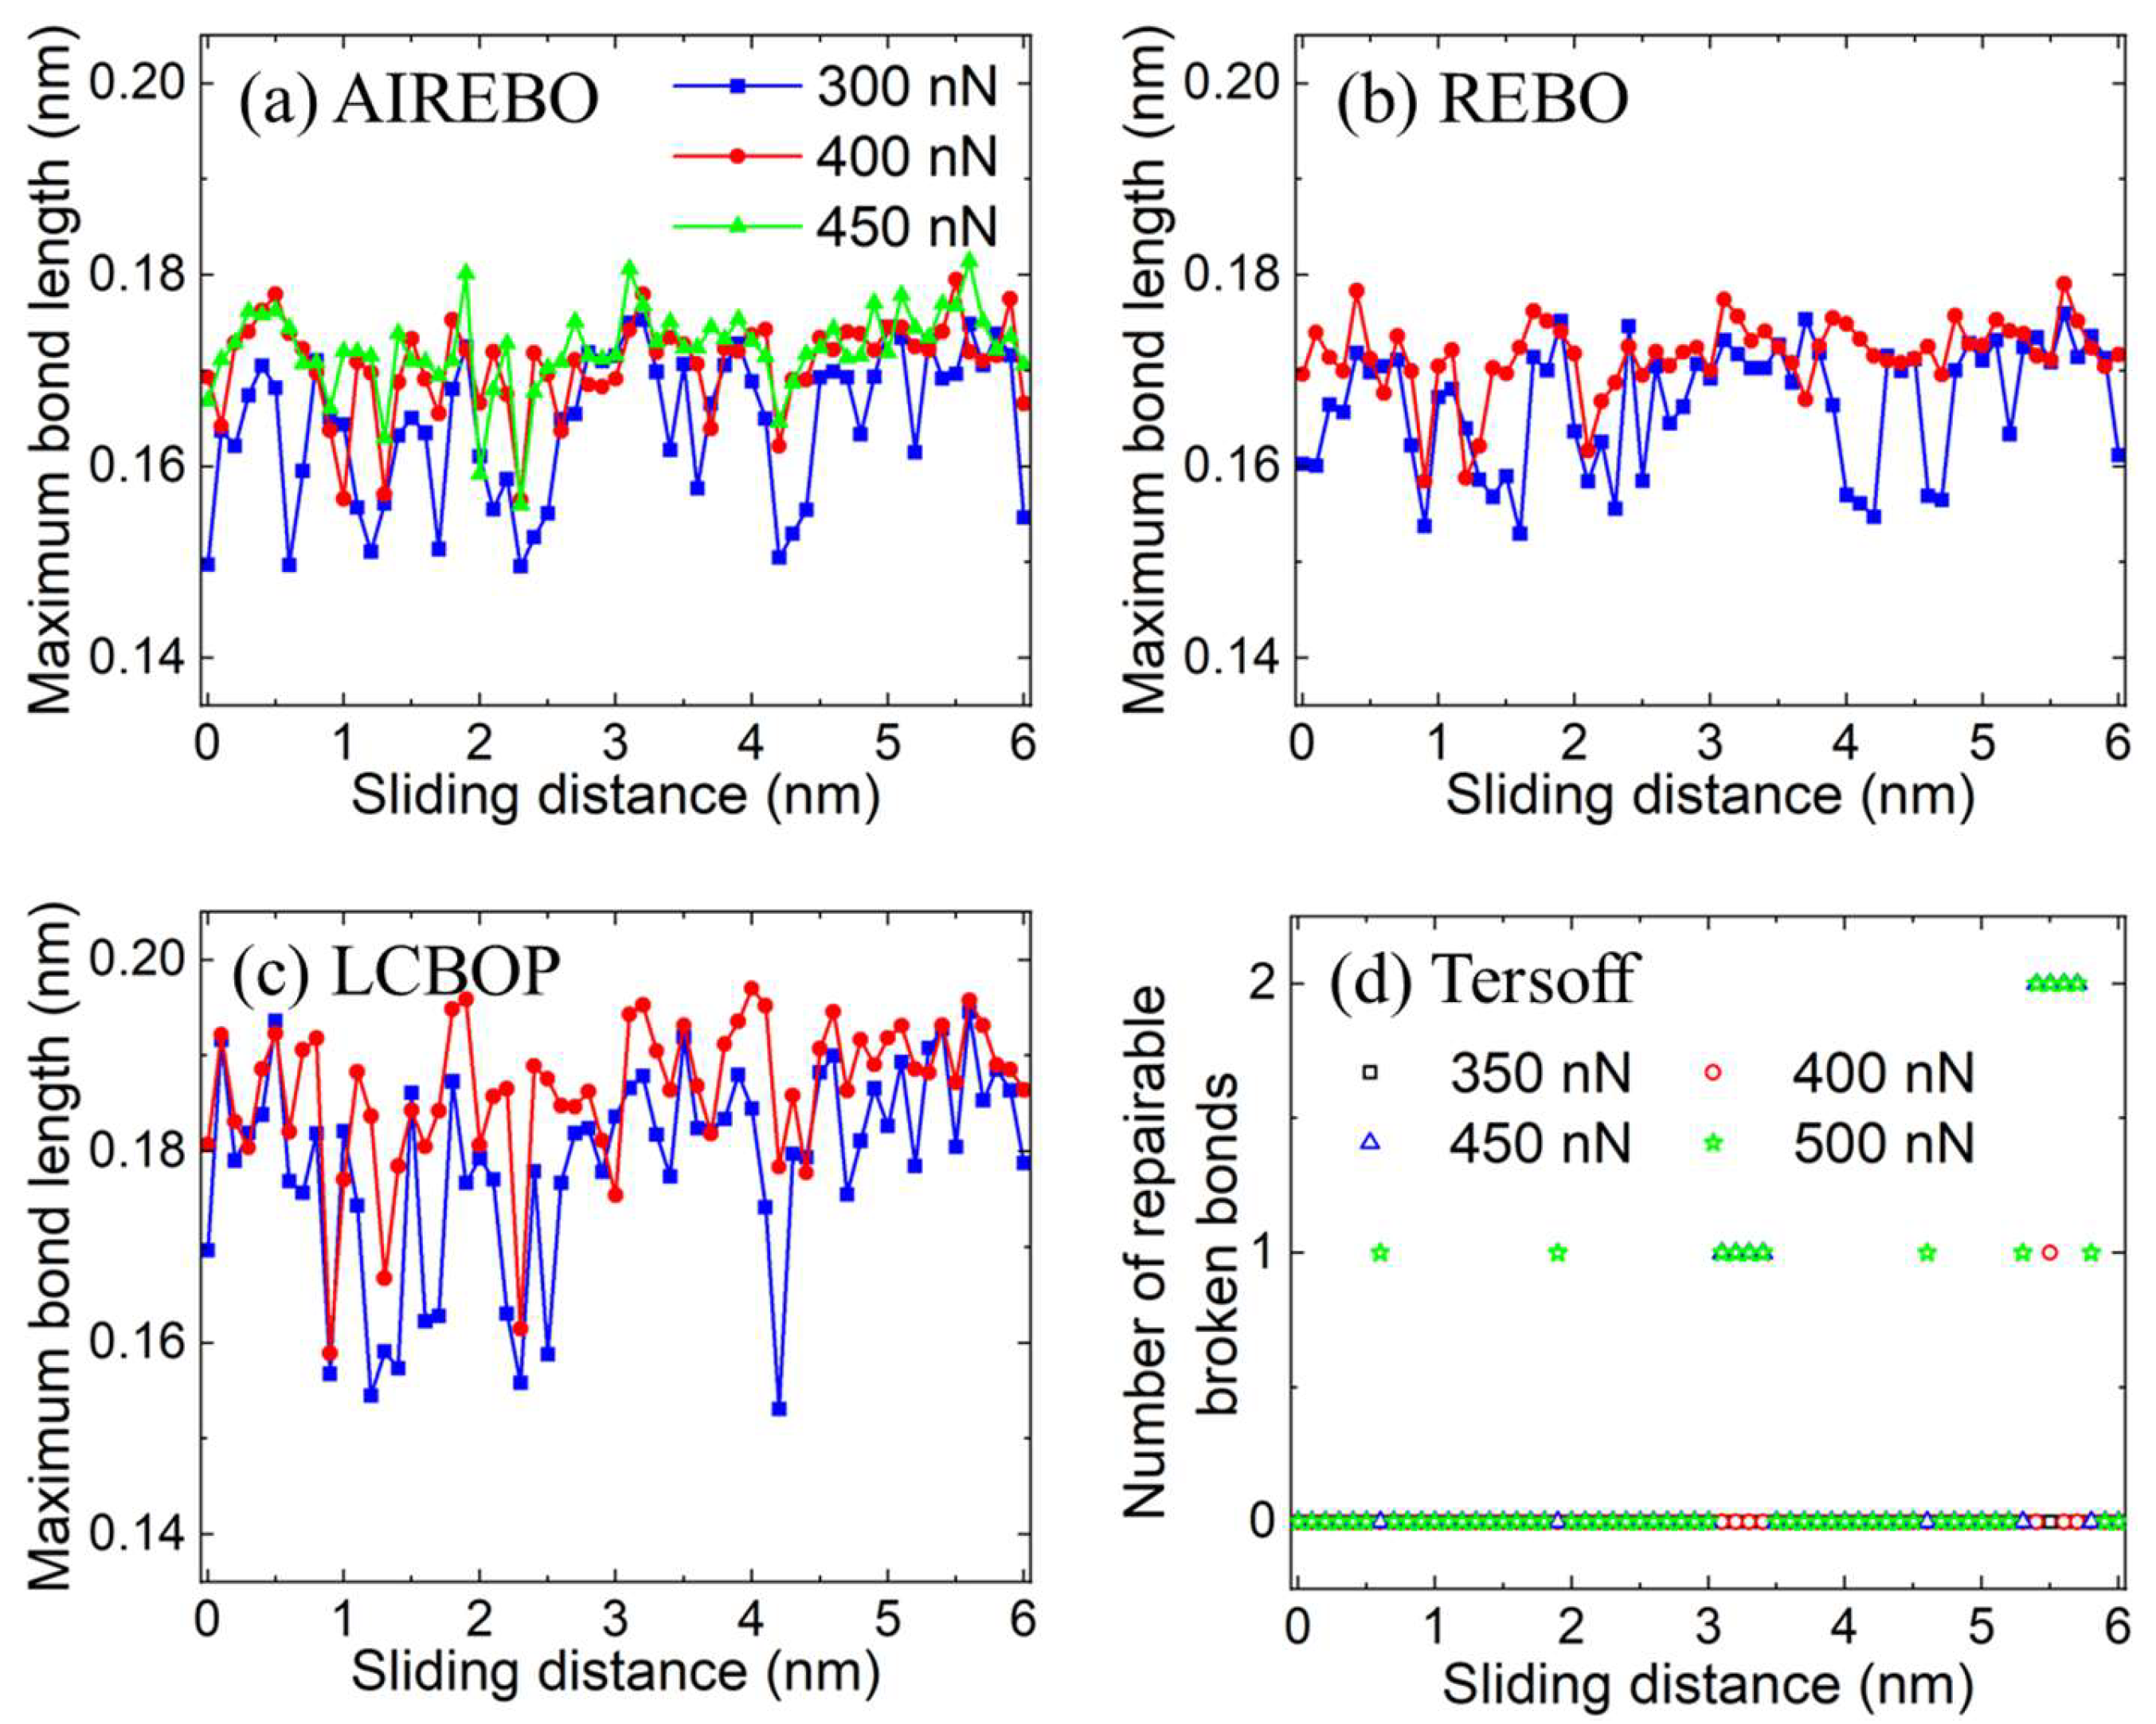
3.2. Plastic Deformation Phase
3.3. Wear Phase
4. Conclusions
Author Contributions
Funding
Data Availability Statement
Conflicts of Interest
References
- Lee, C.; Wei, X.; Kysar, J.W.; Hone, J. Measurement of the Elastic Properties and Intrinsic Strength of Monolayer Graphene. Science 2008, 321, 385–388. [Google Scholar] [CrossRef] [PubMed]
- Tan, P.H.; Han, W.P.; Zhao, W.J.; Wu, Z.H.; Chang, K.; Wang, H.; Wang, Y.F.; Bonini, N.; Marzari, N.; Pugno, N.; et al. The shear mode of multilayer graphene. Nat. Mater. 2012, 11, 294–300. [Google Scholar] [CrossRef] [PubMed]
- Liu, Y.; Ge, X.; Li, J. Graphene lubrication. Appl. Mater. Today 2020, 20, 100662. [Google Scholar] [CrossRef]
- Liu, Y.; Yu, S.; Shi, Q.; Ge, X.; Wang, W. Graphene-Family Lubricant Additives: Recent Developments and Future Perspectives. Lubricants 2022, 10, 215. [Google Scholar] [CrossRef]
- Yi, S.; Chen, X.; Li, J.; Liu, Y.; Ding, S.; Luo, J. Macroscale superlubricity of Si-doped diamond-like carbon film enabled by graphene oxide as additives. Carbon 2021, 176, 358–366. [Google Scholar] [CrossRef]
- Wu, G.; Ogata, S.; Gao, L. Atomistic simulations of the frictional properties of 2D materials: A review. J. Phys. D Appl. Phys. 2024, 57, 293001. [Google Scholar] [CrossRef]
- Liu, Y.; Song, A.; Xu, Z.; Zong, R.; Zhang, J.; Yang, W.; Wang, R.; Hu, Y.; Luo, J.; Ma, T. Interlayer Friction and Superlubricity in Single-Crystalline Contact Enabled by Two-Dimensional Flake-Wrapped Atomic Force Microscope Tips. ACS Nano 2018, 12, 7638–7646. [Google Scholar] [CrossRef] [PubMed]
- Yi, S.; Li, J.; Liu, Y.; Ge, X.; Zhang, J.; Luo, J. In-situ formation of tribofilm with Ti3C2Tx MXene nanoflakes triggers macroscale superlubricity. Tribol. Int. 2021, 154, 106695. [Google Scholar] [CrossRef]
- Li, P.; Wang, B.; Ji, L.; Li, H.; Chen, L.; Liu, X.; Zhou, H.; Chen, J. Environmental Molecular Effect on the Macroscale Friction Behaviors of Graphene. Front. Chem. 2021, 9, 679417. [Google Scholar] [CrossRef] [PubMed]
- Gao, X.; Ouyang, W.; Urbakh, M.; Hod, O. Superlubric polycrystalline graphene interfaces. Nat. Commun. 2021, 12, 5694. [Google Scholar] [CrossRef]
- Gao, X.; Urbakh, M.; Hod, O. Stick-Slip Dynamics of Moiré Superstructures in Polycrystalline 2D Material Interfaces. Phys. Rev. Lett. 2022, 129, 276101. [Google Scholar] [CrossRef] [PubMed]
- Zhang, J.; Xu, Q.; Gao, L.; Ma, T.; Qiu, M.; Hu, Y.; Wang, H.; Luo, J. A molecular dynamics study of lubricating mechanism of graphene nanoflakes embedded in Cu-based nanocomposite. Appl. Surf. Sci. 2020, 511, 145620. [Google Scholar] [CrossRef]
- Li, S.; Li, Q.; Carpick, R.W.; Gumbsch, P.; Liu, X.Z.; Ding, X.; Sun, J.; Li, J. The evolving quality of frictional contact with graphene. Nature 2016, 539, 541–545. [Google Scholar] [CrossRef] [PubMed]
- Zheng, X.; Su, L.; Deng, G. Influence of Nanoparticles in Lubricant on Sliding Contact of Atomic Rough Surfaces—A Molecular Dynamics Study. Lubricants 2024, 12, 160. [Google Scholar] [CrossRef]
- Dmitriev, A.I.; Nikonov, A.Y.; Österle, W. Molecular Dynamics Modeling of the Sliding Performance of an Amorphous Silica Nano-Layer—The Impact of Chosen Interatomic Potentials. Lubricants 2018, 6, 43. [Google Scholar] [CrossRef]
- de Tomas, C.; Suarez-Martinez, I.; Marks, N.A. Graphitization of amorphous carbons: A comparative study of interatomic potentials. Carbon 2016, 109, 681–693. [Google Scholar] [CrossRef]
- Tersoff, J. Empirical Interatomic Potential for Carbon, with Applications to Amorphous Carbon. Phys. Rev. Lett. 1988, 61, 2879–2882. [Google Scholar] [CrossRef] [PubMed]
- Brenner, D.W. Empirical potential for hydrocarbons for use in simulating the chemical vapor deposition of diamond films. Phys. Rev. B 1990, 42, 9458–9471. [Google Scholar] [CrossRef] [PubMed]
- Brenner, D.W.; Olga, A.S.; Judith, A.H.; Steven, J.S.; Boris, N.; Susan, B.S. A second-generation reactive empirical bond order (REBO) potential energy expression for hydrocarbons. J. Phys. Condens. Matter 2002, 14, 783. [Google Scholar] [CrossRef]
- Stuart, S.J.; Tutein, A.B.; Harrison, J.A. A reactive potential for hydrocarbons with intermolecular interactions. J. Chem. Phys. 2000, 112, 6472–6486. [Google Scholar] [CrossRef]
- Los, J.H.; Fasolino, A. Intrinsic long-range bond-order potential for carbon: Performance in Monte Carlo simulations of graphitization. Phys. Rev. B 2003, 68, 024107. [Google Scholar] [CrossRef]
- Zhang, J.; Gao, X.; Xu, Q.; Ma, T.; Hu, Y.; Luo, J. Atomistic insights into friction and wear mechanisms of graphene oxide. Appl. Surf. Sci. 2021, 546, 149130. [Google Scholar] [CrossRef]
- Xu, Q.; Li, X.; Zhang, J.; Hu, Y.; Wang, H.; Ma, T. Suppressing Nanoscale Wear by Graphene/Graphene Interfacial Contact Architecture: A Molecular Dynamics Study. ACS Appl. Mater. Interfaces 2017, 9, 40959–40968. [Google Scholar] [CrossRef]
- Plimpton, S. Fast Parallel Algorithms for Short-Range Molecular Dynamics. J. Comput. Phys. 1995, 117, 1–19. [Google Scholar] [CrossRef]
- Stukowski, A. Visualization and analysis of atomistic simulation data with OVITO–the Open Visualization Tool. Model. Simul. Mater. Sci. Eng. 2010, 18, 015012. [Google Scholar] [CrossRef]
- Klemenz, A.; Pastewka, L.; Balakrishna, S.G.; Caron, A.; Bennewitz, R.; Moseler, M. Atomic Scale Mechanisms of Friction Reduction and Wear Protection by Graphene. Nano Lett. 2014, 14, 7145–7152. [Google Scholar] [CrossRef]
- Vasić, B.; Matković, A.; Ralević, U.; Belić, M.; Gajić, R. Nanoscale wear of graphene and wear protection by graphene. Carbon 2017, 120, 137–144. [Google Scholar] [CrossRef]
- Egberts, P.; Han, G.H.; Liu, X.Z.; Johnson, A.T.C.; Carpick, R.W. Frictional Behavior of Atomically Thin Sheets: Hexagonal-Shaped Graphene Islands Grown on Copper by Chemical Vapor Deposition. ACS Nano 2014, 8, 5010–5021. [Google Scholar] [CrossRef]
- Sandoz-Rosado, E.J.; Tertuliano, O.A.; Terrell, E.J. An atomistic study of the abrasive wear and failure of graphene sheets when used as a solid lubricant and a comparison to diamond-like-carbon coatings. Carbon 2012, 50, 4078–4084. [Google Scholar] [CrossRef]
- Zhang, J.; Chen, X.; Xu, Q.; Ma, T.; Hu, Y.; Wang, H.; Tieu, A.K.; Luo, J. Effects of grain boundary on wear of graphene at the nanoscale: A molecular dynamics study. Carbon 2019, 143, 578–586. [Google Scholar] [CrossRef]
- Pastewka, L.; Pou, P.; Pérez, R.; Gumbsch, P.; Moseler, M. Describing bond-breaking processes by reactive potentials: Importance of an environment-dependent interaction range. Phys. Rev. B 2008, 78, 161402. [Google Scholar] [CrossRef]
- Zhu, Y.; Li, N.; Zhang, L.; Xia, H.; Cheng, D.; Ma, H. Atomistic simulation on frictional response of nanoscratched Al–graphene system. AIP Adv. 2021, 11, 075112. [Google Scholar] [CrossRef]
- Zhang, J.; Deng, G.; Li, W.; Su, L.; Liu, X.; Ma, T.; Gao, L. Impacts of chemical short-range orders on nanotribological properties of CrCoNi medium-entropy alloy at room and cryogenic temperatures. Tribol. Int. 2024, 191, 109191. [Google Scholar] [CrossRef]
- Qi, Y.; Liu, J.; Zhang, J.; Dong, Y.; Li, Q. Wear Resistance Limited by Step Edge Failure: The Rise and Fall of Graphene as an Atomically Thin Lubricating Material. ACS Appl. Mater. Interfaces 2017, 9, 1099–1106. [Google Scholar] [CrossRef] [PubMed]
- Szlufarska, I.; Chandross, M.; Carpick, R.W. Recent advances in single-asperity nanotribology. J. Phys. D Appl. Phys. 2008, 41, 123001. [Google Scholar] [CrossRef]
- Huang, Z.; Chen, S.; Lin, Q.; Ji, Z.; Gong, P.; Sun, Z.; Shen, B. Microscopic Mechanisms behind the High Friction and Failure Initiation of Graphene Wrinkles. Langmuir 2021, 37, 6776–6782. [Google Scholar] [CrossRef]
- Tran-Khac, B.-C.; Kim, H.-J.; DelRio, F.W.; Chung, K.-H. Operational and environmental conditions regulate the frictional behavior of two-dimensional materials. Appl. Surf. Sci. 2019, 483, 34–44. [Google Scholar] [CrossRef] [PubMed]
- Xu, C.; Zhang, S.; Du, H.; Xue, T.; Kang, Y.; Zhang, Y.; Zhao, P.; Li, Q. Revisiting Frictional Characteristics of Graphene: Effect of In-Plane Straining. ACS Appl. Mater. Interfaces 2022, 14, 41571–41576. [Google Scholar] [CrossRef] [PubMed]
- Sun, X.-Y.; Wu, R.; Xia, R.; Chu, X.-H.; Xu, Y.-J. Effects of Stone-Wales and vacancy defects in atomic-scale friction on defective graphite. Appl. Phys. Lett. 2014, 104, 183109. [Google Scholar] [CrossRef]
- Cao, A.; Shen, B.; Lin, Q.; Chen, S.; Huang, Z.; Ji, Z.; Zhang, Z. Influence of Stone-Wales defect on graphene friction: Pinning effect and wrinkle modification. Comput. Mater. Sci. 2020, 173, 109423. [Google Scholar] [CrossRef]
- Qi, Y.; Liu, J.; Dong, Y.; Feng, X.-Q.; Li, Q. Impacts of environments on nanoscale wear behavior of graphene: Edge passivation vs. substrate pinning. Carbon 2018, 139, 59–66. [Google Scholar] [CrossRef]
- Huang, Y.; Yao, Q.; Qi, Y.; Cheng, Y.; Wang, H.; Li, Q.; Meng, Y. Wear evolution of monolayer graphene at the macroscale. Carbon 2017, 115, 600–607. [Google Scholar] [CrossRef]
- Zhang, J.; Li, W.; Qin, R.; Chen, P.; Liu, Y.; Liu, X.; Gao, L. An atomic insight into the stoichiometry effect on the tribological behaviors of CrCoNi medium-entropy alloy. Appl. Surf. Sci. 2022, 593, 153391. [Google Scholar] [CrossRef]


Disclaimer/Publisher’s Note: The statements, opinions and data contained in all publications are solely those of the individual author(s) and contributor(s) and not of MDPI and/or the editor(s). MDPI and/or the editor(s) disclaim responsibility for any injury to people or property resulting from any ideas, methods, instructions or products referred to in the content. |
© 2024 by the authors. Licensee MDPI, Basel, Switzerland. This article is an open access article distributed under the terms and conditions of the Creative Commons Attribution (CC BY) license (https://creativecommons.org/licenses/by/4.0/).
Share and Cite
Ye, X.; Zhang, J.; Chen, P. Impact of Interatomic Potentials on Atomic-Scale Wear of Graphene: A Molecular Dynamics Study. Lubricants 2024, 12, 245. https://doi.org/10.3390/lubricants12070245
Ye X, Zhang J, Chen P. Impact of Interatomic Potentials on Atomic-Scale Wear of Graphene: A Molecular Dynamics Study. Lubricants. 2024; 12(7):245. https://doi.org/10.3390/lubricants12070245
Chicago/Turabian StyleYe, Xueqi, Jie Zhang, and Ping Chen. 2024. "Impact of Interatomic Potentials on Atomic-Scale Wear of Graphene: A Molecular Dynamics Study" Lubricants 12, no. 7: 245. https://doi.org/10.3390/lubricants12070245
APA StyleYe, X., Zhang, J., & Chen, P. (2024). Impact of Interatomic Potentials on Atomic-Scale Wear of Graphene: A Molecular Dynamics Study. Lubricants, 12(7), 245. https://doi.org/10.3390/lubricants12070245