Abstract
The aim of this study was to identify the areal surface parameters that correlated with lowering of sliding friction. Different ground surfaces were created on stainless steel and the lubricated sliding friction generated at the contact interface with a flat-faced aluminum pin was studied. The frictional force encountered is an order of magnitude lower for a P1200-finished surface than the other ground surfaces. Using 3D surface profilometry, a unique surface parameter ratio “Spk/Sk” was found to predict the frictional performance of these surfaces. When this surface parameter ratio was less than 1, average sliding friction was close to 0.1. When this ratio was greater than 1, the coefficient was an order of magnitude lower. Using energy dispersive spectrometry, such surfaces after wear showed the presence of a uniform dispersed layer of iron oxide on the surface of the pin. This was absent on the surfaces having high friction, indicating the role of the steel counter surface in building this beneficial transfer layer. Scanning electron microscopy provided topography images to visualize the surface wear. The motivation for the authors was to use a commercially scaled process like precision grinding for the surface modifications on stainless steel.
1. Introduction
The manufacturing industry, and conventionally the automotive industry, rely on grinding as a cost-efficient and scalable process to modify surface roughness with a view to improving dimension, fit, and appearance, apart from meeting performance requirements [1], including sliding friction and wear [2], where mating surfaces are involved. Although surfaces and interfaces are multifold, those that are in contact and move relative to each other gather special attention with regards to surface modification and refinement. Such functional surfaces need to be studied, analyzed, and controlled as part of ongoing research and while setting design specifications needed for manufacturing, inspection, and quality control stages. The parameters thus defined [3,4] will have a key relationship with the outgoing quality of products manufactured, the part and system durability requirements, and the functional requirements that the part is required to meet. Karkalos et al. [5], in their studies on slot milling, found that the influences of the coolant and depth of cut were key factors in milling for reducing surface roughness.
Burnishing as a finishing operation was examined by Tayeb et al. [6], where machining parameters like burnishing speed, force, and ball diameters influenced the surface roughness. These machined surfaces determined the friction at contact, the quantum of wear [7], and the ability to retain or repel fluids. Jeng [8] conducted surface roughness experiments using riblet tapes to generate repeatable surfaces in the early 1990s; using the contact-based characterization techniques, the study proposed reducing roughness heights to enhance sliding friction and reducing wear where mating surfaces are involved.
Texturing has always been a favorite topic of research, especially to those working in the fields of tribology, surface coatings, and surface modification. Laser surface texturing is widely accepted, and a popular fabrication technique used by these researchers [9,10]. Many of these studied were targeted to understand the effect of surface topography on reducing friction [11,12]. The authors here, in a previous publication [13], discussed their observations on the shape of the frictional force profiles using different surface topographies machined on a stainless steel counterface. There, it was noted that the shape of the frictional force profiles changed with changes in the surface topography of the stainless steel countersurface. It was also observed that the shape of the plots changed with the change in the speed of the reciprocating table and with the viscosity of the lubricant used. It was thus pertinent to further investigate these different topographies to find the reason for the change in the shape of the frictional force profiles. The techniques of SEM, SEM-EDS, BSE- SEM, and three-dimensional (3D) optical profilometry were used effectively to understand the mechanisms in greater detail.
In modern times, optical interference microscopy is used as a major noncontact characterization strategy towards developing new surface modification processes and for quality control. Scanning surfaces to obtain information on three-dimensional surface parameters [14] helps standardize and ensure the functionality of manufactured parts. There are more than 40 areal surface parameters defined to characterize a surface [15]. Areal surface parameters represent more information and data points about a surface than the conventionally used 2D surface parameters, and hence are more statistically significant. Three-dimensional profilometry is hence being widely used by researchers to understand the surface topography and predict sliding friction based on the influence of some key surface parameters. Comparison between the two commonly used dimensional parameters in the industry and the current 3D surface parameters indicates the wealth of information contained with them. Dong at al. [16,17] recognized that for control of surface roughness, the profiling techniques and two-dimensional (2D) parameters were inadequate. They defined an effective and widely accepted 3D parameter set for mass adoption. Functional indices were proposed to describe some fundamental functional properties of bearing and fluid retention from the characteristics of the surface bearing area ratio curve. Sedlacek [18] et al. used the surface roughness parameters Ssk and Sku to predict the tribological behavior of contact surfaces; they found that higher values of kurtosis and lower skewness lead to lower friction. Turned surfaces which have positive skewness display higher sliding friction than surfaces with porosities which have a negative value of skewness. Surface with porosities act like a micro-reservoir and help retain the lubricant and wear particles; thus, negatively skewed surfaces display lower sliding friction. A still lower skewness meant that friction was still lower. This is true for surfaces which have almost the same Sa and Sz, but different values of Ssk and a kurtosis of almost 3.
Contact profilometers continue to still be used for their economy and ease of usage. However, where the design requires tighter control of surface morphology, for example like machining of fuel injectors, gears, and bearing races [19], the use of dedicated 3D optical profilometers in process control is necessary. In the present study, the topography measurements were carried out by 3D vertical interferometry equipment, whose reliability is higher than that of the conventional stylus measurements.
W.P. Dong et al. [20] investigated the 3D properties of a surface, mainly the amplitude and hybrid parameters. They postulated that the bearing area ratio curve can be used to calculate the material volume of the surface topography and the void volume enclosed in the interfacial area of the material. These parameters are closely interrelated to the functional properties of surfaces, such as the bearing, wear, running-in, and fluid retention. The surface bearing ratio, obtained from the area material ratio curve, is related to the ratio of the contacting area obtained by truncating the surface summits by a plane parallel to the mean plane at a given truncation level over the sampling area.
Grzesik et al. studied [21] the areal surface parameters of a machined surface to conclude that the increased wear resistance came from an increased valley void volume and a reduced material volume in the peaks. Vmp and Vvv are terms used for quantifying the volume in the peaks and valleys, respectively, where a lower Vmp indicated higher wear resistance, and vice versa, while a higher Vvv indicated a higher fluid retention tendency.
Pradeep L Menezes et al. [22,23] elaborated oil retention properties while observing that random smoother surfaces could retain more oil and could reduce the coefficient of friction during sliding as compared to surfaces prepared by unidirectional sliding of abrasives and an “8” pattern of abrading and surface preparation. They concluded that the parameter “Del a”, which is an average of the slope of the surface profile, influences the ploughing component of friction and increases with the increase in “Del a”. The transfer layer formation of the soft surface on the hard counter surface was found to the highest where the “Sda” or “Del a” parameter was the highest. The ploughing component was associated with the plastic deformation of the asperities, and hence was highest on surfaces with the highest Sda, whereas the adhesive component of friction dominated where oil lubrication was absent.
Studies by Prajapati and Tiwari [24] on pin-on-disk dry sliding tests found a correlation between the coefficient of friction (COF) and areal surface parameters for AISI 304 steel. They reported a negative correlation between COF and the areal surface parameters autocorrelation length Sal and skewness Sk, and a positive correlation between RMS roughness Sq and mean summit curvature Ssc.
Sedlacek et al. [25] used the information from the areal surface analysis to investigate the correlation between commonly used parameters like average surface roughness Sa, skewness Ssk, and kurtosis Ssk and the sliding friction during boundary lubricated sliding. They demonstrated that the standard roughness parameters Sa and Sq are not sufficient to determine the tribological properties of contact surfaces. They showed that surfaces with higher Sku and negative Ssk values tend to reduce friction even with different and higher average surface roughness values. They also found that under boundary lubrication, Ssk and Svk also showed a good correlation with the coefficient of friction and could be used for planning surfaces towards achieving a desired tribological behavior.
Reddy et al. [26] investigated the effect of areal surface parameters according to ISO 25178 [14] on the tribological behavior during lubricated sliding at varied weights and sliding speeds. They found that Vvv, Svk, Spk, Sk, Sku, Sk, and Sq showed a strong correlation with friction and wear depth. They concluded that Vvv and Svk retained the lubricant and increased the life of the component. Pettersson et al. [27,28] found that by introducing controlled peaks and valleys in a relatively flat surface, the frictional performance can be improved. Lubricant can remain trapped inside these mini reservoirs, lowering friction and increasing the durability of the system. Ibatan et al. [29] stated that in the hydrodynamic and mixed lubrication regime, the microcavity in the surface acts as a reservoir for fluid lubricant, while in the boundary lubrication regime, it traps wear particles to reduce the third body abrasion.
The authors had previously discussed [13] the shape of the frictional force curves for the different ground surfaces on the steel countersurface. The P1200-finished surface yielded extremely low sliding friction and generated almost a flat frictional force curve when compared with P320- and mirror-finished surfaces. Here, the steel flat was in reciprocated sliding against an aluminum flat pin, in the presence of a lubricant. The authors wanted to explain why the shape of these force curves were so different from each other. In one of their experiments here, the authors could generate different P320-finished surfaces by varying the quantity of grinding fluid. These surfaces had almost similar root mean square surface roughness but showed widely different frictional force responses. The aim of this study was to understand how the areal surface parameters in each of the topographies could relate to the obtained coefficient of COF. In this paper, the authors intend to discuss the 3D surface parameters using vertical scanning interferometry and predict the magnitude of sliding friction that was obtained. The reasons for lowering the sliding friction for the P1200 surface were already discussed in the previous paper; the authors further substantiate it with the aid of scanning electron microscopy and energy dispersive spectrometry.
2. Materials and Methods
Flat specimens of grade 304 stainless steel with Rockwell hardness B98 of 30 mm × 30 mm were laser cut from a single stock having a thickness of 4 mm; the faces were ground and lapped to a mirror finish using a table grinder, as shown in Figure 1. This was achieved by grinding the surface with a series of coated abrasives on the table grinder, starting from a coarse P320 followed by P400, P600, P800, P1000, P1200, P1500, and finally P2000 grit sizes.
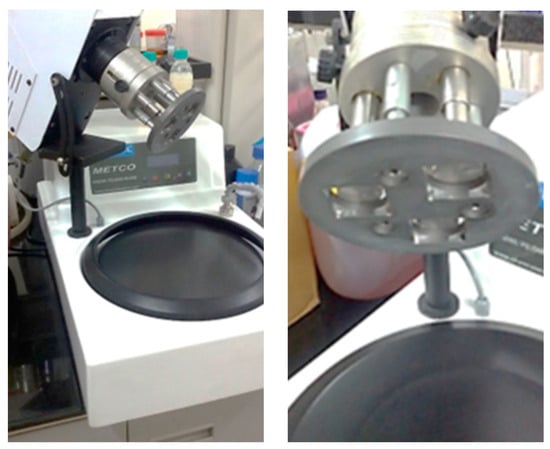
Figure 1.
The table grinder with the custom-made square specimen holder [13].
After each step, the specimens were cleaned in an ultrasonic bath with ethanol followed by hexane. The surfaces were lapped with a ceramic polishing slurry to achieve the mirror finish. To prepare a specimen with the ground finish, sandpaper of the select grit was used to grind the surface through a controlled and repeatable process; these specimens are referred to by the grit size used for preparation, viz., P1200 and P320. Variations in areal surface parameters were also achieved by varying the quantity of grinding fluid used for wetting the surfaces; hence, this quantity was controlled to generate repeatable surface topographies in this study.
The stainless steel flat and aluminum pin specimens were then tested for friction on a pin-on-flat reciprocating tribometer driven by a Scotch yoke mechanism, as shown in Figure 2. The Scotch yoke mechanism was responsible for the reciprocation, and hence the velocity profile was sinusoidal. Aluminum 6061 T6 pins of hardness level HRB 61 with a diameter of 3 mm were used in the test. These pins were run-in suitably while the run-in debris was intermittently cleaned from the contact zone.
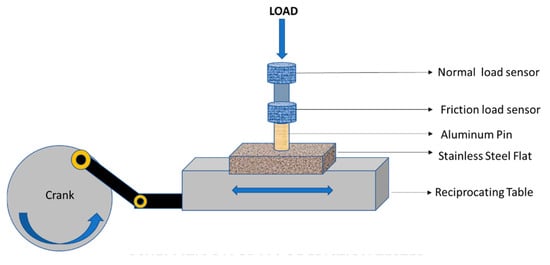
Figure 2.
Schematic of the tribometer and the loading arrangement [13].
Once the run-in was completed, the pins were tested in the tribometer set up to a vertical Z load of 50 N and 20 mm stroke at preset frequencies of reciprocation. The areal surface parameters were measured using vertical scanning interferometry. A Gaussian filter was applied with a S-filter cutoff of 8 µm and L-filter cutoff of 0.08 mm, and the objective magnification used was 10X. The total sliding distance was 72 m, while the frequency of sliding was maintained at 1 Hz for 1800 reciprocating cycles.
Group 1 base oil of API Group 1 SN500, which had a kinematic viscosity of 100 cSt at 40 °C, was used in this study. The secondary emission mode and back-scattering mode of a scanning electron microscope were used to scan the surface composition and image the surface topography; an energy dispersive spectrometer quantified the composition of the surface and tribolayers.
During boundary lubrication, as defined by the Stribeck curve there is an inverse relationship between the sliding velocity and the frictional force. The frictional force reaches a maximum at velocities approaching zero. At maximum velocities, the friction force is the lowest. Figure 3 below shows the velocity profile and the instantaneous frictional force plotted against the crank angle. An alternating “M” and inverted “M” shape was seen, which conforms to the classical Stribeck behavior. This plot was used as a reference to compare the actual frictional force plots observed in the sliding experiments that followed.
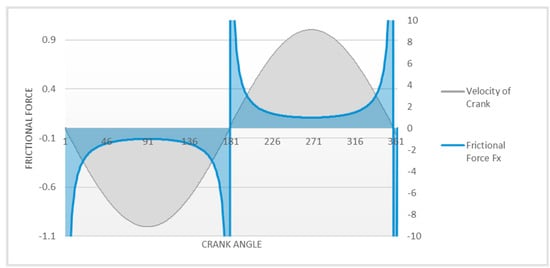
Figure 3.
The velocity profile of the reciprocating table and the theoretical frictional force profile [13].
3. Background
The authors in their previous work [11] observed that the sliding friction was extremely low for a P1200finished surface as compared to other similarly prepared surfaces such as mirror, P2000, P800, and P320-finished surfaces. In their work, they varied different components of the tribo-system, like oil viscosity, speed of reciprocation, and the contact pressures; they found that in all the combinations, the P1200-finished surfaces exhibited extremely low friction, while the mirror and P320 exhibited higher friction. This phenomenon was widely pronounced at lower sliding velocities and where viscosity of the oil was relatively higher. The authors decided to investigate further using these three surfaces in this study. Figure 4 shows the shape of the frictional profiles on mirror-, P1200-, and P320-finished surfaces.
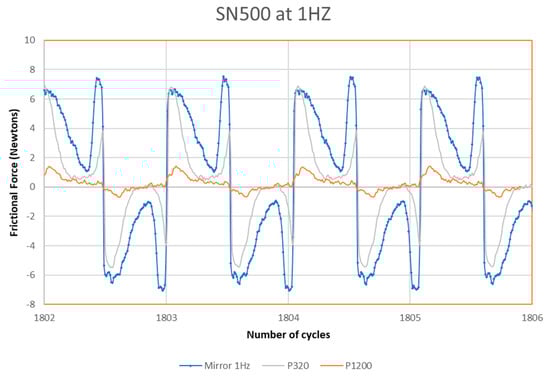
Figure 4.
Plot of frictional force vs. number of reciprocating cycles for different finished surface.
The pin-on-flat tribo-system accelerates from zero velocity in the boundary lubrication zone to a maximum velocity at the middle of the stroke corresponding to the mixed lubrication zone. It later returns to the boundary lubrication zone as the system decelerates to zero velocity, before the direction reversal occurs and this cycle repeats until the end of the test. Neglecting any surface effects and using the Stribeck phenomena governing the relationship between the sliding friction with other tribo-system parameters, the authors could theoretically predict the shape (Figure 3) of the frictional force curve for a complete reciprocating cycle.
In these sliding experiments, the friction force curves did not obey the classical Stribeck behavior when the topography was changed from a mirror-finished surface to a P1200-finished surface. The force profiles had almost disappeared to indicate minimal friction, as seen in Figure 4. For a P320-finished surface, the acceleration peaks were very prominent while the deceleration peaks were smaller.
It was believed that P1200 surfaces in combination with SN500 virgin base oil could entrap enough oil to ensure a continuous oil film was formed and retained even when the surface contact zone was decelerating to zero velocities. Sudeep et al. [30] stated that the wettability of textured surfaces increased as compared with smooth and lapped surfaces. While accelerating from zero velocities, the friction peaks were minimal, which would have resulted from the minimal surface peak heights resulting from the topography generated by the P1200 abrasive finishing process.
In this study, the contact surfaces of the stainless steel flat and the pin were observed under a 3D optical profilometer to understand what changes were occurring on the surface topography as the system reached steady state, while each test was run for 1800 reciprocating cycles with a stroke length of 20 mm. Surfaces were characterized using three-dimensional surface parameters and correlated with friction results obtained from sliding.
Further examination of the P1200- and P320-finished surfaces was conducted by comparing the wear surfaces on secondary emission (SE) imaging and back-scattered emission (BSE) imaging on a scanning electron microscope. The wear scars were also tested under energy dispersive spectrometry (EDS) to identify and characterize the tribo-layer formed on the contact surfaces.
4. Results
Using back-scattered imaging on a scanning electron microscope, the surface was scanned after completing 1800 reciprocating cycles. The images taken for the mirror-, P1200-, and P320-finished surfaces are shown in Figure 5. The frictional forces as recorded on the tribometer for these corresponding surfaces are plotted in Figure 4.
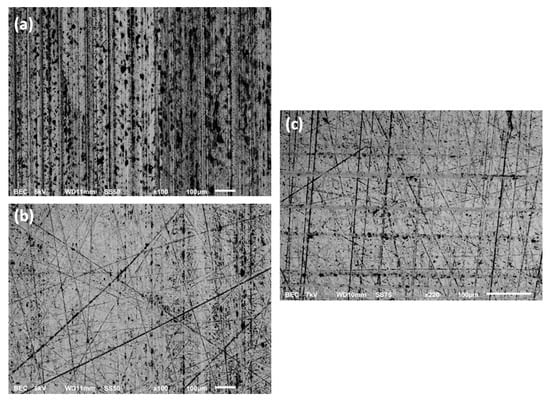
Figure 5.
BSE SEM micrographs after sliding for (a) mirror-finished surface, (b) P1200-finished surface, and (c) P320-finished surface.
The material removal is visible from the deep and parallel wear lines on the surface; this is positioned along the direction of the sliding of the pin. The dark spots seen are the aluminum wear particles from the pin transferred onto the steel counterface; see Figure 6.
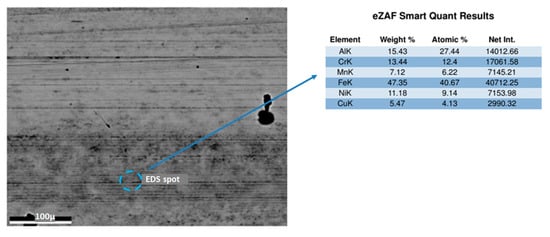
Figure 6.
BSE micrograph and EDS scan on black wear marks after sliding on P1200-finished stainless steel flat. Aluminum is present in the scan, indicating transfer of aluminum from the pin.
We can observe from Figure 5a that the mirror-finished surface after the end of test had deep wear marks resembling delamination and adhesive wear; dark lines are visible in the BSE image, indicating the wear of the aluminum pin and subsequent material transfer on the steel surface. From Figure 5a,b, it is observed that the wear was comparatively lower for P1200- and P320-finished surfaces. The black wear tracks did appear; however, they were significantly less with much lower intensities.
The wear marks and dark spots indicating material transfer are far less as compared to Figure 5a, indicating less wear of the aluminum pin. The EDS scan in Figure 6 indicates the presence of aluminum.
The BSE images, however, could not explain why P1200 surfaces had extremely low friction as compared to P320 surfaces, and why for P320-finished surfaces the Fx plots had significantly milder deceleration peaks as compared to the acceleration peaks seen in Figure 4.
The surfaces of the stainless steel flat were scanned before the sliding experiment using a 3D optical profilometer. The three different machined surfaces, viz., mirror-, P1200-, and P320-finished surfaces, were tabulated using the 3D surface parameters, which quantified the volume of peaks, valley roughness, and core roughness volumes; this is shown in Table 1.

Table 1.
Shows the different areal surface parameters analyzed on the optical surface profiler for the different surfaces.
In the analysis shown in Table 1, the surface parameter Spk/Sk happens to be less than 1 for the mirror-finished surface, where frictional curves followed the Stribeck curve relationship. For a P1200-finished surface, the surface parameter ratio Spk/Sk was noted to be greater than 1. It was found that the frictional force was exceptionally low, and the frictional force plot was subdued in the friction scale domain used for these tests. This was explained using the shape of the frictional force profiles in Figure 4.
By increasing the quantity of grinding fluid, the ‘P320-smooth’surface was prepared using P320 abrasive. This had a similar magnitude of root mean square (RMS) roughness as the P320 finished surface Zhou et al. [31] showed that by varying the grinding fluid parameters, the grinding forces changed, which further influenced the surface parameters and surface residual forces. The tabulation in Table 1 depicts the three surfaces using 3D surface parameters quantifying the volume of peak, valley roughness, and core roughness.
As seen in Table 1, the P1200-finished surfaces and “P320-smooth” surfaces had a surface parameter ratio Spk/Sk greater than 1. For the mirror-finished surface and P320-finished surface, the surface parameter ratio Spk/Sk was less than 1. The “P320-smooth” surfaces had very similar magnitudes and shapes of the frictional force plots as observed in the P1200-finished surfaces. Exceptionally low frictional forces were noted, and the frictional force plot was almost absent in the friction scale domain used for these tests. P320-finished surfaces showed higher sliding friction and the frictional curves followed the principles of the Stribeck curve.
Figure 7 shows that the surface of the pin is highly non-uniform, indicating severe sliding wear during running-in. This is also expected as the running-in procedure does not employ a viscous lubricant, as the objective is to ensure maximum surface-to-surface contact at the start of the test.
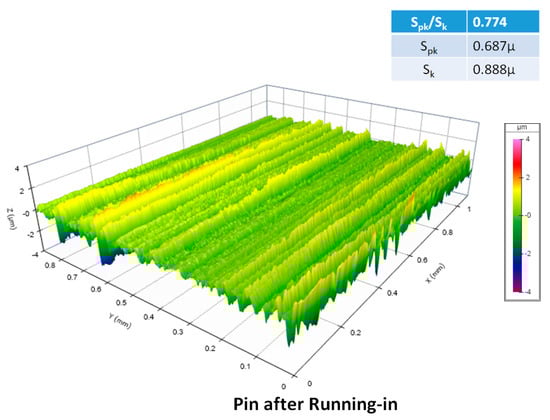
Figure 7.
Three-dimensional profile of the pin after “running-in” under 10X objective. The topography looked rough with deep ploughing marks and the surface parameter ratio Spk/Sk of this surface was less than 1.
Figure 7 and Figure 8 show the condition of the pin surface before and after the sliding test on a P1200-finished stainless steel surface. The measured surface parameter ratio on the pin surface, Spk/Sk was greater than 1 at the end of the test. A notable transformation in the surface topography was observed on the pin after the sliding test. The change in topography is evident, as the deep sliding wear marks present at the start of the test from the running-in have completely disappeared, to give a smooth topography at the end of the test.
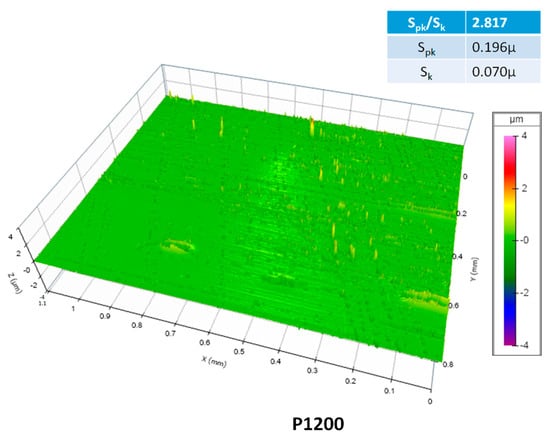
Figure 8.
Three-dimensional pin profile after 1800 cycles on P1200-finished surface. The topography looked smooth and the surface parameter ratio Spk/Sk of this surface was greater than 1.
Figure 9a,b show the back-scattered images of the pin surface at different magnifications, captured after the reciprocating sliding experiment on a P1200-finished steel surface.
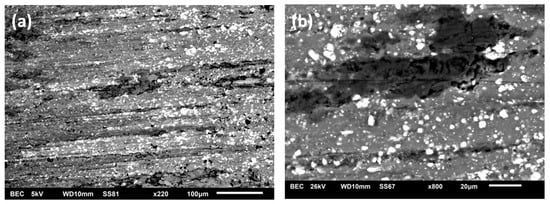
Figure 9.
(a). Back-scattered emission image of the pin after P1200 sliding test (at 220×). Observe the even layer of bright spots, identified later from EDS as an iron oxide layer. (b). Back-scattered emission image of the pin after P1200 sliding test (at 800×). The bright transfer layer is even more evident in this picture at higher magnification.
A fine dispersion of particles embedded on the pin surface was of the order of a micron in diameter. They are seen as evenly dispersed bright spots in the back-scattered image and were formed during the sliding experiment.
The EDS scan as shown in Figure 10 confirms the presence of an iron oxide layer in the bright spots seen on the surface. The scan in Figure 11 looks at the black spots found on the pin surface, as well as a point in the bulk matrix on the pin surface. The black spots correspond to carbon and oxygen either from the lubricant or from oxidation, while the bulk corresponds to the surface aluminum oxide layer.
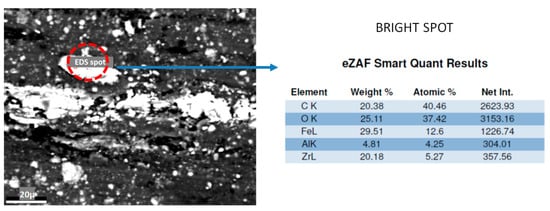
Figure 10.
EDS scan of back-scattered emission image of the pin after P1200 sliding test.
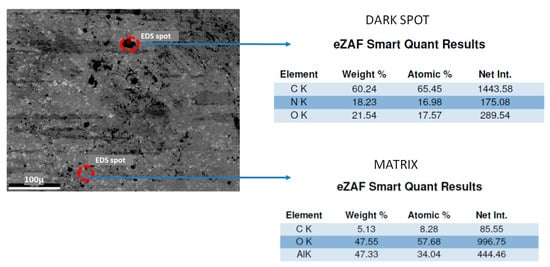
Figure 11.
EDS scan of back-scattered emission image of the pin in after P1200 sliding test.
It was seen that this tribo-layer formed on the pin surface was unique to the P1200 topography. An energy dispersive spectrometry of these bright spots confirmed iron oxide to be present in significant proportions.
Three-dimensional surface image of pins from the sliding experiment on P320-finished surfaces, including the “P320-smooth” surfaces is shown in Figure 12. The pin surface was scanned on the 3D optical profilometer before and after completing the sliding on the different topographies discussed above.
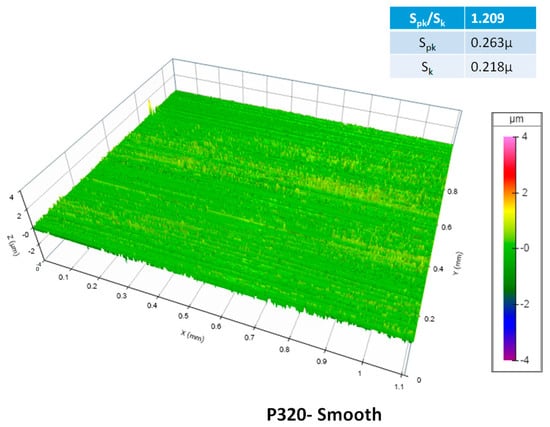
Figure 12.
Three-dimensional profile of the pin after 1800-cycle sliding test on “P320-smooth” flat. The topography looked smooth and the surface parameter ratio Spk/Sk of this surface was greater than 1.
The pin surface appears smooth after the test; this is a drastic change from the start of the test, where the pin running-in surface was replete with heavy sliding wear marks.
Figure 13a shows a similar surface micrograph as already seen in Figure 11; a huge transformation in the surface topography of the pin is seen after the sliding test. The deep sliding wear marks present at the start of the test have completely disappeared to give a smooth topography.
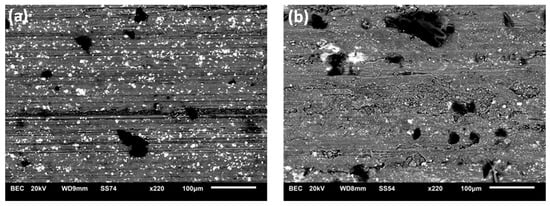
Figure 13.
(a). Back-scattered emission image of the pin after 1800-cycle sliding test on “P320-smooth” flat (at 220×). (b). Back-scattered emission image of the ping after sliding on P320, the rougher surface; an absence of the iron oxide transfer layer is noted.
As observed with P1200, the pin surface shows a bright uniformly spread transfer layer.
With P320-finished surfaces, it was observed that the aluminum pin surface was worn during the sliding. The 3D micrograph of the pin after sliding on a P320-finished surface is shown in Figure 14. There was no improvement in the surface topography of the pin surface, as was noted with the P320-smooth surface.
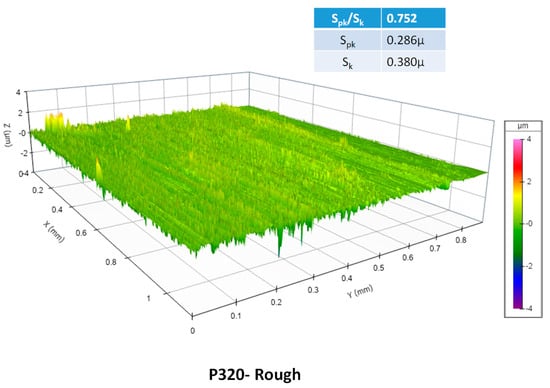
Figure 14.
Three-dimensional profile of the pin after sliding on P320 surface. Unlike “P320-smooth” or “P1200” pin samples, the pin topography here shows deep sliding wear marks and evidence of heavy wear. The topography looked rough with deep ploughing marks and the surface parameter ratio Spk/Sk of this surface was less than 1.
From the back-scattered image shown in Figure 13b, there were no sharp and bright contrasts as observed earlier with P1200 and P320-smooth specimens. The micrograph had a uniform dark matrix which resembled that of the aluminum surface of the pin.
Regression:
A polynomial regression analysis was performed on the COF response using the Spk/Sk value as a continuous variable for the data set listed in Table 1. The plot of the variable and response parameter and the regression line is shown in Figure 15. The authors performed transformations on the parameters in the x and y axis to obtain a meaningful analysis. The x axis was transformed to the square of the variable, and for the y axis the logarithm of the response was taken; this operation reduced the randomness of the residuals and ensured a normal distribution.
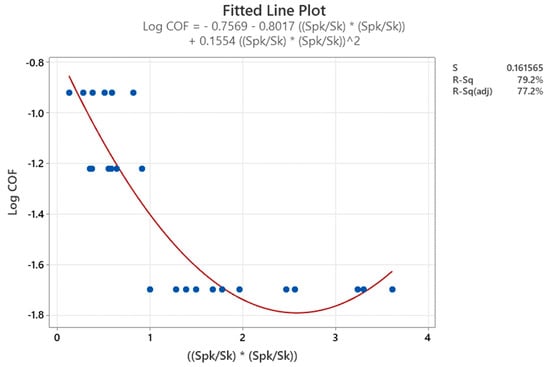
Figure 15.
Plot of (Spk/Sk)2 v/s Log (COF) and the regression line. The blue dots represent the transformed responses, and the red plot is the regression line.
A coefficient of determination R2 of 79% was obtained. This is shown in Table 2. Minitab® 20.2 software was used for this analysis. In these results, the function of Spk/Sk of the topography explains approximately 79% of the variation in the average COF obtained in the sliding tests. The R2 value indicates that the model fits the data well. The regression coefficients in the model are statistically significant as the p value is <0.05.
Table 2.
Polynomial regression analysis of variables having “Spk/Sk” against COF response.
The regression results indicate that the ratio parameter Spk/Sk is significant. In Figure 16, the residuals from the regression equation are plotted in a normal probability distribution, and the scatter shows them to be normally distributed. The order of observations shows randomness with respect to the residuals, and hence the model is a good fit.
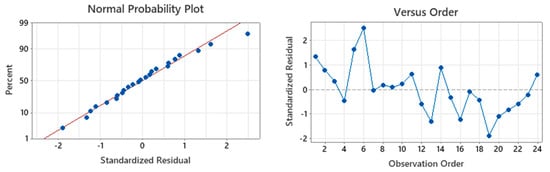
Figure 16.
Plot of the residuals from the regression and residuals based on the order of observations. The scatter points are in blue dots and the best fit straight line is in red. Residuals follow the normal probability distribution well and are randomly distributed among the multiple observations.
5. Discussion
In Figure 5, the authors observed the wear tracks after completion of 1800 cycles under the back-scattered emission field of a scanning electron microscope. What emerged from the wear track images was a correlation between the frictional force plots and intensity of the wear tracks. The wear tracks having characteristic dark wear lines suggested that the aluminum from the pin had transferred onto the stainless steel surface; the frictional force plots showed the characteristic alternating “M” and “W” shapes adhering to the Stribeck behavior seen in Figure 3. On the contrary, where the wear track was light or almost invisible, the frictional force plots did not follow the shape of the idealized Stribeck curve. For the P1200-finished surface, the frictional force plots looked nearly flat when compared with other specimens. These observations suggest that a critical film thickness of the lubricant at the interface exists, above which the surface-to-surface contact tends to reduce. When the sliding velocities increase, the oil film thickness increases at the contact zone and the intensity of the wear tracks tones down and the coefficient of friction drops.
From the SEI image of the steel counterface in Figure 17, considerable wear on the steel counterface was observed, which was originally mirror-finished. Because aluminum is a softer metal compared to stainless steel, the wear of aluminum will be more, and hence the contrast on the EDS scan of a black transfer layer identified as aluminum was seen in Figure 6 on the steel counterface.
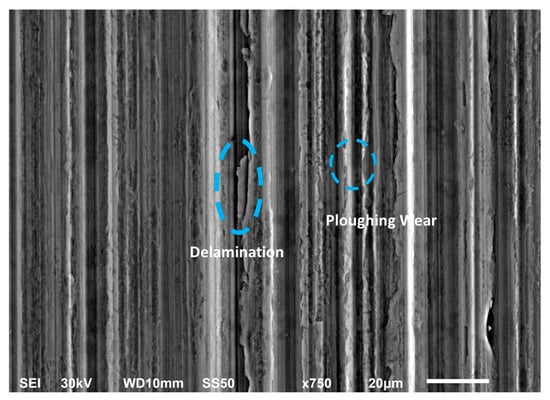
Figure 17.
Secondary emission image on the mirror-finished surface after the completion of sliding. Observe the delamination and ploughing wear as indicated in the image.
Westlund et al. [32] worked on a series of microscale sliding experiments involving a polished stainless steel flat and aluminum 6082 pin. The stainless steel flat was polished using diamond particles to a mirror finish. They found that the relationship between friction and transfer of materials between the sliding surfaces strongly depends on the initial roughness of the harder countersurface, material composition, presence of oxygen, and lubricants. They observed that on the hard steel flat, the smooth surface is compromised by transferred aluminum from the pin or due to third-body abrasion effects. They also concluded that using lubricants with tribofilm-forming additives reduces material transfer from the aluminum pin, which makes the sliding surface rough. They found that the aluminum pin was heavily loaded with oxidized layer including steel fragments. Similar observations of the transfer from hard steel to the softer aluminum were reported by Menezes et al. [33] and Bowden and Tabor [34], where they investigated the transfer of steel fragments to copper and the immediate subsurface plastic deformation of the steel surface.
The authors observed high friction in experiments with mirror-finished stainless steel, which is associated with the severe deformation seen in Figure 17; this caused wear of stainless steel, including observations of ploughing wear and delamination wear. The surface oxide layer eventually wears off in high friction, forming a thick hard layer which could wear off the steel. Westlund et al. [32] found that the soft pin surfaces are modified with these steel particles; these are capable of being a part of a strongly modified tip that can scratch the hard steel surface, which was precisely seen in these experiments.
Krupka et al. [35,36] mentioned in their work that surface texturing, for a mixed film regime, provided an increase in the average film thickness and the local film thickness across the topographic features forming the texture. In such a tribo-system, when all other variables like oil viscosity, reciprocating speed, and contact pressure were kept constant, the topography modification at the contact zone and a tribo-transfer layer formation on the interacting surfaces seemed responsible for the tribo-system reaching a steady state, and in some favorable instances this mechanism brought the frictional forces to a minimum. For P320-finished surfaces, the total of the adhesive and abrasive component of friction [37], representing the net frictional force, was lower during deceleration than acceleration. This indicated that the steel topography was aiding in fluid retention and viscous flow of the lubricant, and consequently a leading trail of the lubricant film was maintained ahead of the pin which, while decelerating, reduced the sliding friction. This film was, however, absent when direction reversals occurred, explaining the higher friction seen while the pin is accelerating.
The wear track micrographs helped us conclude that mirror-finished surfaces had the maximum share of adhesion forces, and hence the highest adhesive delamination wear, irrespective of the sliding velocity. Here, the wear patterns observed in the SEM showed material delamination, with adhesive wear being the most prominent wear mechanism. As we move to a coarse surface like P320, the share of abrasive forces on the net friction force was higher. The abrasive forces reduced with the number of cycles. This was also evidenced by the stratified presence of aluminum over the surface of the stainless steel flat, as observed in the back-scattered image of the wear surface in Figure 5c.
As defined in ISO 25,178 Part II [38], the surface parameter ratio Spk/Sk is defined as the ratio of the reduced peak height to the core roughness depth. The magnitude of this ratio was found to be synonymous with the sliding friction observed in the experiments. The authors introduced this areal surface parameter ratio after scanning and compiling the observations and findings for the different stainless steel specimens prepared. The regression analysis could relate the frictional performance with the surface topography and demonstrate the relevance. As seen in Table 1, this ratio could predict the observations of near-zero frictional force plots for P1200-finished and “P320-smooth” surfaces.
Luiz Albero Franco et al. [39], in their study on 3D surface parameters, tried to find the actual meaning of Spk and its relation to the volume of the hill or peaks, Vmp. They stated that the parameter Spk, as defined in the ISO 25,178-2 standard [14] as the average height of the peaks protruding over the core surface, is inadequate in its definition. Rather, Spk is a height parameter that is closely related to “Vmp”, the volume occupied by the peaks on a surface. They derived that, for random surfaces, the average height of the hills that extends above the core region is one half of the reduced peak height “Spk”.
The aluminum pin surface was found to evolve as the test progressed and was influenced by the topography of the steel countersurface. Where friction was extremely low, the pin surface was modified and became more even and smooth; this is shown in Figure 7, Figure 8 and Figure 12, which had a Spk/Sk ratio greater than 1. The pin, when observed under a BSE scan, as seen in Figure 9a,b and Figure 13a, had a bright layer evenly spread on its surface. This layer was identified as iron oxide transferred from the stainless steel flat surface during sliding. This layer was found to form preferentially with the P1200-finished and “P320-smooth” surfaces only, and was absent on the mirror-, P320-, and “P320-rough”-finished surfaces. This indicated that this iron oxide tribo-layer had an impact on the shape of the frictional plots and was responsible for the extremely low values of friction observed. For surfaces where friction was higher, the pin surfaces remained rough, as seen in Figure 14, and the Spk/Sk ratio was less than 1.
For surfaces where Spk/Sk is greater than 1, the volume of the material occupied in the peaks is much more than for surfaces where Spk/Sk is less than 1. When the ratio of Spk/Sk is related to the texture amplitude normalized by the overall roughness magnitude, it gives an insight into the texture symmetry, which plays a distinct role in maximizing the Spk/Sk ratio. Das et al. [40] stated that when Spk/Sk is high, there is a greater amount of texture amplitude symmetry, indicating the presence of a greater volume of material occupied in symmetrical peaks than for other surfaces where Spk/Sk is low. The Spk/Sk ratio highlights the importance of peak structures in a topography. The volume occupied by the peaks in relation to the core roughness and the symmetry in the texture amplitude increased with increase in this surface parameter ratio. A Spk/Sk ratio greater than 1 represents a larger volume of symmetrically sized asperities supporting the load at the contact zone, enabling a uniform transfer layer of iron oxide to develop on the aluminum countersurface. These topographies, apart from reducing surface wear caused by surface adhesion, also allow the valley structures to hold the oil efficiently. Erdemir [41] inferred that the lubrication regimes in classical Stribeck diagrams could be modified by surface modifications. Controlling specific surface parameters resulted in modifying both the width and the height of the boundary lubrication regimes, and thus achieving lower friction and wear at sliding and rotating contact interfaces.
In industry, precision grinding techniques are being used as a method of surface finishing, which is often the penultimate step in the material removal cycle of a machining operation. Scenarios exist for such parts where the end application might have critical performance requirements involving sliding in wet or lubricated conditions. A good example is of the diesel injectors used in modern-day diesel engines, where lubricated sliding minimizing friction is a key performance requirement [42,43]. The authors believe that the approach highlighted in this study of evaluating the surfaces from critical areal surface parameters can prove to be an effective method of quality control for limiting the variabilities during the metal finishing operation. This can act as a boon to the energy balance by conserving useful energy and reducing friction.
6. Conclusions
Certain topographies achieved extremely low sliding friction in the lubricated regime. The critical three-dimensional areal surface parameter Spk/Sk with respect to the stainless steel surface could fairly predict whether the tribo-system can achieve a minimum sliding friction. The stainless steel flat ground using a P1200 coated abrasive showed the lowest average coefficient of friction, of the order of 0.02. This surface had an average root mean square roughness value of 0.15 microns and a Spk/Sk value above 1.
It was found that stainless steel topographies where Spk/Sk value was above 1 had a beneficial transfer layer of iron oxide gradually depositing on the softer counterface. This might lower the sliding friction to such low levels. Surfaces having an Spk/Sk value below 1 experienced higher friction. The Spk/Sk ratio highlights the importance of peak structures in a topography. These features on the surface helped reduce the sliding friction and consequent wear found on a stainless steel countersurface. The topography of the stainless steel surface had an influence on the evolution of the aluminum pin topography during sliding. For topographies having an Spk/Sk value below 1, the transfer layer was not found on the pin surface.
The beneficial changes noted on the pin surface were responsible for the extraordinary reduction in the sliding friction for the tribo-system. The authors expect this study to be relevant to the metal finishing industry, especially where applications focus on lubricated sliding. Where friction reduction is a design criterion, controlling critical surface parameters can be important in improving manufacturing and system reliability, enhancing system response and reducing energy consumption.
Author Contributions
Conceptualization, G.P., V.J. and S.V.K.; methodology, G.P.; formal analysis, G.P., V.J. and S.V.K.; investigation, G.P.; resources, V.J. and S.V.K.; data curation, G.P.; writing—original draft preparation, G.P.; writing—review and editing, V.J. and S.V.K. All authors have read and agreed to the published version of the manuscript.
Funding
This research received no external funding.
Data Availability Statement
All relevant data are presented in the paper.
Conflicts of Interest
The authors declare no conflict of interest.
Abbreviations
| Fx | Frictional force |
| COF | Coefficient of friction |
| P2000, P1200, P320 | PSA liner paper backed coated abrasives as per FEPA (P- Scale) based on mean grain size of abrasive mineral ds-50 particle size. |
| Hz | Unit of reciprocating frequency expressed as Hertz |
| MPa | S.I. Unit of pressure, abbreviated as Mega Pascals |
| Sa | Average areal surface roughness |
| Sda | Average dale area |
| Sdq | Root mean square gradient |
| Sdr | Surface area ratio |
| Sds | Density of summits |
| SE | Secondary emissions |
| SEM | Scanning electron microscope |
| SI | International system of units |
| SiC | Silicon carbide |
| Sk | Reduced core roughness |
| Sku | Surface kurtosis |
| SN150 | Mineral Base oil belonging to the Group 1 American Petroleum Institute classification, refined using Solvent Neutral processing methods having a target viscosity of 30 cSt at 40 deg C. |
| SN500 | Mineral Base oil belonging to the Group 1 American Petroleum Institute classification, refined using Solvent Neutral processing methods having a target viscosity of 100 cSt at 40 deg C. |
| SN60 | Mineral Base oil belonging to the Group 1 American Petroleum Institute classification, refined using Solvent Neutral processing methods having a viscosity of 12 cSt at 40 deg C. |
| Sp | Max peak height |
| Spk | Reduced summit height |
| Sq | Root mean square roughness |
| SS | Stainless steel |
| Ssc | Mean summit curvature |
| Ssk | Surface skewness |
| Std | Texture direction |
| Stdi | Texture direction index |
| Sti | Texture index |
| Sv | Max valley depth |
| Svi | Valley fluid retention index |
| Svk | Reduced valley height |
| 3D | Three dimensional |
References
- Molnar, V. Tribological Properties and 3D Topographic Parameters of Hard Turned and Ground Surfaces. Materials 2022, 15, 2505. [Google Scholar] [CrossRef] [PubMed]
- Ahmed, M.M.I.; Wei, L.; Abdel-Hamid, I.M.; Mohamed, A.E.O.; Fadl, A.E.; Ahmed, M.A.M.; Muhammad, F.E.; Ammar, E. Cooling and lubrication techniques in grinding: A state-of-the-art review, applications, and sustainability assessment. Chin. J. Aeronaut. 2023, 36, 76–113. [Google Scholar]
- An, B.; Wang, X.; Xu, Y.; Jackson, R.L. Deterministic elastic-plastic modelling of rough surface contact including spectral interpolation and comparison to theoretical models. Tribol. Int. 2019, 135, 246–258. [Google Scholar] [CrossRef]
- Öztürk, S.; Kahraman, M.F. Modeling and optimization of machining parameters during grinding of flat glass using response surface methodology and probabilistic uncertainty analysis based on Monte Carlo simulation. Measurement 2019, 145, 274–291. [Google Scholar] [CrossRef]
- Karkalos, N.E.; Karmiris-Obratanski, P.; Kurpiel, S.; Zagorski, K.; Markopoulos, A.P. Investigation on the surface quality obtained during trochoidal milling of 6082 aluminum alloy. Machines 2021, 9, 75. [Google Scholar] [CrossRef]
- El-Tayeb, N.S.M.; Low, K.O.; Brevern, P.V. On the surface and tribological characteristics of burnished cylindrical Al-6061. Tribol. Int. 2009, 42, 320–326. [Google Scholar] [CrossRef]
- Whittaker, R.K.; Hothi, H.S.; Eskelinen, A.; Blunn, G.W.; Skinner, J.A.; Hart, A.J. Variation in Taper Surface Roughness for a Single Design Effects the Wear Rate in Total Hip Arthroplasty. J. Orthop. Res. 2017, 35, 1784–1792. [Google Scholar] [CrossRef] [PubMed]
- Jeng, Y.R. Experimental Study of the Effects of Surface Roughness on Friction. Tribol. Trans. 1990, 33, 402–410. [Google Scholar] [CrossRef]
- Kligerman-Ryk, G.; Kligerman, Y.; Etsion, I. Experimental investigation of laser surface texturing for reciprocating automotive components. Tribol Trans. 2002, 45, 444–449. [Google Scholar]
- Kovalchenko, A.; Ajayi, O.; Erdemir, A.; Fenske, G.; Etsion, I. The effect of laser surface texturing on transitions in lubrication regimes during unidirectional sliding contact. Tribol. Int. 2005, 38, 219–225. [Google Scholar] [CrossRef]
- Ronen, A.; Etsion, I.; Kligerman, Y. Friction-reducing surface texturing in reciprocating automotive components. Tribol. Trans. 2001, 44, 359–366. [Google Scholar] [CrossRef]
- Marian, V.G.; Kilian, M.; Scholz, W. Theoretical experimental analysis of a partially textured thrust bearing with square dimples. Proc. Inst. Mech. Eng. Part J J. Eng. Tribol. 2007, 221, 771–778. [Google Scholar] [CrossRef]
- Parameswaran, G.; Jayaram, V.; Kailas, S.V. Frictional Characteristic Curves of Ground Surfaces in Lubricated Sliding. Lubricants 2023, 11, 354. [Google Scholar] [CrossRef]
- ISO 25178-2; 2012 Geometrical Product Specifications (GPS)—Surface Texture: Areal—Part 2: Terms, Definitions and Surface Texture Parameters. ISO: Geneva, Switzerland, 2012.
- Stout, K.; Blunt, L. Three-Dimensional Surface Topography, 2nd ed.; Penton Press: London, UK, 2000; ISBN 9781857180268. [Google Scholar]
- Dong, W.P.; Sullivan, P.J.; Stout, K.J. Comprehensive study of parameters for characterizing three-dimensional surface topography. Part III. Parameters for characterizing amplitude and some functional properties. Wear 1994, 178, 29–43. [Google Scholar] [CrossRef]
- Dong, W.P.; Sullivan, P.J.; Stout, K.J. Stout, Comprehensive study of parameters for characterizing three-dimensional surface topography I: Some inherent properties of parameter variation. Wear 1992, 159, 161–171. [Google Scholar] [CrossRef]
- Sedlaček, M.; Gregorčič, P.; Podgornik, B. Use of the Roughness Parameters Ssk and Sku to Control Friction—A Method for Designing Surface Texturing. Tribol. Trans. 2016, 60, 260–266. [Google Scholar] [CrossRef]
- de Groot, P. Principles of interference microscopy for the measurement of surface topography. Adv. Opt. Photon. 2015, 7, 1–65. [Google Scholar] [CrossRef]
- Dong, W.P.; Stout, K.J. An integrated approach to characterization of surface wear: Qualitative characterization. Wear 1995, 181–183, 700–716. [Google Scholar] [CrossRef]
- Grzesik, W.; Zak, K.; Kiszka, P. Comparison of Surface Textures Generated in Hard Turning and Grinding Operations. Procedia CIRP 2014, 13, 84–89. [Google Scholar] [CrossRef]
- Menezes, P.L.; Kailas, S.V. Effect of surface roughness parameters and surface texture on friction and transfer layer formation in tin-steel tribo-system. J. Mater. Process. Technol. 2008, 208, 372–382. [Google Scholar] [CrossRef]
- Menezes, P.L.; Kailas, S.V. Effect of surface topography on friction and transfer layer during sliding. Tribol. Online 2008, 3, 25–30. [Google Scholar] [CrossRef]
- Prajapati, D.K.; Tiwari, M. The correlation between friction coefficient and areal topography parameters for AISI 304 steel sliding against AISI 52100 steel. Friction 2021, 9, 41–60. [Google Scholar] [CrossRef]
- Sedlaček, M.; Podgornik, B.; Vižintin, J. Correlation between standard roughness parameters skewness and kurtosis and tribological behaviour of contact surfaces. Tribol. Int. 2012, 48, 102–112. [Google Scholar] [CrossRef]
- Kuriachen, B.; Joshy, J.; Joy, M.L. Influence of areal surface parameters on the tribological behavior of Ti6Al4V under lubricated condition. Tribol. Int. 2023, 179, 108147. [Google Scholar] [CrossRef]
- Pettersson, U.; Jacobson, S. Textured surfaces in sliding boundary lubricated contacts—Mechanisms, possibilities and limitations. Tribol. -Mater. Surf. Interfaces 2007, 1, 181–189. [Google Scholar] [CrossRef]
- Pettersson, U.; Jacobson, S. Influence of surface texture on boundary lubricated sliding contacts. Tribol. Int. 2003, 36, 857–864. [Google Scholar] [CrossRef]
- Ibatan, T.; Uddin, M.S.; Chowdhury, M.A.K. Recent development on surface texturing in enhancing tribological performance of bearing sliders. Surf. Coat. Technol. 2015, 272, 102–120. [Google Scholar] [CrossRef]
- Sudeep, U.; Tandon, N.; Pandey, R.K. Tribological Studies of Lubricated Laser-Textured Point Contacts in Rolling/Sliding Reciprocating Motion with Investigations of Wettability and Nano hardness. Tribol. Trans. 2015, 58, 625–634. [Google Scholar] [CrossRef]
- Zhou, N.; Peng, R.L.; Pettersson, R. Surface integrity of 2304 duplex stainless steel after different grinding operations. J. Mater. Process. Technol. 2016, 229, 294–304. [Google Scholar] [CrossRef]
- Westlund, V.; Heinrichs, J.; Jacobson, S. On the Role of Material Transfer in Friction Between Metals: Initial Phenomena and Effects of Roughness and Boundary Lubrication in Sliding Between Aluminium and Tool Steels. Tribol. Lett. 2018, 66, 97. [Google Scholar] [CrossRef]
- Menezes, P.L.; Kishore; Kailas, S.V.; Lovell, M.R. Tribological response of soft materials sliding against hard surface textures at various numbers of cycles. Lubr. Sci. 2013, 25, 79–99. [Google Scholar] [CrossRef]
- Bowden, F.P.; Tabor, D. The Friction and Lubrication of Solids. Part 1; Clarendon Press: Oxford, UK, 1954. [Google Scholar]
- Křupka, I.; Vrbka, M.; Hartl, M. Effect of surface texturing on mixed lubricated non-conformal contacts. Tribol. Int. 2008, 41, 1063–1073. [Google Scholar] [CrossRef]
- Křupka, I.; Hartl, M. The effect of surface texturing on thin EHD lubrication films. Tribol. Int. 2007, 40, 1100–1110. [Google Scholar] [CrossRef]
- Hutchings, I.; Shipway, P. Friction. In Tribology: Friction and Wear of Engineering Materials, 2nd ed.; Section 3.4.2; Elsevier: Amsterdam, The Netherlands, 2017; pp. 41–45. [Google Scholar]
- Whitehouse, D.J. Handbook of Surface and Nanometrology, 2nd ed.; CRC Press: Boca Raton, FL, USA; Taylor and Francis Group: Abingdon, UK, 2011. [Google Scholar]
- ISO 25178-2; Franco, L.A.; Sinatora, A. 3D Surface Parameters Actual Meaning of Spk and Its Relationship to Vmp. Precision Engineering: Monmouth, UK, 2015; pp. 106–111.
- Das, J.; Linke, B. Evaluation and systematic selection of significant multi-scale surface roughness parameters (SRPs) as process monitoring index. J. Mater. Process. Technol. 2017, 244, 157–165. [Google Scholar] [CrossRef]
- Erdemir, A. Review of engineered tribological interfaces for improved boundary lubrication. Trib. Int. 2005, 38, 249–256. [Google Scholar] [CrossRef]
- Oğuz, H.; Düzcükoğlu, H.; Ekinci, Ş. The Investigation of Lubrication Properties Performance of Euro-Diesel and Biodiesel. Tribol. Trans. 2011, 54, 449–456. [Google Scholar] [CrossRef]
- Xiao, H.; Liu, S. Tribological properties of biodiesel: A review of recent advances. In Energy Sources, Part A: Recovery, Utilization, and Environmental Effects; Taylor and Francis Group: Abingdon, UK, 2020; pp. 1–20. [Google Scholar]
Disclaimer/Publisher’s Note: The statements, opinions and data contained in all publications are solely those of the individual author(s) and contributor(s) and not of MDPI and/or the editor(s). MDPI and/or the editor(s) disclaim responsibility for any injury to people or property resulting from any ideas, methods, instructions or products referred to in the content. |
© 2024 by the authors. Licensee MDPI, Basel, Switzerland. This article is an open access article distributed under the terms and conditions of the Creative Commons Attribution (CC BY) license (https://creativecommons.org/licenses/by/4.0/).