Article

Study on Temperature Field Distribution of a High-Speed Double-Helical Gear Pair with Oil Injection Lubrication

School of Mechanical and Electrical Engineering, Central South University, Changsha 410083, China
*
Author to whom correspondence should be addressed.
Lubricants 2024, 12(9), 315; https://doi.org/10.3390/lubricants12090315
Submission received: 18 July 2024 / Revised: 3 September 2024 / Accepted: 6 September 2024 / Published: 9 September 2024

Abstract

:
The temperature field distribution of high-speed double-helical gears under oil injection lubrication is investigated by obtaining heat flux density and convective heat transfer coefficients through theoretical calculations and CFD (computational fluid dynamics) simulations. Based on the CFD method, fluid simulations are performed to obtain the distribution of lubricating oil on the surface of the double-helical gears, the velocity streamline diagram of the lubricating oil, and the convective heat transfer coefficients of different surfaces of the gears. The friction heat flux density is calculated using Hertzian contact theory and theoretical formula of heat generation. The double-helical gears’ steady-state temperature field simulation uses this heat flux density as a boundary condition. The correctness of the calculation method is verified through experiments. The study shows that increasing the jet velocity allows the jet to reach the tooth surface more effectively, improving the cooling effect and reducing the maximum gear temperature. However, the relationship between the jet velocity and the minimum gear temperature is non-linear. Within a certain range, increasing the jet diameter makes the jet wider, and the area covered by the lubricating oil becomes larger as the jet spreads around the gear teeth, enhancing the cooling effect. An increase in gear speed leads to an increase in frictional heat flux density; moreover, the high-velocity airflow generated by the increased speed reduces the amount of lubricant entering the mesh zone, which in turn causes the maximum temperature of the gears to continue to rise.

1. Introduction

Compared with other types of gears, double-helical gears have advantages such as a high overlap ratio, strong load-carrying capacity, and stable transmission, making them the primary transmission components of transmission systems in aerospace and other fields [1,2]. Among the commonly used lubrication methods, oil injection lubrication is mostly used for high-speed gear operation, while splash lubrication is suitable for occasions with lower transmission loads. Double-helical gears are frequently employed in high-speed, high-load situations when the gears’ friction produces a large amount of heat and causes the gears’ surface temperature to rise sharply. Oil injection lubrication is more appropriate for lubricating double-helical gears because it can precisely inject lubricating oil into the gear meshing area, providing the required lubrication and removing heat produced by friction through the circulation of the oil. However, the relationship between heat generation and heat dissipation of the lubricating oil becomes complicated under high-speed, heavy-load conditions, and the effect of oil jet lubrication is influenced not only by jet parameters but also by the operating conditions of the gears. Therefore, it is of great significance to investigate the temperature field of double-helical gears under oil jet lubrication to improve their working performance and service life.
The research on the oil jet lubrication of gears mainly involves experimental methods and CFD simulation methods. For the experimental method, Andersson et al. [3] used an FZG gear test rig to compare the temperatures and gearbox efficiencies under different lubrication methods by varying the maximum contact pressure on the tooth surface. They compared jet lubrication on the engagement side, jet lubrication on the disengagement side, and immersion lubrication, and found that the gearboxes were more efficient during jet lubrication, whereas the tooth temperature was lower with immersion lubrication. To explore oil jet lubrication technology in gear transmission systems, H. Schober [4] used a high-speed camera to capture images, observing and analyzing the details and effects of the lubrication process. Massini et al. [5] conducted jet lubrication experiments on a new type of rotating test rig to visualize the effect of jet impact on gears at high speeds. Emre Ayan et al. [6] experimentally studied the cooling capability of oil jet lubrication in the cooling system of a high-speed, high-power gear turbofan engine gearbox. Despite these efforts, observing phenomena like jet impact, splashing, and oil film spreading during lubrication is challenging. The short timescale and complex three-dimensional spatial scale of oil jet splashing phenomena require high-precision measurement equipment, making it difficult to complete in the confined space of a gearbox. Moreover, the costs associated with such experiments are substantial.
Due to technological advances, the emergence of simulation software has drastically improved research efficiency, leading scholars to use CFD simulation methods for studying oil jet lubrication. The commonly used CFD methods include the volume of fluid (VOF) method, the smoothed particle hydrodynamics (SPH) method, and the lattice Boltzmann method (LBM). During the process of gear oil jet lubrication, there is intense interaction between the oil jet and the air due to the agitation caused by the rotating gears. This requires tracking the free surface of the two-phase flow of oil and air, for which the VOF method can effectively simulate the situation. Yazdani et al. [7] conducted VOF simulations on the meshing conditions of a pair of rotating spur gears, laying the foundation for their thermal behavior study. Turner et al. [8] simulated the flow field of a gearbox through VOF method, using the simulation results of the single-phase flow as the starting point for two-phase flow simulation to study the characteristics of oil flow. Jiang et al. [9] utilized the VOF to simulate the splash lubrication of a hypoid bevel gear reduction box, analyzing the influencing factors of lubricating oil flow at key positions. The SPH and LBM methods are mesh-free simulation methods with Lagrangian properties. Keller [10] et al. verified the computational time superiority of the SPH method in the oil gear interaction. However, the current SPH method cannot use turbulence models, which limits its application. Ambrose [11] simulated the oil jet lubrication of a single spur gear using the LBM software XFlow and compared it with existing SPH results, finding good consistency in the jet diffusion and penetration phenomena after the lubricating oil reaches the tooth surface. But the two-phase LBM method was found to be more time-efficient than the two-phase SPH method. Ji et al. [12] proposed an SPH numerical simulation of oil flow in gearboxes, and the difference in velocity field between simulation and experiment was discussed. Subsequently, Menon et al. [13] proposed a GPU-accelerated SPH method for multiphase flow simulation in gearboxes. Scholars are also keen to study the impact of air flow fields formed by high-speed rotating gears on the oil jet. Akin et al. [14] established an analytical model for spur gear oil jet lubrication, suggesting that the high-speed rotating airflow around the gears can atomize the jet, hindering the lubricating oil from reaching the tooth grooves. The theoretical analysis compared well with experimental results. Townsend et al. [15] conducted theoretical and experimental studies on oil jet lubrication on the disengagement side of gear pairs, and concluded that the airflow will have an effect on the injection depth of the lubrication jet. Chen et al. [16] found that high-speed gear oil injection on the disengagement side is easily dispersed by airflow, with better results on the engagement side. Increasing the jet speed can reduce the high-speed airflow on the lubricant jet direction of motion, reducing the degree of jet offset. CFD simulations can effectively capture the oil film distribution on gear tooth surfaces in the meshing area. Many scholars take the oil film distribution on the tooth surface in the meshing zone as one of the indicators of gear jet lubrication. Zhou et al. [17] established an oil film stiffness model to study the lubrication of modified spur gears. Wang [18] investigated the oil film deposition and spreading under different meshing angles by establishing a dual-nozzle jet lubrication model for a pair of helical gears. The simulation results showed that the two nozzles could simultaneously lubricate the tooth surface only at specific angles, with greater oil film thickness on surfaces closer to the nozzle. Zhang et al. [19] developed a high-line-speed gear oil jet lubrication simulation model under negative pressure, analyzing the collision evolution process of oil with the tooth surface at different times under negative pressure conditions, obtaining the spreading mechanism of oil on high-speed gear surfaces. The structure and arrangement of nozzles and other parameters have a great influence on the gear lubrication effect. Xia et al. [20] developed a CFD-based fluid calculation model for high-line-speed spur gear oil jet lubrication, determining the optimal nozzle angle through flow field streamline diagrams. Dai et al. [21] evaluated parameters such as temperature of meshing spur gears, helical gears, and orthogonal spur gears, deriving and predicting reasonable ranges for nozzle geometric parameters and determining the optimal configuration for each specific model’s oil jet lubrication. Wang et al. [22] established an oil jet lubrication model for high-speed herringbone gears, placing nozzles on both the engagement and disengagement sides to study the effects of different oil jet angles, particularly the end jet angle, on oil splash. They found that nozzle deflection toward the driven gear on the engagement side reduces oil splash, while the end jet angle on the disengagement side has little impact on oil splash.
During the meshing process of gears, heat is mainly generated by the sliding friction of the gear teeth and dissipated through convective heat transfer with the lubricating oil and air. When this process reaches equilibrium, the temperature field of the gear can be obtained. Scholars worldwide have long been dedicated to the study of gear temperature fields. The heat generation in gears primarily results from power loss due to gear meshing. Fatourehchi et al. [23] were the first to combine tribological models with thermal flow coupling analysis methods, using CFD to predict the heat generated in a gear pair under oil jet lubrication within an air–oil mist environment in a gearbox. Mo et al. [24] utilized computational fluid dynamics technology to analyze the power loss due to wind resistance of helical cylindrical gears. Their simulation results provided velocity vector diagrams of the fluid domain around the gears, indicating that setting baffles around the gears can effectively reduce wind resistance power loss. Wei et al. [25] studied the impact of operating and design parameters on the power loss and overall efficiency of a wheel-side reducer, offering insights for optimizing reducer efficiency. Velex [26] proposed displacement-based friction power loss formulas for spur and helical gears, which can be used to study the effect of tooth profile modification on friction power loss. In the study of gear temperature fields, Blok [27] first proposed the concept of flash temperature to represent the instantaneous temperature rise at the contact points during gear meshing, deriving an approximate formula for calculating flash temperature. Tobe [28], building on Blok’s theory, proposed a more accurate calculation method, which improved the accuracy of the initial point selection in the grid and verified its feasibility through spur gear temperature experiments. Cheng [29] incorporated thermal effects into elastohydrodynamic lubrication, leading more scholars to explore the relationship between gear temperature fields and characteristics such as contact pressure distribution, oil film shape and thickness, and friction. Gan et al. [30] utilized the finite element approach to examine the heat transfer process and created a numerical model to forecast thermal behavior under mixed lubrication circumstances. The temperature field was then effectively solved by Li et al. [31] by creating formulas for determining the friction heat flux density and convective heat transfer coefficients for various gear surfaces. In order to determine the tooth surface temperature field, Qiao et al. [32] performed finite element analysis and calculated the heat flow produced during gear friction. Li et al. [33] developed a calculation approach for the transient temperature field of gears under starved lubrication conditions and examined the impact of power and rotational speed on the transient temperature field. This method was based on the concepts of heat transmission and tribology. Chen [34] proposed a sequentially coupled gear temperature simulation analysis method, considering multiphase convective heat transfer (solid–liquid-gas) and different heat dissipation coefficients of gear surfaces, simulating the body temperature and flash temperature of aviation gears under different operating conditions. Wu et al. [35] introduced an approach for calculating the friction coefficient under mixed lubrication considering surface roughness and studied the temperature field of spur gears. Yazdani et al. [7] used a new mesh division to predict the heat flow state over time and obtained the flow and temperature field distributions in the system under stabilization. Mironova et al. [36] used experimental methods to study the variation law of temperature field of gears in ideal meshing state. Roda-Casanova [37] introduced a new method for determining the temperature field during the operation of polymer cylindrical gears based on the finite element method. A numerically loaded tooth contact analysis of the gearing was carried out to determine the heat generated by friction and thermally analyzed in the form of thermal loads.
Previous studies in the field of gear oil jet lubrication and the processes of solving gear temperature fields have achieved significant accomplishments, providing research ideas and calculation methods for this work. However, most of these studies have focused on spur and helical gears, with double-helical gears receiving less attention. Additionally, the temperature field distribution of double-helical gears lubricated with oil jet has not been extensively studied. These two aspects are the focus of this paper.
This paper is arranged as follows: Section 2 presents the CFD method used for flow field lubrication simulation in this study, as well as the Hertz theory and empirical formulas used to calculate heat generation; Section 3 conducts experiments to confirm the viability of the numerical model; Section 4 presents the geometric model used in this study; and Section 5 examines the temperature field and lubrication conditions of the double-helical gear under various rotational speeds and jet parameters.

2. Numerical Calculation Methods

2.1. CFD Theoretical

2.1.1. Basic Control Equations

Using computational mathematics, the necessary flow control equations for fluid dynamics can be solved numerically in a discrete manner through the CFD approach. The conservation of mass, momentum, and energy are the three fundamental principles of fluid movement. These principles allow for the derivation of the continuity equation, momentum equation (also known as the Navier–Stokes equations), and energy equation, respectively, which serve as the control equations for the flow field [38].
According to the law of conservation of mass, the net mass flow out of a differential volume must equal the mass decrease within that volume. Defining the reduction in mass as negative, this can be expressed as:
ρ t + ρ u t + ρ v t + ρ w t = 0
where ρ is the density, t is time, u , v , w are the velocity toward the x , y , and z directions, ρ V is commonly denoted as ρ u t + ρ v t + ρ w t , and V is the velocity vector field.
From Newton’s second law, the product of the mass of the fluid microparticle and its acceleration is the force on the moving fluid microparticle, where the forces include volumetric and surface forces, and the mass of the fluid microparticle is kept constant. The momentum equation is as follows:
ρ u t + ρ u V = p x + τ x x x + τ y x y τ z x z + ρ f x = 0 ρ u t + ρ v V = p y + τ x y x + τ y y y τ z y z + ρ f y = 0 ρ u t + ρ w V = p z + τ x z x + τ y z y τ z z z + ρ f z = 0
where p is the pressure, τ i j is the stress in the j direction acting on the plane perpendicular to the i axis, and f is the body force per unit mass acting on the fluid element.
According to the law of conservation of energy, the rate of change of energy within a fluid microcluster is the sum of the net heat flux into the microcluster and the power of the work exerted by the force applied to the microcluster. The energy conservation equation can be expressed as follows:
t ρ e + V 2 2 + ρ e + V 2 2 V = p q ˙ + x k T x + y k T y + z k T z u p x v p y w p z + u τ x x x + u τ y x y + u τ z x z + v τ x y x + v τ y y y + u τ z y z + w τ x z x + w τ y z y + w τ z z z + ρ f V
where e is the internal energy per unit mass, q ˙ is the volumetric heat generation per unit mass, T is the temperature, and k is the thermal conductivity.

2.1.2. Multiphase Flow Model

Natural substances can exist in solid, liquid, or gas states. When a phenomenon involves multiple states of matter simultaneously, it is termed a multiphase flow problem. This paper investigates the jet lubrication process, which entails the breakup and merging of lubricant oil droplets and interactions between gas and liquid interfaces, resulting in an oil–gas two-phase flow phenomenon.
Fluent provides four multiphase flow models: the volume of fluid (VOF), the mixture, the Eulerian, and the wet steam. The first three models are commonly used. This paper selects the implicit calculation method of the VOF model [39] for simulation. The implicit algorithm is more stable than the explicit calculation method. The volume percentage of each phase in each control volume is calculated by the VOF multiphase flow model, which mimics flow processes. Lubricant oil and air are the two phases of the gear jet lubrication procedure. The total volume fractions of all phases of a control unit, which equals the total volume fractions of air and lubrication oil, at any given time, is always equal to 1. Therefore, the following equation can be derived:
α a i r + α o i l = 1
where α a i r and α o i l are the air and lubricating oil volume portions.

2.1.3. Turbulence Model

At high rotational speeds, the rotation of the gears and the impact of the jet formed when the lubricant reaches the tooth surface can lead to complex fluid dynamic phenomena. The gears, with high-speed rotation, cause the lubricant flow to exhibit turbulence characteristics, resulting in a high Reynolds number. This turbulence phenomenon has an important effect on the lubrication effect, which needs to be fully considered in the simulation process.
Turbulence models are commonly used in fluid simulation calculations, and Fluent also provides corresponding turbulence models. Considering the high-speed rotation of the gears and the impact of the jet when the lubricant reaches the tooth surface, and after a comprehensive evaluation of computational costs, the RNG k-ε turbulence model is selected for its effectiveness in simulation. This model is particularly suitable for capturing the complex fluid dynamics and their impact on lubrication. The RNG model [40] turbulent kinetic energy (k) equation and turbulent dissipation rate ( ε ) equation are shown below, respectively:
( ρ k ) t + ( ρ k u i ) x i = x j [ ( α k μ e f f ) k x j ] + G k + G b ρ ε Y M
( ρ ε ) t + ( ρ ε u i ) x i = x j [ ( α ε μ e f f ) ε x j ] + C 1 ε ε k [ ( G k + C 3 ε G b ) ] C 2 ε ρ ε 2 k R ε
where G k is the kinetic energy released during turbulence due to the mean velocity gradients, G b is the amount of kinetic energy generated by buoyancy effects in turbulence, Y M is the amount of variable dilatation in compressible turbulence that contributes to the total rate of dissipation, and α k and α ε are the inverse effective Prandtl numbers for turbulence kinetic energy and turbulence dissipation rate, respectively. C 1 ε , C 2 ε and C 3 ε are constants. μ i is the velocity component in each direction. The term μ e f f in the equation can be obtained from the following expression:
μ e f f = μ + μ t μ t = ρ C μ k 2 ε
where μ is the molecular dynamic viscosity, μ t is the turbulent eddy viscosity, C μ is a constant.

2.2. Heat Flux Density Calculation

2.2.1. Radius of Curvature at Meshing Position

Figure 1 is a schematic diagram of meshing gears in the end face, r b 1 , r b 2 are the base radius of the two gears, N1N2(s) is the meshing line, B1 and B2 are the endpoints of the meshing line, and C is the contact point of two teeth on the line B1B2.
The tooth profile’s curvature radius at the meshing position can be expressed as:
R t 1 = N 1 B 1 B 1 C
R t 2 = N 2 B 2 B 2 C
The conversion relationship between the radius of curvature on the end face R t 1 , R t 2 and the normal radius of curvature R 1 , R 2 is:
R 1 = R t 1 / cos β b
R 2 = R t 2 / cos β b
where β b is the helix angle of the gear base circle.
The equivalent radius of curvature at each meshing position is:
R = R 1 R 2 R 1 + R 2

2.2.2. Velocity at Meshing Position

The velocity U of the gear pair at the meshing point can be decomposed into the normal velocity U n and tangential velocity U t along the tooth surface. The calculation formulas for the tangential velocities of the driving and driven gears are:
U t 1 = 2 π n 1 R 1 cos β b / 60000 U t 2 = 2 π n 2 R 2 cos β b / 60000
The relative sliding velocity U s , entrainment velocity U R , and rolling–sliding ratio ξ at the meshing point are:
U s = U t 1 U t 2 U R = U t 1 + U t 2 2 ξ = U s U R

2.2.3. Contact Line Length

The face contact ratio ε α and axial contact ratio ε β are calculated separately according to the formulas, and the total contact ratio ε γ is the sum of the two:
ε α = B 1 B 2 P b ε β = B sin β π m n
where P b is the base pitch.
Based on the calculation, the face contact ratio ε α is less than the axial contact ratio ε β . The gear pair in this document is identified as a first type double-helical gear (where ε α < ε β ). The contact line length analysis proceeds with the following steps:
B e =                         s cot β                                                 s < B 1 B 2                   B 1 B 2 cot β                         B 1 B 2 s B t a n β B s B 1 B 2 cot β                     s > B t a n β
where B e represents the effective contact width constant, used to characterize the contact effectiveness.
The single tooth contact line length L for a double-helical gear is equal to double the length of the one-sided contact line, expressed as:
L = 2 B e cos β
The total of the contact line lengths for each meshing pair determines the overall contact line length L Z for a pair of gears at a specific moment:
L Z = i = 1 n L i s
where L i represents the contact line length corresponding to different s values, and n is the number of pairs of teeth simultaneously in contact, which here is 4.

2.2.4. Normal Load on Tooth Surface

For any meshing point K , a force analysis is conducted. Let r k denote the radius distance from point K to the gear axis, T k denote the torque applied, α n k , α t k , and β k represent the normal pressure angle, end face pressure angle, and helix angle at point K respectively. Thus, the normal force at any point on the meshing contact line is:
F b n = T k r k cos α n k cos β k

2.2.5. Average Contact Pressure on Tooth Surface

Based on Hertz’s elastic contact theory, the double-helical gear-tooth contact problem is simplified to the contact problem of two cylinders along their generatrices, resulting in elliptical distribution of contact stress with a contact width of 2 a . The formula for calculating the half-contact width a is:
a = 4 F b n π L 1 ν 1 2 E 1 + 1 ν 2 2 E 2 R 1 R 2 R 1 R 2
where v is the Poisson’s ratio, E is the modulus of elasticity, and L is the total contact line length.
The average contact stress on the gear tooth surface is:
P n = π 4 F b n π 1 ν 1 2 E 1 + 1 ν 2 2 E 2 L R 1 R 2 R 1 R 2

2.2.6. Tooth Surface Friction Coefficient

The friction coefficient on the tooth surface can be calculated using the following formulas [41]:
μ = e f S R , P h , ν 0 , S P h b 2 S R b 3 V e b 6 ν 0 b 7 R b 8
where f S R , P h , ν 0 , S = b 1 + b 4 S R P h log 10 ν 0 + b 5 e S R P h log 10 ν 0 + b 9 e S . And where S R is the rolling–sliding ratio, P h is the maximum Hertz contact stress in MPa, ν 0 is the dynamic viscosity of the lubricating oil in centipoise (cps), V e is the entrainment velocity in m/s, S is the root mean square surface roughness (0.2 μ m here), R is the equivalent radius of curvature in meters, and b i is a constant value (i = 1~9, as shown in Table 1).
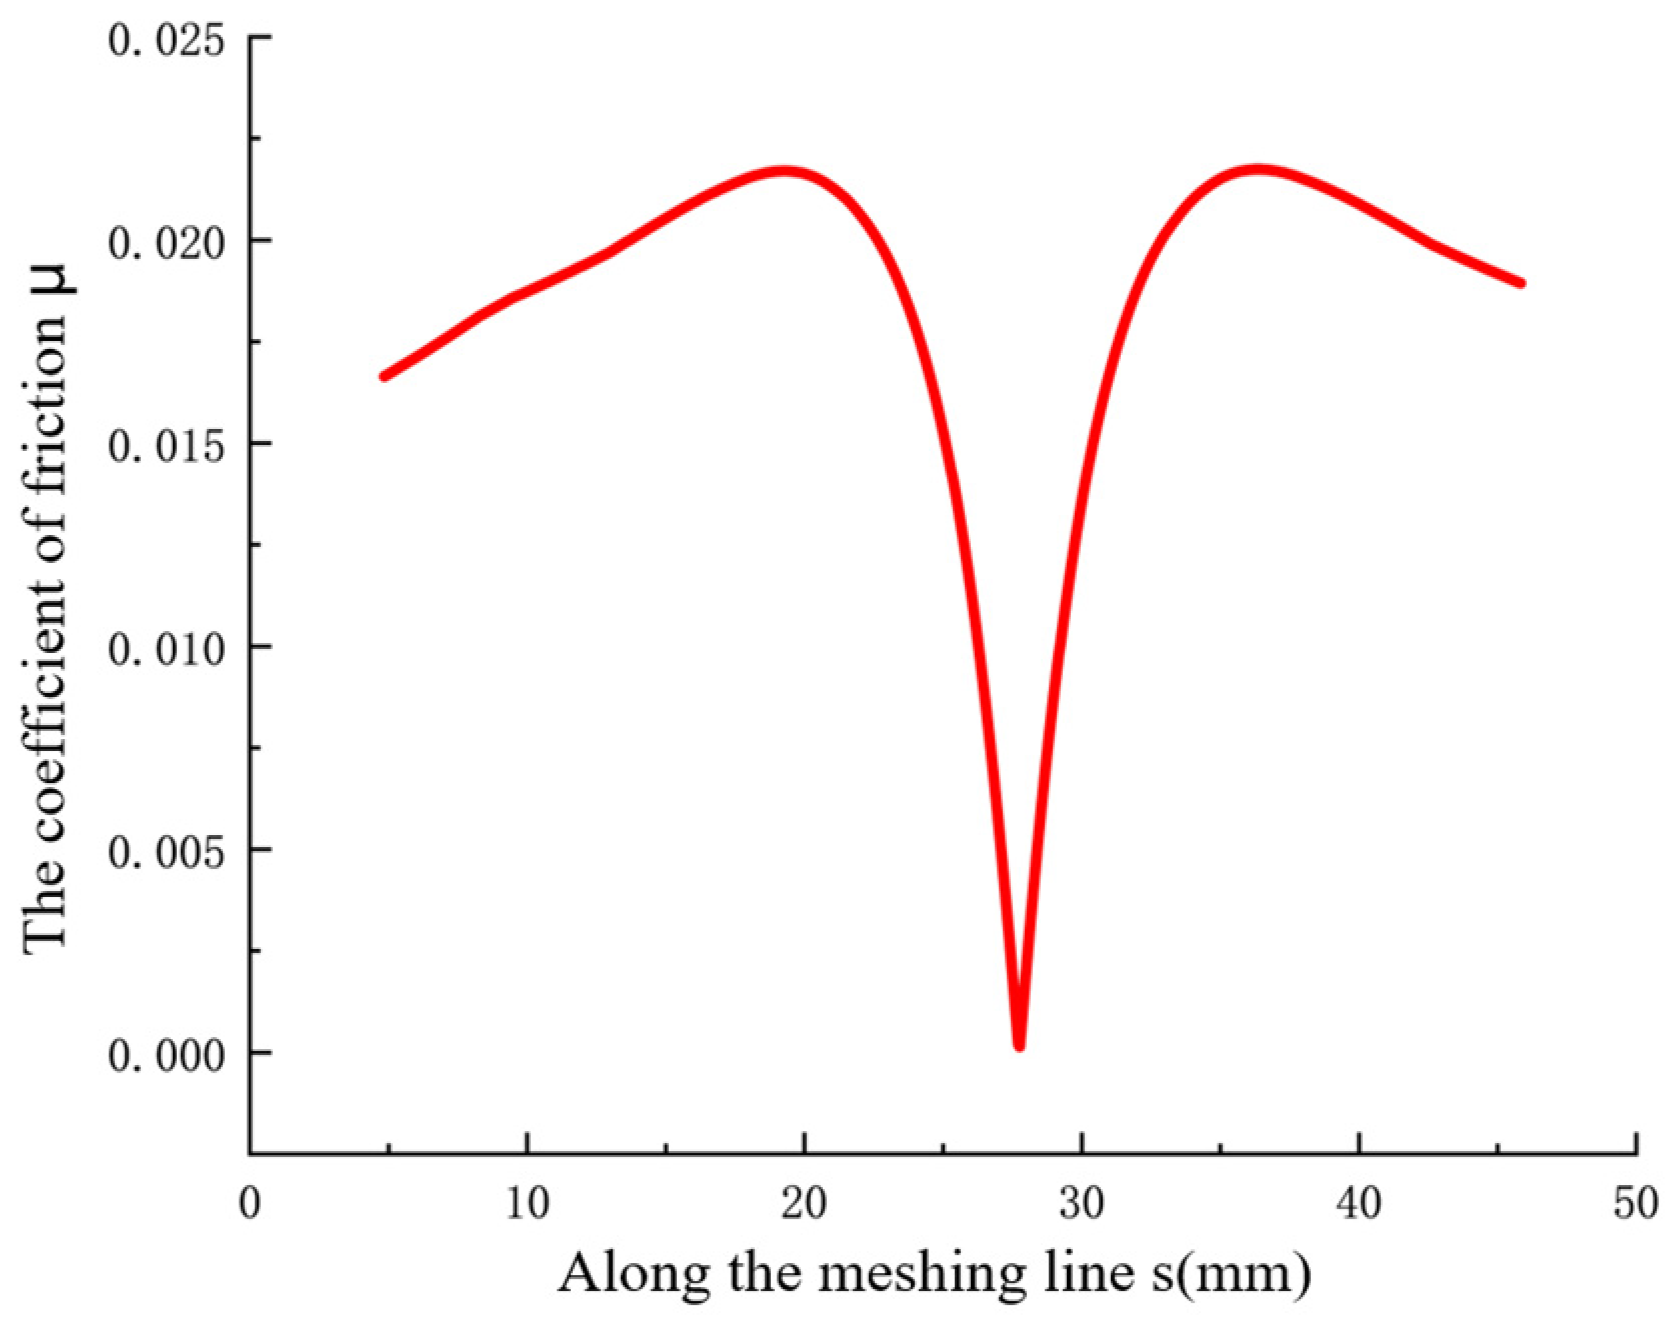
The calculated friction factor is shown in Figure 2, with a symmetrical trend.

2.2.7. Calculation of Average Frictional Heat Flux Density on Tooth Surface

Frictional heat only occurs during meshing in the gear’s rotation cycle. V. Simon proposed a more accurate method for calculating heat flux density [42,43], but it is relatively complex. Other scholars [44,45,46,47] have adopted a slightly less accurate but simpler method. As this paper aims to study the effects of various factors on lubrication performance and gear temperature fields without requiring high precision, we have adopted the latter method. At the meshing point of a double-helical gear, the total instantaneous frictional heat flux density can be represented as: Q = μ P n U S . To solve for the temperature field of the gear body, the average frictional heat flux density is required. This is obtained by averaging the heat generation at each meshing point over the time of one complete rotation (q1 for the driving gear, q2 for the driven gear):
q 1 = t 1 T 1 Q 1 q 2 = t 2 T 2 Q 2
where t 1 and t 2 are the times for the two gears to pass through the half-contact width: t 1 = 2 a U 1 t , t 2 = 2 a U 2 t .
Q 1 and Q 2 are the instantaneous frictional heat flux densities for the driving and driven gears, respectively. Their values are determined by the frictional heat distribution coefficient k . Q 1 , Q 2 , and k can be calculated using the following formulas:
Q 1 = k Q , Q 2 = 1 k Q k = λ 1 ρ 1 c 1 U t 1 λ 1 ρ 1 c 1 U t 1 + λ 2 ρ 2 c 2 U t 2
where λ is the thermal conductivity of the gear, ρ is the density of the gear, and c is the specific heat capacity of the gear.

3. Verification of Numerical Method

To validate the simulation model, a test bench was established to assess the jet lubrication temperature field of double-helical gears. Temperature measurements were conducted at various points on the gear under varying jet speeds and diameters. The test bench was designed with specific criteria:
  • Adjustable jet parameters;
  • Real-time temperature monitoring of the double-helical gear;
  • User-friendly operation, ensuring safety and reliability through digital control.
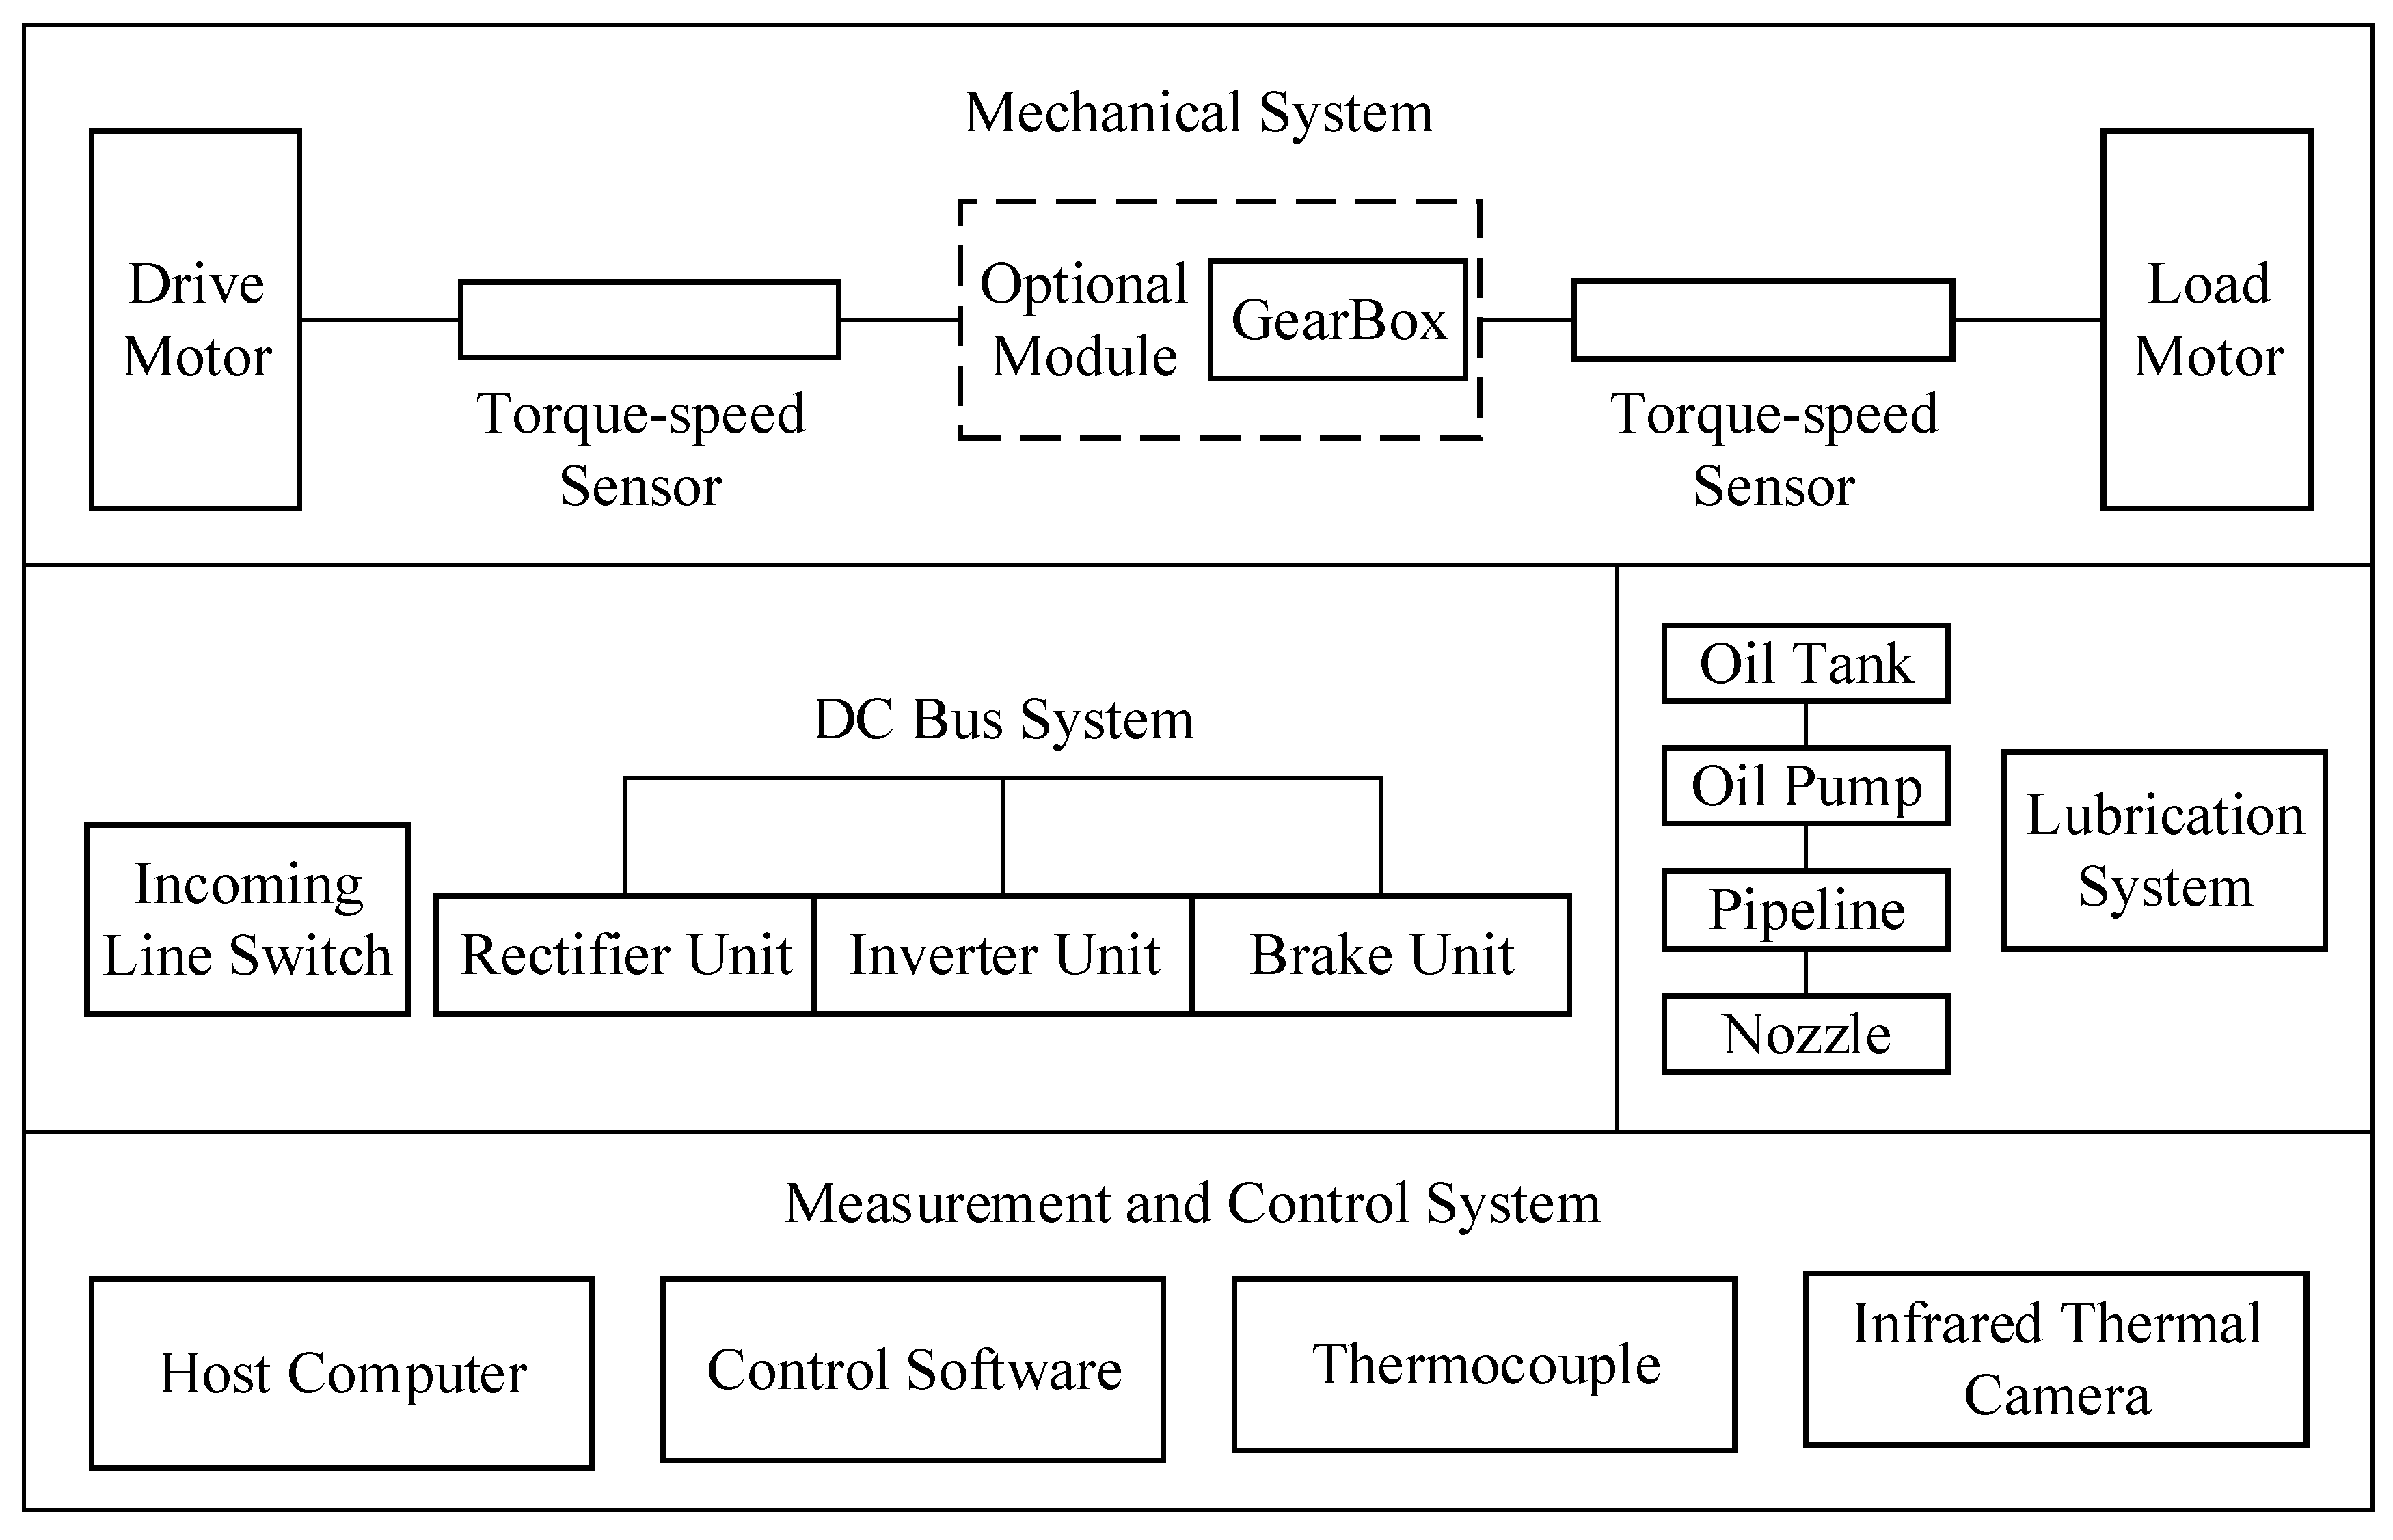
Based on these criteria, the test bench for double-helical gear jet lubrication temperature fields employs a closed electric power flow system. This system is straightforward and efficient in load handling, but entails higher production costs. Figure 3 illustrates the components of this double-helical gear test rig, comprising the mechanical, DC bus, measurement and control, and lubrication systems. The motor used in the mechanical system is a CHIHS brand M45B-12-1.5KW (Dongguan Haichuang Electromechanical Co., Dongguan, China), with a rated speed of 12,000 rpm and a rated power of 1.5 KW, which is controlled via a frequency converter to ensure precise control of the motor’s speed. A DYN-200 dynamic torque sensor (Bengbu Dayang Sensor System Engineering Co., Bengbu, China) is employed to monitor the motor’s output speed and torque, with a torque range of 0–10 Nm and a speed range of 0–10,000 rpm.
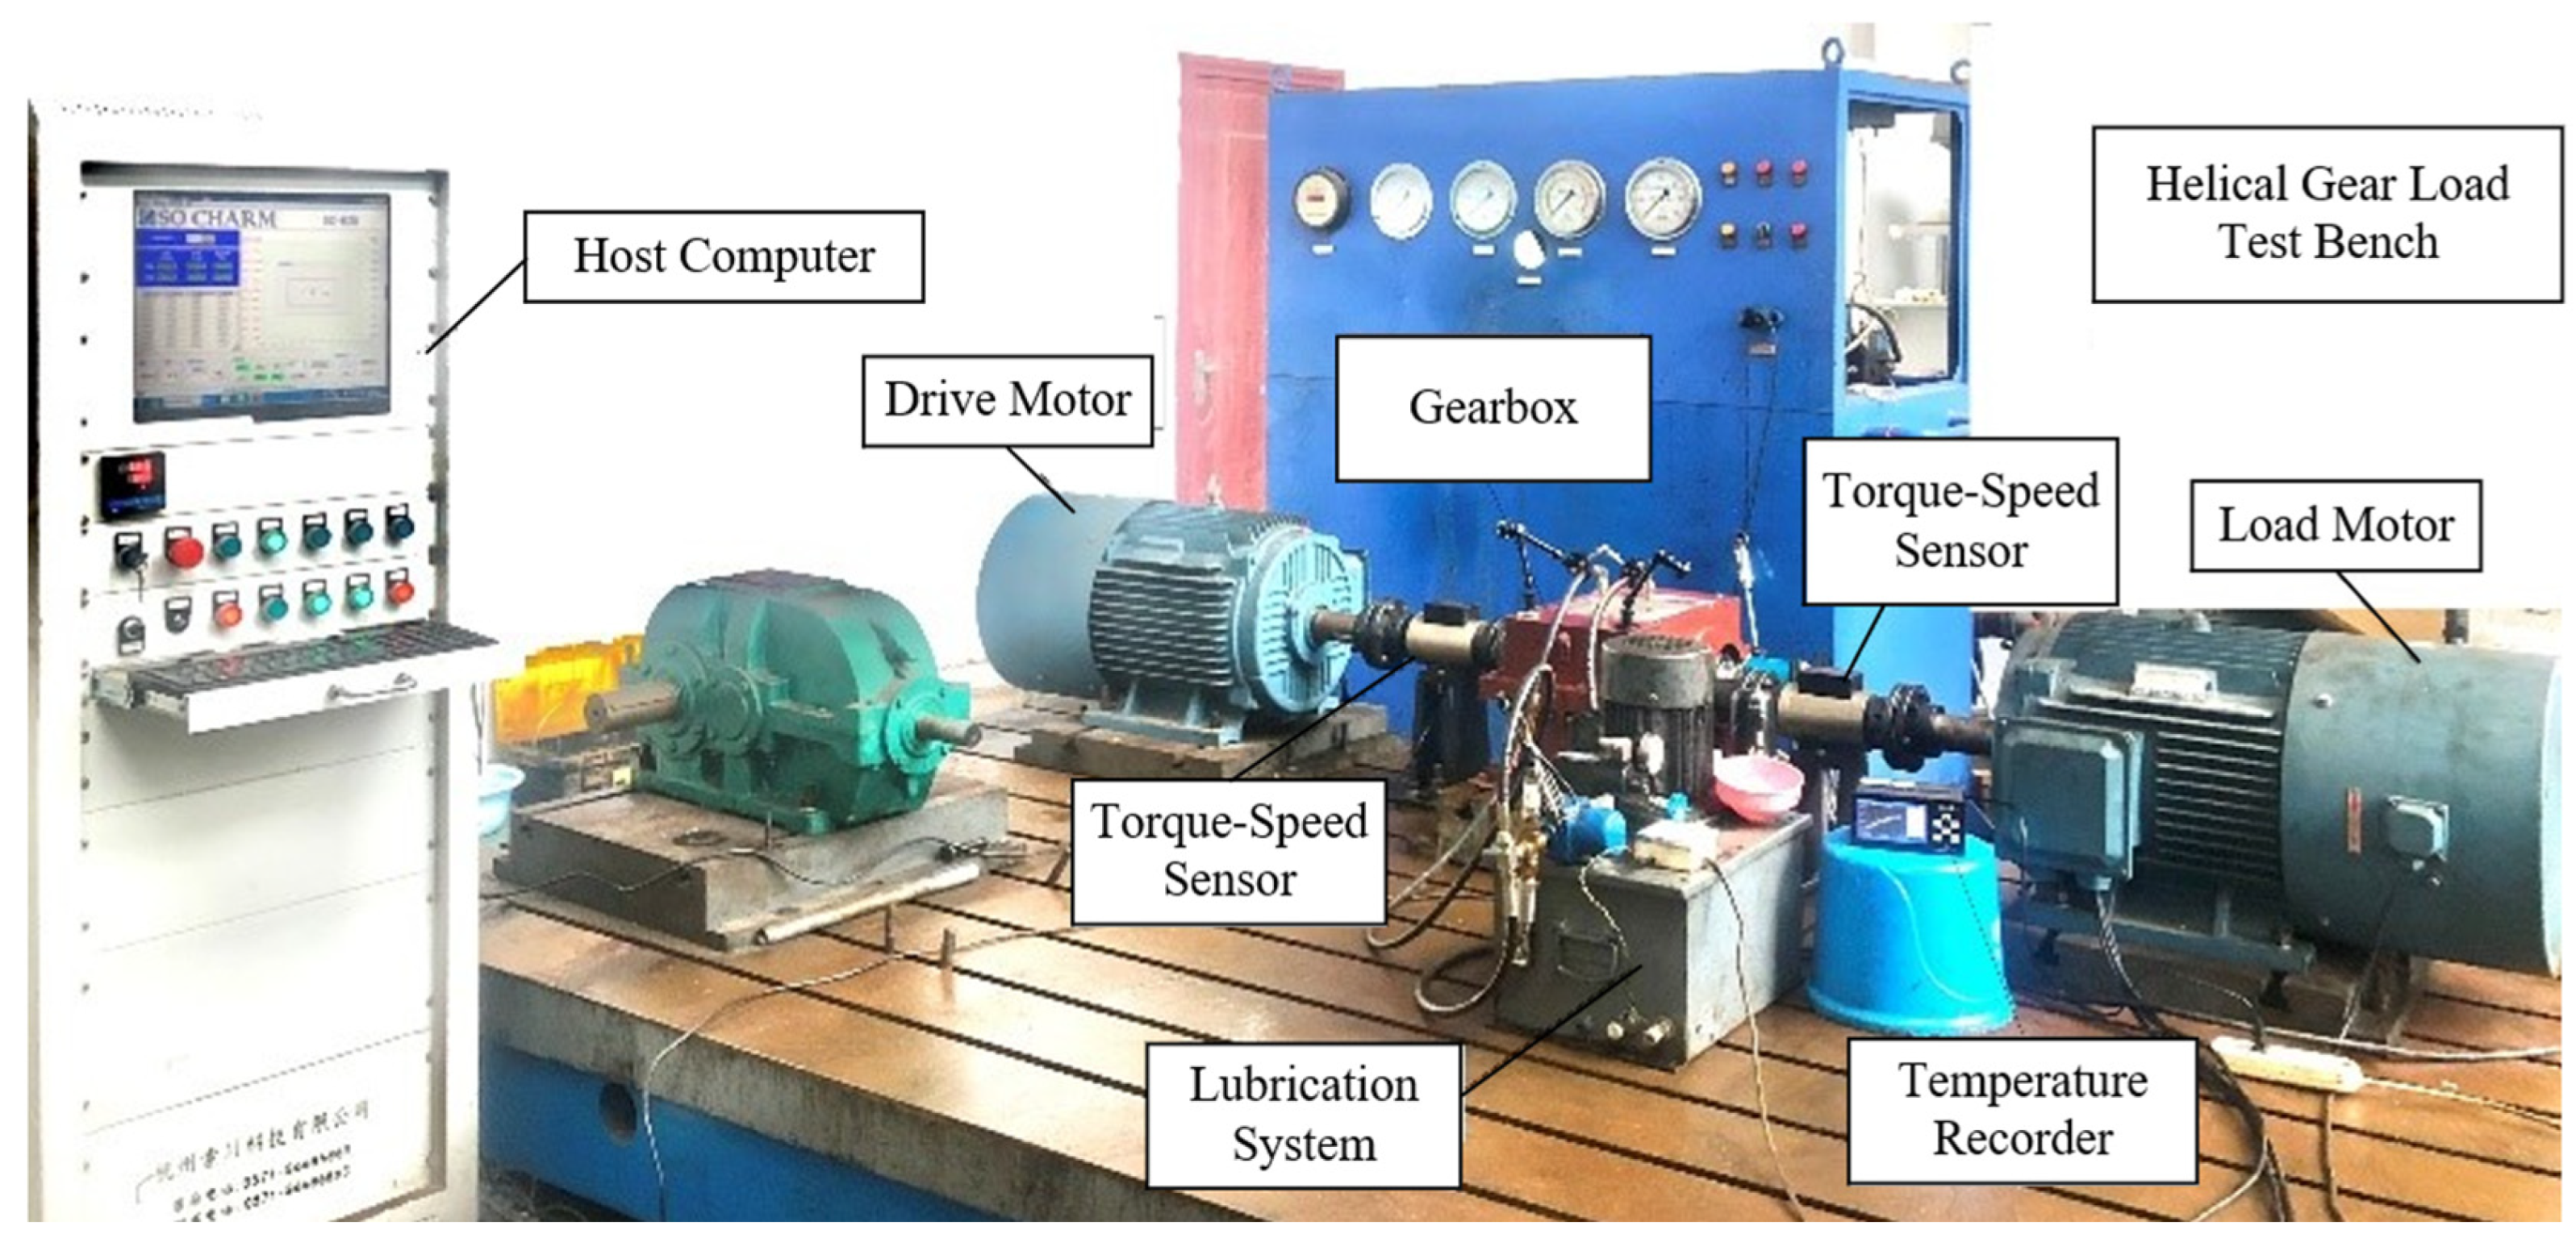
For the measurement and control system, we used a Wrnk-191K (Shanghai Songdao Heating Sensor Co., Shanghai, China) armored insulated thermocouple for temperature measurement inside the gear bore, known for its flexibility and strong electromagnetic interference resistance, with a sheath diameter of 2 mm. Temperature measurement on the gear end face was performed using a K-type ordinary patch thermocouple with a patch diameter of 5 mm. The thermocouple’s measuring end was fixed to the gear using high-temperature adhesive (D-3 glue), and the signal was transmitted through a slip ring to a paperless recorder that displayed the real-time temperature of the measured points. The assembled test bench is shown in Figure 4.
The parameters of the involute double-helical gearbox used in the experiment are shown in Table 2. The material parameters of the gears and the physical parameters of the lubricant are given in Table 3 and Table 4, respectively. The numbers of teeth for the driving and driven gears were 43 and 42, respectively. Thermocouples were arranged on the driving gear. Figure 5 shows the gearbox assembled.
The experiment employed dual-nozzle oil jet lubrication, where the nozzles were fixed in position via magnetic clamping seats, and there was a square hole at the top of the gearbox. Due to the splashing phenomenon caused by jet impact onto the high-speed rotating gears, a transparent baffle was placed over the square hole and fixed to the gearbox. This prevented lubricating oil from splashing out of the box, ensuring the cleanliness of the experimental environment and facilitating continuous observation and adjustment of experimental operation. The monitoring module was responsible for real-time data acquisition of the temperature field in the double-helical gear jet lubrication test rig, including operational and temperature parameters. The monitoring system comprised an upper computer, control software, thermocouples, various sensors, and observation equipment.
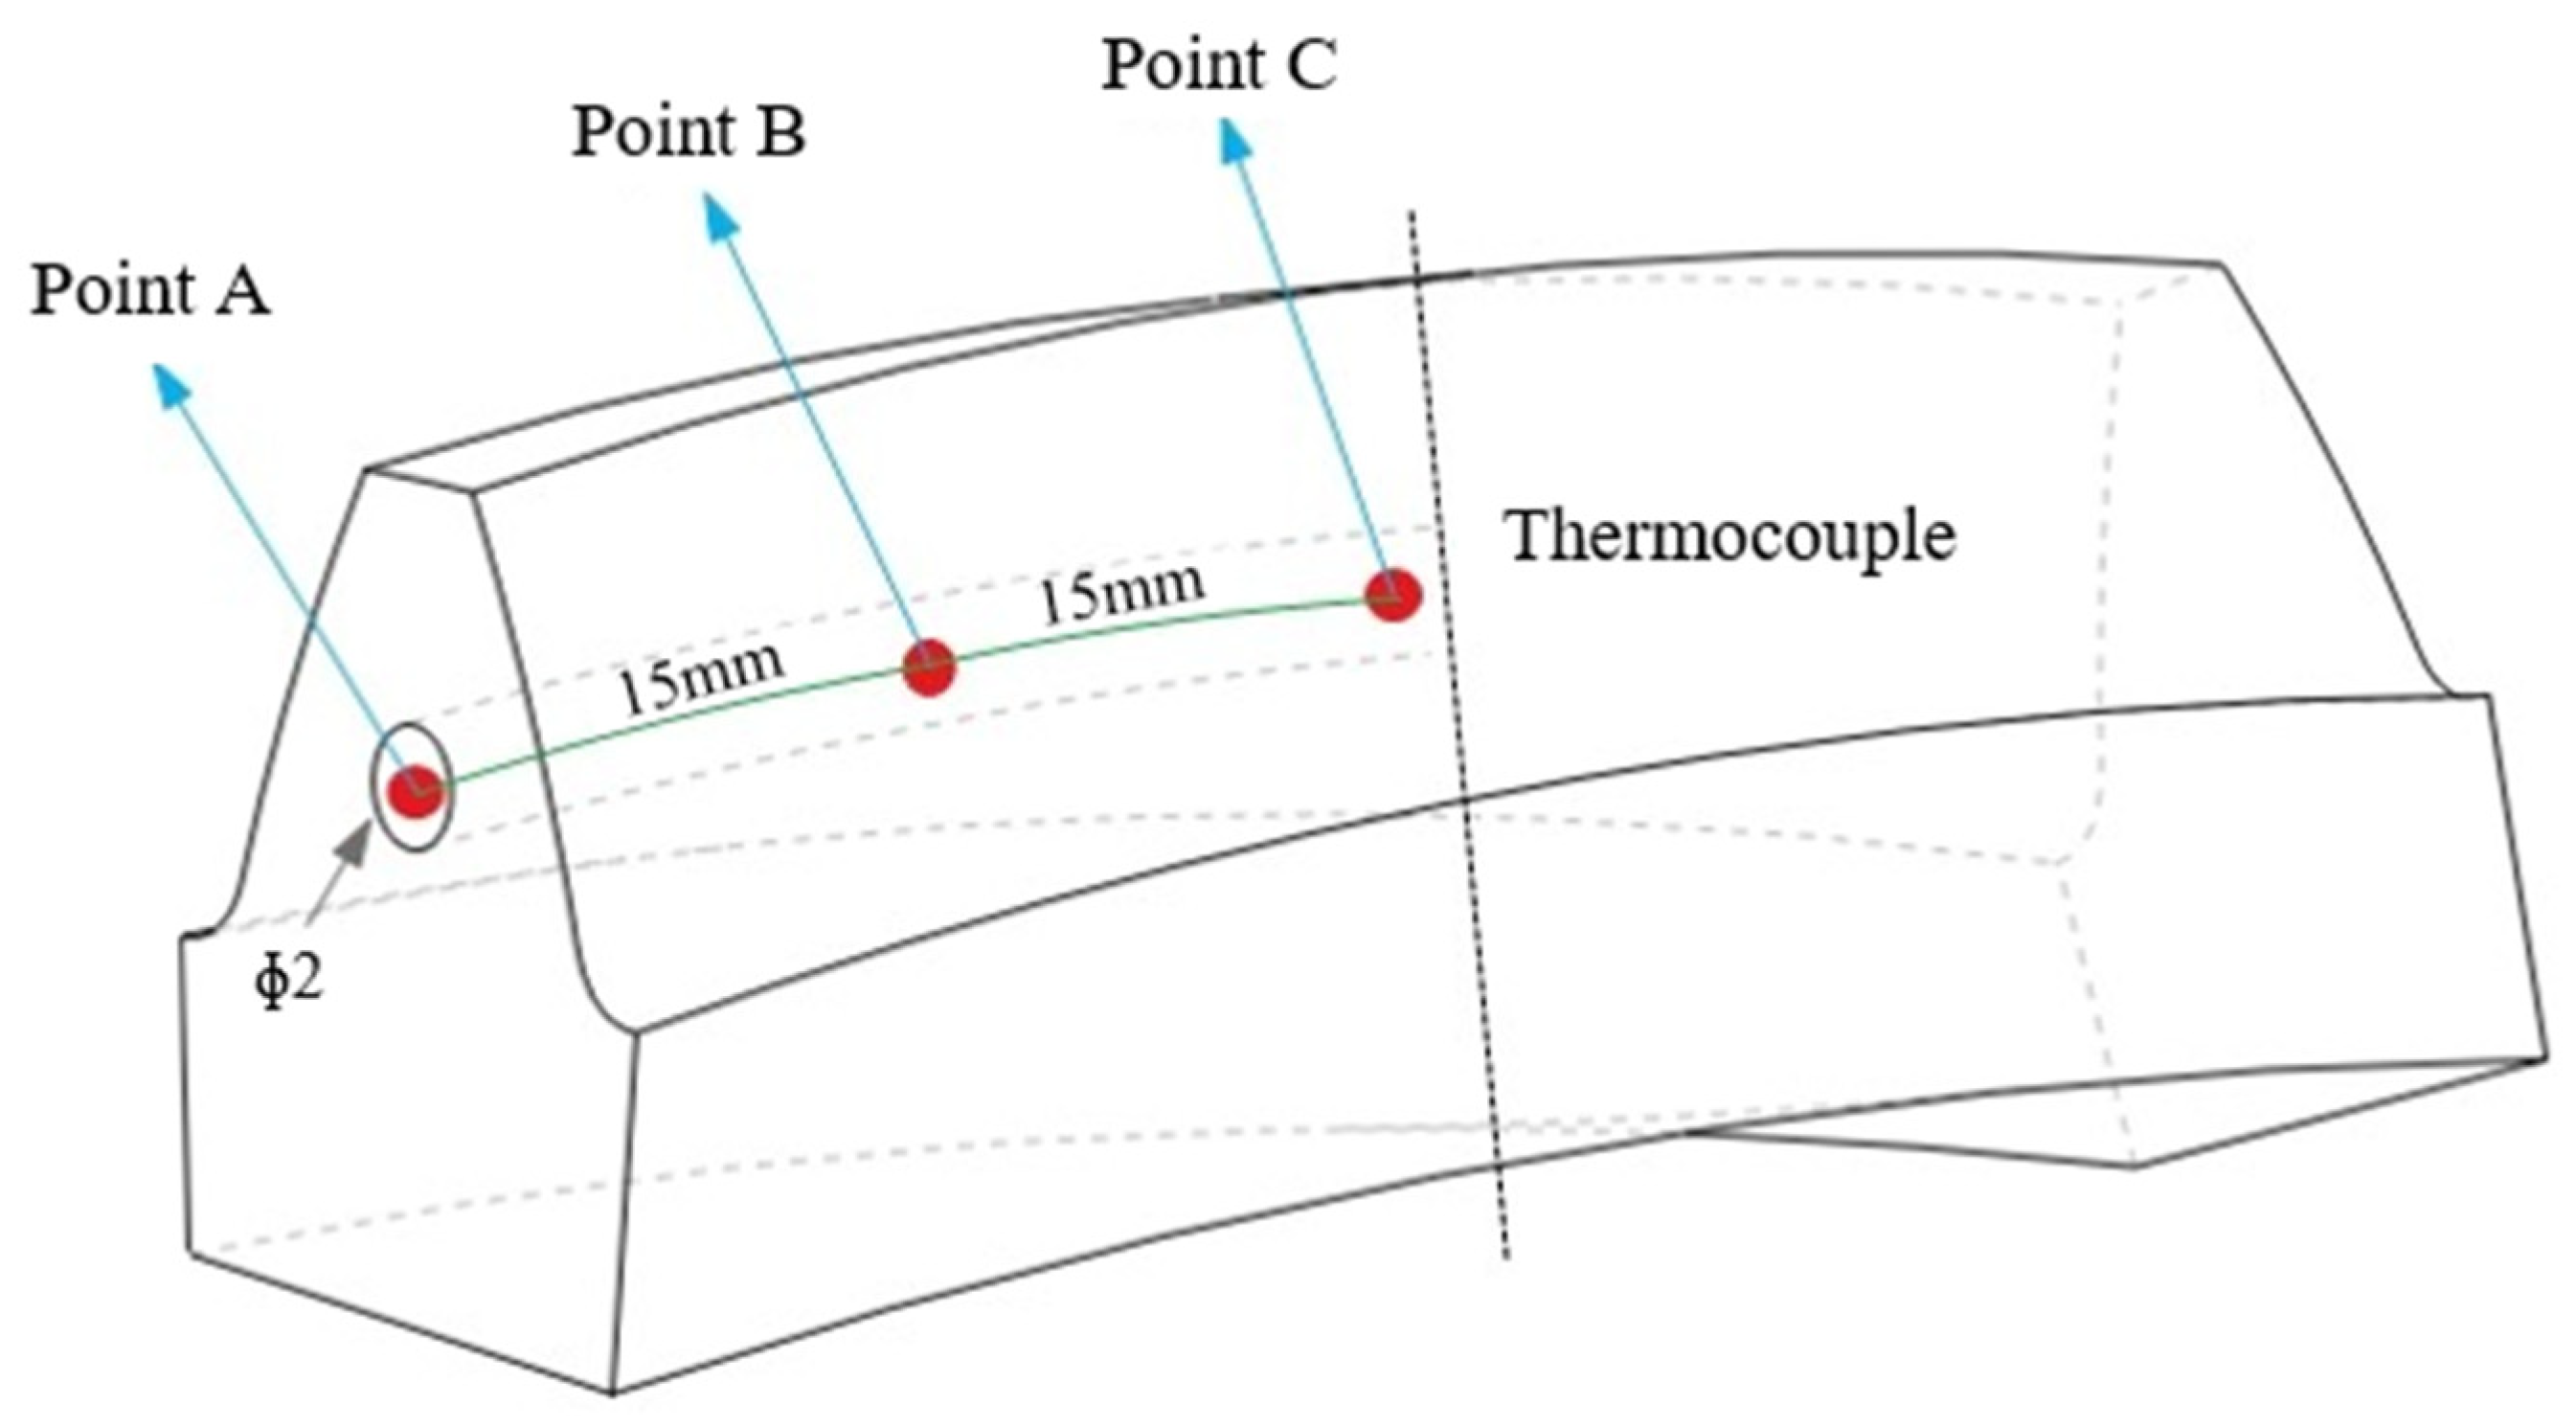
Temperature measurements were taken on the driving gear. Holes were drilled along the rotational direction of the outer end face of the driving gear, with a total of six holes evenly distributed in the rotational direction, each with a diameter of 2 mm. As shown in Figure 6, with the outer end face as the reference, thermocouples were fixed at 0 mm, 15 mm, and 30 mm, designated as point C, point B, and point A, respectively. Each position had two thermocouples. The gear width of the experimental gear was 60 mm, with point A located at the middle end face, directly below the jet path.
The experimental process was as follows: first, power was supplied, and the upper computer control software was started, establishing serial communication and setting parameters for the variable frequency motor. The driving motor and loading motor were then started. Once the gear reached the specified speed, the lubrication system was activated to begin the jetting experiment. During the experiment, the accumulation of oil in the gearbox was observed, a continuous oil supply was ensured, and the temperature rise was recorded and observed using the chart recorder and various sensor data until the gear reached steady-state temperature.
Considering the performance and safety of the equipment, the test conditions were set as follows: the driving gear’s rotational speed was 1200 r/min, the jet speed was 4 m/s, and the jet diameter was 1 mm. Under these conditions, the steady-state temperature measured by the thermocouple located at a hole depth of 30 mm was 32.65°, which represents the maximum temperature of the driving gear. The simulation results are displayed in Figure 7. The middle end face of the double-helical gear has the maximum temperature of 30.246°, whereas the center of the tooth body has the minimum temperature. The tooth surface surrounding the gear has a higher temperature than the tooth body. The test results are higher than the simulation values, which may be related to the reason that the wind resistance effect, etc., is not considered when loading heat.
Increasing the jet velocity to 9.5 and 15 m/s under the same experimental conditions showed that the real-time temperature curves of the thermocouples stabilized in a shorter time. As given in Figure 8, the simulation temperature values closely match the experimental temperature values at different jet velocities. Both simulation and experimental values decrease with increasing jet velocity: from 4 to 9.5 m/s, the maximum temperature decreases by approximately 2 °C, and from 9.5 m/s to 15 m/s, it decreases by approximately 3 °C. Increasing the jet velocity can effectively improve lubrication. The error values for the experiments at these three jet velocities are 7.36%, 6.95%, and 8.72%, respectively.
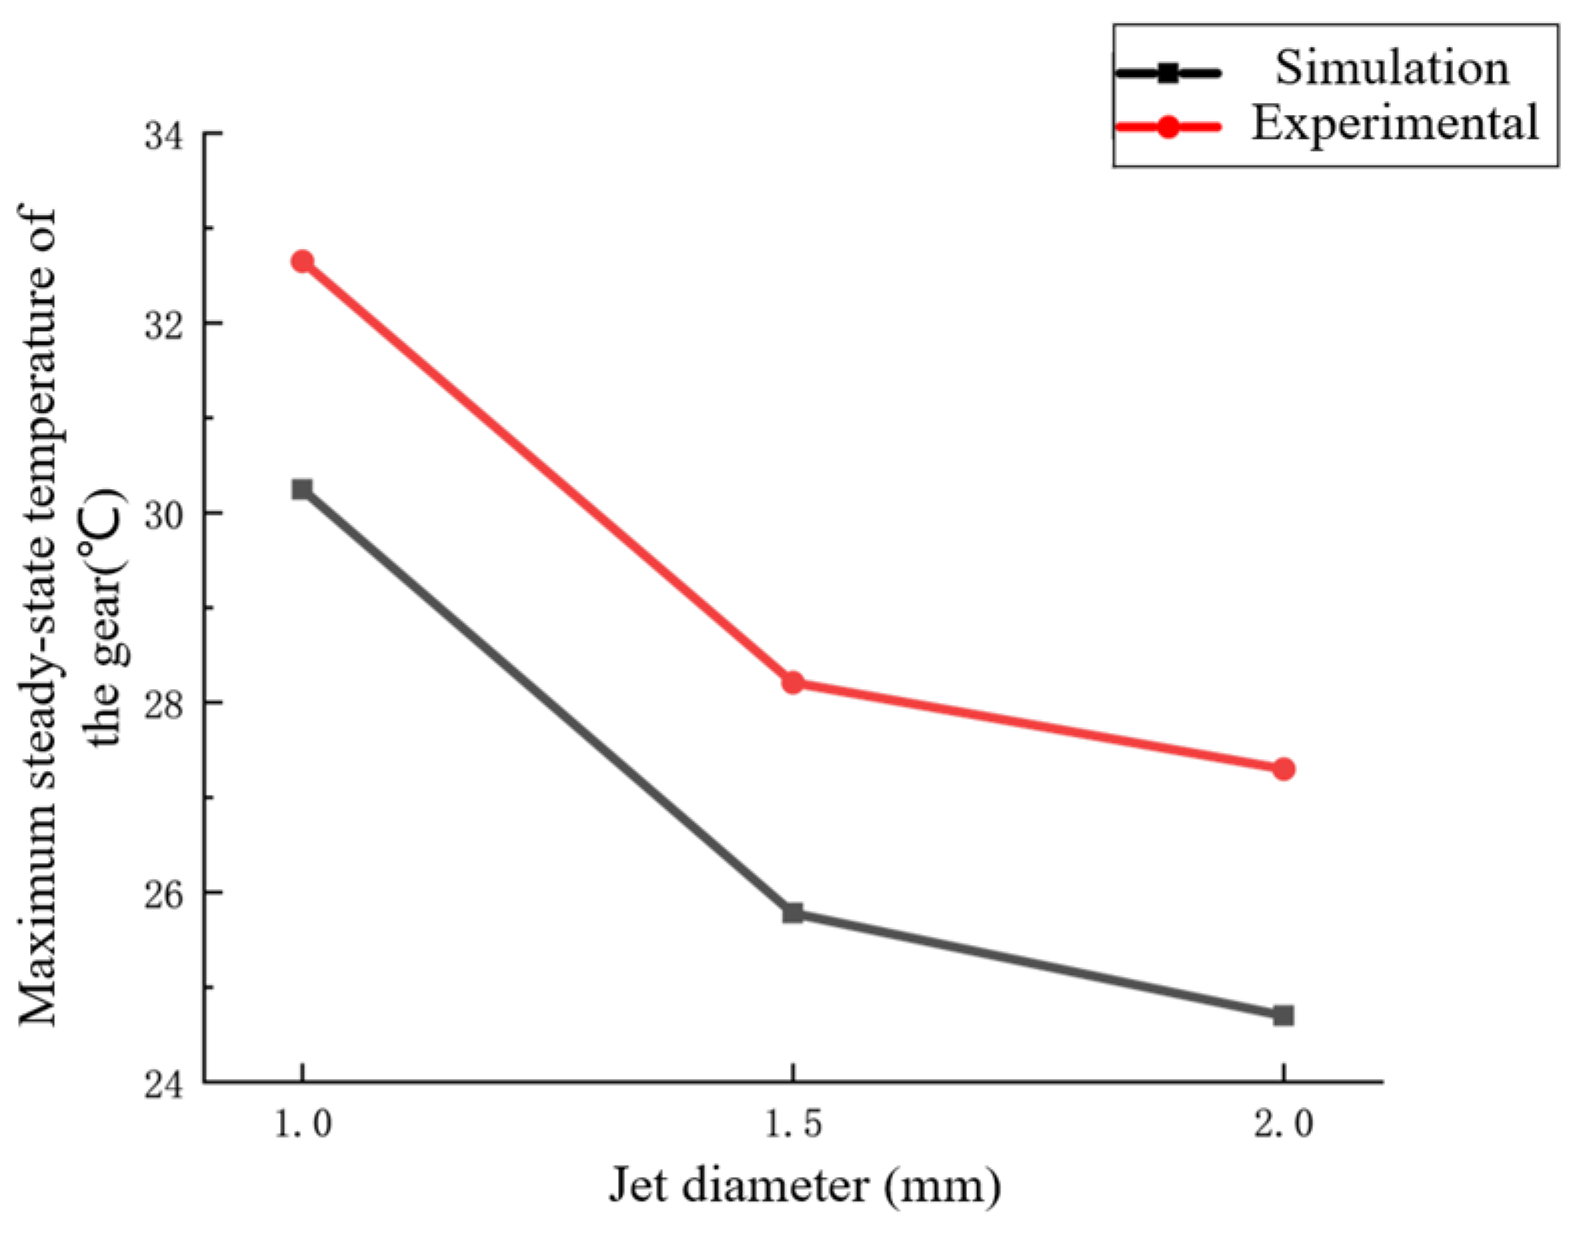
Maintaining the jet velocity at 4 m/s, experiments were conducted with different nozzle diameters of 1.5 mm and 2 mm. As displayed in Figure 9, simulation and experimental temperature values both decrease as the jet diameter increases. Increasing the diameter from 1 mm to 1.5 mm reduces the maximum temperature by approximately 4.5 °C, while increasing it from 1.5 mm to 2 mm reduces it by about 1 °C. This indicates that appropriately increasing the jet diameter can effectively reduce surface temperatures, but excessively large diameters do not significantly improve the effect. The error values of the test under these three jet diameters are 7.36%, 8.72% and 13.19%, indicating an increase in relative error with larger jet diameters.
In conclusion, the temperature trends of the double-helical gears in both experiments and simulations are consistent, with very small differences observed between measured and simulated temperatures. This validates the feasibility of the simulation method.

4. Simulation Model

4.1. Double-Helical Gear Jet Lubrication Simulation Model

The geometric parameters of the double-helical gear pair are listed in Table 5. A three-dimensional model of the gears was created in SolidWorks, along with a fluid domain model relevant to oil jet lubrication, as shown in Figure 10.
In fluid simulation, pressure is used to describe the pressure distribution of the fluid. Usually, the pressure value of a key point is used as the verification basis. By solving the pressure, the correctness and accuracy of the simulation model can be evaluated, and whether the model needs to be improved can be determined. In this paper, the accuracy of each group of grid models can be judged by obtaining the pressure difference in the meshing area of different examples at the same time node.
As shown in Table 6, the total number of mesh elements, actual computation time, and simulation results for different cases are presented. The pressure difference in the meshing zone initially increases and then stabilizes as the total number of mesh elements increases. Specifically, in cases 1 and 2, the pressure difference continues to rise, whereas in case 4, the pressure difference changes only slightly. Therefore, we selected the mesh model from case 3 for subsequent fluid simulation calculations. The final mesh consisted of approximately 6,146,000 elements, with an average element quality of 0.835. Other criteria such as skewness and orthogonal quality also met the requirements for fluid simulation.

4.2. Temperature Field Simulation Model for Double-Helical Gears

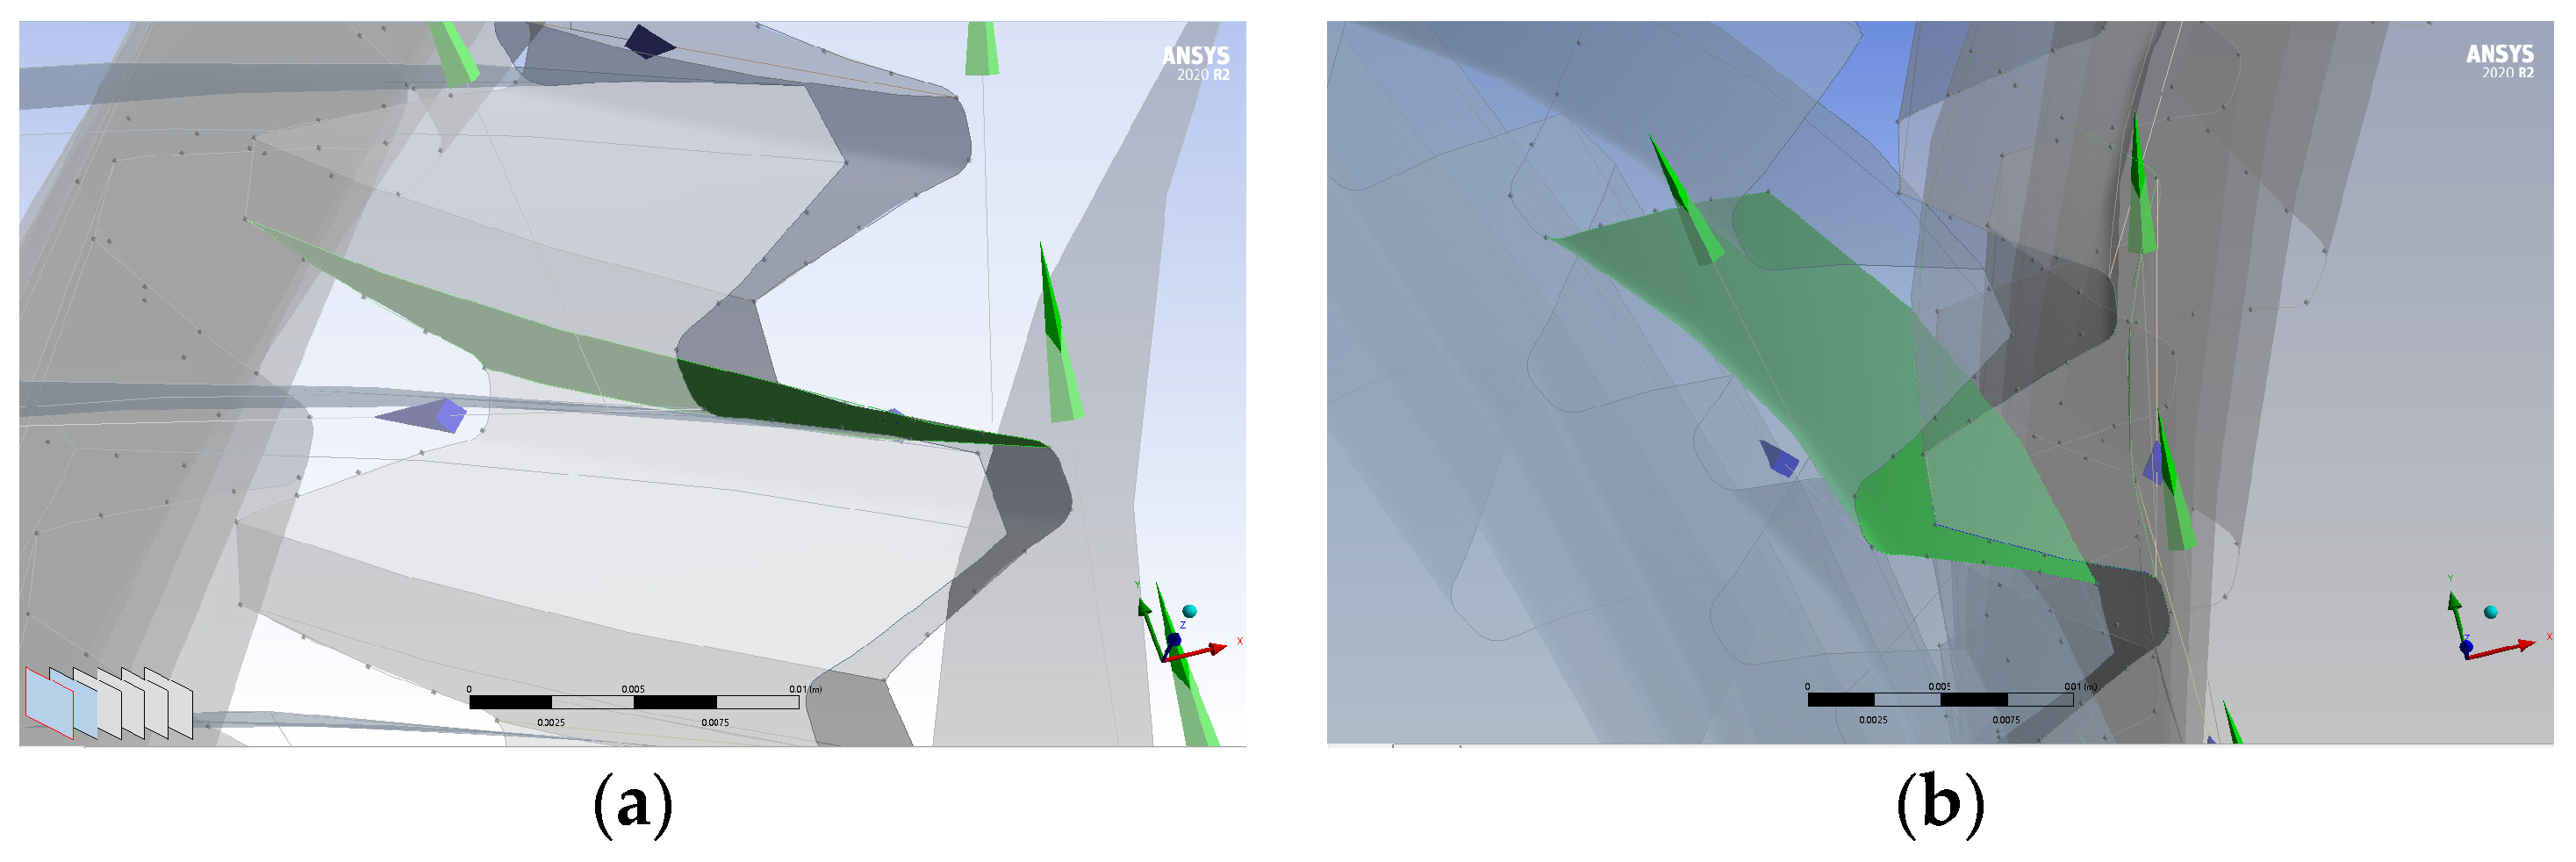
The temperature field module retains only the gear model, and it requires dividing the tooth surface into meshed and non-meshed areas. Preprocessing was conducted in ANSYS Design-Modeler (v. 2020 R2). Initially, points were generated on the contour lines of the inner and outer end faces, creating lines. The Projection command was then used to divide the tooth surface into meshed and non-meshed areas, as shown in Figure 11, with the meshed areas highlighted.
In the Meshing module, the gear model was meshed with a grid size of 0.8 mm, resulting in 1,445,641 mesh elements with an average quality of 0.7, meeting the thermal simulation requirements of the model. The gear temperature field simulation was performed in the Steady-State Thermal module of ANSYS.

5. Simulation Analysis Results

5.1. Lubrication Simulation Results Analysis

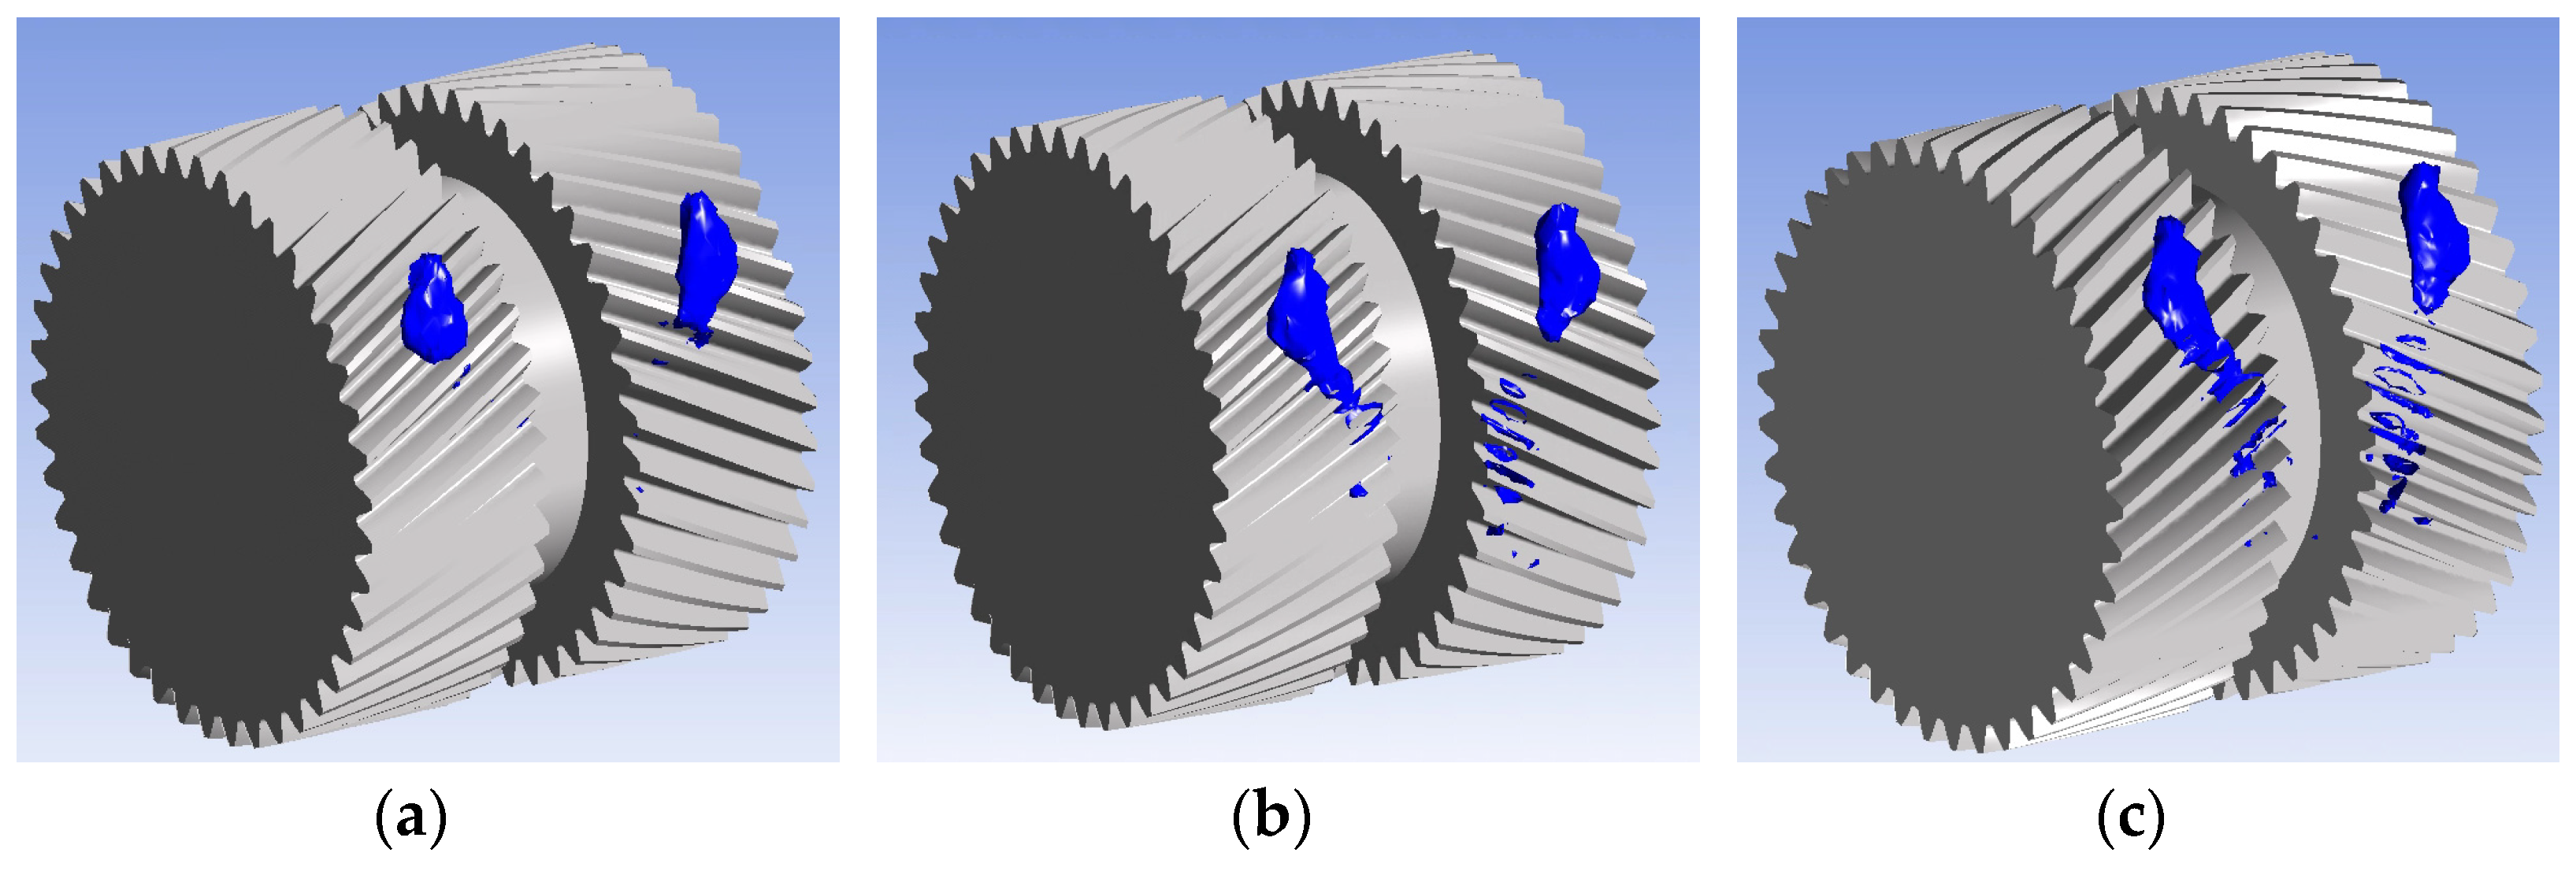
The multiphase flow model used for jet lubrication simulation is the VOF (volume of fluid) model, which describes each phase through volume fractions. The oil-to-gas ratio represents the percentage of lubricant in the two phases. In this section, the isosurface map of the driving gear and the lubricant velocity streamlines in axial view and end face view are analyzed. The isosurface map visualizes the distribution of the lubricant in the whole flow field, helping us to understand the coverage and distribution characteristics of the lubricant in the jet lubrication process. The velocity streamline plots show the flow paths and velocity distribution of the lubricant on the gear surface, helping us understand the lubricant flow behavior on the gear surface and its effect on gear mesh-area lubrication.

5.1.1. Jet Velocity

To investigate the effect of various jet speeds on the oil lubrication of double-helical gear injection, three sets of jet speeds were used to study the flow field’s dispersion: 70 m/s, 80 m/s, and 90 m/s. The driving gear rotated at 3000 rpm, and the jet diameter was 1 mm. As the jet velocity increases, the jet’s ability to penetrate the barrier formed by the surrounding high-speed airflow improves, allowing more lubricant to enter the meshing area. According to the equivalent surface plot in Figure 12, it is evident that more lubricant is spread across the gear surface at greater jet velocities.
To explore the impact of jet velocity on the jet trajectory, lubricant oil velocity streamline plots from different perspectives were obtained from the post-processing results. Figure 13a,b show the axial and end-face perspectives, respectively. From the axial perspective, it can be observed that at a jet velocity of 70 m/s, the jet exhibits slight turbulence. This phenomenon is eliminated when the jet velocity increases due to its increased capacity to withstand the surrounding airflow, lubricant oil can enter the meshing area more readily. From the end-face perspective, it can be seen that the jet tends to be directed towards the driven gear near the meshing area. This also explains why the maximum oil-to-gas ratio on the driven gear surface is greater than that on the driving gear.

5.1.2. Jet Diameter

This section examines the flow field distribution under three different jet diameters: 0.8, 1, and 1.2 mm. The jet velocity is 80 m/s, and the primary gear rotates at 3000 rpm.
As shown in the isosurface map in Figure 14, when the jet diameter increases, the lubricant oil accumulated near the outlet forms a larger column due to the influence of the surrounding high-speed airflow. Simultaneously, the nozzle’s oil output increases in volume per unit time, leading to increased lubricant oil entering the meshing area and enhanced dispersion on the gear surface.
Compared to changing the jet speeds, altering the jet diameters does not cause significant fluctuations in the maximum oil-to-gas ratio on the gear surfaces of the driving and driven gears. Additionally, comparing Figure 12a with Figure 14a, it is evident that when the jet velocity decreases to 70 m/s, the jet’s ability to penetrate the airflow weakens, causing almost all the oil to accumulate at the nozzle outlet. However, when the jet diameter decreases to 0.8 mm, the jet can still penetrate the barrier and continue forward. The flow rates under the two conditions are 2.20 × 10⁻⁴ m3/s and 1.61 × 10⁻⁴ m3/s, indicating that Condition B (jet diameter of 0.8 mm) achieves better lubrication with a lower flow rate compared to Condition A (jet velocity of 70 m/s).
Figure 15a,b show the lubricant oil velocity streamlines of the double-helical gear from axial and end face perspectives, respectively. The axial view indicates that the jet diameter has minimal bearing on the jet’s trajectory entering the meshing area, with the oil moving towards the inner end face. With a jet diameter of 0.8 mm, the end face view reveals that the jet does not show a significant bias before entering the meshing area, resulting in a similar maximum oil-to-gas ratio for both gears. However, as the jet diameter increases, the jet tends to favor the driven gear, and compared with 1 mm jet diameter, the length of the jet biased towards the driven gear becomes larger at 1.2 mm jet diameter, causing the driven gear’s maximum oil-to-air ratio to be higher than the driving gear’s, with better lubrication effect.

5.1.3. Gear Rotation Speed

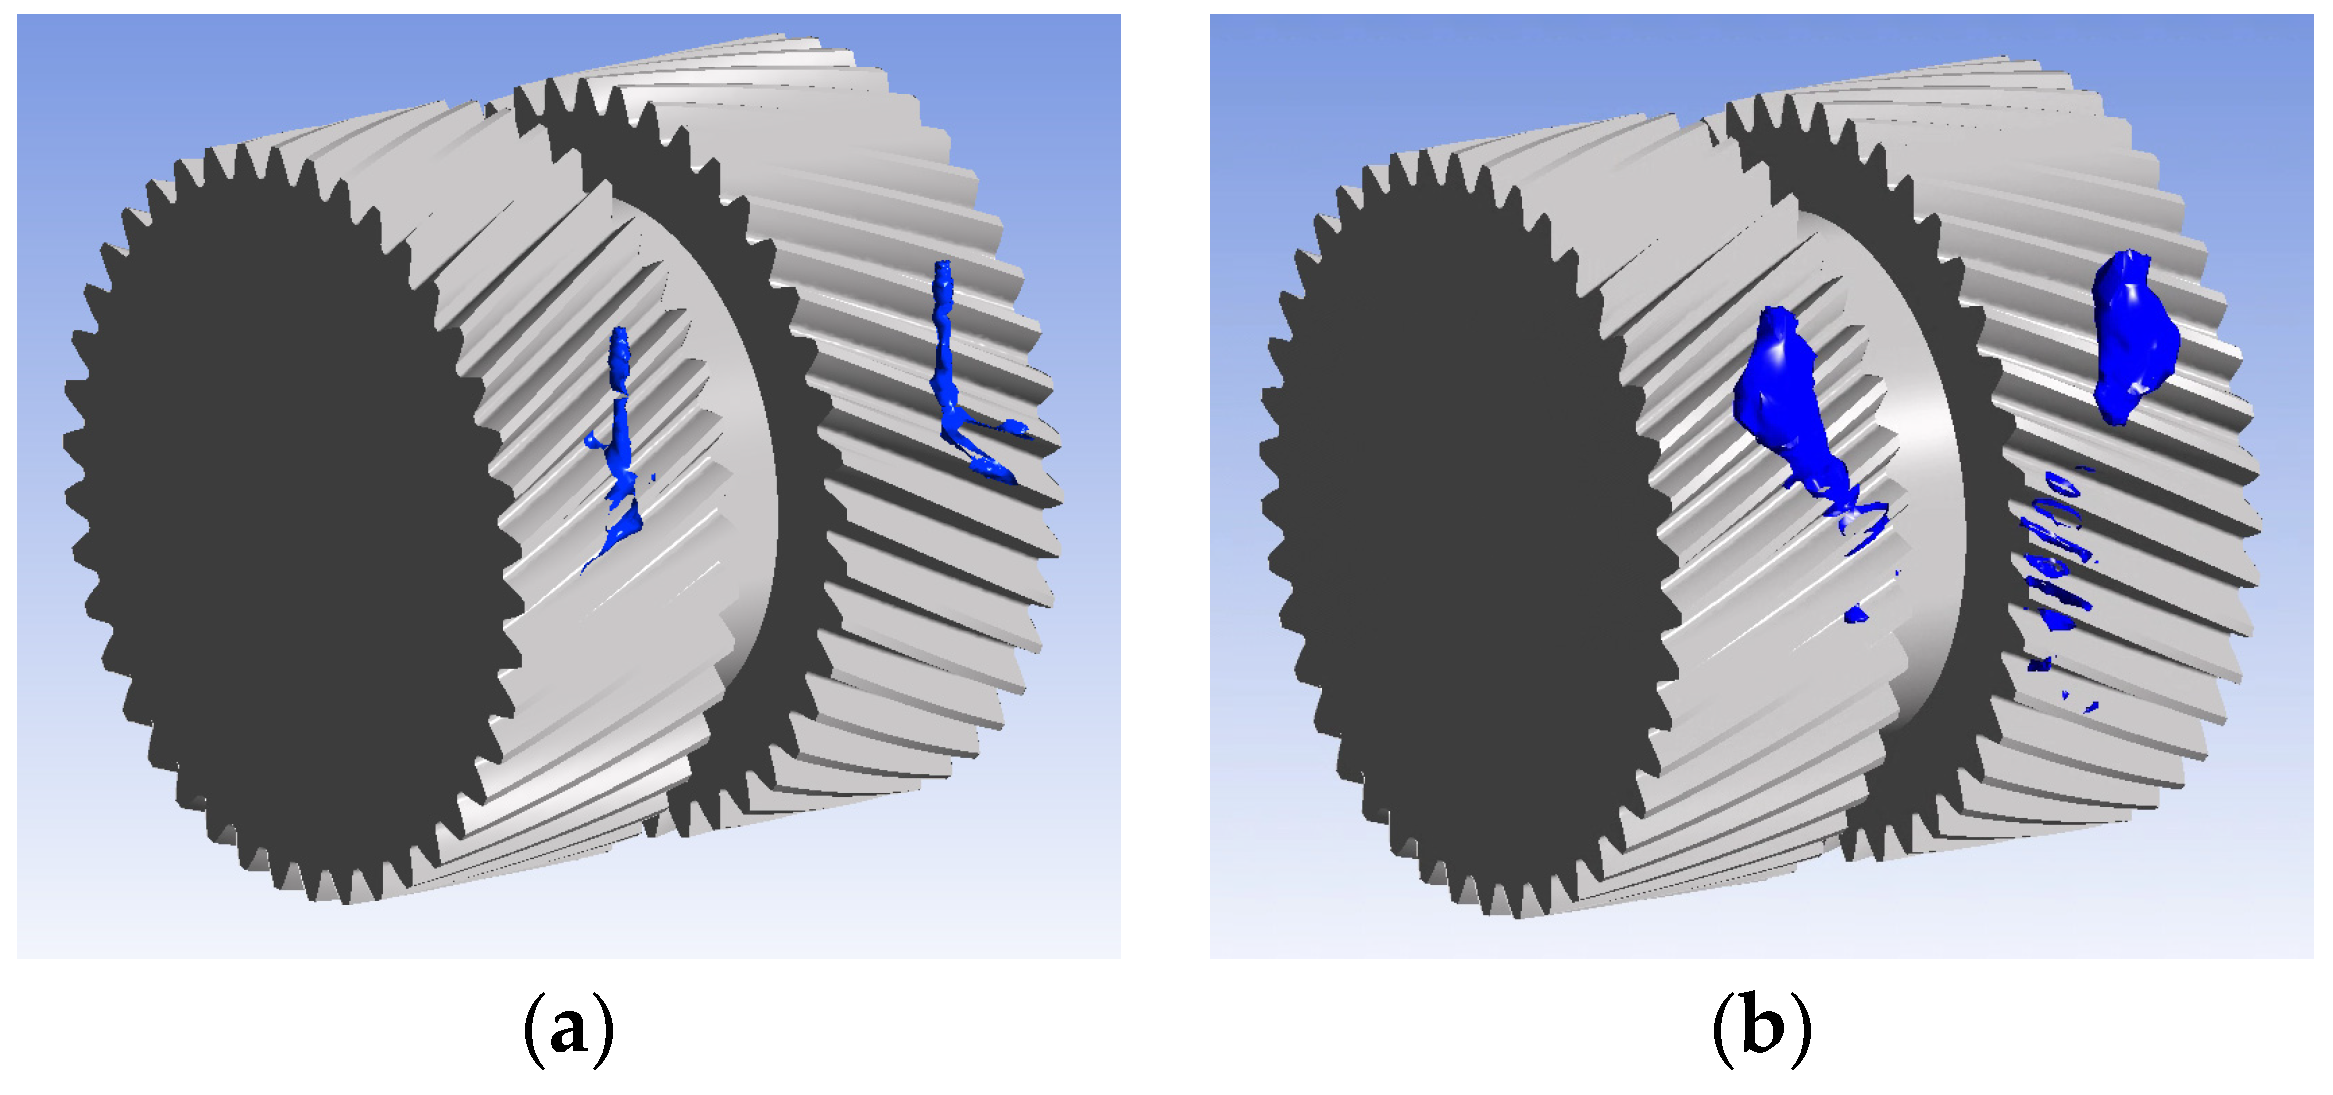
The trajectory of the lubricant oil is influenced to some extent by the rotational speed of the gear. This section begins by performing simulation calculations with no rotational speed to observe the flow field phenomena under these conditions. The oil–gas ratio cloud chart of the double-helical gear driving gear is displayed in Figure 16. When stationary, the gear does not generate a barrier region, enabling the jet to smoothly enter the meshing area without airflow interference, and accumulate in the meshing region.
An isosurface with an oil–gas ratio of 0.01 is set, as shown in Figure 17. It can be observed that when the gear is stationary, the oil can smoothly enter the meshing area to achieve lubrication, maintaining an excellent three-dimensional shape. After hitting the tooth surface, the jet disperses into droplets. However, when the gear is rotating, the oil is quickly influenced by the surrounding airflow as it exits the nozzle, causing the lubricant to accumulate near the outlet and increasing its spatial volume. This accumulation prevents the jet from moving smoothly along its path.
In practical conditions, double-helical gears often operate under high-speed rotation. When using jet lubrication, the obstructive effect of the airflow generated by high-speed gears must be considered. Addressing how to mitigate this phenomenon has been a topic of ongoing discussion among scholars.
To further explore the effect of air drag on lubrication effectiveness, this section investigates the flow field distribution under three different driving gear speeds: 2000, 3000, and 4000 r/min. The jet speed is 80 m/s, and the nozzle diameter is 1 mm.
Figure 18a,b, respectively, show the velocity streamlines of the lubricating oil for the double-helical gear from an axial view and an end view. The rotational speeds of the driving gear, from left to right, are 2000, 3000, and 4000 r/min. As observed in the axial perspective, at a rotational speed of 2000 r/min, compared with 3000 r/min, the jet trajectory into the meshing area does not significantly deflect towards the inner end face, but instead reaches the gear surface more directly. Upon reaching a rotational speed of 4000 r/min, the jet begins to exhibit a turbulent state, which is also fully illustrated by the end view. From Figure 18b, it can be known that when the rotational speed is 2000 r/min, the jet tends to deflect towards the driven gear before entering the meshing area. Unlike at 3000 r/min, the deflection occurs closer to the meshing area, leading to greater differences in lubrication performance between the two gears at lower speeds.

5.2. Temperature Field Simulation Result Analysis

5.2.1. Convective Heat Transfer Coefficient Calculation

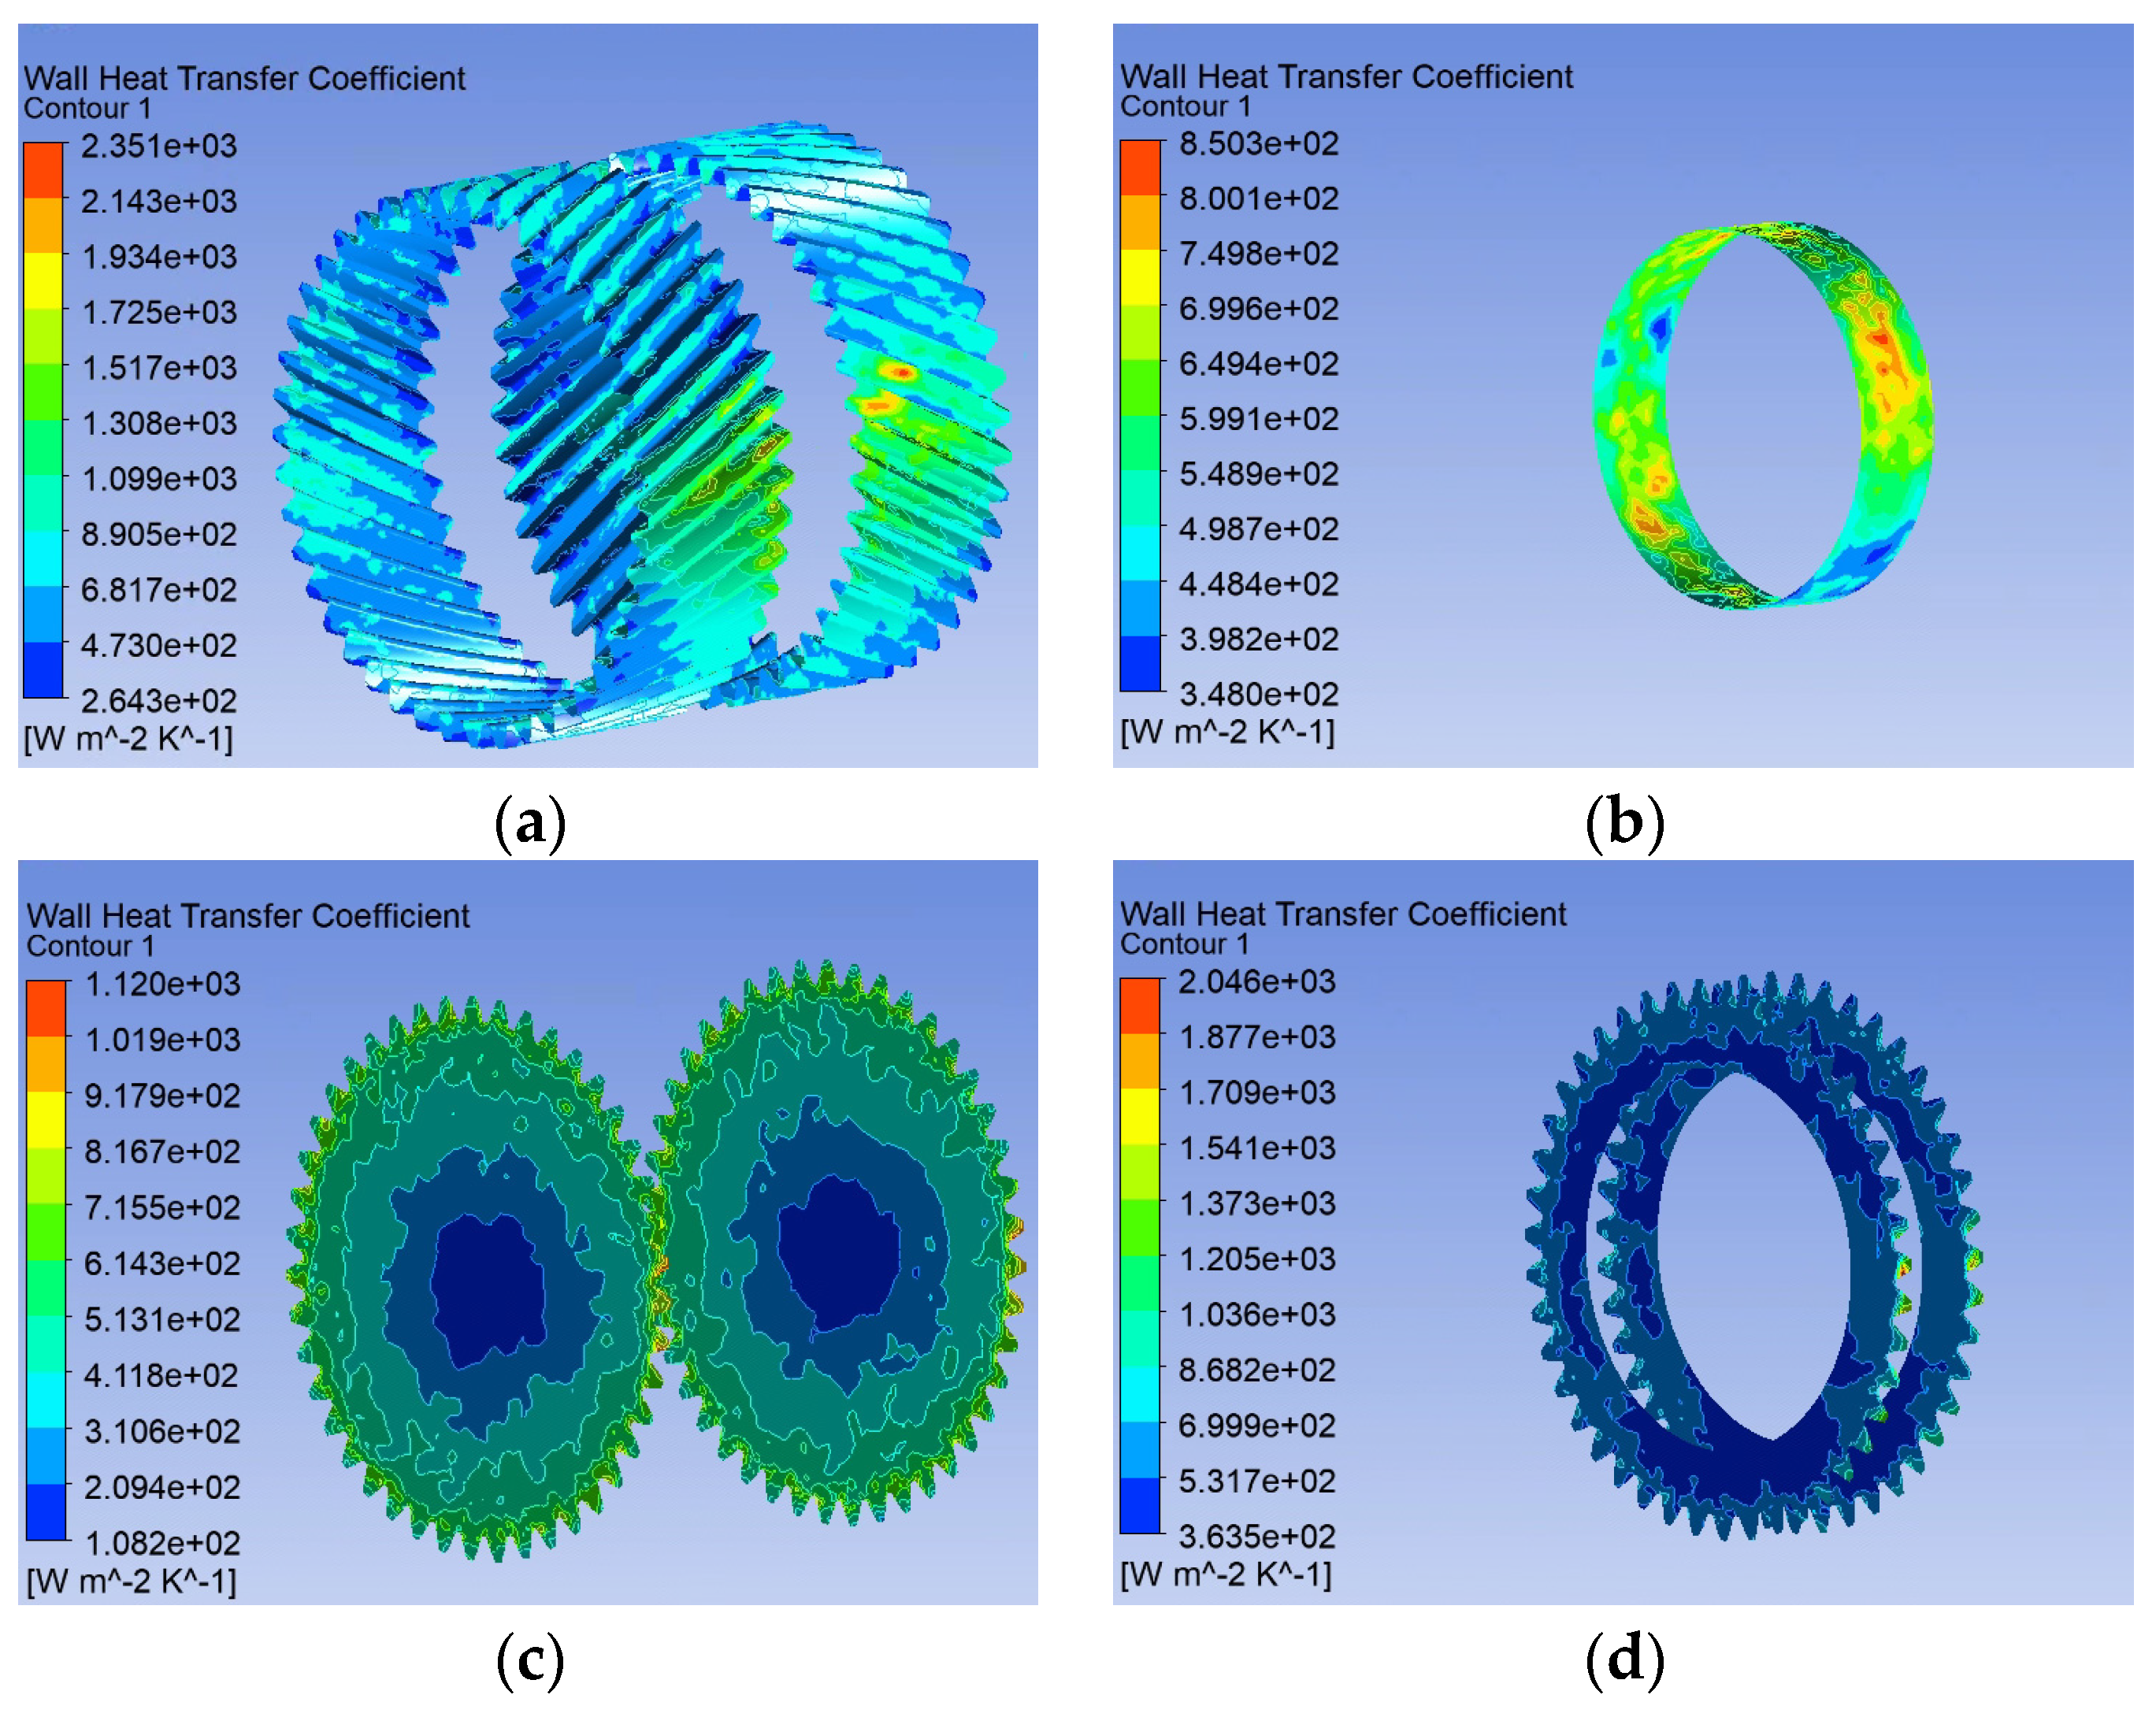
The ability of the lubricating oil and gear to transport heat is indicated by the convective heat transfer coefficient. After completing the simulation, the results were imported into the CFD-Post post-processing software (v. 2020 R2) for analysis to obtain the convective heat transfer coefficients on each surface. As shown in Figure 19 and Figure 20, these depict the distribution of convective heat transfer coefficients on the surfaces of the driving and driven gear, respectively. It is evident that, whether on the driving gear or the driven gear, the convective heat transfer coefficients are highest near the meshing zone due to the continuous accumulation of oil entering the meshing zone from the nozzle.
As can be seen in Table 7, the average convection heat transfer coefficient on the tooth surface is the highest, with values of 689.13 for the driving gear and 699.34 for the driven gear. The convective heat transfer coefficients at each point of each surface are derived from the post-processor. The average values of the convection heat transfer coefficient are very close for the inner end face and the root relief groove, while the outer end face exhibits the lowest average convection heat transfer coefficient compared to other surfaces, with values of 480.78 for the driving gear and 480.11 W/(m2·k) for the driven gear.

5.2.2. Calculation of Heat Flux Density for Double-Helical Gears

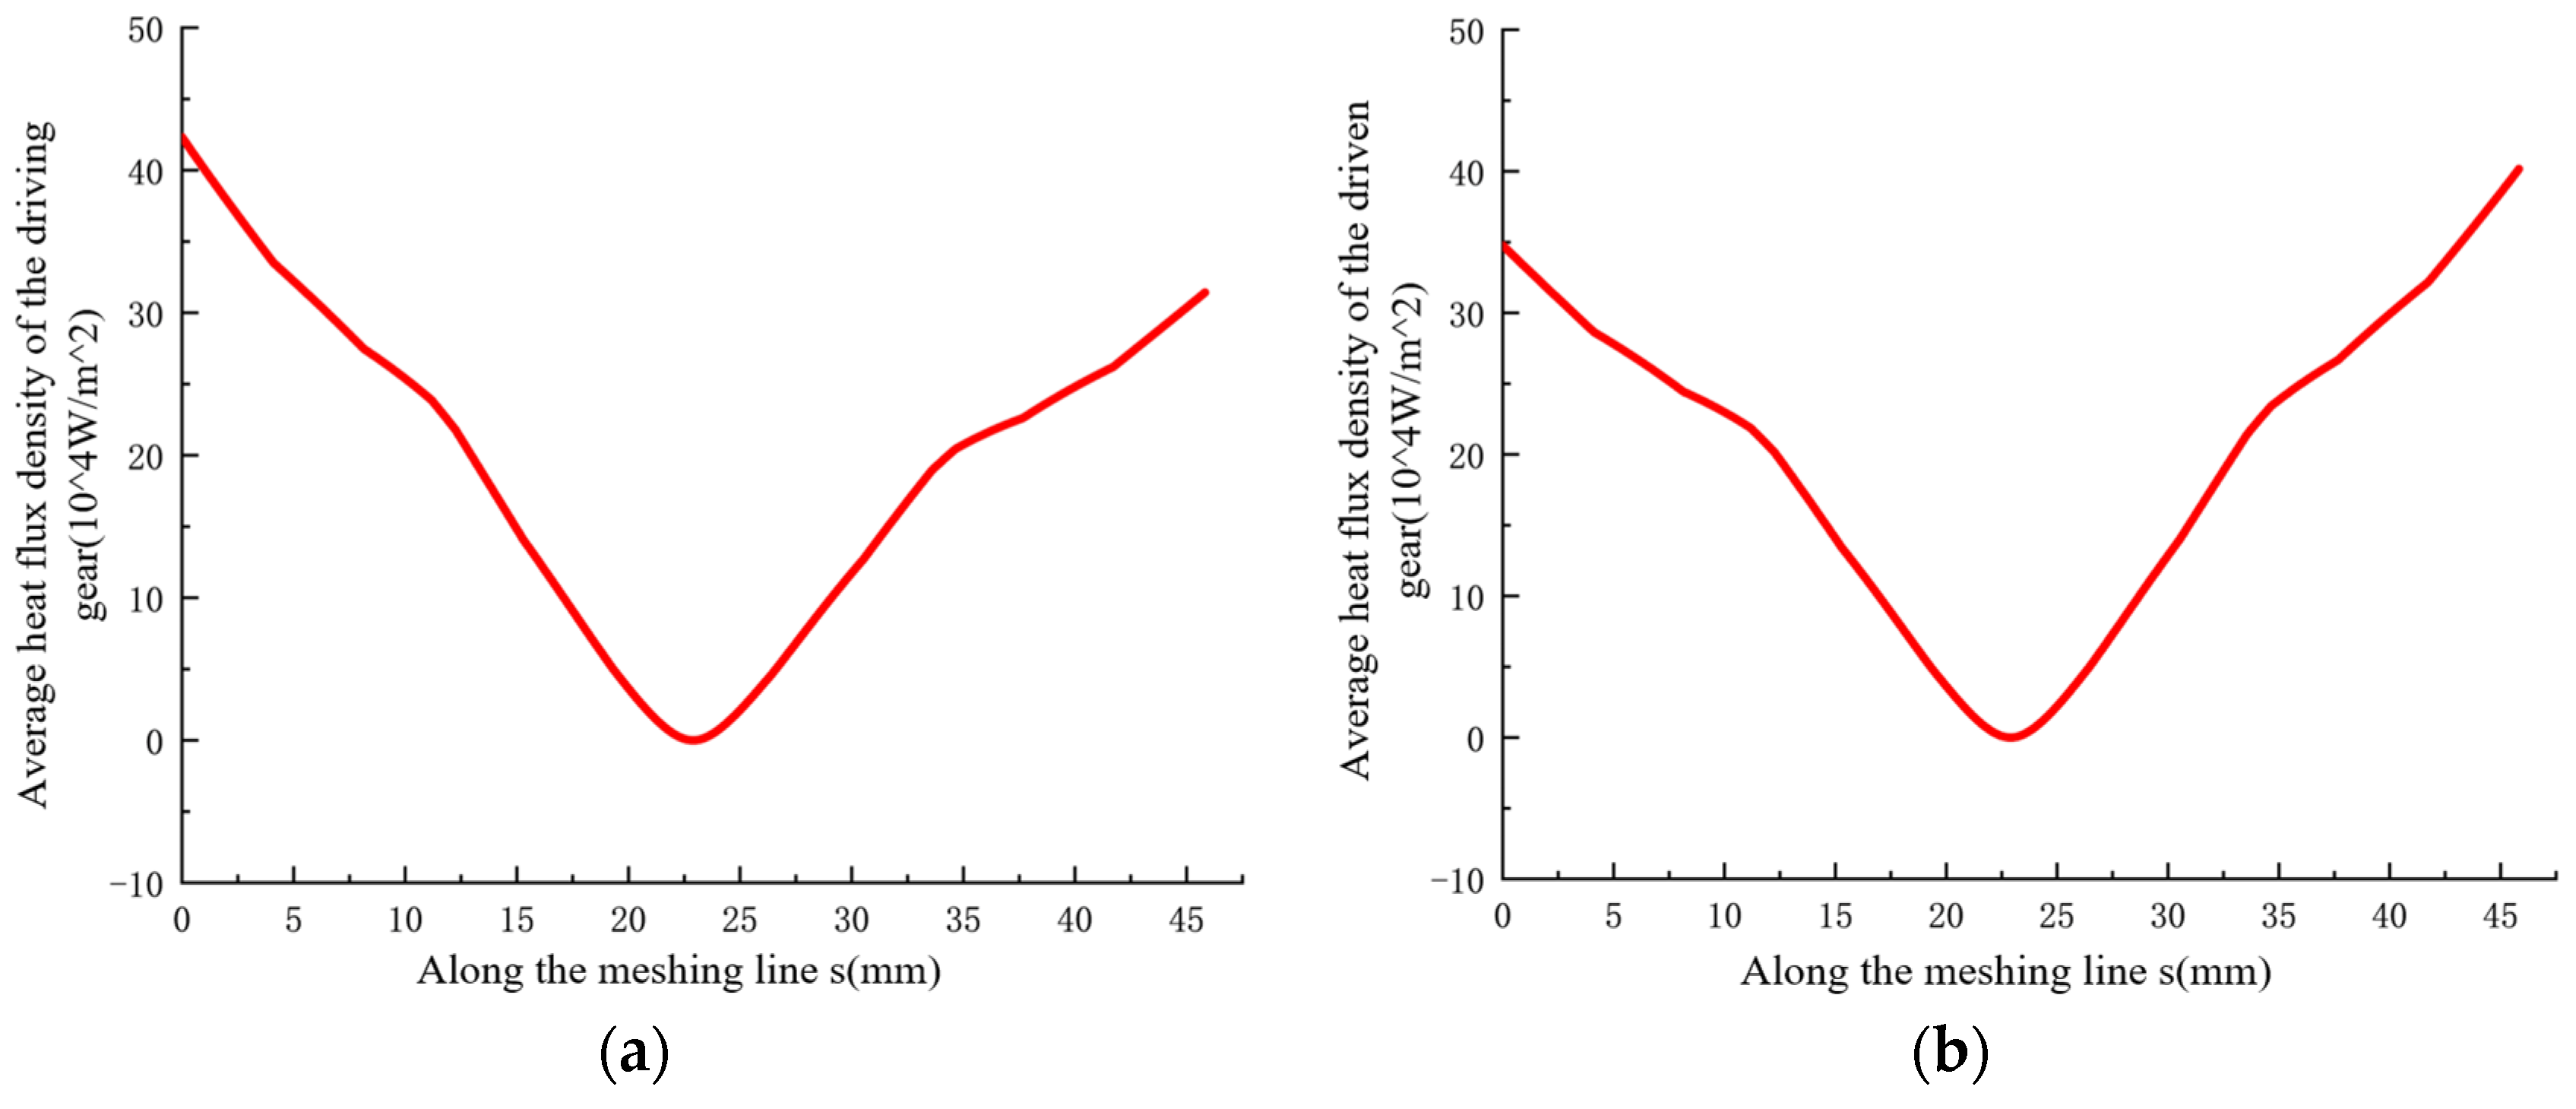
Based on Hertzian theory, a tooth surface contact analysis of double-helical gears was conducted to determine the frictional heat flux density, providing the heat generation boundary conditions for the temperature field solution. Using MATLAB software (v. R2018b) for programming, the relevant meshing parameters of the double-helical gears were obtained, and the frictional heat flux density as the heat generation boundary condition was calculated, as shown in Figure 21. The average frictional heat flux density of both gears initially decreases and then increases along the meshing line. Since the number of teeth of both gears is similar, their heat generation amounts are also not significantly different.

5.2.3. Temperature Field Simulation Solution

Since the gear teeth generate heat due to friction only during meshing, the average value of heat generation is loaded onto all meshing surfaces of the gears. The calculated average heat flux densities were 0.191 W/mm2 and 0.195 W/mm2 for the driving and driven gears, respectively. In addition, the convective heat transfer coefficients obtained from the fluid simulation (shown in Table 7) were used as heat transfer boundary conditions for the temperature field simulation.
The double-helical gear’s steady-state temperature field distribution is depicted in Figure 22. The maximum temperature, as visible in the image on the left, is 135.79 °C, and the lowest temperature is 83.361 °C, located at the center of the gear. Enlarging the gear teeth yields the right image, where the red area is on the meshing surface and the yellow area is on the non-meshing surface. It can be observed that heat generation causes a significant temperature difference between the meshing and non-meshing surfaces.

5.2.4. Analysis of Parameters Affecting the Steady-State Temperature Field Distribution

To further explore the distribution of the gear temperature field under different lubrication conditions, this section analyzes the impact of various injection parameters and rotational speed conditions.

Effect of Jet Speed on the Temperature Field

In this section, the steady-state temperature field distributions of double-helical gears are investigated at three sets of jet speeds: 70, 80, and 90 m/s. The same post-processing methods are used to apply convective heat transfer coefficients to each gear surface, while the heat generation conditions remain constant since the operating conditions did not change. The steady-state temperature field distribution of the double-helical gears at various jet speeds is shown in Figure 23. The lubricating oil flow rate increases with a progressive increase in jet speed because the jet can reach the tooth surface more easily and has a greater cooling effect.
When the jet speed increases from 70 to 80 m/s, the maximum and minimum temperatures decrease by 1.4 °C and 3.292 °C. When the jet speed increases from 80 to 90 m/s, the maximum temperature decreases by only 0.88 °C, while the minimum temperature increases by 2.254 °C. This indicates that a moderate increase in jet speed helps reduce the maximum temperature of the gears. However, excessively high jet speeds do not significantly improve the cooling effect and impose greater demands on the equipment. Additionally, the relationship between jet speed and the lowest gear temperature is not linear, so a reasonable jet speed should be selected.

Effect of Jet Diameter on the Temperature Field

In this section, the steady-state temperature field distributions of double-helical gears are studied under three jet diameters: 0.8, 1, and 1.2 mm. The steady-state temperature field distribution of double-helical gears under various jet diameters is shown in Figure 24. As the jet diameter increases, the jet becomes wider, and when the jet hits the gear teeth and spreads around, the lubricant covers a larger area, resulting in improved cooling of the gears.
When the jet diameter increases from 0.8 mm to 1 mm, the maximum and minimum temperatures decrease by 1.97 °C and 3.261 °C, respectively. As the jet diameter increases from 1 to 1.2 mm, the maximum and minimum temperatures decrease by 1.31 °C and 1.152 °C, respectively. This indicates that both extreme temperatures of the gear are negatively correlated with the jet diameter. Compared with jet speed, changing the nozzle diameter under the same other conditions may achieve better results. It can be seen that when the jet diameter is 1.2 mm, the temperature reduction is not as significant as the previous one. This is because excessive lubricating oil requires the gear to overcome more lubrication resistance during operation, leading to additional heat generation. Therefore, the jet diameter should not be too large to avoid wasting lubricating oil.

Effect of Gear Speed on the Temperature Field

This section investigates the steady-state temperature field distributions of double-helical gears under three sets of driving gear speeds: 2000, 3000, and 4000 rpm. With an input torque of 20,000, the frictional heat flux density of the gear pair is recalculated after changing the speed, as shown in Table 8 below. The average heat flux density of the gears increases with the increase in speed.
After reloading the calculated heat generation boundary conditions and heat dissipation boundary conditions, the results of the temperature field simulation are shown in Figure 25. With constant jet speed and diameter, increasing the gear speed generates stronger high-speed airflow, intensifying the air churning effect and significantly affecting the trajectory of the jet. This makes less lubricating oil enters the meshing area, sharply decreasing the heat transfer effectiveness. Meanwhile, frictional heat due to gear meshing also increases, leading to an overall increase in gear temperature.
It is observed that with increasing speed, the maximum temperature continues to rise while the minimum temperature decreases. As the speed increases from 2000 to 3000 rpm, the maximum temperature increases by 8.92 °C, and the minimum temperature decreases by 4.594 °C. When the speed further increases from 3000 to 4000 rpm, the maximum temperature increases by 8.23 °C, and the minimum temperature decreases by 14.397 °C. At 4000 rpm, because there is a greater difference in the frictional heat flux density between the driven and driving gears, the driving gear’s temperature is noticeably lower than the driven gear’s. In practical applications, it is crucial to monitor gear speed, as changes in speed affect both heat generation and dissipation, which can significantly influence lubrication effectiveness.

6. Conclusions

(1) Within a certain range, increasing the jet speed can reduce the maximum temperature of the gears. However, the lubricant flow rate increases in tandem with the jet speed. This results in a shorter dwell time of the lubricant on heat sources, such as gears or bearings. Additionally, higher jet speeds increase the turbulence of the oil flow, which limits the efficiency of heat removal by the lubricant. Therefore, excessively high injection speeds do not significantly reduce the maximum temperature of the gears. This suggests that optimizing lubrication parameters is critical in applications such as aerospace or high-performance automotive transmissions where precise temperature control is essential.
(2) Increasing the jet diameter increases the amount of oil flowing out of the nozzle per unit time, allowing more lubricating oil to enter the meshing area, thus improving the lubrication effectiveness of the gear. However, increasing the volume of lubricating oil can also lead to increased churning losses in the gear, which generates additional heat. To guarantee the equipment’s regular functioning and longevity, the jet diameter needs to be controlled within an appropriate range. When designing lubrication systems for double-helical gears, it is essential to consider the trade-offs between enhancing lubrication and minimizing additional heat generation due to oil churning.
(3) The frictional heat flux density of the gear increases with increasing speed. When the gear operates at high speeds, a strong air field is formed near the meshing area, and the jet flow encounters an air field barrier after flowing out of the nozzle. This results in only a portion of the lubricant being able to enter the mesh zone. Therefore, an increase in rotational speed results in less lubricant entering the vicinity of the mesh zone, and the heat transfer effect deteriorates, causing the maximum gear temperature to increase. This indicates the need for careful design of lubrication systems or alternative cooling strategies for double-helical gears in high-speed machinery.

Author Contributions

Conceptualization, X.H.; Methodology, X.H. and Y.Y.; Validation, Y.Y. and J.C.; Investigation, Y.Y.; Data curation, X.H. and J.C.; Writing—original draft, J.C.; Writing—review & editing, Y.Y.; Project administration, X.H.; Funding acquisition, X.H. All authors have read and agreed to the published version of the manuscript.

Funding

Project of opening competition mechanism to select the best candidates of manufacturing industry of Hunan province: Grant No. 2022GXGG003.

Data Availability Statement

Data are contained within the article.

Conflicts of Interest

The authors declare no conflict of interest.

References

  1. Tang, D.; Chen, G. Current situation and prospect of gear transmission technology. J. Mech. Eng. 1993, 29, 35–42. [Google Scholar]
  2. Xu, H. Development dynamics of gear manufacturing technology. Manuf. Technol. Mach. Tool 1994, 3, 43–45. [Google Scholar]
  3. Andersson, M.; Sosa, M.; Olofsson, U. Efficiency and temperature of spur gears using jet lubrication compared to dip lubrication. Proc. Inst. Mech. Eng. Part J J. Eng. Tribol. 2017, 231, 1390–1396. [Google Scholar] [CrossRef]
  4. Schober, H. Einspritzschmierung bei Zahnradgetrieben. In FVA Forschungshefte Heft 156; Forschungsvorhaben Nr. 44111; Institut fur Maschinenkonstruktion und Getriebebau der Universit at Stuttgart: Stuttgart, Germany, 1983. [Google Scholar]
  5. Massini, D.; Fondelli, T.; Facchini, B.; Tarchi, L.; Leonardi, F. High Speed Visualizations of oil Jet Lubrication for Aero-engine Gearboxes. Energy Procedia 2016, 101, 1248–1255. [Google Scholar] [CrossRef]
  6. Ayan, E.; Kromer, C.; Schwitzke, C.; Bauer, H.J. Experimental investigation of the oil jet heat transfer on meshing spur gears. In Proceedings of the 5th Conference of the International Society for Air Breathing Engines, Ottawa, ON, Canada, 25–30 September 2022. [Google Scholar]
  7. Yazdani, M.; Soteriou, M.C. A novel approach for modeling the multiscale thermo-fluids of geared systems. Int. J. Heat Mass Transf. 2014, 72, 517–530. [Google Scholar] [CrossRef]
  8. Turner, A.; Morvan, H.P.; Simmons, K. Two Phase Computational Study of Flow Behaviour in a Region Within an Aeroengine Gearbox. In Turbo Expo: Power for Land, Sea, and Air; American Society of Mechanical Engineers: New York, NY, USA, 2014; Volume 45738, p. V05CT16A021. [Google Scholar]
  9. Jiang, Y.; Hu, X.; Hong, S.; Li, P.; Wu, M. Influences of an oil guide device on splash lubrication performance in a spiral bevel gearbox. Tribol. Int. 2019, 136, 155–164. [Google Scholar] [CrossRef]
  10. Keller, M.C.; Kromer, C.; Cordes, L.; Schwitzke, C.; Bauer, H.J. CFD study of oil-jet gear interaction flow phenomena in spur gears. Aeronaut. J. 2020, 124, 1301–1317. [Google Scholar] [CrossRef]
  11. Ambrose, S.; Morvan, H.; Simmons, K. Investigation of Oil Jet Impingement on a Rotating Gear Using Lattice Boltzman Method (LBM). In Proceedings of the 2018 Turbomachinery Technical Conference and Exposition, Oslo, Norway, 11–15 June 2018; American Society of Mechanical Engineers: New York, NY, USA, 2018; Volume 50985, p. V001T01A028. [Google Scholar] [CrossRef]
  12. Ji, Z.; Stanic, M.; Hartono, E.A.; Chernoray, V. Numerical simulations of oil flow inside a gearbox by Smoothed Particle Hydrodynamics (SPH) method. Tribol. Int. 2018, 127, 47–58. [Google Scholar] [CrossRef]
  13. Menon, M.; Szewc, K.; Maurya, V. Multi-Phase Gearbox Modelling Using GPU-Accelerated Smoothed Particle Hydrodynamics Method. In Proceedings of the 2019 Fluids Engineering Division Summer Meeting, San Francisco, CA, USA, 28 July–1 August 2019; American Society of Mechanical Engineers: New York, NY, USA, 2019; Volume 59049, p. V03AT03A008. [Google Scholar]
  14. Akin, L.S.; Mross, J.J.; Townsend, D.P. Study of lubricant jet flow phenomena in spur gears. J. Lubr. Technol. 1975, 97, 283–288. [Google Scholar] [CrossRef]
  15. Townsend, D.P.; Akin, L.S. Study of lubricant jet flow phenomena in spur gears-out of mesh condition. J. Mech. Des. 1978, 100, 61–68. [Google Scholar] [CrossRef]
  16. Chen, G.; Zhou, Y.; Qian, X.; Wu, W.; Zhao, Y. Simulation study on oil jet lubrication of high-speed gears. Lubr. Seal 2019, 44, 125–132. [Google Scholar]
  17. Zhou, C.; Xiao, Z.; Chen, S.; Han, X. Normal and tangential oil film stiffness of modified spur gear with non-Newtonian elastohydrodynamic lubrication. Tribol. Int. 2017, 109, 319–327. [Google Scholar] [CrossRef]
  18. Wang, L.; Zhan, Y.; Liu, L. Analysis of oil jet lubrication for high-speed hk gear pairs. J. Mech. Sci. Technol. 2019, 38, 1641–1646. [Google Scholar]
  19. Zhang, H.; Huang, B.; Ding, Y. Analysis of oil jet lubrication for high-speed gearboxes under negative pressure based on, C.F.D. Mech. Transm. 2024, 48, 16–23. [Google Scholar] [CrossRef]
  20. Xia, J.; Yao, H.; Chen, S.; Wang, Z.; Tao, X. Optimal nozzle orientation design for high linear speed gears based on CFD method. Lubr. Seal 2023, 48, 178–186. [Google Scholar]
  21. Dai, Y.; Jia, J.; Ouyang, B.; Bian, J. Determination of an optimal oil jet nozzle layout for helical gear lubrication: Mathematical modeling, numerical simulation, and experimental validation. Complexity 2020, 2020, 2187027. [Google Scholar] [CrossRef]
  22. Wang, Y.; Niu, W.; Tang, W.; Guo, M.; Guo, X. Factors influencing the deviation of oil nozzle jet direction. J. Aerosp. Power 2012, 27, 1665–1670. [Google Scholar]
  23. Fatourehchi, E.; Shahmohamadi, H.; Mohammadpour, M.; Rahmani, R.; Theodossiades, S.; Rahnejat, H. Thermal analysis of an oil jet-dry sump transmission gear under mixed-elastohydrodynamic conditions. J. Tribol. 2018, 140, 051502. [Google Scholar] [CrossRef]
  24. Mo, S.; Dang, H.; Zou, Z.; Tang, W.; Yue, Z. Study on aerodynamic power loss of high-speed spiral bevel gears. Mech. Transm. 2021, 45, 1–6. [Google Scholar] [CrossRef]
  25. Wei, C.; Song, C.; Zhu, C.; Tan, C.; Guo, W. Modeling and analysis of transmission efficiency of high-speed wheel-side reducers for electric vehicles. J. Chongqing Univ. 2019, 42, 1–8. [Google Scholar] [CrossRef]
  26. Velex, P.; Ville, F. An analytical approach to tooth friction losses in spur and helical gears influence of profile modifications. J. Mech. Des. 2009, 131, 101008. [Google Scholar] [CrossRef]
  27. Blok, H. The dissipation of frictional heat. Appl. Sci. Res. Sect. A 1955, 5, 151–181. [Google Scholar] [CrossRef]
  28. Tobe, T.; Kato, M. A study on flash temperatures on the spur gear teeth. J. Eng. Ind. 1974, 96, 78–84. [Google Scholar] [CrossRef]
  29. Cheng, H.S. A refined solution to the thermal-elastohydrodynamic lubrication of rolling and sliding cylinders. Asle Trans. 1965, 8, 397–410. [Google Scholar] [CrossRef]
  30. Gan, L.; Xiao, K.; Wang, J.; Pu, W.; Cao, W. A numerical method to investigate the temperature behavior of spiral bevel gears under mixed lubrication condition. Appl. Therm. Eng. 2019, 147, 866–875. [Google Scholar] [CrossRef]
  31. Li, W.; Zhai, P.F.; Ding, L. Analysis of Thermal Characteristic of Spur/Helical Gear Transmission. J. Therm. Sci. Eng. 2019, 11, 021003. [Google Scholar] [CrossRef]
  32. Qiao, S.; Zhou, J.; Zhang, X.; Jiang, H.; Shao, Y.; Shen, Y.; Wang, C. Dynamic Thermal Behavior of Two-Stage Gear Transmission System. J. Vib. Eng. Technol. 2021, 9, 1809–1831. [Google Scholar] [CrossRef]
  33. Li, F.; Wang, S.; Li, Z.; Li, J. Transient temperature field of helicopter transmission system spiral bevel gears under oil starvation conditions. J. Aerosp. Power 2020, 35, 1489–1495. [Google Scholar] [CrossRef]
  34. Chen, Y.; Zhu, J.; Chen, T.; Zhu, C.; Wei, P.; Xu, Y. Study on service temperature prediction model of high-speed gears in aviation. Mech. Transm. 2024, 48, 1–9. [Google Scholar] [CrossRef]
  35. Wu, M.; Hu, X.; Fang, T.; Wang, A.; Quan, C. Thermal analysis and experiment of spur gears under time-varying mixed lubrication. J. Mech. Des. Res. 2021, 37, 87–91. [Google Scholar]
  36. Mironova, T.B.; Prokofiev, A.B.; Sverbilov, V.Y. The finite element technique for modelling of pipe system vibroacoustical char-acteristics. Procedia Eng. 2017, 176, 681–688. [Google Scholar] [CrossRef]
  37. Roda-Casanova, V.; Sanchez-Marin, F. A 2D finite element based approach to predict the temperature field in polymer spur gear transmissions. Mech. Mach. Theory 2019, 133, 195–210. [Google Scholar] [CrossRef]
  38. Anderson, J.D. Computational Fluid Dynamics: The Basics with Applications; McGraw-Hill: New York, NY, USA, 1995. [Google Scholar]
  39. Hirt, C.W.; Nichols, B.D. Volume of fluid (VOF) method for the dynamics of free boundaries. J. Comput. Phys. 1981, 39, 201–225. [Google Scholar] [CrossRef]
  40. Yakhot, V.; Orszag, S.A.; Thangam, S.; Gatski, T.B.; Speziable, C.G. Development of turbulence models for shear flows by a double expansion technique. Phys. Fluids A Fluid Dyn. 1992, 4, 1510–1520. [Google Scholar] [CrossRef]
  41. Xu, H.E. Development of a generalized mechanical efficiency prediction methodology for gear pairs. In Dissertation Abstracts International; University Microfilms: Ann Arbor, MI, USA, 2005. [Google Scholar]
  42. Simon, V. Thermo-EHD analysis of lubrication of helical gears. J. Mech. Trans. 1988, 110, 330–336. [Google Scholar] [CrossRef]
  43. Simon, V. EHD Lubrication of Different Types of Gears; Springer: Berlin/Heidelberg, Germany, 2009. [Google Scholar]
  44. Handschuh, R.F.; Kicher, T.P. Experimental and Analytical Assessment of the Thermal Behavior of Spiral Bevel Gears; National Aeronautics and Space Administration, Lewis Research Center: Cleveland, OH, USA, 1995.
  45. Long, H.; Lord, A.A.; Gethin, D.T.; Roylance, B.J. Operating temperatures of oil-lubricated medium-speed gears: Numerical models and experimental results. Proc. Inst. Mech. Eng. Part G J. Aerosp. Eng. 2003, 217, 87–106. [Google Scholar] [CrossRef]
  46. Long, H.; Zhang, G.; Luo, W. Analytical simulation of transient contact stress and temperature of rotating gears. J. Mech. Eng. 2004, 40, 24–29. [Google Scholar] [CrossRef]
  47. Fernandes, C.M.; Rocha, D.M.; Martins, R.C.; Magalhães, L.; Seabra, J.H. Finite element method model to predict bulk and flash temperatures on polymer gears. Tribol. Int. 2018, 120, 255–268. [Google Scholar] [CrossRef]
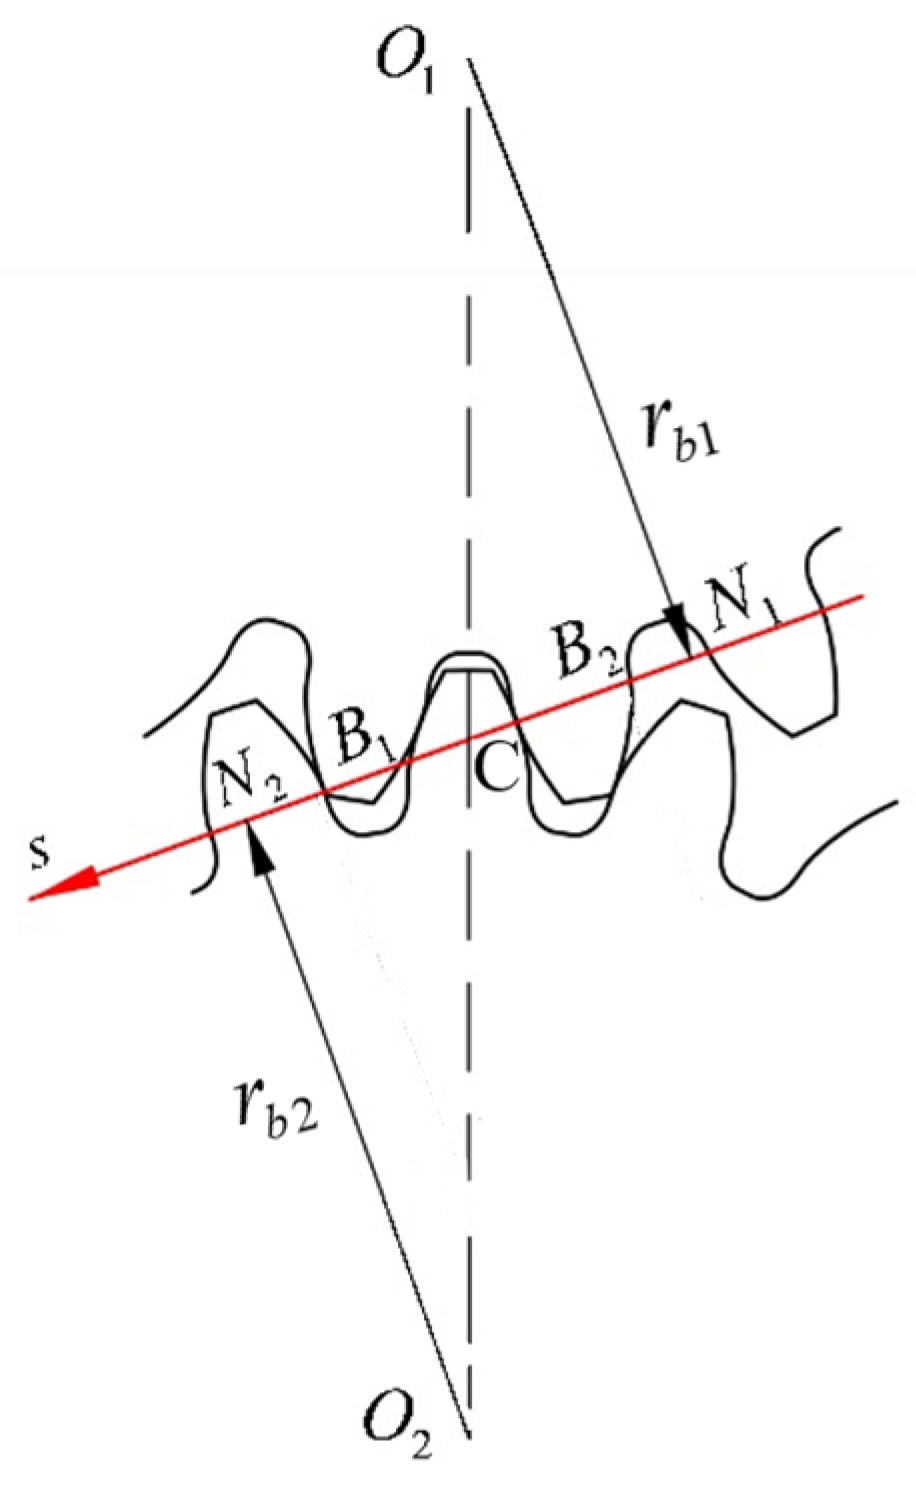
Figure 1. Gear meshing diagram.
Lubricants 12 00315 g001
Figure 2. Friction factor.
Lubricants 12 00315 g002
Figure 3. Overall scheme of the experiment platform.
Lubricants 12 00315 g003
Figure 4. Physical diagram of the experiment platform.
Lubricants 12 00315 g004
Figure 5. Double-helical gearbox.
Lubricants 12 00315 g005
Figure 6. Distribution diagram of drilling positions.
Lubricants 12 00315 g006
Figure 7. Steady-state temperature distribution.
Lubricants 12 00315 g007
Figure 8. Comparison of simulation and experimental temperature values at different jet velocities.
Lubricants 12 00315 g008
Figure 9. Comparison of simulation and experimental temperature values at different jet diameters.
Lubricants 12 00315 g009
Figure 10. Geometric model of double-helical gear pair for jet lubrication.
Lubricants 12 00315 g010
Figure 11. Meshed surface division: (a) driving gear meshed surface; (b) driven gear meshed surface.
Lubricants 12 00315 g011
Figure 12. Isosurfaces at different jet velocities: (a) 70 m/s; (b) 80 m/s; and (c) 90 m/s.
Lubricants 12 00315 g012
Figure 13. Lubricant oil velocity streamlines at different jet speeds: (a) axial view; (b) end-face view.
Lubricants 12 00315 g013
Figure 14. Equivalent surface plots at different jet diameters: (a) 0.8 mm; (b) 1 mm; and (c) 1.2 mm.
Lubricants 12 00315 g014
Figure 15. Lubricant oil velocity streamlines at different jet diameters: (a) axial view; (b) end-face view.
Lubricants 12 00315 g015
Figure 16. Oil−gas ratio cloud chart of driving gear tooth surface: (a) with rotation speed; (b) without rotation speed.
Lubricants 12 00315 g016
Figure 17. Oil–gas ratio isosurface of driving gear: (a) with rotation speed; (b) without rotation speed.
Lubricants 12 00315 g017
Figure 18. Lubricating oil velocity streamlines at different rotational speeds of the driving gear: (a) axial view; (b) end-face view.
Lubricants 12 00315 g018
Figure 19. Convective heat transfer coefficient distribution on surfaces of the driving gear: (a) tooth surface; (b) relief groove; (c) outer end face; (d) inner end face.
Lubricants 12 00315 g019
Figure 20. Convection heat transfer coefficient on various surfaces of the driven gear: (a) tooth surface; (b) relief groove; (c) outer end face; (d) inner end face.
Lubricants 12 00315 g020
Figure 21. Average frictional heat flux density: (a) driving gear; (b) driven gear.
Lubricants 12 00315 g021
Figure 22. Steady-state temperature: (a) overall distribution; (b) local distribution.
Lubricants 12 00315 g022
Figure 23. Steady-state temperature field of double helical gear under different jet speeds: (a) 70 m/s; (b) 80 m/s; (c) 90 m/s.
Lubricants 12 00315 g023
Figure 24. Steady-state temperature field of double helical gear under different jet diameters: (a) 0.8 mm; (b) 1 mm; (c) 1.2 mm.
Lubricants 12 00315 g024
Figure 25. Steady-state temperature field of double helical gear under different driving gear speeds: (a) 2000 rpm; (b) 3000 rpm; (c) 4000 rpm.
Lubricants 12 00315 g025
Table 1. Parameters of bi.
ParameterValue
b 1 −8.916465
b 2 1.03303
b 3 1.036077
b 4 −0.354068
b 5 2.812084
b 6 −0.100601
b 7 0.752755
b 8 −0.390958
b 9 0.620305
Table 2. Geometric parameters of the experimental gears.
ParameterValue (Driving and Driven Gears)
Number of Teeth43/42
Module (mm)3.5
Tooth Width (mm)60/60
Pressure Angle (°)20
Helix Angle (°)26.969
Shaft Hole Radius (mm)42/45
Undercut Radius (mm)78/76
Undercut Width (mm)46
Table 3. Material parameters of the double-helical gear pair.
Name Density   ( k g / m 3 ) Specific Heat Capacity
( J / k g k )
Thermal Conductivity
( W / m k )
Elastic Modulus
( G P a )
Gear7980500402.1
Table 4. Physical properties parameters of lubricating oil.
NameDensity ( k g / m 3 ) Specific Heat Capacity
( J / k g k )
Thermal Conductivity
( W / ( m · k ) )
Dynamic Viscosity
(Pa·s)
Lubricating Oil969.619600.140.03
Table 5. Geometric parameters of the double-helical gear pair.
ParameterValue
Number of Teeth43/42
Module (mm)3.5
Face Width (mm)60
Pressure Angle (°)22.5
Helix Angle (°)26.969
Standard Center Distance (mm)166.9
Table 6. Total number of grids, computation time and results for different cases.
CaseTotal Number of Mesh Elements
(Million)
Actual Computation Time (h)Pressure Difference in the Meshing Zone (Pa)
14.31321.9266,379
25.20428.5313,058
36.14642.7399,082
47.56258.6387,998
Table 7. Convection heat transfer coefficients of gears.
SurfaceConvective Heat Transfer Coefficient/W/(m2·k)
Driving Gear Tooth Surface689.13
Driving Gear Flank579.45
Driving Gear Outer End Face480.78
Driving Gear Inner End Face602.05
Driven Gear Tooth Surface699.34
Driven Gear Flank585.88
Driven Gear Outer End Face480.11
Driven Gear Inner End Face605.61
Table 8. Frictional heat flux density at different speeds.
Driving Gear Speed (rpm)Average Heat Flux Density (Driving Gear/Driven Gear) (W/mm2)
20000.1328/0.1355
30000.1913/0.1951
40000.2478/0.2527
Disclaimer/Publisher’s Note: The statements, opinions and data contained in all publications are solely those of the individual author(s) and contributor(s) and not of MDPI and/or the editor(s). MDPI and/or the editor(s) disclaim responsibility for any injury to people or property resulting from any ideas, methods, instructions or products referred to in the content.