Article

Atomic Simulation of Wear and Slip Behavior Between Monocrystalline Silicon and 6H-SiC Friction Pair

1
Center of Ultra-Precision Optoelectronic Instrumentation Engineering, Harbin Institute of Technology, Harbin 150001, China
2
Key Lab of Ultra-Precision Intelligent Instrumentation, Harbin Institute of Technology, Ministry of Industry Information Technology, Harbin 150080, China
*
Author to whom correspondence should be addressed.
Lubricants 2025, 13(4), 147; https://doi.org/10.3390/lubricants13040147
Submission received: 22 February 2025 / Revised: 22 March 2025 / Accepted: 25 March 2025 / Published: 27 March 2025
(This article belongs to the Special Issue Recent Advances in Lubricated Tribological Contacts)

Abstract

:
The slip mechanism between the chunk and wafer during high-speed dynamic scanning of the extreme ultraviolet lithography (EUV) motion stage remains unclear. Considering real-machined roughness, molecular dynamics (MD) simulations were performed to investigate the nanotribological behavior of 6H-SiC sliders on single-crystal silicon substrates. The effects of sinusoidal asperity parameters and normal loads on wear and slip were systematically analyzed. Results indicate that, for friction between sinusoidal asperities and ideal flat surfaces, the amplitude of surface parameters exhibits negligible influence on friction. In contrast, reduced normal loads and lower periods significantly increase both friction force and coefficient of friction (COF).

1. Introduction

In the field of semiconductor manufacturing, the performance of integrated circuits is influenced by the positioning accuracy of the EUV motion stage [1,2]. The clamping device on the motion stage holds the wafer during exposure. Due to insufficient dry friction, slip occurs during high-speed motion in a vacuum environment [3]. This kind of slip will lead to a degradation in positioning accuracy, which, in turn, will adversely impact the yield rate of the chips [4]. Increasing the adsorption force of the chuck in the clamping device can reduce slip, but it may cause wafer deformation, thus shortening the lifespan of the chips [5]. There are various material combinations for wafers and chucks in lithography. Given the widespread use and stability of single-crystal silicon [6], as well as the excellent thermal properties [7,8], hardness [9], and stiffness [10] of 6H-SiC, this paper will investigate the microscopic friction mechanisms between single-crystal silicon wafers and 6H-SiC chucks.
Using instruments like atomic force microscopes and friction force microscopes [11] apparatus to conduct experiments is an effective way to study nanotribology. However, due to the limitations of experimental conditions and the advancements in computer technology, low-cost MD simulations offer an efficient alternative. For instance, Yu et al. [12] analyzed the friction process of diamonds on the 6H-SiC surface and discovered that microscopic crystal changes can lead to macroscopic crack formation. Wu et al. [13] investigated the effect of processing temperature on the deformation of 6H-SiC during nanoscale scratching, finding that the processing temperature significantly affects dislocation distribution, scratching force, and COF. Piroozan et al. [14] researched the sliding friction between two amorphous SiC surfaces, finding that the relationship between dynamic friction force and sliding velocity is nonlinear, not conforming to Coulomb’s law of friction.
The characterization of contact interfaces plays a pivotal role in advancing fundamental friction theory [15,16]. In prior studies, contact interfaces have been often simplified to a spherical tip and an idealized plane [17,18]. Other MD friction models have also been developed with textured surfaces [19], triangular surfaces [20], and fractal surfaces [21]. However, these characterization methods exhibit limited applicability to real engineering surfaces. With the advancement of contact mechanics, sinusoidal asperity contact has been widely recognized as an effective approximation for rough surfaces [22,23]. The limits of real surfaces are at the atomic scale. MD simulations can capture atomic trajectories and thereby reveal the microscopic mechanisms of friction. Notably, no MD studies have been reported on contact friction involving sinusoidal asperities.
This research uses MD simulations to study the sliding process of 6H-SiC sliders with one-dimensional sine wave surfaces on single-crystal silicon plane substrates. By analyzing the substrate surface’s temperature, stress, and phase transition, the study investigates the destructive behavior of the substrate surface under different normal loads. To gain a deeper understanding of the sliding mechanism, the displacement and velocity, as well as the adhesive force, contacting force, and friction of the sliders are analyzed.

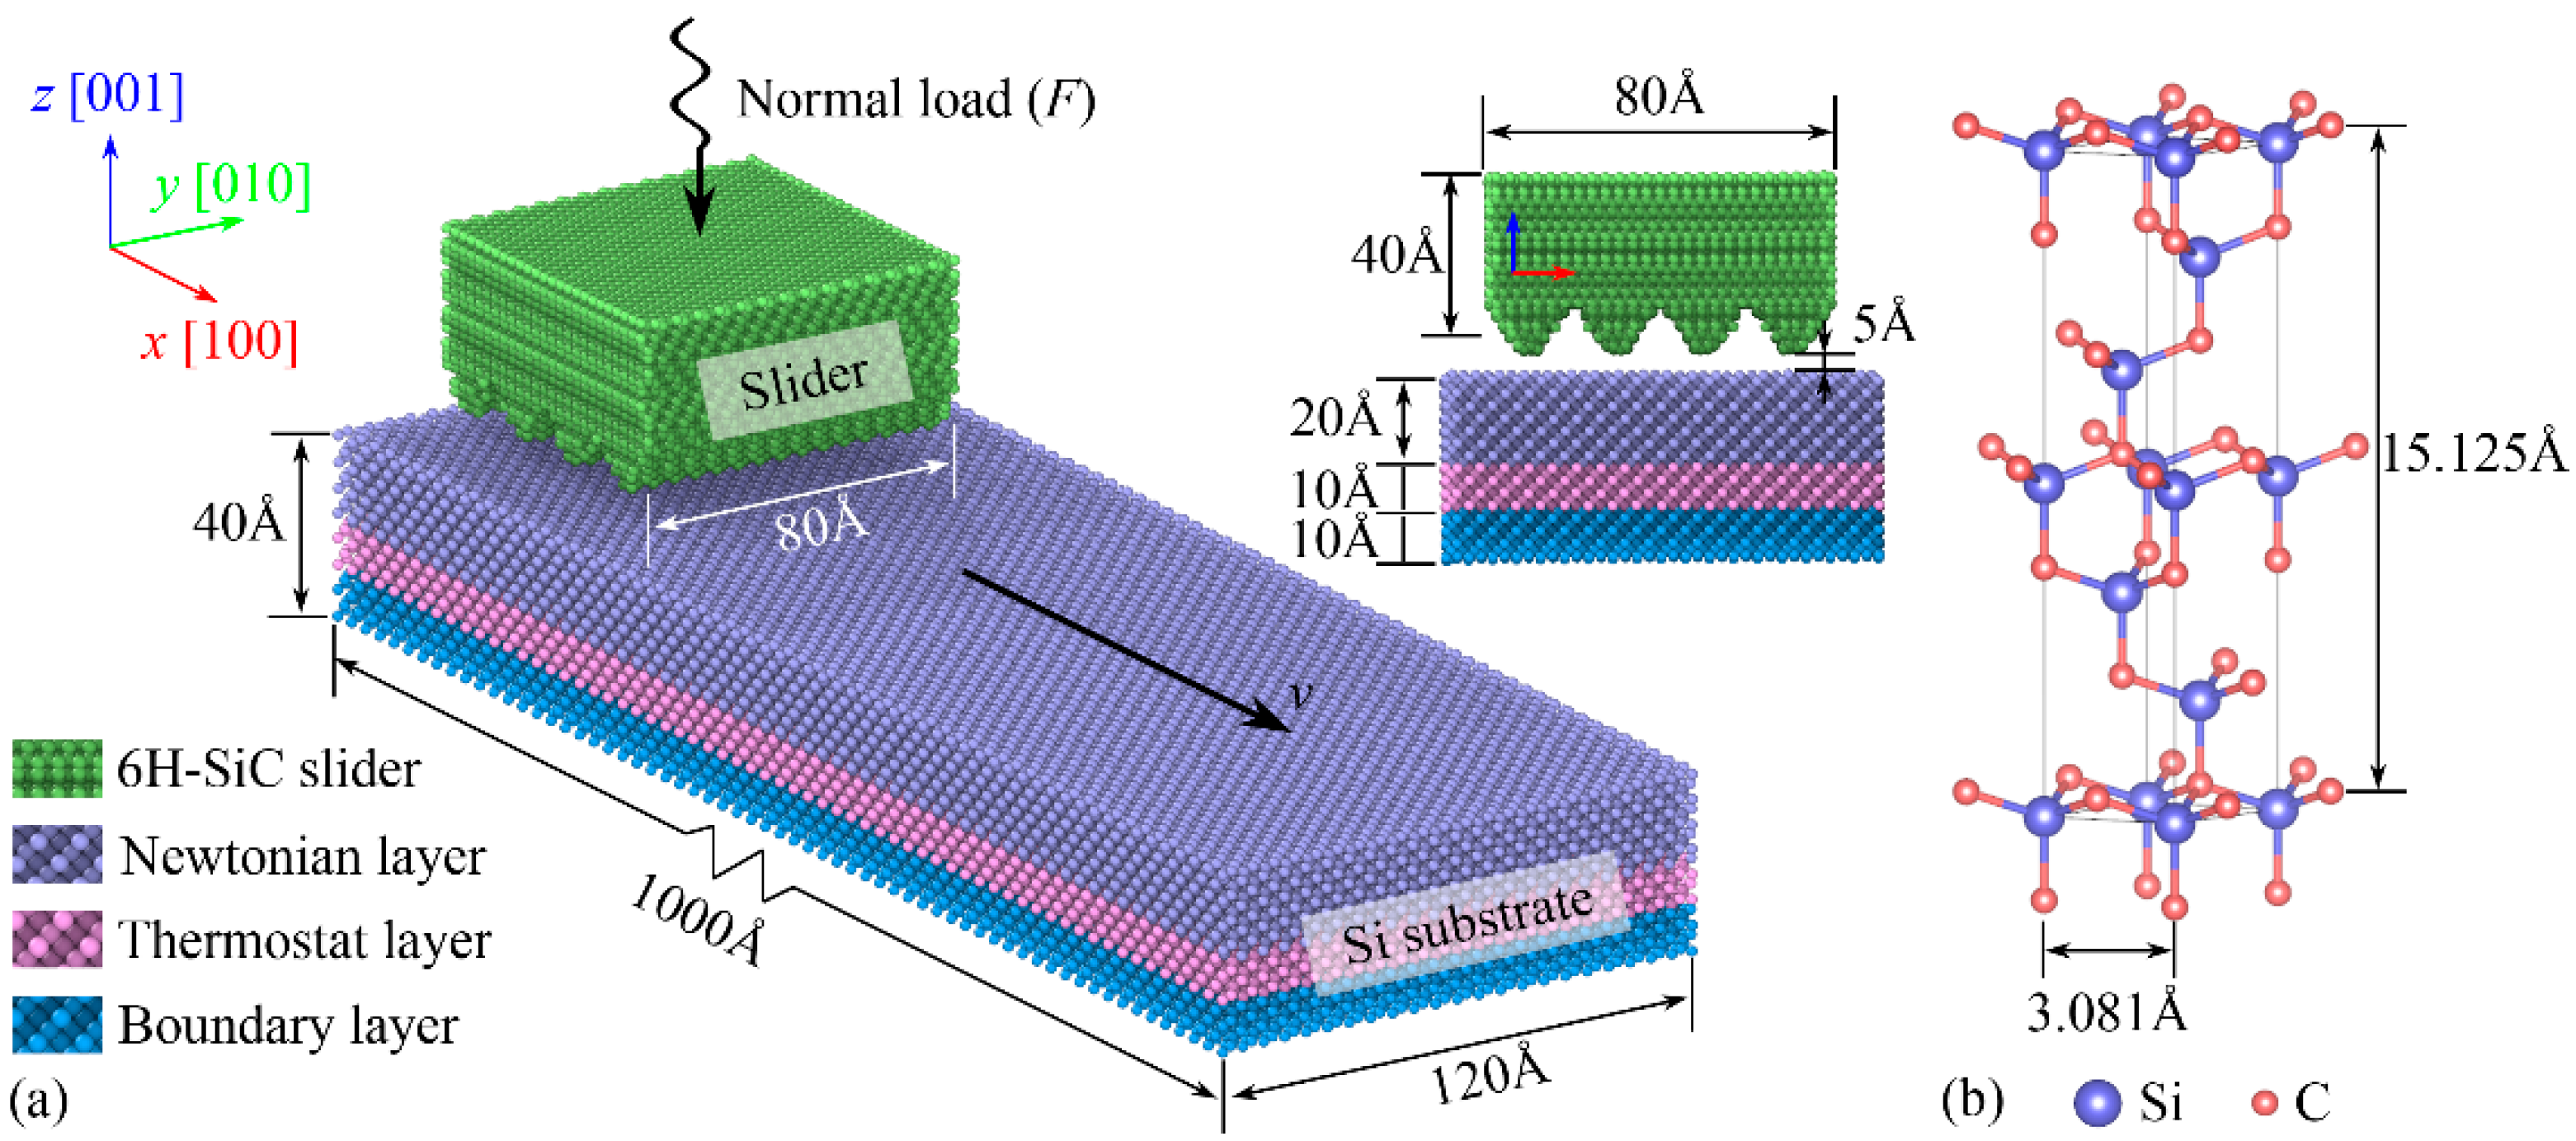
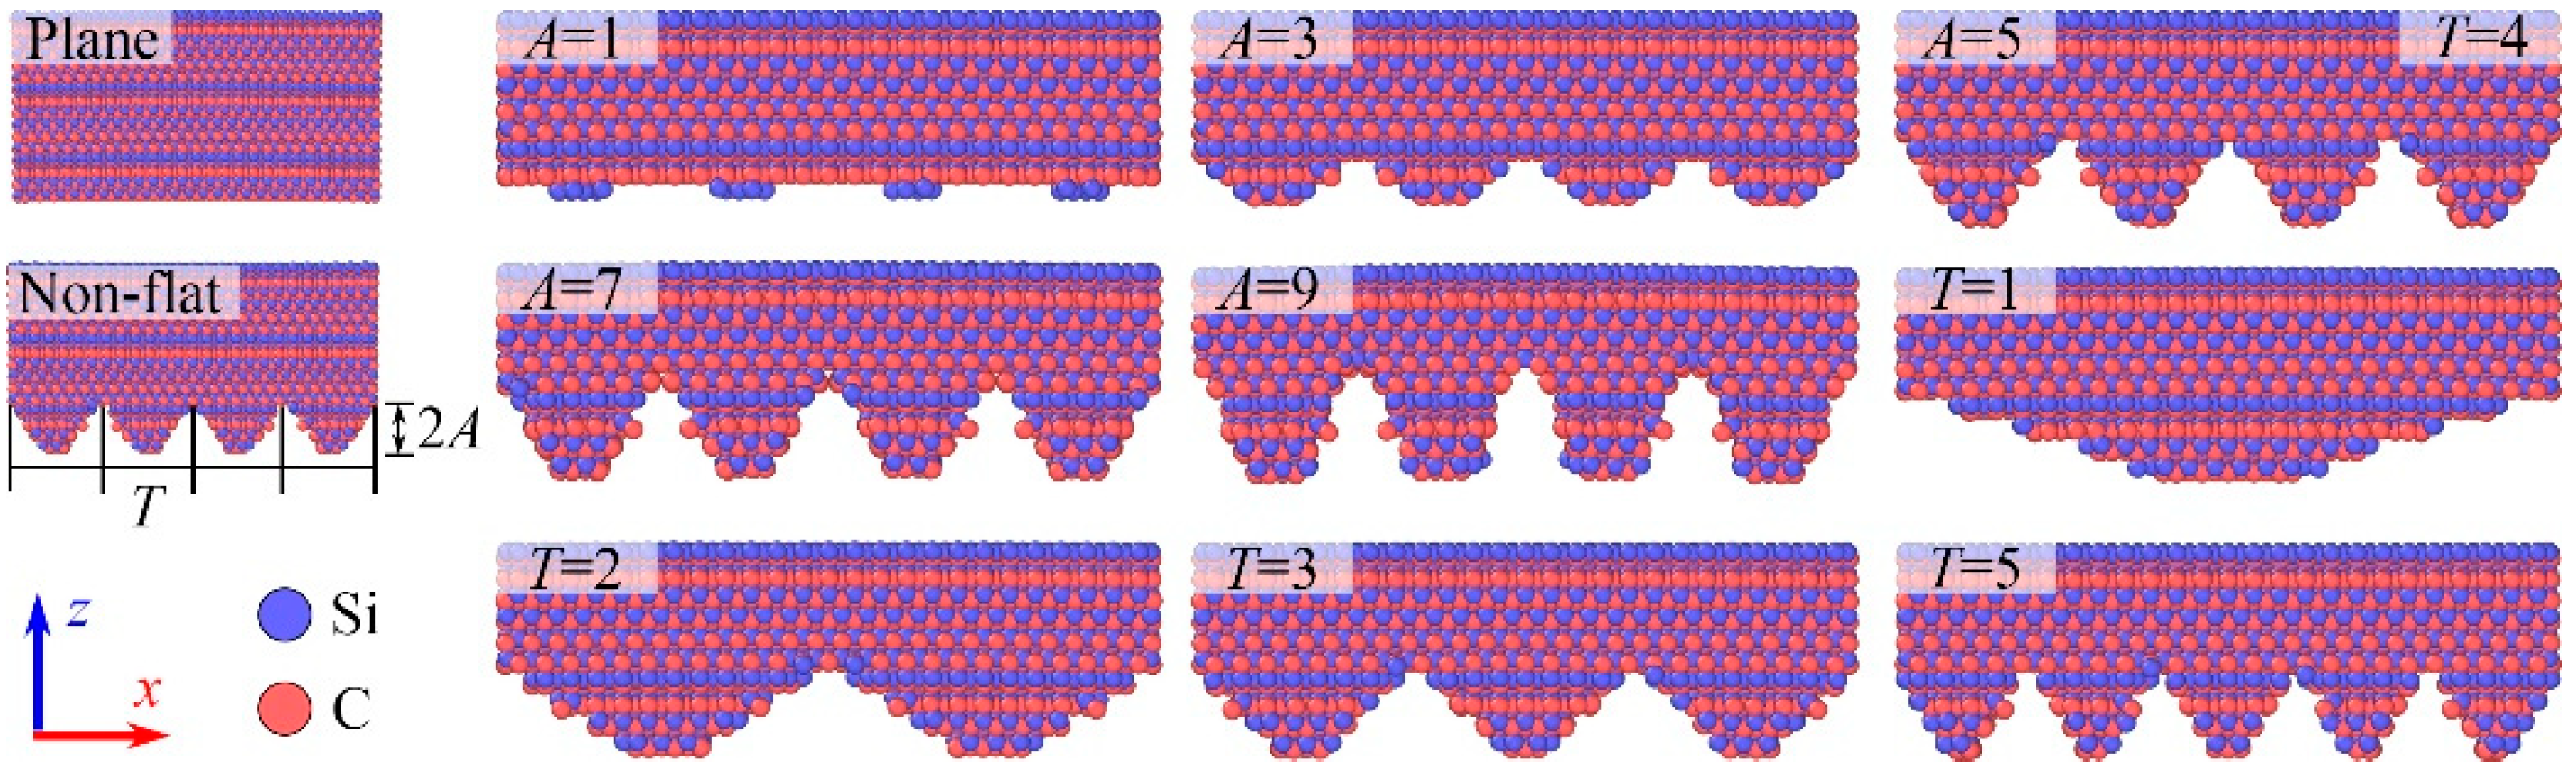
2. Simulation Method

The MD model of 6H-SiC sliding on a Si substrate, implemented using the Large-scale Atomic/Molecular Massively Parallel Simulator (LAMMPS) [24], is shown in Figure 1a. The simulation results were visualized using Ovito Basic v3.5.3 [25]. The Si substrate has a box size of 1000 Å × 120 Å × 40 Å, containing 245,978 atoms. The upper surface of the Si substrate is the (001) crystal plane, with a 10 Å thick boundary layer at the bottom to ensure that the substrate is not moved by the slider during sliding. Adjacent to the boundary layer is a 10 Å thick thermostat layer, using the Langevin equation [26]. Above the thermostat layer is a 20 Å thick Newtonian layer, where atoms follow Newton’s second law [27]. The 6H-SiC slider size is 80 Å × 80 Å × 40 Å, which is the average height of 40 Å. The slider contains approximately 24,000 atoms, with the upper surface being the (0001) crystal plane [28]. The crystal structure of 6H-SiC is shown in Figure 1b. Periodic boundary conditions are applied in the x and y directions, while non-periodic and shrink-wrapped boundary conditions are applied in the z direction. The angular momentum of the 6H-SiC slider is set to 0, so it is only influenced by forces and not by torques to prevent rolling during sliding. Based on mechanical properties research [29,30] considering crystal orientation, the Vickers hardness (HV) of 6H-SiC [10] is more than 2700, while that of single-crystal [31] silicon does not exceed 1400. Consequently, the 6H-SiC slider is treated as a rigid body, focusing solely on surface damage to the Si substrate. A plane slider’s bottom surface is used as a reference, while the bottom surface of the non-flat slider is determined by the following formula:
z > A cos ( π T / 40 ) + 45
where z is the height coordinate of the atomic position. Initially, the minimum height of the slider is 45 Å. A represents the amplitude of the one-dimensional sinusoidal surface, with values of 1, 3, 5, 7, and 9. T is the period of the one-dimensional sinusoidal surface, with values of 1, 2, 3, 4, and 5. Enlarged side view of the non-flat slider bottom is shown in Figure 2.
A virtual atom is connected to the slider by springs in the y and z directions to apply normal force, F. The spring constants in the y and z directions are 0 N/m and 50 N/m, respectively, which are comparable to other simulations [32,33]. By adjusting the equilibrium position of the spring, different magnitudes of F are applied to the A = 5 and T = 4 sliders [34]. Additionally, the interactions between the virtual atom and other atoms are neglected. The Si-C interactions within the slider are described by the Tersoff potential [35]. The Si-C and Si-Si interactions between the slider and the substrate are described by the Lennard-Jones (L-J) potential:
E ( r ) = 4 ε [ ( σ r ) 12 ( σ r ) 6 ] , r < r 0
where σ and ε are the equilibrium distance and cohesive energy, respectively. For Si–Si, ε = 0.402 kcal/mol, and σ = 4.295 Å. For C–C, ε = 0.105 kcal/mol, and σ = 3.851 Å [36]. Geometric average is used for the calculation of σ and ε for Si–C. r is the distance between two atoms. The cut-off radius r0 in this simulation was set as 10 Å to ensure the accuracy and efficiency of computation. Additionally, the contact force between the slider and the substrate is calculated based on the interaction forces between two groups of atoms. The adhesive force is computed via van der Waals interactions between the atomic group of the slider and substrate [37].
The time step for the simulation is set to 1 fs. Initially, the system is equilibrated in a canonical (NVT) ensemble at 300 K for 5 ps to reach a stable state. Subsequently, all atoms are set in a microcanonical (NVE) ensemble. The slider is positioned 5 Å above the substrate. A force field of 10−5 eV·mole/(Å·g), directed along the positive x-axis, is applied to the slider for 80 ps to induce movement. This force field is then removed for 80 ps. Finally, a force field of 10−5 eV·mole/(Å·g), directed along the negative x-axis, is applied for 80 ps. The computational parameters for the MD simulation are shown in Table 1.
In addition, to explore the influence of surface on wear, the von Mises stress is calculated based on the atomic stress tensor in this work [38], as shown in Equation (3):
σ vm ( i ) = 1 2 σ xx ( i ) σ yy ( j ) 2 + σ yy ( i ) σ zz ( j ) 2 + σ xx ( i ) σ zz ( i ) 2 + 6 ( σ xy 2 ( i ) + σ yz 2 ( i ) + σ zx 2 ( i ) ) 1 2
where σvm is the von Mises stress of atom i, and σxx(y,z) is the atomic stress tensor, where σxx, σyy, σzz, σxy, σyz, and σzx are the six stress components for each atom.

3. Result and Discussion

3.1. Analysis of Substrate Surface Wear

Figure 3 shows the temperature of the substrate surface during 120 ps of sliding, with 40 ps having elapsed after the removal of the lateral force field. In this figure, the substrate has a length of 150 Å in the x direction, and the white dashed box indicates the position of the slider at that time. The white arrow indicates where the temperature is highest on the substrate at this time. The temperature analysis methodology adopted in this work is similar to that of previous studies [39]. However, the numerical values of temperature rise during friction and the atomic distribution patterns demonstrate significant discrepancies. Friction and grinding processes exhibit substantial differences. Under the friction of a flat-bottomed slider, the highest atomic temperature of the substrate is 764 K. For sliders with amplitudes A = 1, 3, 5, 7, and 9 Å, the maximum temperatures of the substrate atoms are 988, 1178, 1075, 810, and 839 K, respectively. Except that the highest temperature position is in the middle of the slider when A = 1, the highest temperature position of other amplitude sliders is below the first peak on the lower surface of the slider. For sliders with periods T = 1, 2, 3, 4, and 5, the maximum temperatures of the substrate atoms are 1031, 1039, 942, 1075, and 797 K, respectively. Except for the slider with T = 5, where the temperature increase region of the substrate atoms is beneath the first two peaks of the slider, the temperature increase region for the other four sliders is beneath the first peak. Under F = 40, 70, 100, 130, and 160 nN, the maximum temperatures of the substrate atoms are 874, 948, 1075, 987, and 956 K, respectively. Similarly, the temperature increase region of the substrate atoms is consistently beneath the first peak of the slider. The normal load causes the substrate to deform, and the direction of slide causes the peak in front of the slider to preferentially collide with the substrate, resulting in the current temperature distribution.
Figure 4 shows the von Mises stress distribution of the substrate surface during 120 ps of sliding. In the figure, the substrate has a length of 150 Å in the x direction, and the black dashed box indicates the position of the slider at that time. The black arrow points to the location of the maximum von Mises stress on the substrate. Under all the parameters, the maximum von Mises stress remains below 3 GPa, which does not induce dislocation formation within the substrate. Consequently, dislocation analysis is excluded from this study. For the plane slider, the maximum stress in the substrate is 2.76 GPa, located in the central front part of the slider. Notably, the stress in the area directly below the center of the plane slider is significantly smaller than the stress around it, indicating that the real contact area of two perfectly flat surfaces is also smaller than the nominal contact area at the microscopic scale. For sliders with amplitudes A = 1, 3, 5, 7, and 9 Å, the maximum stresses in the substrate are 2.92, 2.77, 2.84, 2.63, and 2.79 GPa, respectively. For amplitude parameters, higher stresses occur consistently under the slider peaks, though no obvious pattern emerges in maximum von Mises stress values. For sliders with periods T = 1, 2, 3, 4, and 5, the maximum stresses in the substrate are 3.01, 2.75, 2.92, 2.84, and 2.79 GPa, respectively. Similar to sliders with different amplitudes, the maximum stress region is beneath the first peak of the slider’s bottom surface. Additionally, the stress distribution in the substrate for sliders with T = 1 and 2 clearly shows the contact area. Regarding periodicity, increased periods distribute the normal load more evenly, thereby reducing von Mises stress. Wu et al. [40] demonstrated that wear strongly depends on sinusoidal surface topography. Our results align with theirs. Moreover, periodicity exerts a greater influence on stress and wear than amplitude at the atomic scale. Under F = 40, 70, 100, 130, and 160 nN, the maximum stresses in the substrate are 2.52, 2.66, 2.84, 2.92, and 2.98 GPa, respectively, with the maximum stress region beneath the first peak of the slider’s bottom surface. For normal load, von Mises stress exhibits a linear correlation. Temperature contour maps closely align with von Mises stress contour maps. When slider atoms approach excessively close to each other, adjacent substrate atoms experience significant repulsion, deviating from their original lattice positions. Atomic motion induces temperature elevation.
Partial substrate surface atoms undergo phase transformations under moderate von Mises stresses. Figure 5 illustrates the phase changes of substrate atoms during 120 ps of sliding. This figure shows the substrate with a length of 150 Å in the x direction. The atoms in the phase transition are highlighted in red. In monocrystalline silicon, the internal atoms exhibit a cubic diamond structure. To avoid excessive color complexity, atoms with cubic diamond structures were removed to facilitate clearer observation of phase-transition atoms. It is found that the crystal of some surface atoms changes from a cubic diamond (first or second neighbor) to an amorphous structure (other) when the slider moves across them. Regardless of parameters, only surface-layer atoms exhibit amorphization. After the slider passes, some amorphized atoms revert to cubic diamonds (first or second neighbor). The wear occurs due to the deformation of the top layer of silicon atoms, similar to previous findings [41].
The number of phase-changed atoms is quantified, with Figure 6 displaying the number of atoms transformed to other crystal phase and their percentage of the total substrate surface atoms. There are approximately 37,000 substrate atoms in the region with a length of 150 Å in the x direction. For the plane slider, sliding between two planes results in 120 atoms on the substrate surface transforming to other crystal phases, which is 0.3% of the substrate surface atoms. For sliders with amplitudes A = 1, 3, 5, 7, and 9 Å, the numbers of transformed atoms are 407, 411, 341, 384, and 439, respectively, representing 1.1%, 1.1%, 0.9%, 1.0%, and 1.2% of the substrate surface atoms. The number of transformed atoms increases with amplitude for sliders with A = 5, 7, and 9 Å. For sliders with periods T = 1, 2, 3, 4, and 5, the numbers of transformed atoms are 396, 390, 343, 341, and 338, respectively, representing 1.1%, 1.1%, 0.9%, 0.9%, and 0.9% of the substrate surface atoms. The number of transformed atoms for T = 1 and 2 sliders is quite close, slightly higher than for T = 3, 4, and 5. This is due to the distribution of the normal load across the contact area for higher-period sliders. Under F = 40, 70, 100, 130, and 160 nN, the numbers of transformed atoms are 101, 200, 341, 419, and 484, respectively, representing 0.3%, 0.5%, 0.9%, 1.1%, and 1.3% of the substrate surface atoms. The relationship between the normal load and the number of transformed atoms is approximately linear.

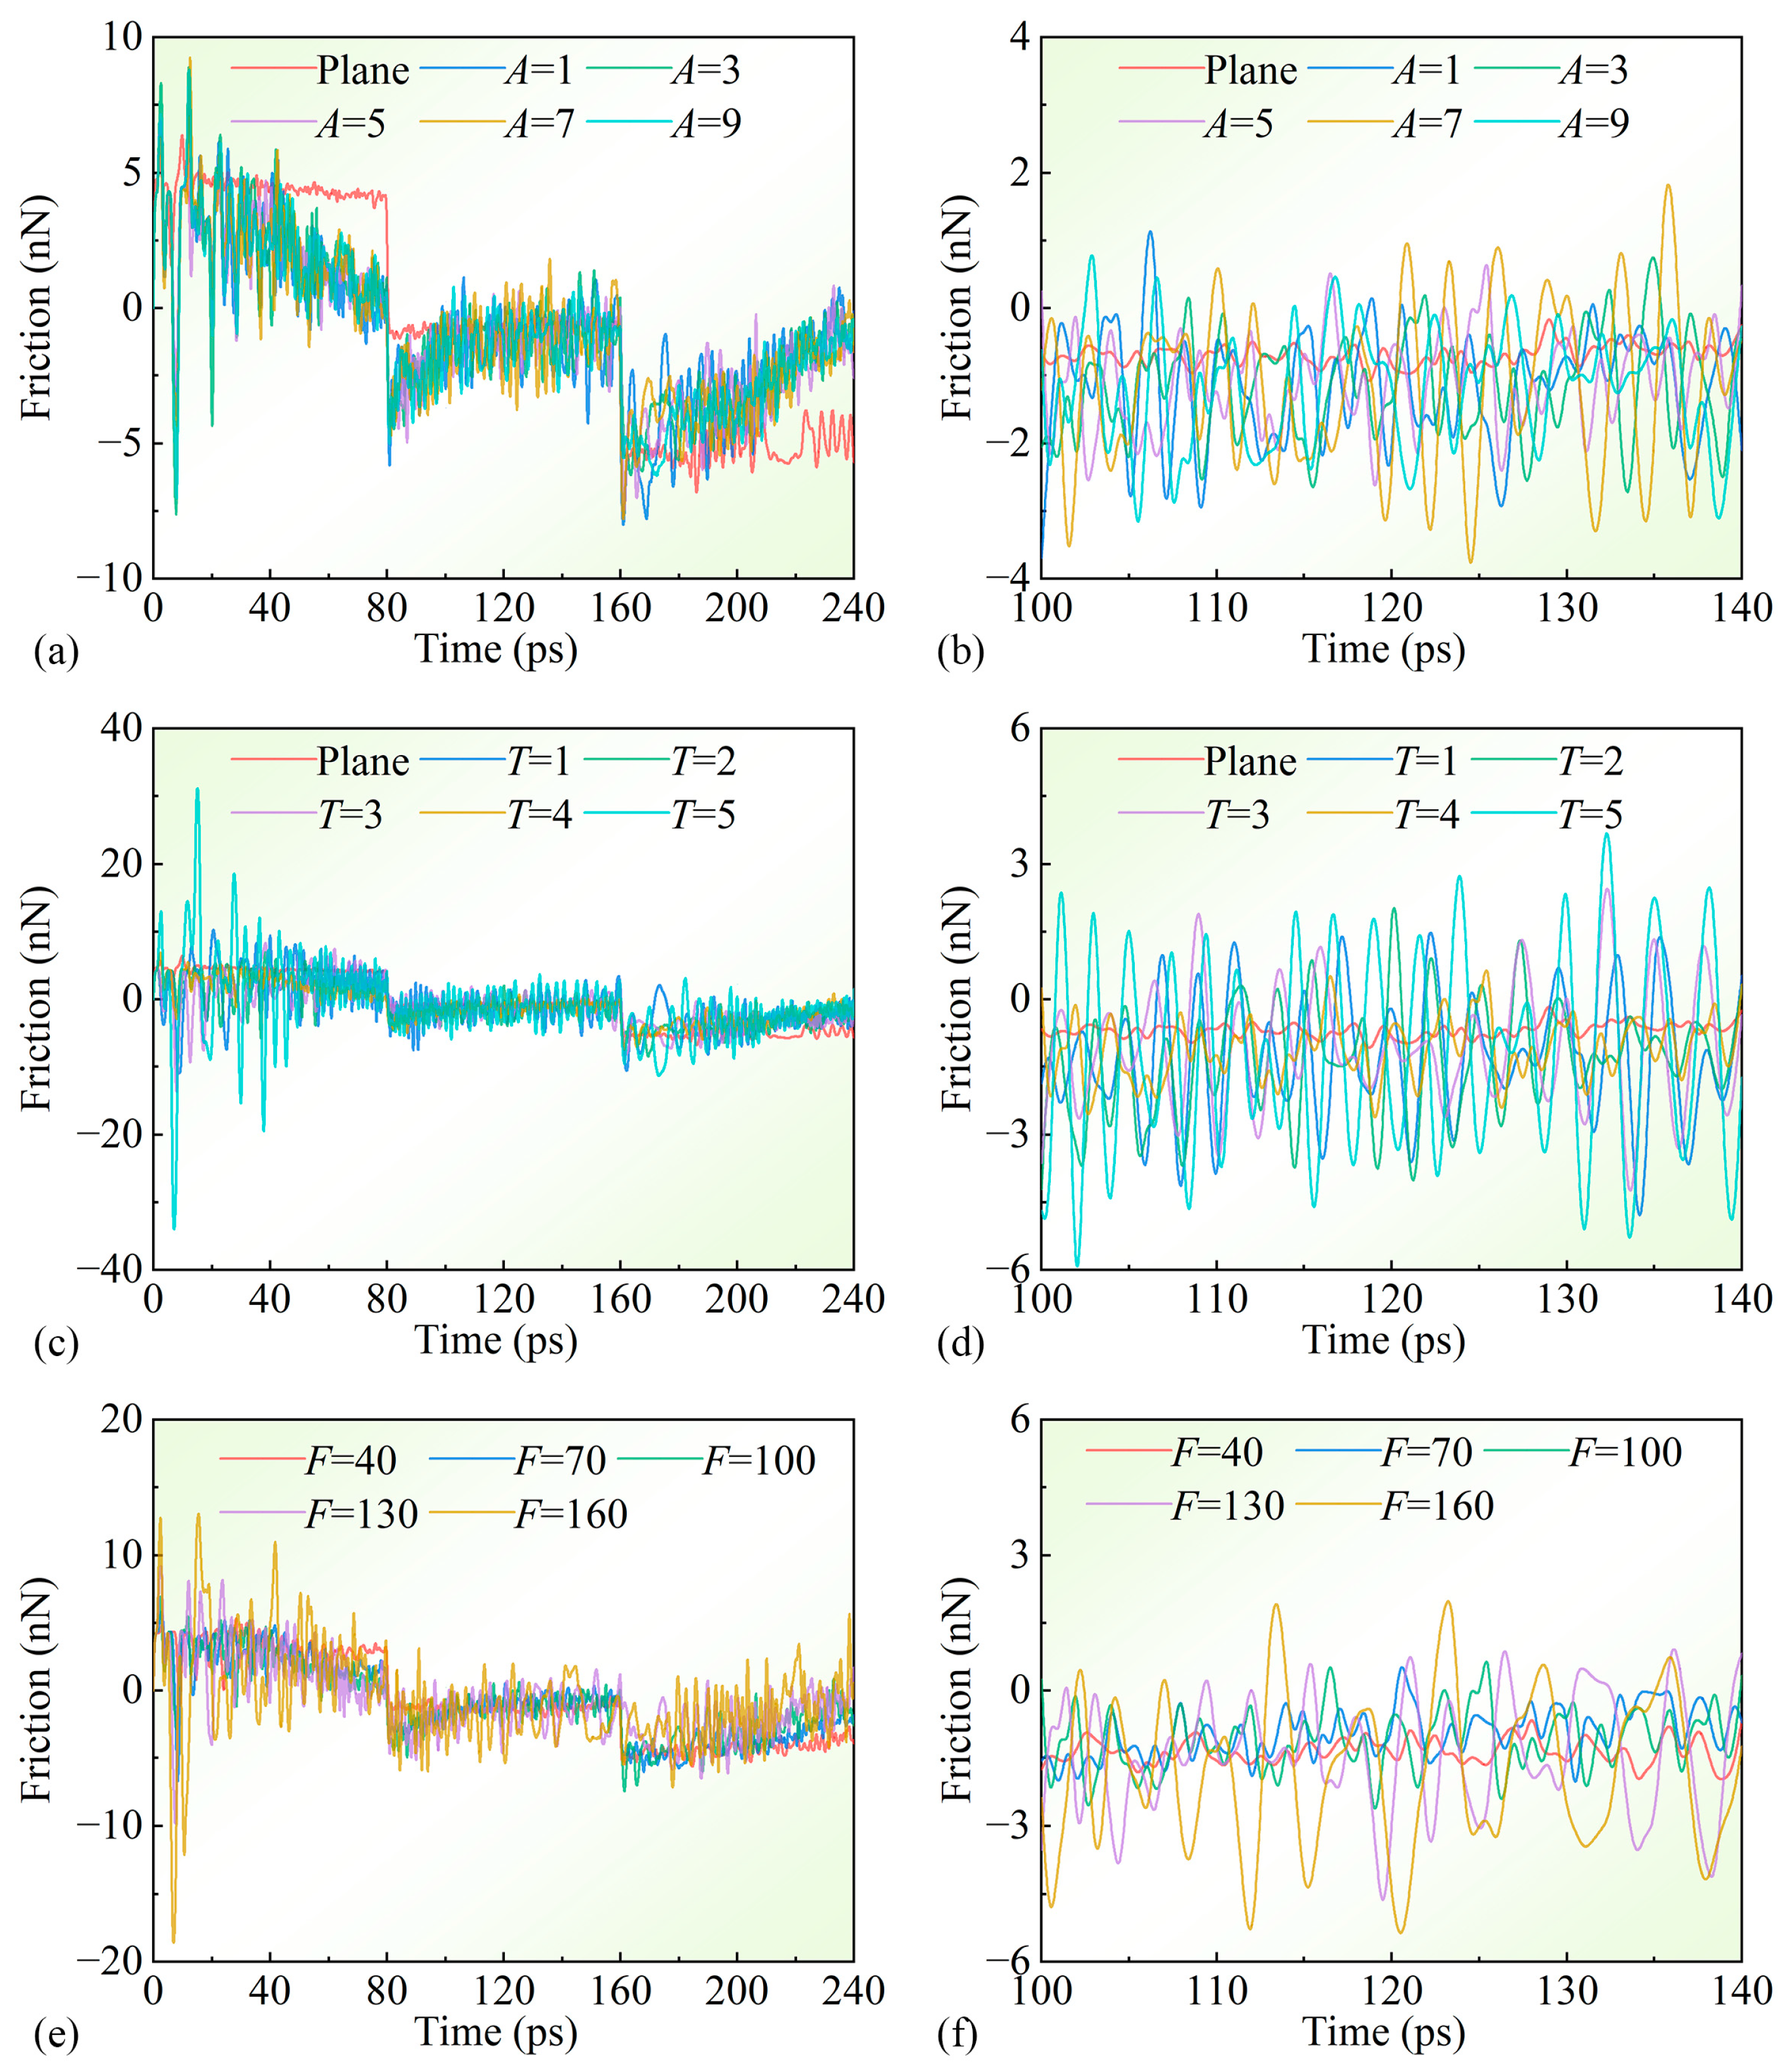
3.2. Analysis of Sliding and Friction

Under the same force field and for the same duration, the sliding distances and velocities of different sliders in the x direction are shown in Figure 7. From Figure 7a,b, it can be seen that the sliding distance and velocity of sliders with different amplitudes do not differ significantly. This is more clearly observed in the speed magnified view from 80 ps to 160 ps, during which there is no horizontal force field applied, and the sliders decelerate solely due to frictional forces. Figure 7c,d reveal differences in sliding distance for sliders with different periods attributed to differences in acceleration during the acceleration phase. The slider with T = 4 accelerates faster than the slider with T = 3, showing a significant speed difference at 80 ps. During the deceleration phase from 80 ps to 240 ps, the speed differences between sliders with different periods become less noticeable. Compared to sliders with different amplitudes and periods, the plane slider covers a significantly greater distance, accelerates faster in the acceleration force field, and decelerates faster in the deceleration force field. From Figure 7e,f, it can be seen that with increasing normal load, both the sliding distance and velocity of the slider decrease. Additionally, it is observed that under F = 40 nN, the acceleration and deceleration are relatively smooth. For low loads, the velocity curve during acceleration and deceleration is nearly linear, indicating that acceleration is almost constant and frictional force is nearly steady. The wear analysis reveals that at F = 40 nN, the slider induces negligible damage to the substrate surface. Under this condition, adhesion-mediated tangential damping dominates, resulting in smooth deceleration. However, under F = 160 nN, the boundaries of the two deceleration phases are difficult to distinguish, and the accelerations and frictional forces during the two time periods are similar. As F increases, permanent deformation accumulates on the substrate surface, leading to collisions between the substrate and the front atoms on the slider’s lower interface. Consequently, plowing effects become progressively significant, and the deceleration process exhibits more pronounced fluctuations.
Figure 8 shows the contact force and adhesive force in the z direction acting on the slider. In the initial phase of sliding, due to a certain gap between the slider and the substrate in the z direction, the slider moves towards the substrate under the normal load applied by the spring and eventually makes contact with the substrate. The slider experiences a combination of spring pressure and substrate support force, causing both normal contact force and normal adhesive force to oscillate until they stabilize. These oscillations occur during the acceleration phase and do not affect the subsequent deceleration of the slider. From Figure 8a,b, it can be seen that after 60 ps, the contact force on the plane slider and sliders with different amplitudes is similar at around 100 nN. The adhesive forces on sliders with different amplitudes are also similar, approximately −54 nN. Figure 8c,d show that after 80 ps, the contact forces on the plane slider and sliders with different amplitudes remain similar at about 100 nN. However, there are differences in adhesive forces among sliders with different amplitudes. Specifically, the adhesive force on the slider with T = 1 is about –48 nN, while that on the slider with T = 5 is about −58 nN. The adhesive forces on the remaining period sliders are close to −53 nN. Compared to sliders with different amplitudes and periods, the plane slider experiences a significantly higher adhesive force of −180 nN. This implies that enhanced surface smoothness promotes a higher atomic registry at contacting interfaces, thereby increasing the number of interacting atom pairs and amplifying adhesive forces. Conversely, textured surfaces effectively suppress adhesion through reduced real contact area, though parametric variations in surface exhibit limited influence on adhesive force modulation within experimentally relevant scales. Figure 8e,f demonstrate a linear relationship between contact force and normal load, consistent with previous findings [42]. Under F = 160 nN, the adhesive force on the slider is approximately −49 nN, and under F = 130 nN, the adhesive force is about −52 nN. These values are slightly lower than the −55 nN observed under other conditions. This suggests that as the normal load increases, the slider moves closer to the substrate, the atoms of the slider and substrate become closer, and the adhesive force increases accordingly.
During sliding, the friction force is the contact force in the x direction experienced by the slider. Figure 9 shows the friction force of the slider and the friction force after removing the horizontal force field. In the initial sliding phase, due to the gap between the slider and the substrate in the z direction, the friction force oscillates significantly. During the period when a reverse horizontal force field is applied, the slider gradually decelerates to zero and begins to accelerate in the opposite direction, passing through the worn area of the substrate. The reasons for friction force changes in this phase are complex and are not analyzed here. In the period after removing the horizontal force field, the friction force is relatively stable, so the focus is on this time segment, with an enlarged view showing the friction force from 100 ps to 140 ps. Figure 9a,b indicate that the friction forces for sliders with different amplitudes are quite similar, with the slider having an amplitude of A = 7 exhibiting the most pronounced fluctuations in friction force. Figure 9c,d show that the slider with T = 5 experiences the most significant fluctuations in friction force. Compared to sliders with different amplitudes and periods, the plane slider exhibits a more stable friction force. This indicates that smoother contact surfaces lead to smaller fluctuations in friction force. Figure 9e,f show that a smaller normal load results in less fluctuation in the friction force experienced by the slider. From the slider velocity in Figure 7b,d,f, it is evident that the slider gradually decelerates between 100 and 140 ps, confirming the presence of friction forces opposing motion. In Figure 9, the raw sampling interval for the friction force is 0.5 ps. The observed fluctuations around zero arise because, during deceleration, the proximity between atomic groups occasionally induces an accelerating force on the slider (friction force > 0). This phenomenon is indeed plausible at ultrafast time scales.
In this paper, the COF is defined as the ratio of the average friction force to the average normal contact force over the same time period. Table 2 summarizes the average friction force and COF corresponding to field-free deceleration in Figure 9, along with their standard deviations. Although increasing the sampling interval reduces volatility and stabilizes friction forces below 0, the standard variance at 0.5 ps is still presented in this table for data authenticity. Notably, the plane slider exhibits significantly lower average friction force and COF compared to all sinusoidal-asperity sliders, which aligns with experimental trends [43]. Under identical normal loads, the amplitude within surface parameters demonstrates negligible influence on friction. However, sliders with lower periods exhibit markedly higher average friction forces and coefficients than those with longer periods. Regardless of amplitude, the contact area between sinusoidal-asperity sliders and the substrate remains comparable. This can be explained by the adhesion–ploughing composite friction theory [44]. Under identical normal loading conditions, the T = 1 slider exhibits a smaller contact area with the substrate, inducing greater substrate stress. Additionally, it experiences significantly higher adhesive forces compared to other non-flat sliders. For the T = 2 slider, the superposition of deformations caused by its two wave peaks intensifies the elastic ploughing effect on the substrate. Substrate dimples substantially enhance sliding resistance. For a given slider, when F increases from 70 nN to 160 nN, the average friction force rises linearly while the COF remains stable. At F = 40 nN, the COF (0.0330) significantly exceeds values under higher loads. This anomaly is attributed to the L-J potential characteristics: at lower loads, the increased atomic separation between the slider and substrate amplifies the dominance of attractive forces, where adhesion-induced tangential damping becomes pronounced. As F increases, the atomic distance decreases, resulting in greater elastic deformation of the substrate, with the primary mechanism shifting to elastic ploughing effects. Wang et al. [45] demonstrated through finite element methods that COFs decrease as the amplitude-to-wavelength ratio increases. Under low normal contact pressure, static COFs exhibit an inverse correlation with contact pressure. Our results align with their observed trends.

4. Conclusions

In this work, the sliding process of 6H-SiC sliders with one-dimensional sine wave surfaces on single-crystal silicon substrates was simulated using MD simulations. The effects of different amplitudes and periods of the slider, as well as different normal loads, on frictional wear and slip were investigated. These findings can assist in optimizing the roughness design of EUV chucks, enabling wafers to achieve reduced slip under high-dynamic motion without significantly increasing deformation. The main conclusions are as follows:
(1)
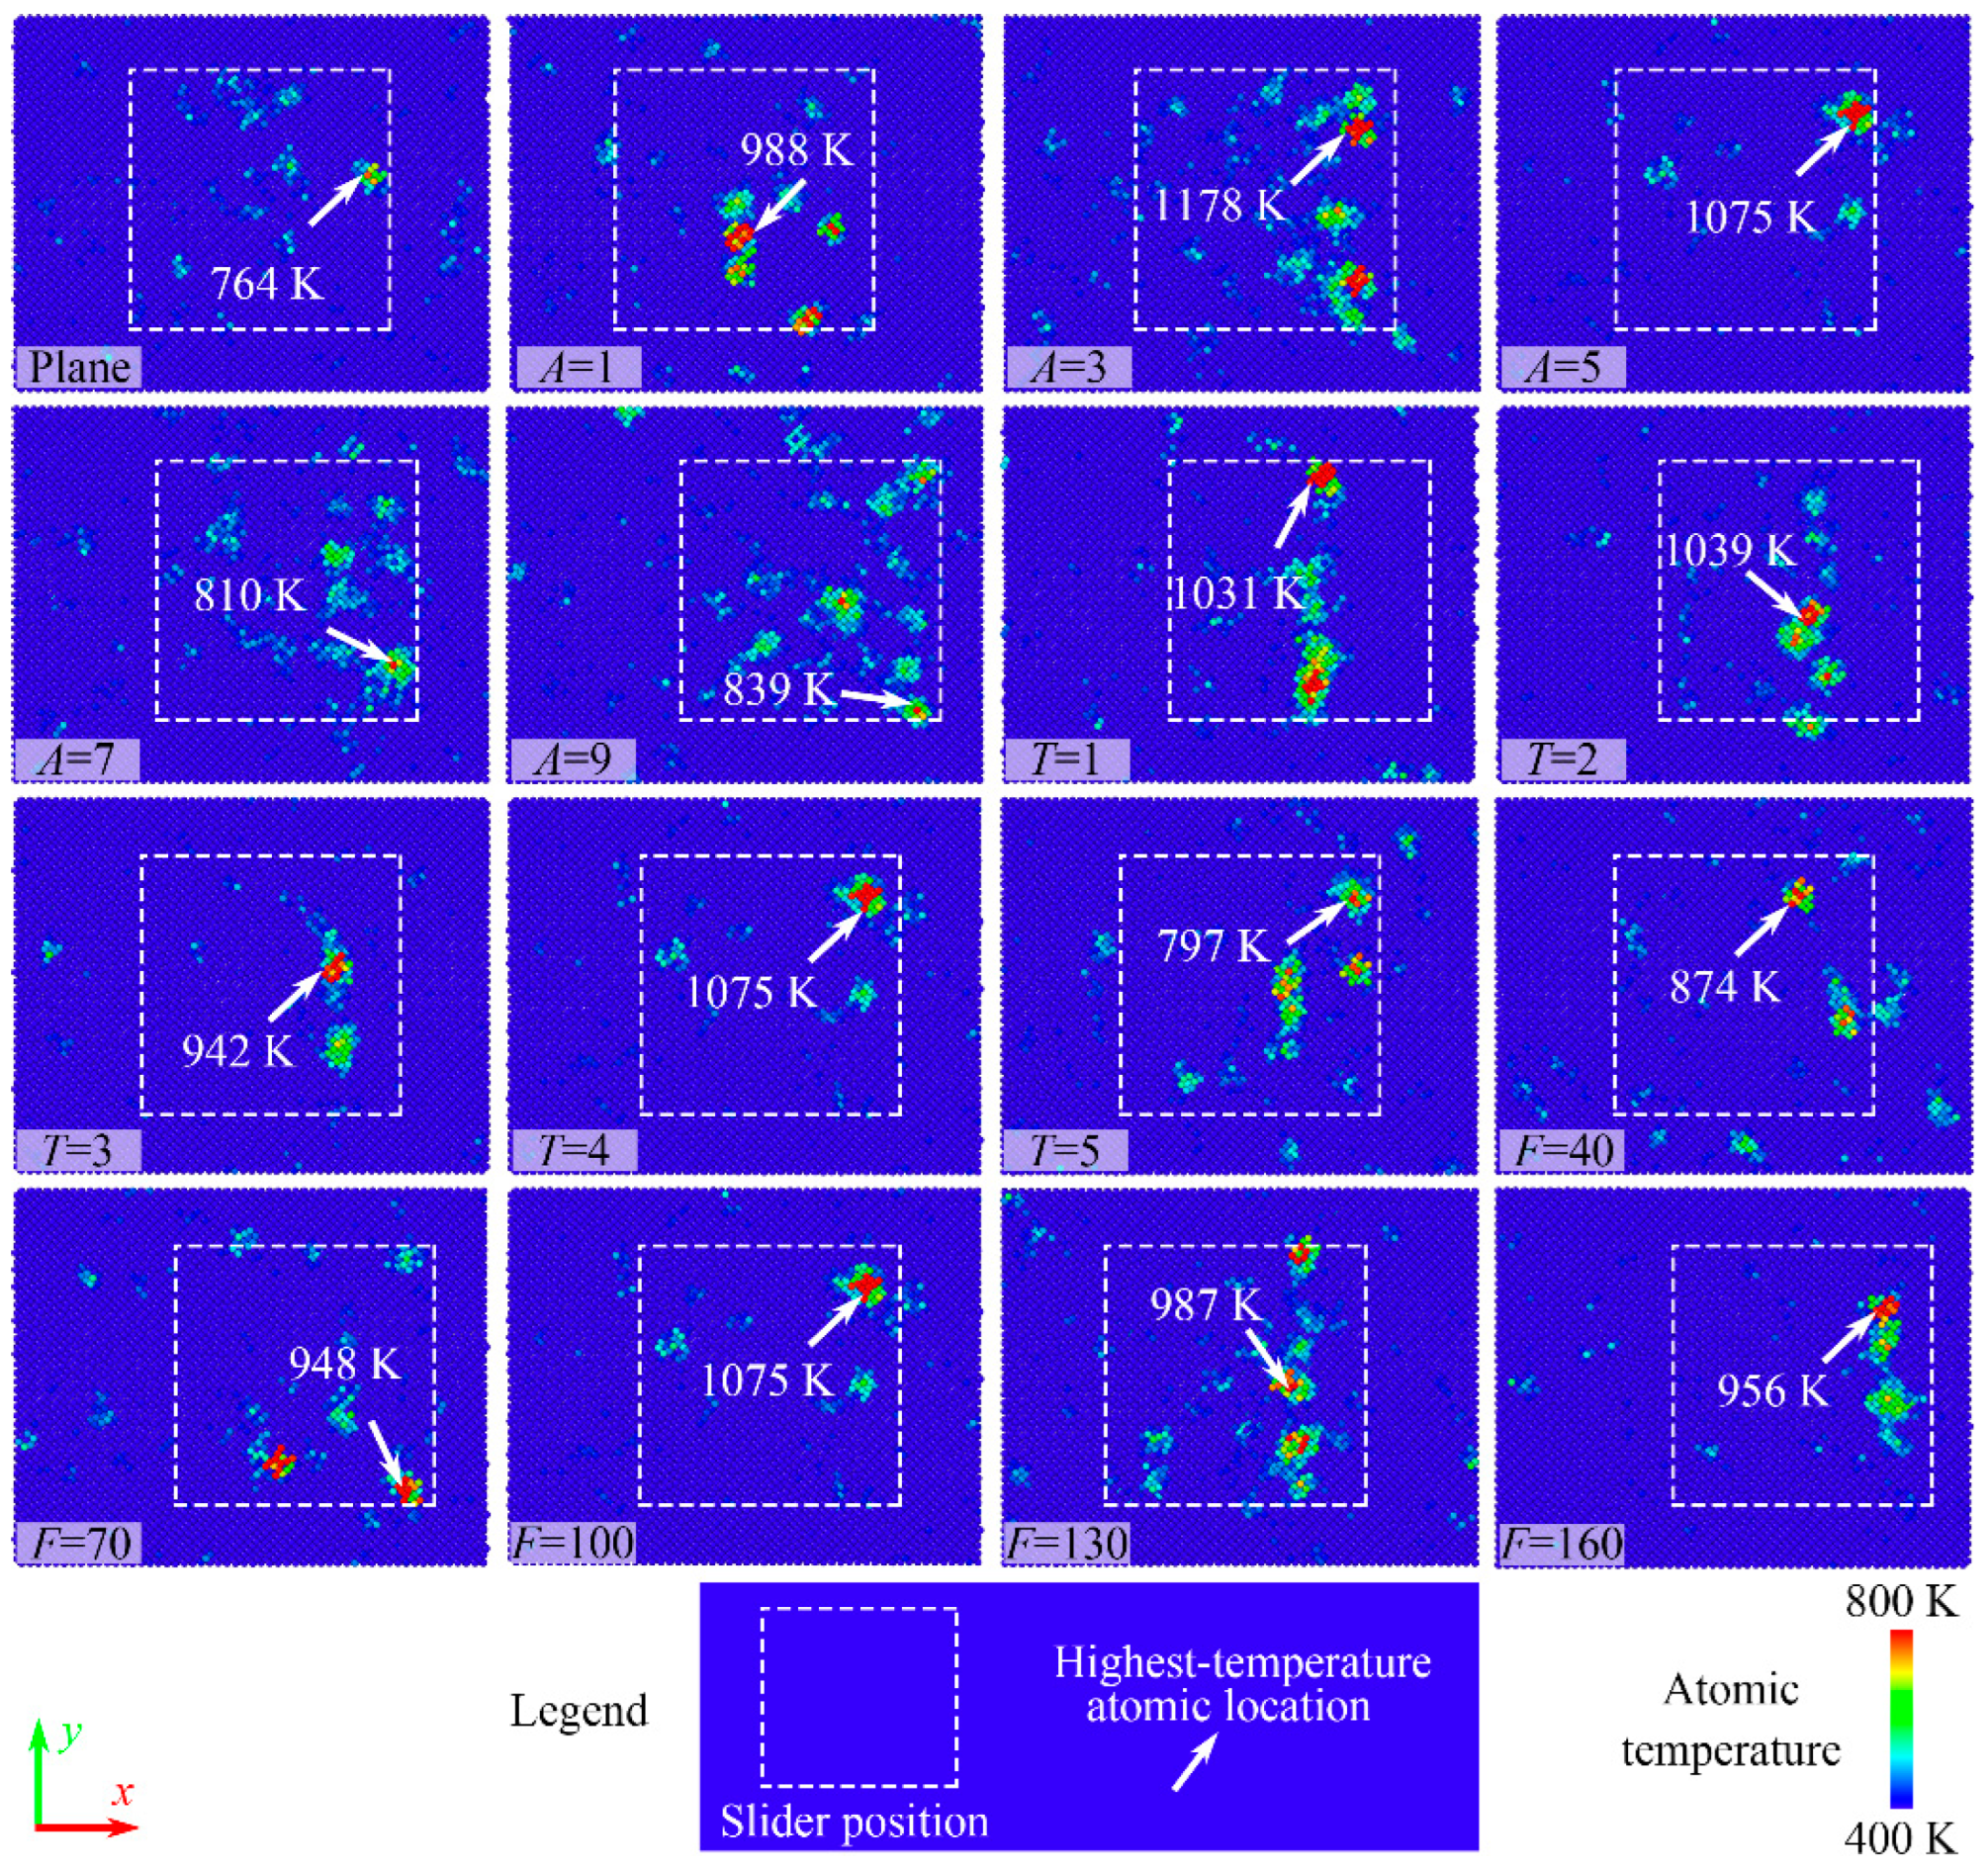
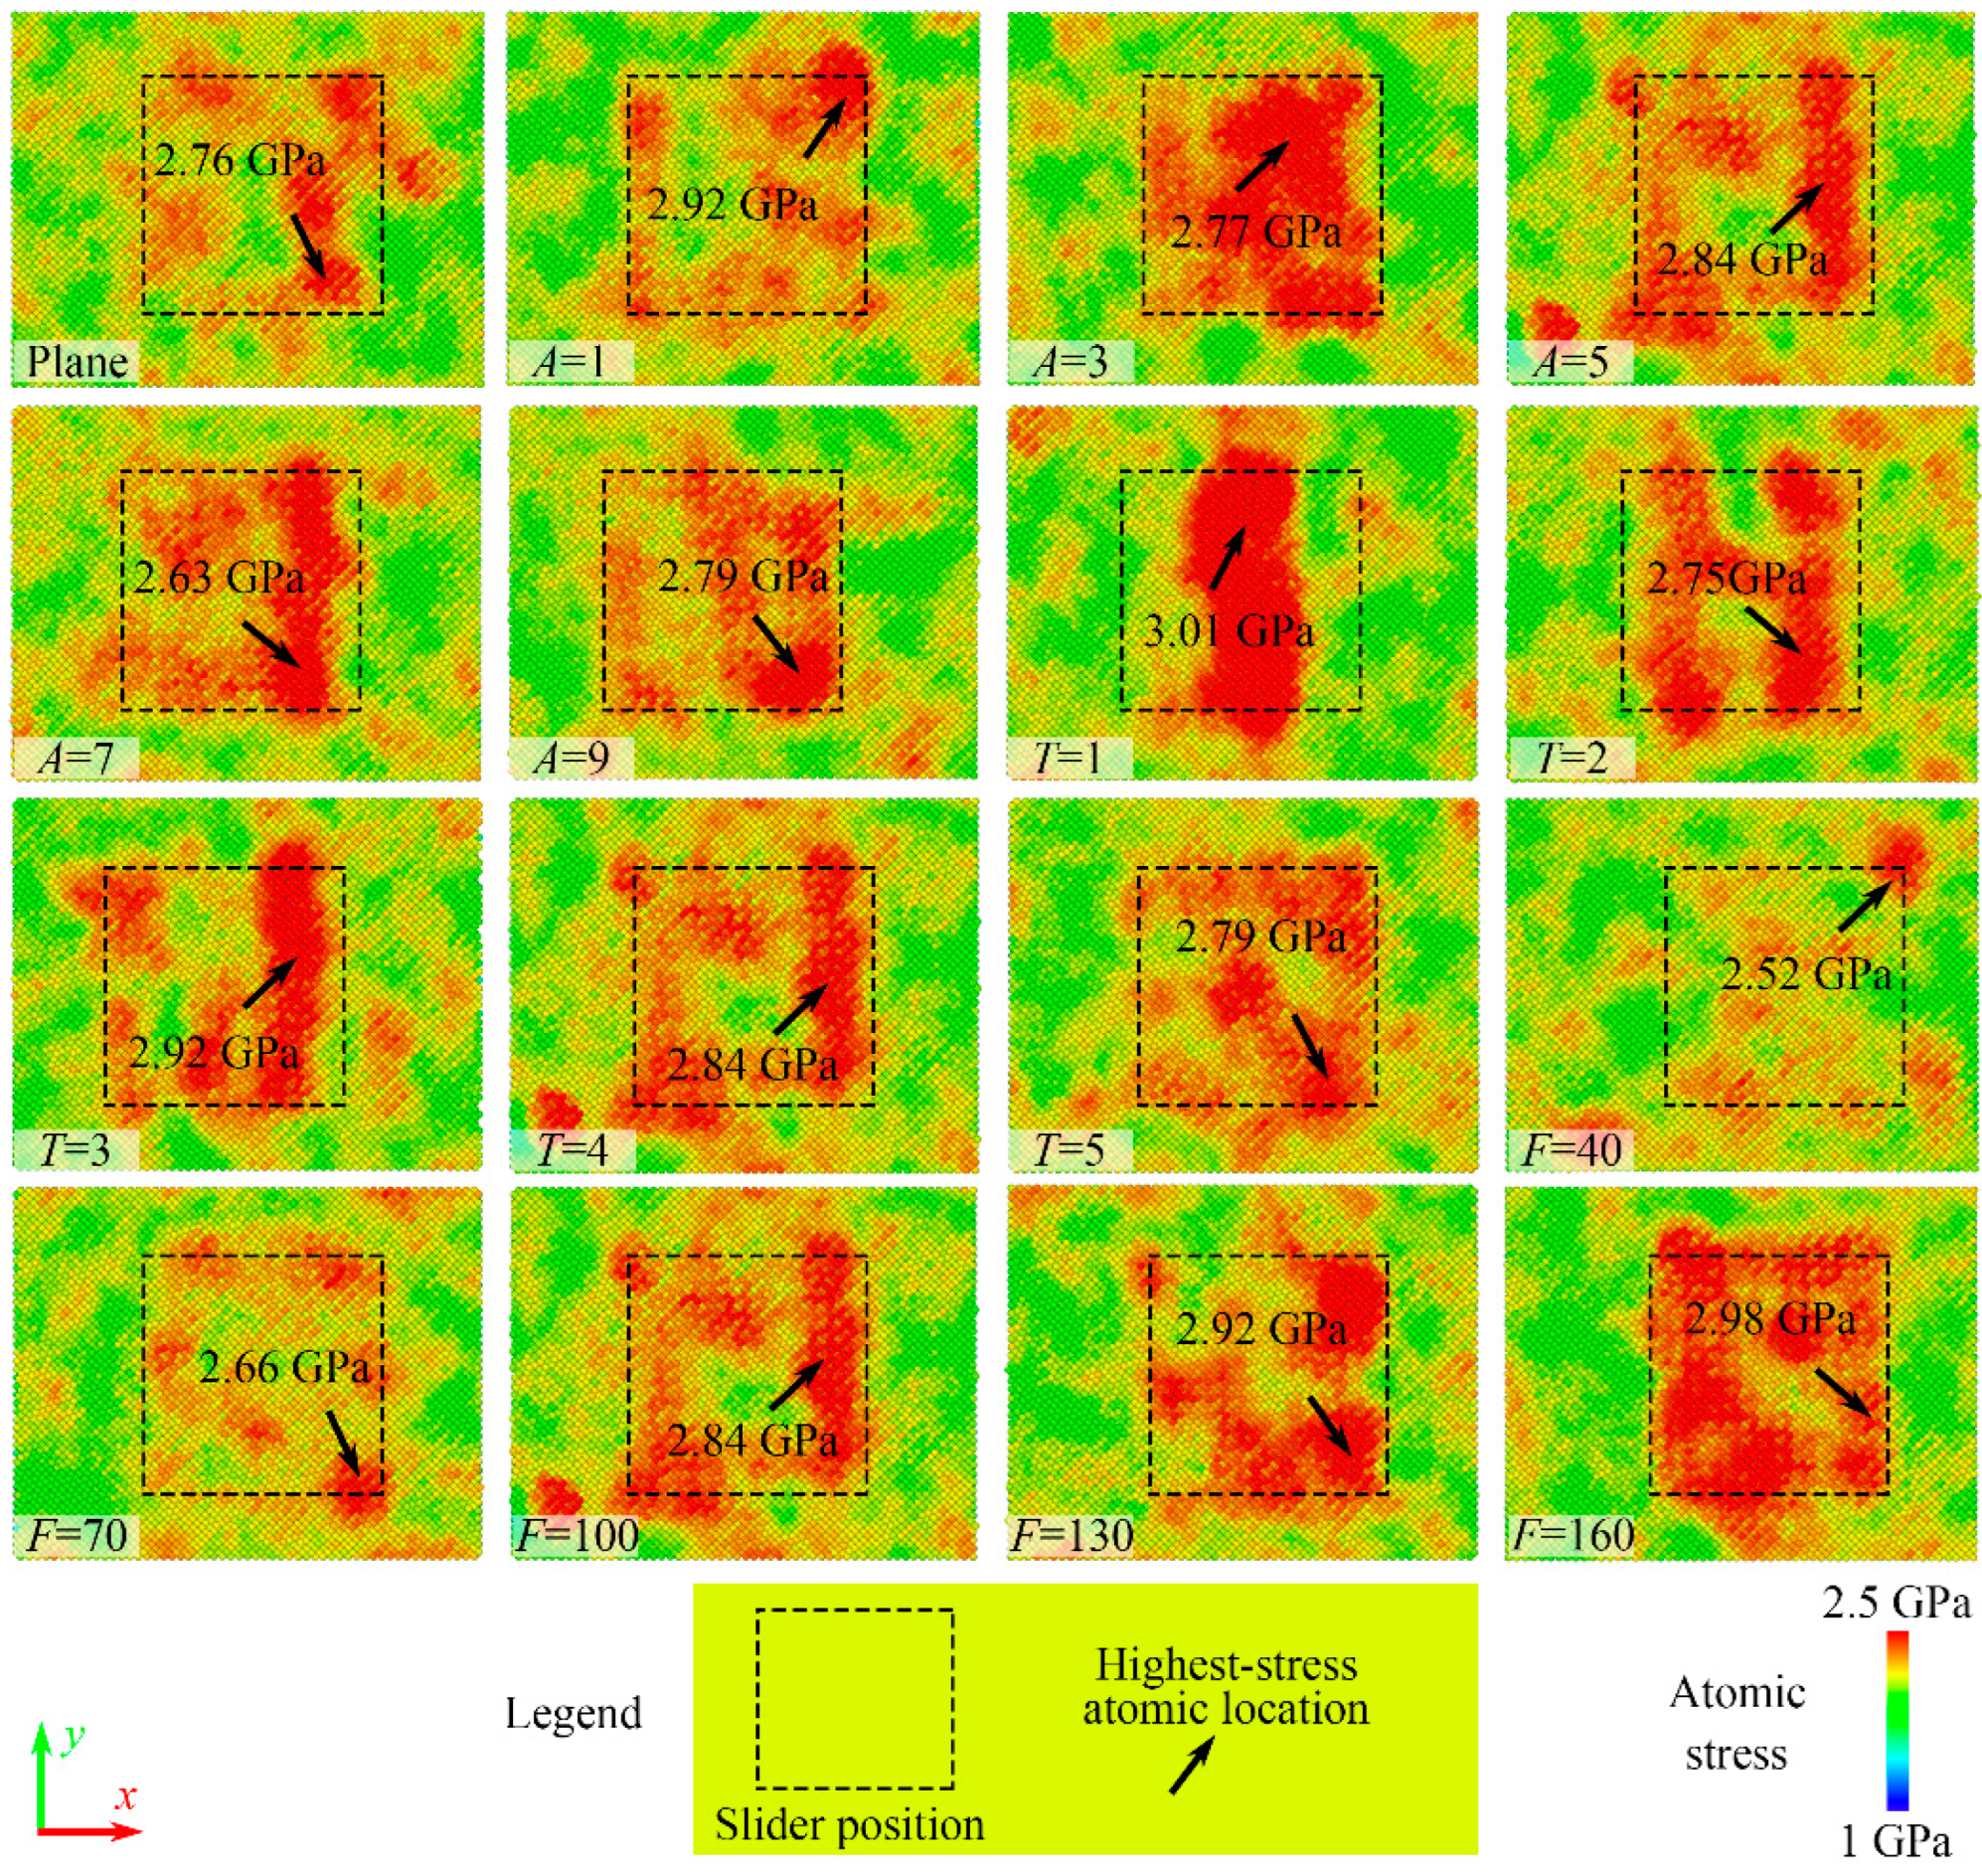
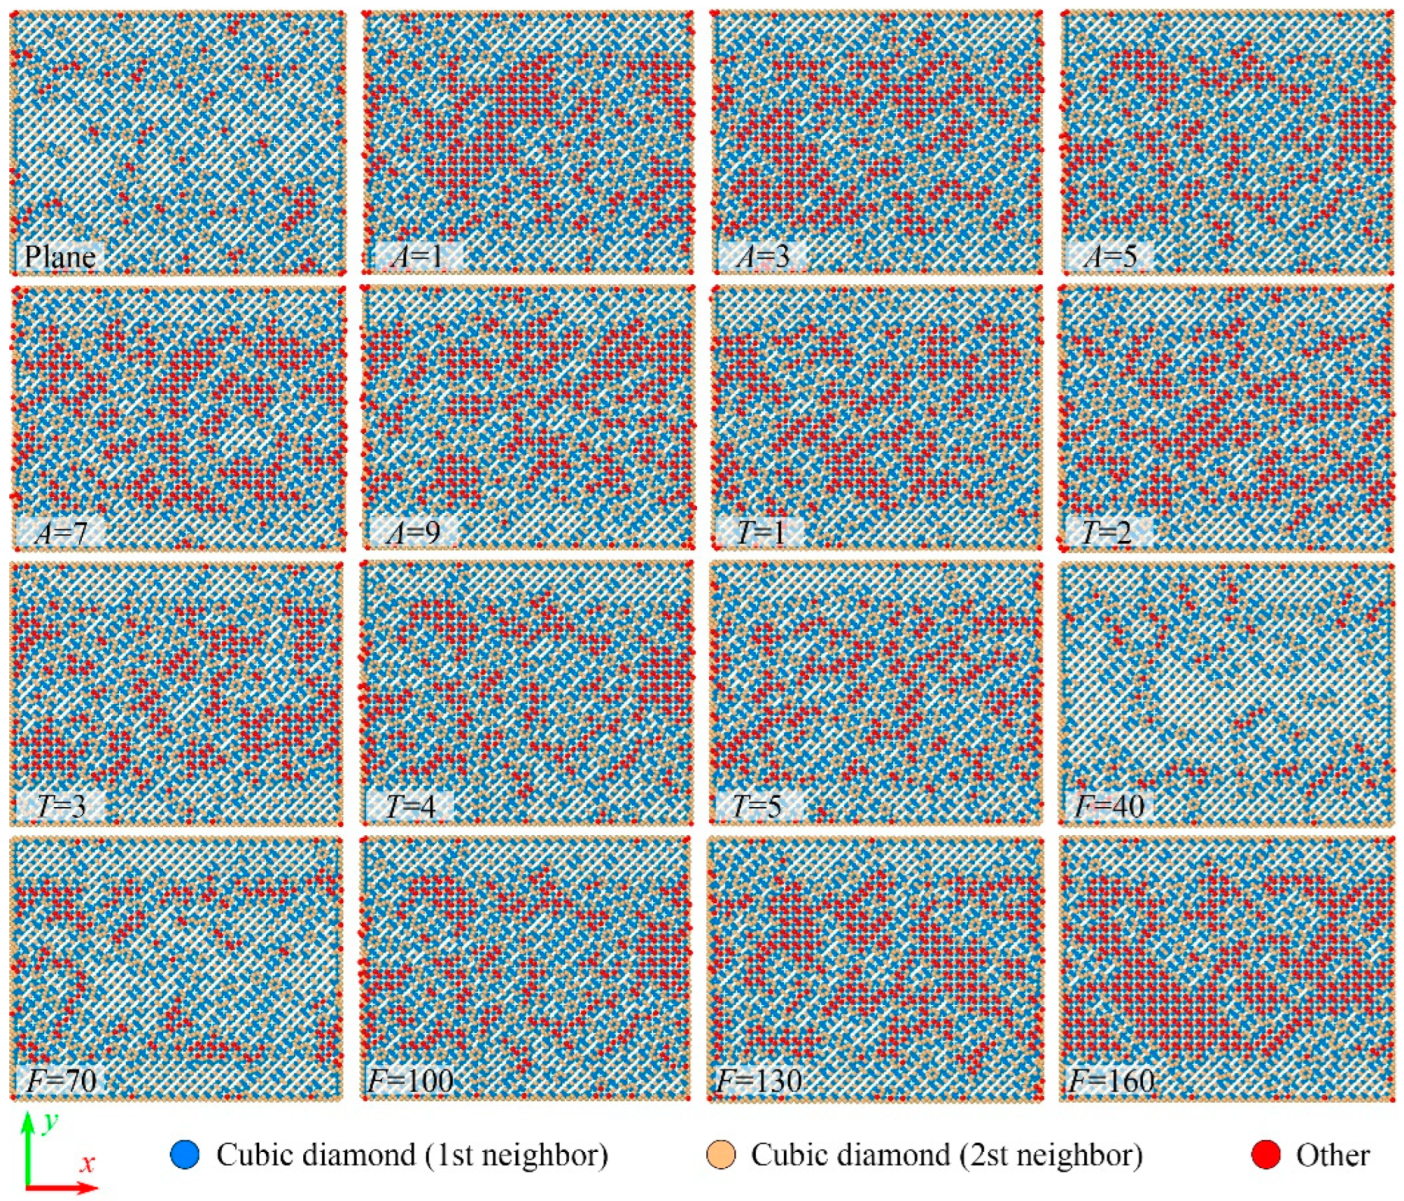
Analysis of temperature and stress distributions reveals that the actual contact area is smaller than the nominal contact area. The centers of plane sliders and some sinusoidal sliders fail to effectively contact the substrate.
(2)
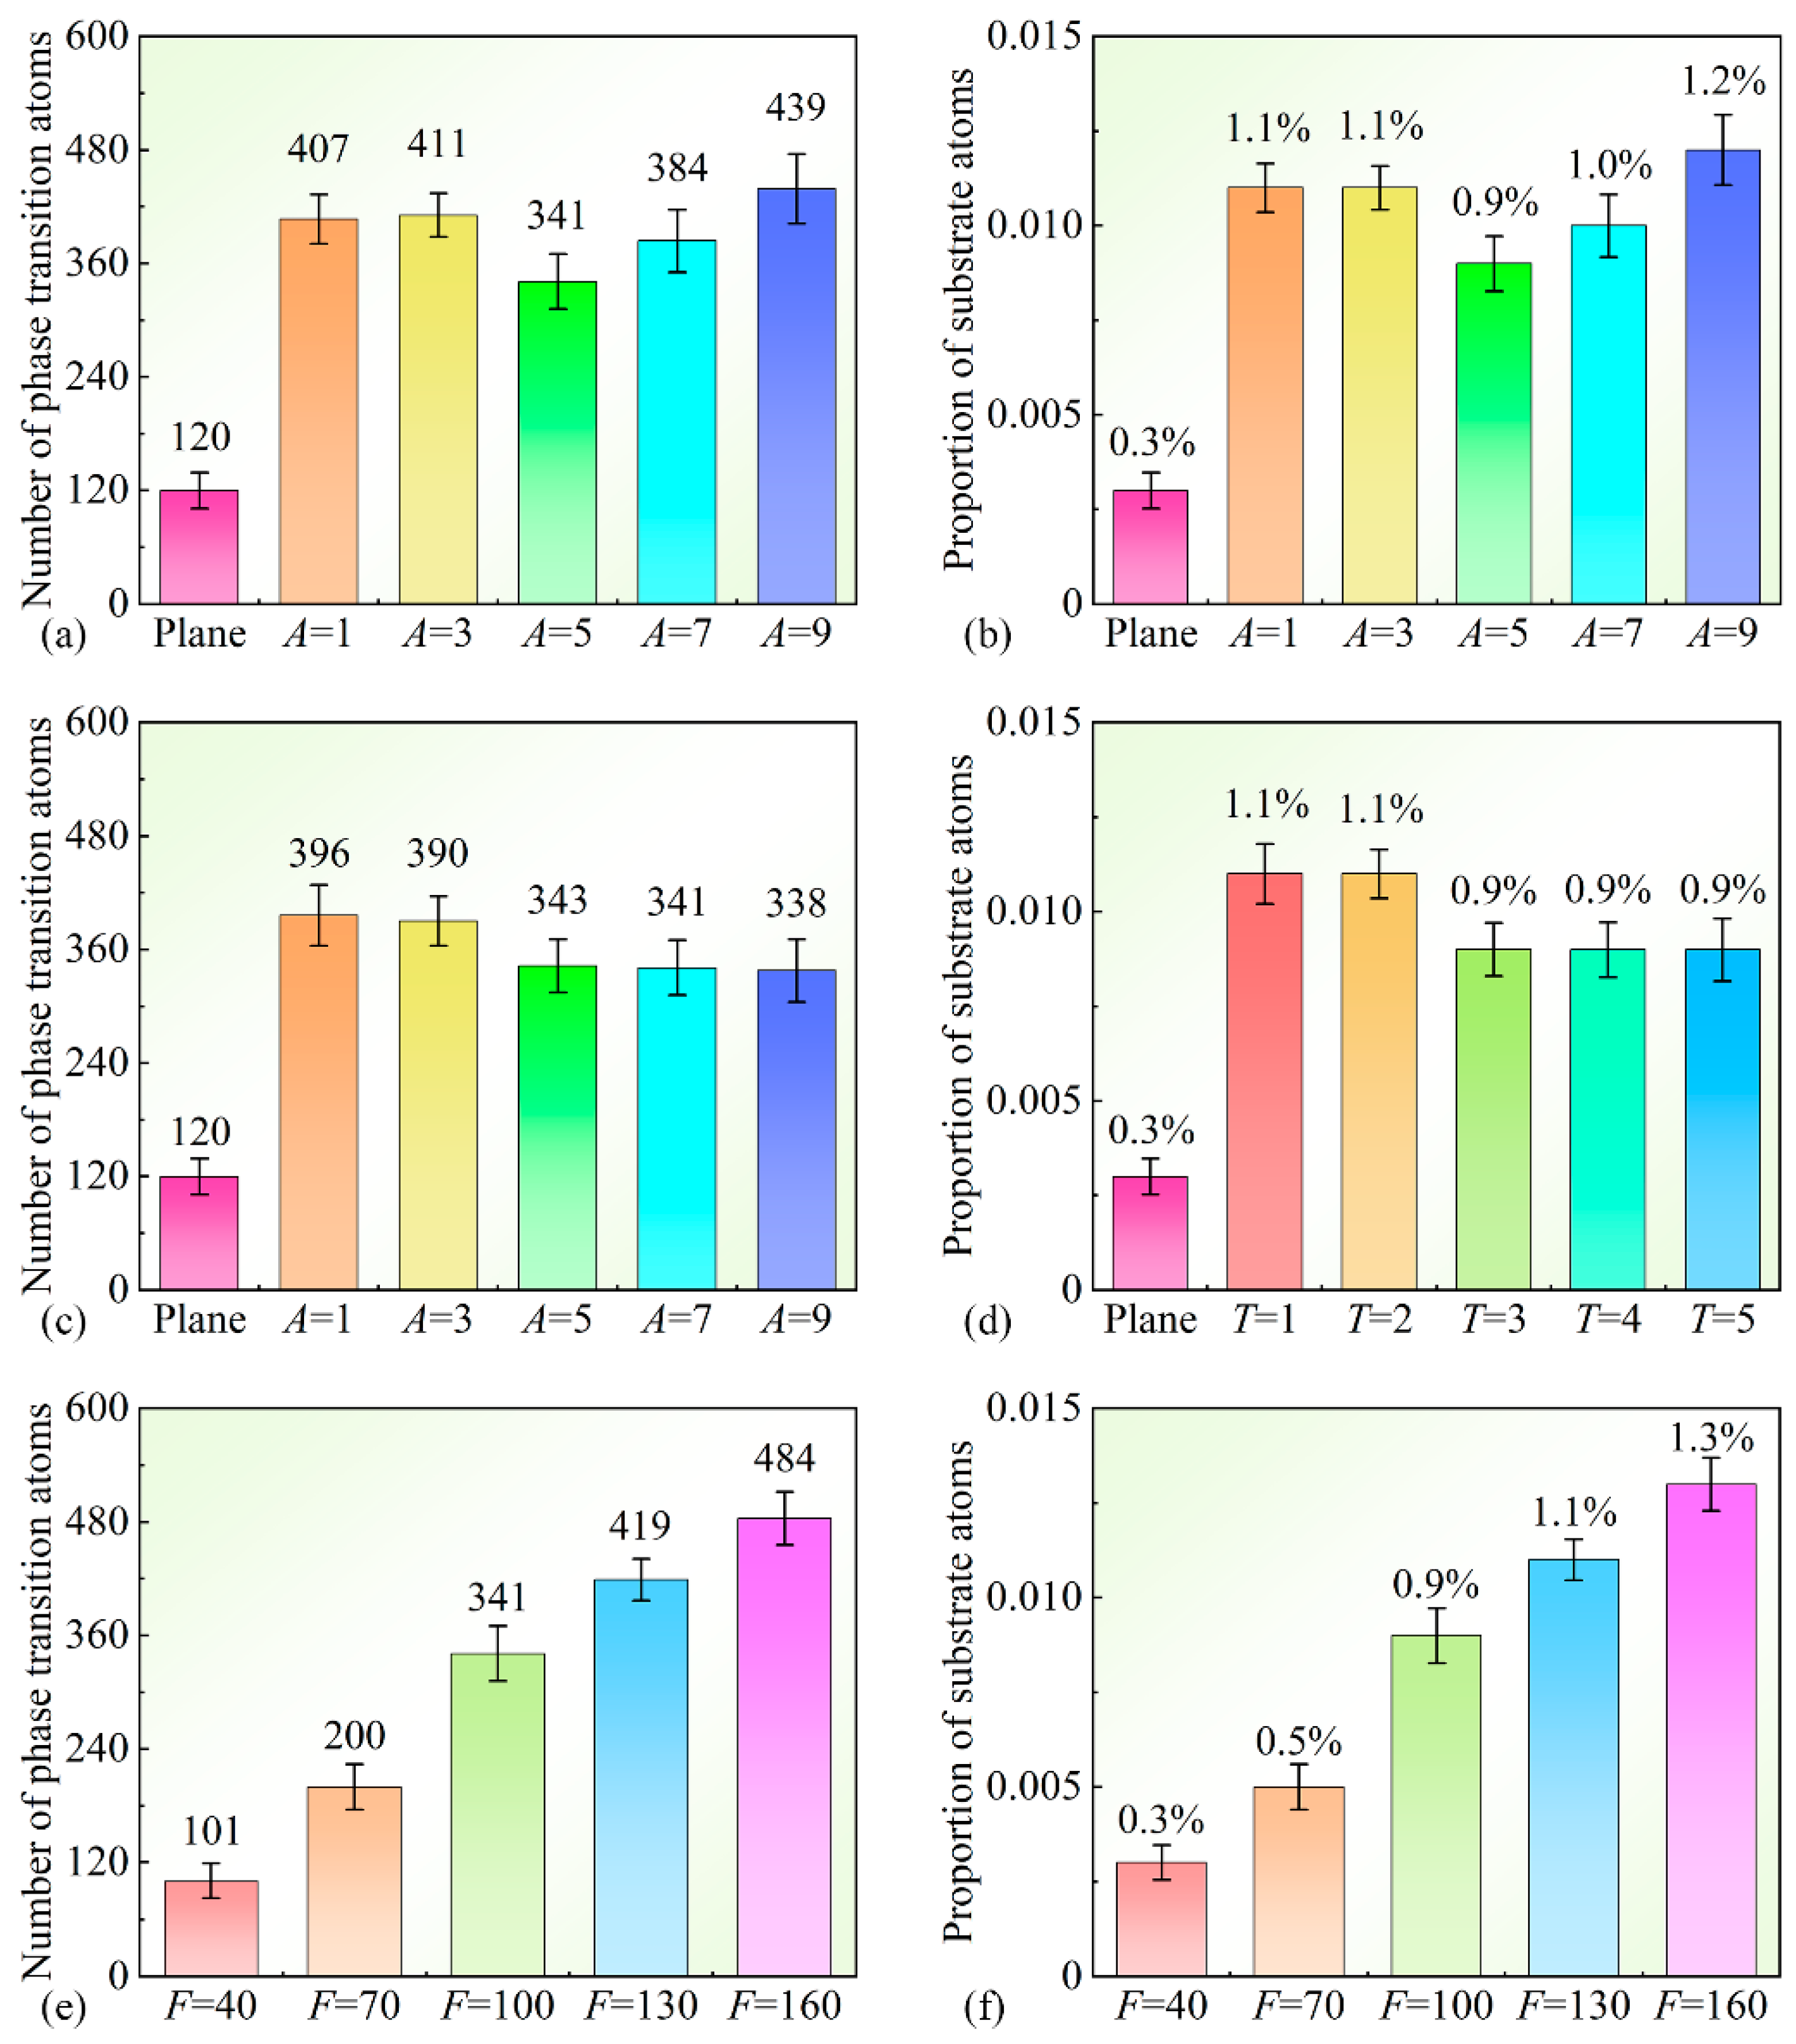
Examination of substrate atomic phase transitions indicates that within the elastic deformation regime, sliders with different amplitudes cause comparable damage levels to the substrate, while lower-period sliders inflict slightly greater damage than longer-period ones. Higher normal loads exacerbate atomic destruction on the substrate surface.
(3)
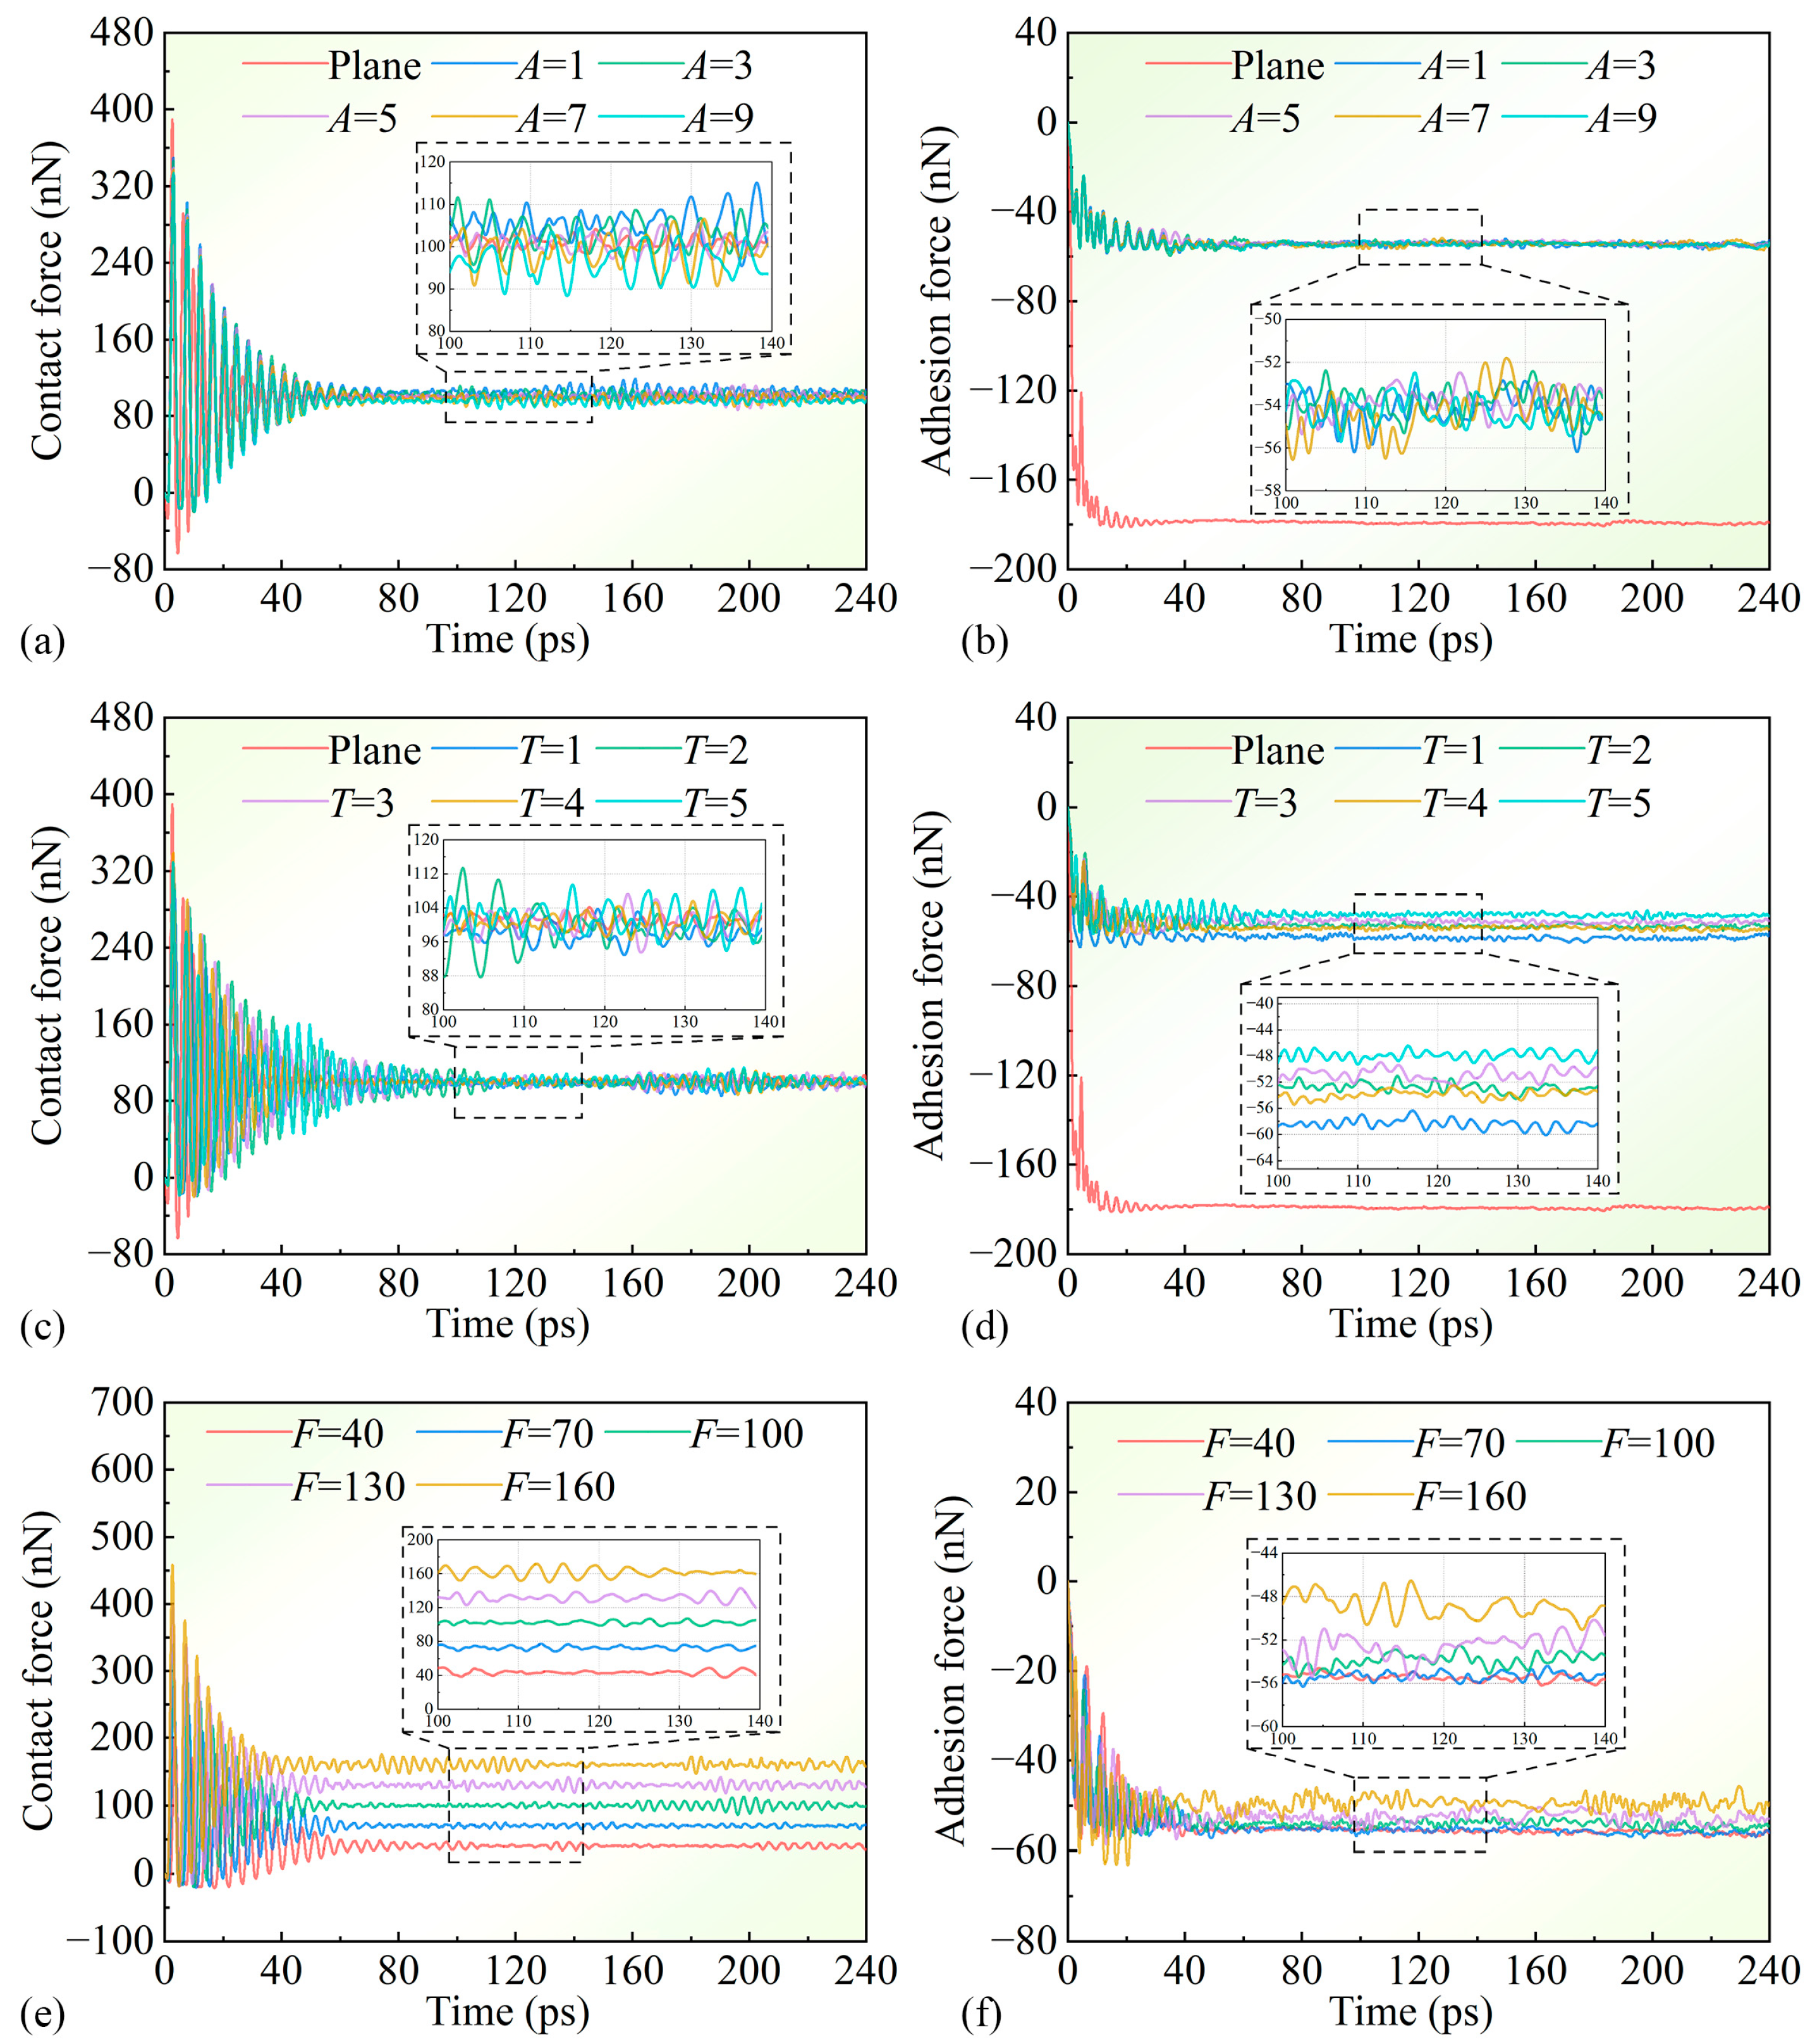
Plane sliders experience adhesive forces exceeding threefold those of sinusoidal sliders, demonstrating that smoother contact surfaces generate stronger adhesion. Amplitude exertion has minimal influence on adhesion. Reducing the period or normal load increases adhesion.
(4)
Under identical normal loads, amplitude variations in surface parameters negligibly affect friction. Lower-period sliders exhibit significantly higher COFs than their longer-period counterparts. At ultra-low normal loads, adhesion-dominated damping surpasses elastic ploughing-induced damping under moderate loads.

Author Contributions

Conceptualization, J.L.; Methodology, J.P.; Software, D.L. and P.Z.; Validation, H.L., P.Z. and B.Z.; Formal analysis, J.P. and D.L.; Investigation, J.P., D.L. and B.Z.; Resources, J.W. and P.Z.; Data curation, J.P., B.Z., J.L. and Q.Y.; Writing—original draft, J.P. and D.L.; Writing—review & editing, J.P., J.W., H.L. and P.Z.; Visualization, J.P., J.L. and Q.Y.; Supervision, J.W., H.L. and P.Z.; Project administration, J.W. and H.L.; Funding acquisition, J.W. All authors have read and agreed to the published version of the manuscript.

Funding

This research was funded by the National Natural Science Foundation of China (5175499).

Data Availability Statement

Data will be made available upon request.

Acknowledgments

The authors express sincere gratitude to all the reviewers who participated in the review.

Conflicts of Interest

The authors declare no conflicts of interest.

References

  1. Shen, H.; Zhang, L.; Wei, Y.; Liu, S. Influence of the vibration of extreme ultraviolet lithographic tool stages on imaging. Opt. Express 2023, 31, 22358–22371. [Google Scholar] [CrossRef] [PubMed]
  2. Sharma, E.; Rathi, R.; Misharwal, J.; Sinhmar, B.; Kumari, S.; Dalal, J.; Kumar, A. Evolution in lithography techniques: Microlithography to nanolithography. Nanomaterials 2022, 12, 2754. [Google Scholar] [CrossRef] [PubMed]
  3. Naaijkens, G.; Rosielle, P.; Steinbuch, M. Mask side wall clamping. Opt. Microlithogr. XXVI 2013, 8683, 736–745. [Google Scholar]
  4. Amin-Shahidi, D.; Trumper, D.L. Design and control of a piezoelectric driven reticle assist device for prevention of reticle slip in lithography systems. Mechatronics 2014, 24, 562–571. [Google Scholar]
  5. Hermans, J.V.; Laidler, D.; Foubert, P.; D’havé, K.; Cheng, S.; Dusa, M.; Hendrickx, E. Progress in EUV Lithography Towards Manufacturing from an Exposure Tool Perspective. Extreme Ultrav. (EUV) Lithogr. III 2012, 8322, 832202. [Google Scholar]
  6. Li, A.S.; Wang, H.Y.; Hu, S.C.; Zhou, Y.; Du, J.G.; Ji, L.Q.; Ming, W.Y. A Systematic Review of Modeling and Simulation for Precision Diamond Wire Sawing of Monocrystalline Silicon. Micromachines 2024, 15, 1041. [Google Scholar] [CrossRef]
  7. Ma, G.L.; Li, S.J.; Liu, F.L.; Zhang, C.; Jia, Z.; Yin, X.C. A Review on Precision Polishing Technology of Single-Crystal SiC. Crystals 2022, 12, 101. [Google Scholar] [CrossRef]
  8. Dong, B.; Yu, C.; Deng, C.J.; Zhu, H.X.; Ding, J.; Tang, H. Research progress in thermal conductivity of SiCceramics. Cailiao Gongcheng 2023, 15, 64–75. [Google Scholar]
  9. Celler, G.K.; Cristoloveanu, S. Frontiers of silicon-on-insulator. J. Appl. Phys. 2003, 93, 4955–4978. [Google Scholar]
  10. Pan, J.; Yan, Q.; Li, W.; Zhang, X. A nanomechanical analysis of deformation characteristics of 6H-SiC using an indenter and abrasives in different fixed methods. Micromachines 2019, 10, 332. [Google Scholar] [CrossRef]
  11. Gnecco, E.; Bennewitz, R.; Gyalog, T.; Meyer, E. Friction experiments on the nanometre scale. J. Phys. Condens. Matter 2001, 13, R619. [Google Scholar] [CrossRef]
  12. Yu, D.; Zhang, H.; Feng, X.; Liao, D.; Wu, N. Molecular dynamics analysis of 6H-SiC subsurface damage by nanofriction. ACS Omega 2022, 7, 18168–18178. [Google Scholar] [CrossRef] [PubMed]
  13. Wu, Z.; Zhang, L.; Yang, S.; Wu, C.; Xu, K.; Zheng, D. Effects of temperature on the deformation of 6H-SiC during nanoscratching. Wear 2023, 523, 204843. [Google Scholar] [CrossRef]
  14. Piroozan, N.; Naserifar, S.; Sahimi, M. Sliding friction between two silicon-carbide surfaces. J. Appl. Phys. 2019, 125, 124301. [Google Scholar] [CrossRef]
  15. Bhushan, B.; Cai, S. Dry and wet contact modeling of multilayered rough solid surfaces. Appl. Mech. Rev. 2008, 61, 050803. [Google Scholar] [CrossRef]
  16. Ghaednia, H.; Wang, X.; Saha, S.; Xu, Y.; Sharma, A.; Jackson, R.L. A review of elastic plastic contact mechanics. Appl. Mech. Rev. 2017, 69, 060804. [Google Scholar] [CrossRef]
  17. Chen, Z.T.; Xiong, W.; Xu, G.; Li, Y.M.; Mei, H.P.; Ding, T.; Xiao, S.F. Study on molecular dynamics of the effect of defects on the friction properties of single-crystal metals. Ferroelectrics 2019, 546, 98–108. [Google Scholar]
  18. Liu, H.; Guo, Y.; Zhao, P.; Li, D.; Sun, S. Anisotropy origins of coefficient of friction and scratch hardness in nano scratching monocrystalline copper. Tribol. Int. 2023, 188, 108808. [Google Scholar] [CrossRef]
  19. Chen, M.Y.; Hong, Z.H.; Fang, T.H.; Kang, S.H.; Kuo, L.M. Atomistic scale simulation of textured surfaces on dry sliding friction. Trans. Can. Soc. Mech. Eng. 2013, 37, 927936. [Google Scholar] [CrossRef]
  20. He, X.; Bai, Q.; Shen, R.; Zhang, F.; Guo, Y. The evolution of configuration and final state of graphene on rough iron surface. Appl. Surf. Sci. 2020, 530, 147084. [Google Scholar] [CrossRef]
  21. Papanikolaou, M.; Salonitis, K. Fractal roughness effects on nanoscale grinding. Appl. Surf. Sci. 2019, 467, 309–319. [Google Scholar] [CrossRef]
  22. Huang, J.X.; Sun, C.; Chen, J.B. Modeling and characterization of contact behavior of asperities with irregular shapes. Theor. Appl. Mech. Lett. 2025, 15, 100535. [Google Scholar] [CrossRef]
  23. Moshkovich, A.; Lapsker, I.; Rapoport, L.S. The effect of plastic deformation on the flattening of friction surfaces. Lubricants 2024, 12, 276. [Google Scholar] [CrossRef]
  24. Plimpton, S. Fast parallel algorithms for short-range molecular dynamics. J. Comput. Phys. 1995, 117, 1–19. [Google Scholar] [CrossRef]
  25. Stukowski, A. Visualization and analysis of atomistic simulation data with Ovito the open visualization tool. Modell. Simul. Mater. Sci. Eng. 2009, 18, 015012. [Google Scholar] [CrossRef]
  26. Bussi, G.; Donadio, D.; Parrinello, M. Canonical sampling through velocity rescaling. J. Chem. Phys. 2007, 126, 014101. [Google Scholar] [CrossRef]
  27. Spreiter, Q.; Walter, M. Classical molecular dynamics simulation with the velocity verlet algorithm at strong external magnetic fields. J. Comput. Phys. 1999, 152, 102–119. [Google Scholar] [CrossRef]
  28. Fu, C.H.; Lu, H.L.; Sun, S.R. Density functional theory study for adsorption of Oxygen and water molecules on 6H-SiC (0001) surface. Chin. J. Chem. Phys. 2019, 32, 451–456. [Google Scholar] [CrossRef]
  29. Prasad, K.E.; Ramesh, K. Hardness and mechanical anisotropy of hexagonal SiC single-crystal polytypes. J. Alloys Compd. 2019, 770, 158–165. [Google Scholar] [CrossRef]
  30. Zhou, L.; Yao, Y.X.; Liu, Q. Experimental research on the influence of indenter tip radius to indentation hardness. Appl. Mech. Mater. 2008, 10, 327–330. [Google Scholar] [CrossRef]
  31. Goel, S.; Faisal, N.H.; Luo, X.C.; Yan, J.W.; Agrawal, A. Nanoindentation of polysilicon and single crystal silicon molecular dynamics simulation and experimental validation. J. Phys. D Appl. Phys. 2014, 47, 275304. [Google Scholar]
  32. Qi, Y.; Liu, J.; Zhang, J.; Dong, Y.; Li, Q. Wear resistance limited by step edge failure: The rise and fall of graphene as an atomically thin lubricating material. ACS Appl. Mater. Interfaces 2017, 9, 1099–1106. [Google Scholar] [PubMed]
  33. Li, S.; Li, Q.; Carpick, R.W.; Gumbsch, P.; Liu, X.Z.; Ding, X.; Sun, J.; Li, J. The evolving quality of frictional contact with graphene. Nature 2016, 539, 541–545. [Google Scholar]
  34. Kristiansen, K.; Banquy, X.; Zeng, H.; Charrault, E.; Giasson, S.; Israelachvili, J. Measurements of anisotropic (off-axis) friction-induced motion. Adv. Mater. 2012, 38, 5236–5241. [Google Scholar] [CrossRef] [PubMed]
  35. Kawamura, T.; Hori, D.; Kangawa, Y.; Kakimoto, K.; Yoshimura, M.; Mori, Y. Thermal conductivity of SiC calculated by molecular dynamics. Jpn. J. Appl. Phys. 2008, 47, 8898. [Google Scholar]
  36. Rappe, A.K.; Casewit, C.J.; Colwell, K.S.; Goddard, W., III; Skiff, W.M. UFF, a Full Periodic Table Force Field for Molecular Mechanics and Molecular Dynamics Simulations. J. Am. Chem. Soc. 1992, 114, 10024–10035. [Google Scholar]
  37. Cao, A.; Shen, B.; Lin, Q.; Chen, S.; Huang, Z.; Ji, Z.; Zhang, Z. Influence of Stone-Wales defect on graphene friction: Pinning effect and wrinkle modification. Comput. Mater. Sci. 2020, 173, 109423. [Google Scholar]
  38. Liu, Y.; Ji, Y.; Dong, L.; Xie, H.; Song, J.; Li, J. Effect of grinding depths on SiC nanogrinding behavior based on molecular dynamics. Appl. Phys. A-Mater. Sci. Process 2022, 128, 34. [Google Scholar]
  39. Zhao, P.Y.; Zhao, B.; Pan, J.S.; Wu, J.W. Nano-grinding process of single-crystal silicon using molecular dynamics simulation: Nano-grinding parameters effect. Mat. Sci. Semicon Proc. 2022, 143, 106351. [Google Scholar]
  40. Wu, X.H.; Zhang, F.L.; Xia, H.X.; Zhang, L.; Liu, J.H.; Zhang, X.R.; Ao, X.H.; Luo, J.C. Effects of asperity shapes and normal loads on adhesive wear mechanisms. Tribol. Lett. 2025, 73, 42. [Google Scholar] [CrossRef]
  41. Zhang, L.; Tang, C. Friction and wear of diamond-silicon nano-systems: Effect of moisture and surface roughness. Wear 2013, 302, 929–936. [Google Scholar] [CrossRef]
  42. Bai, L.; Srikanth, N.; Korznikova, E.A.; Baimova, J.A.; Dmitriev, S.V.; Zhou, K. Wear and friction between smooth or rough diamond-like carbon films and diamond tips. Wear 2017, 372, 12–20. [Google Scholar] [CrossRef]
  43. Wu, C.; Jia, J.; Che, H.; Mu, J.; Zhao, S.; Zhang, X. Frictional behaviors of three kinds of nanotextured surfaces. Surf. Interface Anal. 2016, 48, 1056–1061. [Google Scholar] [CrossRef]
  44. Bowden, P.; Tabor, D. Ploughing Friction. Proc. R. Soc. Lond. A Mat. 1967, 295, 221–235. [Google Scholar]
  45. Wang, X.Z.; Xu, Y.; Jackson, R.L. Elastic–plastic sinusoidal waviness contact under combined normal and tangential loading. Tribol. Lett. 2017, 65, 45. [Google Scholar] [CrossRef]
Figure 1. (a) Sliding simulation model of 6H-SiC slider on Si substrate and (b) crystal structure of 6H-SiC.
Lubricants 13 00147 g001
Figure 2. Enlarged side view of the non-flat slider’s bottom.
Lubricants 13 00147 g002
Figure 3. Thermal map of substrate surface when sliding 120 ps.
Lubricants 13 00147 g003
Figure 4. von Mises stress distribution of substrate surface when sliding 120 ps.
Lubricants 13 00147 g004
Figure 5. Phase transition of atoms on the substrate surface when sliding 120 ps.
Lubricants 13 00147 g005
Figure 6. The number of substrate atoms with different (a) amplitudes, (c) periods, and (e) normal loads and the percentage of surface atoms with different (b) amplitudes, (d) periods, and (f) normal loads transformed into other crystal phases.
Lubricants 13 00147 g006
Figure 7. Displacement with different (a) amplitudes, (c) periods, and (e) normal loads and velocity with different (b) amplitudes, (d) periods, and (f) normal loads of sliders in x-axis.
Lubricants 13 00147 g007
Figure 8. Contact force with different (a) amplitudes, (c) periods, and (e) normal loads and adhesion force with different (b) amplitudes, (d) periods, and (f) normal loads of sliders in z-axis.
Lubricants 13 00147 g008
Figure 9. Friction with different (a) amplitudes, (c) periods, and (e) normal loads and friction under no force field with different (b) amplitudes, (d) periods, and (f) normal loads of sliders.
Lubricants 13 00147 g009
Table 1. Simulation parameters of sliding.
Simulation ParametersValue
Material of substrateSi
Lattice constant of the substrate (Å)5.428
Material of slidersSiC
Lower surface amplitudes (A) of the sliders (Å)1, 3, 5, 7, 9
Lower surface periods (T) of the sliders1, 2, 3, 4, 5
Normal force (F) on sliders (nN)40, 70, 100, 130, 160
Duration of each force field (ps)80
Timestep (fs)1
Potential functionTersoff, L-J
Initial temperature (K)300
Table 2. Average friction force (unit: nN) and COF under different parameters.
ParametersAverage Friction ForceStandard DeviationCOFStandard Deviation
Plane0.690.230.00680.0023
A = 11.151.140.01110.0110
A = 31.171.070.01120.0103
A = 51.111.070.01080.0105
A = 71.141.500.01130.0150
A = 91.181.130.01120.0117
T = 11.311.790.01320.0184
T = 21.361.700.01350.0172
T = 31.101.630.01070.0162
T = 41.111.070.01080.0105
T = 51.213.000.01200.0297
F = 401.360.370.03300.0085
F = 700.940.810.01330.0113
F = 1001.111.070.01080.0105
F = 1301.441.550.01070.0118
F = 1601.821.890.01120.0116
Disclaimer/Publisher’s Note: The statements, opinions and data contained in all publications are solely those of the individual author(s) and contributor(s) and not of MDPI and/or the editor(s). MDPI and/or the editor(s) disclaim responsibility for any injury to people or property resulting from any ideas, methods, instructions or products referred to in the content.

