Article

Proteinaceous Spirulina Biomass as a Sustainable Drilling Fluid Additive for Lubricity

by
Garrett M. Thibodeaux
,
Nicholas A. Baudoin
and
William M. Chirdon
*
Department of Chemical Engineering, University of Louisiana at Lafayette, Lafayette, LA 70504, USA
*
Author to whom correspondence should be addressed.
Lubricants 2025, 13(4), 149; https://doi.org/10.3390/lubricants13040149
Submission received: 9 February 2025 / Revised: 11 March 2025 / Accepted: 19 March 2025 / Published: 29 March 2025

Abstract

:
This study investigates the potential of Spirulina biomass as a lubricating additive for drilling fluid formulations. In this work, this waste protein is evaluated as a lubricant alternative that may decrease the coefficient of friction while improving the rheological profiles and/or reducing fluid loss via permeation in drilling fluids. A processed and dried Arthrospira platensis (Spirulina) biomass is incorporated into drilling fluid formulations and compared to standard lubricant additives for the drilling fluid properties of lubricity, rheology, and fluid loss. Rheological characterization includes the determination of yield stress, gel strength, and viscosity measurements. The major findings of this study include a friction value reduction of up to 30% and a fluid loss reduction of up to 51% by using 3 vol.% Spirulina. Parameters were fit to two rheological models (Bingham plastic and Herschel–Bulkley). After experimentation and analyzing the data gathered, it was determined that Spirulina and the Spirulina–Coastalube mixture in drilling fluids are good potential candidates as more environmentally benign and cost-effective alternative technologies for drilling fluids for decreasing the coefficient of friction, which results in increasing the lubrication performance of the drilling fluids.

Graphical Abstract

1. Introduction

Petroleum and petrochemical industries are continuing to advance toward environmentally benign and sustainable technologies [1,2,3,4], and the value of projects that involve sustainable materials will only continue to grow [5]. Based on public disapproval and increasing governmental regulation [6], high-performance water-based mud (WBM) technologies are considered to be attractive alternatives to oil-based mud (OBM) technologies for complex well situations [7]. A major issue while using WBM for drilling processes is the torque that arises from friction within the annular column, which causes equipment and tool wear [8]. To fulfil one of the main drilling fluid objectives of providing lubrication, the coefficient of friction—often simply referred to as lubricity—must be monitored and adjusted. Lubricants can be solid (e.g., nanoparticles or glass beads) or liquid [9]. One solid lubrication additive is graphite, which has the ability to reduce the coefficient of friction while also preventing fluid loss by plugging troublesome formations [10]. Traditionally, solid lubricant performance is less dependent on interactions with the fluid or formation because solid lubricants act as a physical barrier for the drill pipe to roll along. While this is good for resiliency and application versatility, the same properties can cause damage to downhole equipment [11]. Thus, development of liquid lubricants for WBM is essential.
Spirulina protein was identified as a potential sustainable lubricant additive [12]. Most commercially available drilling fluid lubricants are either hazardous or expensive and sometimes both. Spirulina powder could provide an alternative because it is an environmentally friendly bioprocessing byproduct with little to no cost [13]. The utilization of waste algae proteins could allow for a new paradigm of cooperation between conventional petroleum production and emerging biofuel technology [14]. Petroleum production could be made more environmentally benign while enabling co-product development for algal biorefineries to increase profitability [12].
For reference, a Sönmez et al. [11] compared the performance of traditional liquid lubricants (diesel, light oil, and heavy oil) with some newer potential formulations (fatty acid/glycerides, triglyceride/vegetable oil, and polypropylene glycol). At up to three percent by volume, all three new lubricants outperformed the traditional types. With no coefficient of friction (CoF) reduction, diesel was the worst performer, while the fatty acid/glyceride lubricant exhibited the most CoF reduction at 60%. The study also looked at the performance of combinations of the fluids, which showed an optimum formulation of 3 percent light oil with 2 percent of the triglyceride/vegetable oil-based lubricant. However, it should be noted that this would not be an appropriate mixture for areas where using petroleum oils in drilling fluid is prohibited or heavily regulated [11].
The bentonite replacement results from the previous study [12] showed that Spirulina powder increased viscosity, decreased fluid loss, and decreased the coefficient of friction. Though the increase in viscosity was not enough to replace bentonite gel outright, the decrease in the coefficient of friction led to further investigation of the performance of the Spirulina powder as a drilling fluid lubricant. Using the same formulation as the control from the previous study [12]—with the mid-range sodium hydroxide concentration and bentonite gel as the viscosifier—in this study, the Spirulina powder was tested against diesel and two commercially available lubricants. One is a high-performance lubricant that contains Environmental Protection Agency (EPA)-regulated components [15] for use in areas such as the Gulf of Mexico, while the other does not contain EPA-regulated components [16]. One (1), two (2), and (3) volume percent concentrations for each lubricant were tested. Though lubricity is the main focus, all samples were tested for high-pressure + high-temperature fluid loss, rheology, and the coefficient of friction (CoF) to evaluate any secondary benefits or drawbacks.

2. Experimental Methods and Data Collection

Many of the methods and materials follow from the referenced study [12] and a published patent [17].

2.1. Materials and Reagents

The lubricants used in this study, specifically diesel and Coastalube (a synthetic polyalphaolefin), were purchased from Sun Coast Resources, Inc. in Austin, TX, USA, and Sun Drilling Products Corp. in Belle Chasse, LA, USA, respectively. HDL Plus was also provided by National Oilwell Varco in Houston, TX, USA. The base drilling fluid composition is comprised of the following materials that were assembled from a preceding publication [12].
Acetar Bio-Tech Inc. (Xi’an, China) supplied the Spirulina blue-green cyanobacteria biomass, which had a protein content of 62.2 wt%. We bought sodium hydroxide (caustic soda) from Axiall, LLC in Houston, TX, USA. Barite (barium sulfate) was acquired from Excalibar, LLC in Dallas, TX, USA, while lignite (humic acid—leonardite) and bentonite (sodium bentonite) were acquired from Cetco/American Colloid in Hoffman Estates, Illinois. A tannin-based deflocculant (Desco) was purchased from Drilling Specialties in The Woodlands, TX, USA. Xanthan gum (polymer) and defoamer (glycol, silicone, and alcohol-based constituents) were supplied by National Oilwell Varco in Houston, TX, USA [12].

2.2. Sample Preparation of Drilling Fluids

Aside from the additions of lubricant additives, the base drilling fluid preparation in this study coincides with a previous study [12] and patent [17]. Table 1 lists the ingredients of the base drilling fluid, which includes xanthan gum, barite, defoamer, lignite, and algal protein or bentonite as an added viscosifier, where the additive concentrations are measured on the basis of lbs/bbl. Using a five-spindle, single-speed multimixer, all materials were combined in a stainless steel mixing cup. The samples were then matured in glass jars with the implementation of a roller oven [12].
The lubricant type and concentration variations can be seen in Table 2. A lab barrel is roughly equivalent to 350 milliliters, where the density units can be either pounds per barrel or grams per 350 milliliters.
Aside from water, barite, and the lubricant, all of the additive concentrations were maintained constant. The kind and concentration of the lubricant were modified, and only the amount of barite and water was changed to guarantee a final fluid density of ten pounds per gallon. The appropriate volume of water was added to the mixing vessel, and then the Gel NT was gradually added during mixing. After that, the defoamer was added, and the gel was mixed for thirty minutes to allow it to hydrate. The mixture considerably thickened and stopped stirring when the caustic soda was introduced. At this stage, Desco and lignite were introduced to thin the fluid. After 10 min, xanthan gum was added to the mixture, followed by barite after another 5 min. After stirring for an additional fifteen minutes, the mud was separated into stainless steel malt cups with volumes equivalent to 1 lab barrel each. Using a syringe, the amount of fluid that would be replaced with lubricant was removed. At the specified volumes, one chosen lubricant was added to each sample mud (the weight of the algae was determined using a specific gravity measurement of 1.816). After that, the mud was put into a glass jar and heated to 150 °F (65.5 °C) for sixteen hours in a roller oven to undergo hot rolling, or aging [17].

2.3. Rheology

Using an OFITE Model 900 Viscometer [18] and following the manufacturer’s operation instructions, all of the rheological measurements were performed in compliance with API RP 13B-1. The fluid was hot-rolled and then mixed for five minutes on a multimixer before being poured into the sample cup for the viscometer. The bob was dipped into the sample and oriented to the sleeve’s submersion line. The standard viscometer readings for drilling fluids were obtained by heating the sample to 120 °F (49 °C) and taking dial readings at speeds of 600, 300, 200, 100, 6, and 3 rpm [18]. Equations (3) and (5) were utilized to compute the yield point and plastic viscosity, respectively. Following a ten-second pause on the viscometer’s rotation, the gel strength was measured at 3 rpm via the maximum dial reading. We performed this again for both ten- and thirty- minute timestamps [12].
Bingham plastic is a typical two-parameter model for non-Newtonian fluids. Since the parameters of the Bingham plastic model can be readily determined without the need for a computer or complicated algorithm, it is the standard way of characterizing these fluids under field conditions. Therefore, the Bingham plastic model was computed for every mud sample in this study. Equation (1) illustrates how to apply the model with the yield point (YP) and plastic viscosity (PV) values that are determined using Equations (3) and (5), respectively. Although the units in this version of the equation are dial readings (°), they serve as estimates in pounds per hundred square feet (lbf/100 ft2) for the YP and centipoise (cP) for the PV [12,19].
τ = Y P + P V × γ ˙ 511
P V   [ cP ] = P V ° 511   s 1 × 511   mPa ° × c P m P a · s P V °
P V = R 600 R 300
Y P l b f 100 f t 2 = Y P ° × 1.067 P V °
Y P = R 300 P V
While Bingham plastic is frequently employed to describe the rheological characteristics of drilling fluids, research has indicated [20] that the three-parameter Herschel–Bulkley model, represented by Equation (6), provides a more accurate representation of the behavior of water-based bentonite drilling fluids. Based on the gathered rheological data, Equations (7)–(9) were utilized to compute the Herschel–Bulkley parameters, which include yield stress, the flow behavior index, and the consistency factor, based on the rheology data [12].
τ = τ y + k γ ˙ n
τ y 2 × R 3 R 6
n = 3.32 × log 10 R 600 τ y R 300 τ y
k = R 300 τ y 511 n

2.4. Fluid Loss

Using an OFITE 4-Unit HTHP Filter Press [19,21], all of the fluid loss measurements were performed in compliance with API RP 13B-1 and following the manufacturer’s operation instructions. After setting the thermocouples to 250 °F (121 °C) within the filter press, the sample was added to the pressured collection cell until it was 0.5 inches (13 mm) from the top. The cell was covered with filter paper before the cap was put on, and all the screws and valve stems were tightened. The filter paper side of the cell was placed downward into the jacket’s preheated apparatus. In order to provide back pressure during heating, the top valve stem was opened after the bottom and top regulators were set to 100 psi (689 kPa). Following the cell’s temperature rise, the bottom valve was opened to initiate filtering at a 500 psi (3.447 MPa) differential pressure, with the top regulator being set at 600 psi (4.137 MPa). After the experiment commenced for 30 min, the filtrate was removed from the condenser once the bottom valve stem was closed. In order to scale up to a typical API filter’s size, the measured volume of the filtrate was doubled and regarded as the total fluid loss for this experiment [17].

2.5. Lubricity

An OFITE extreme pressure and lubricity apparatus [22] was utilized for all of the lubricity measurements in compliance with the manufacturer’s operation instructions. The OFITE lubricity meter was calibrated before each set of drilling fluids was tested. The calibration was performed by immersing the meter’s ring and block in deionized water and allowing it to rotate at 60 rpm. Equation (10) was used to find the correction factor (CF) [12].
Following the calibration check, the ring and block were submerged in the first drilling fluid-filled sample container. Once the reading stabilized, the torque was set to zero. Then, a new reading was taken after 150 inch-pounds (16.9 N⋅m) of torque was applied to the sample container and allowed to sit for five minutes. Using a torque wrench reading 150 inch-pounds and a torque shaft lever arm length of 1.5 inches (3.8 cm), Equation (11) calculates the coefficient of friction (CoF). Using both Equations (10) and (11), Equation (12) calculates a corrected version of the coefficient of friction for the tested drilling mud samples. The percent change in the coefficient of friction, as given in Equation (13), is a better metric and makes comparisons between various studies and lubricants [12].
C F = 34.0 M e t e r   R e a d i n g   f o r   W a t e r
C o F = T o r q u e   R e a d i n g ( 150   i n l b 1.5   i n ) = τ 100   l b
C o F c o r r . = C o F × C F
% c h a n g e = C o F C o F b a s e C o F b a s e × 100

3. Results and Discussion

The same base fluid was used in all of the experiments in the publication, with the type of lubricant and concentration being varied. In order to reduce variations from base formulations, a baseline formulation was run with no lubricant for each batch. The results were calculated as the relative change from the baseline sample.

3.1. Rheology

3.1.1. Bingham Plastic Model

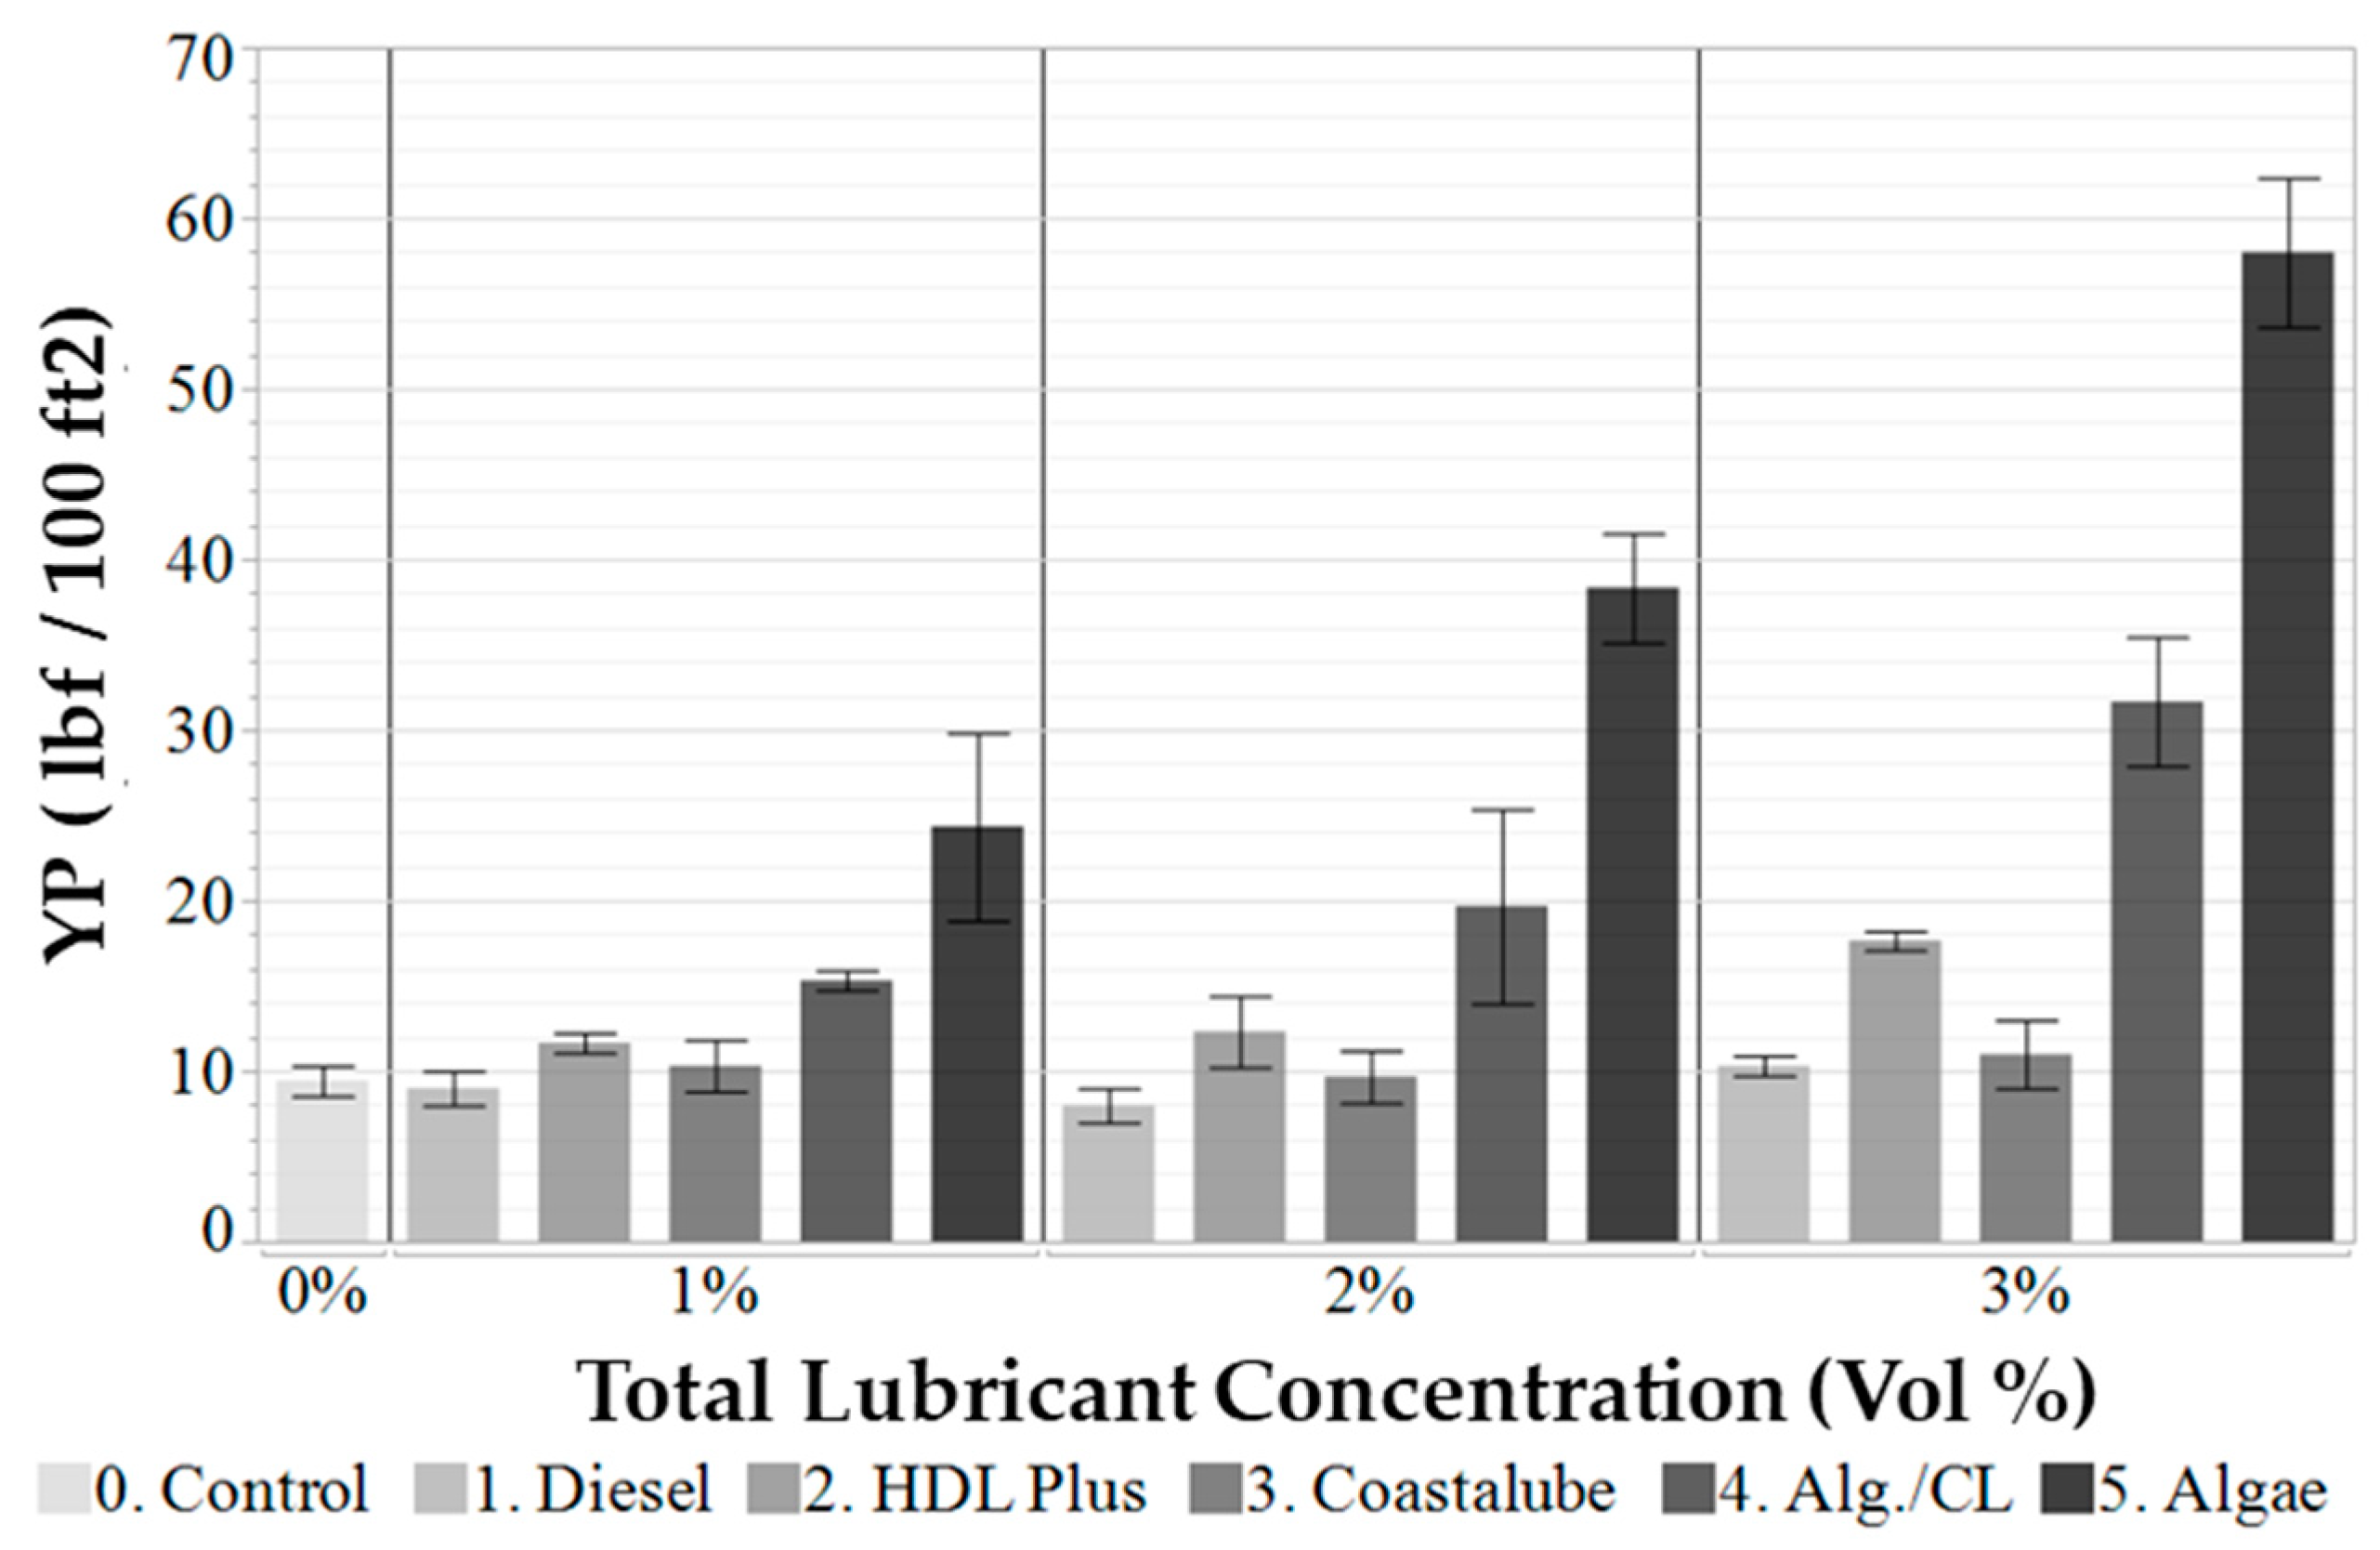
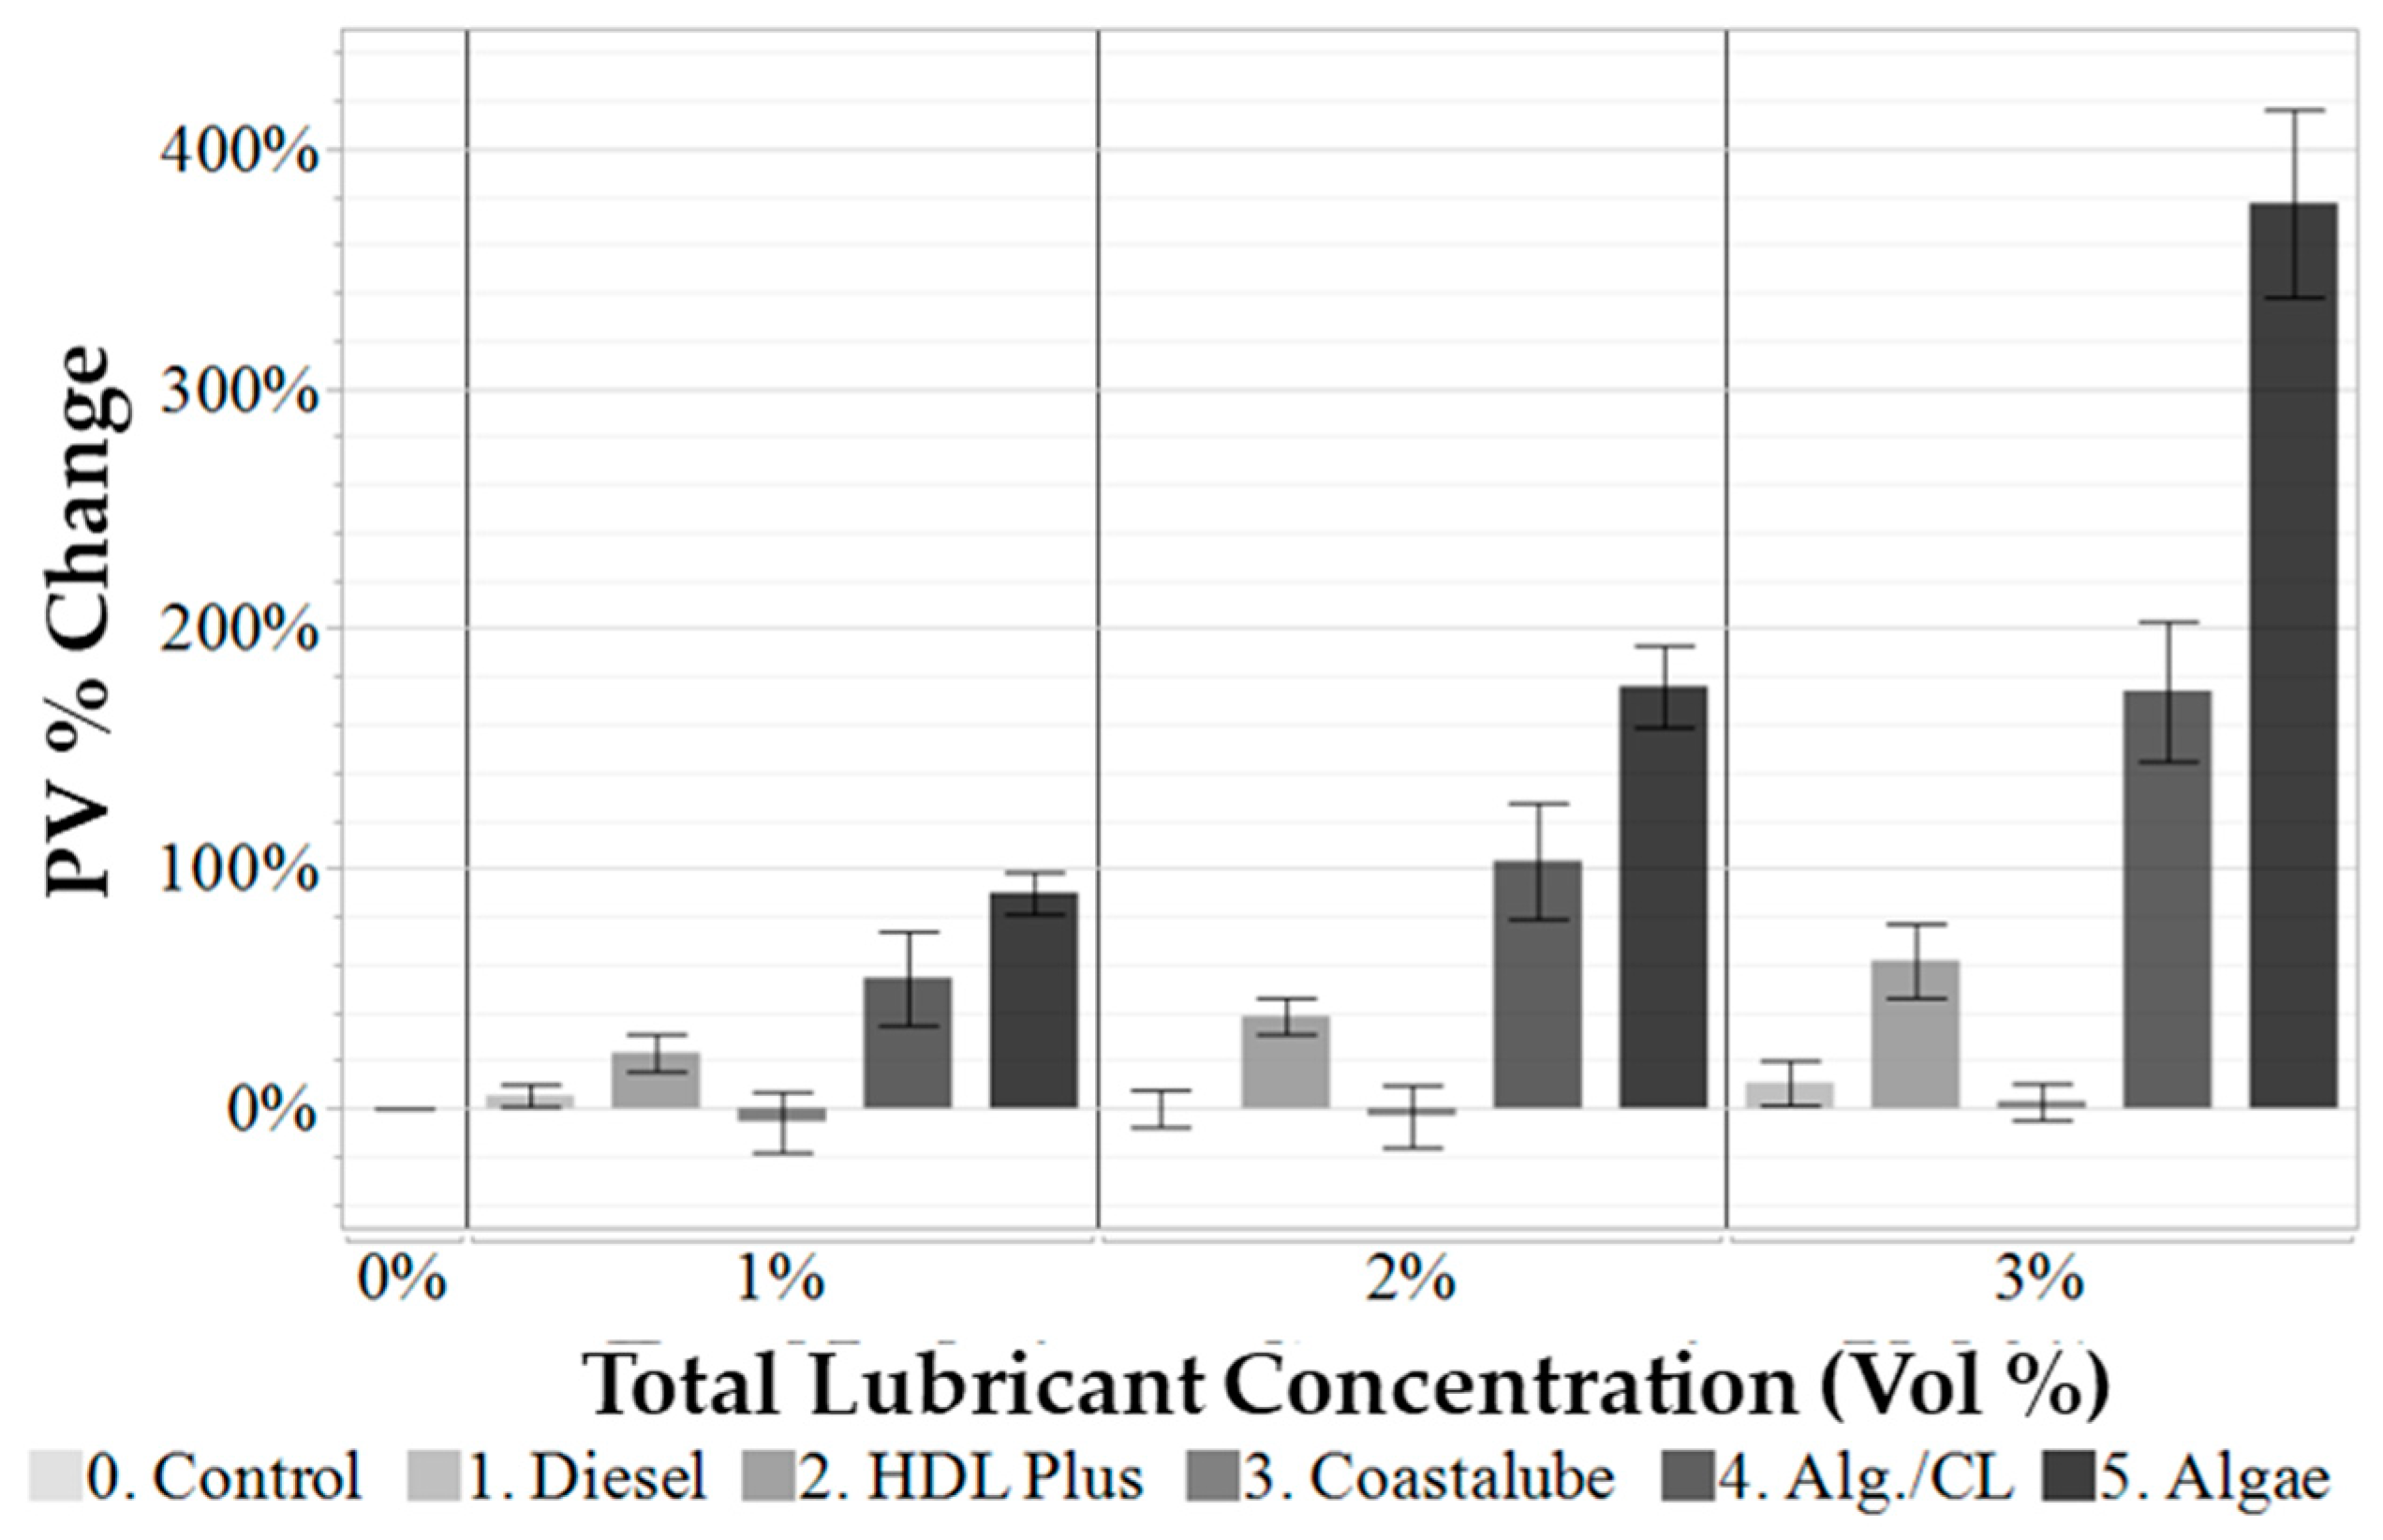
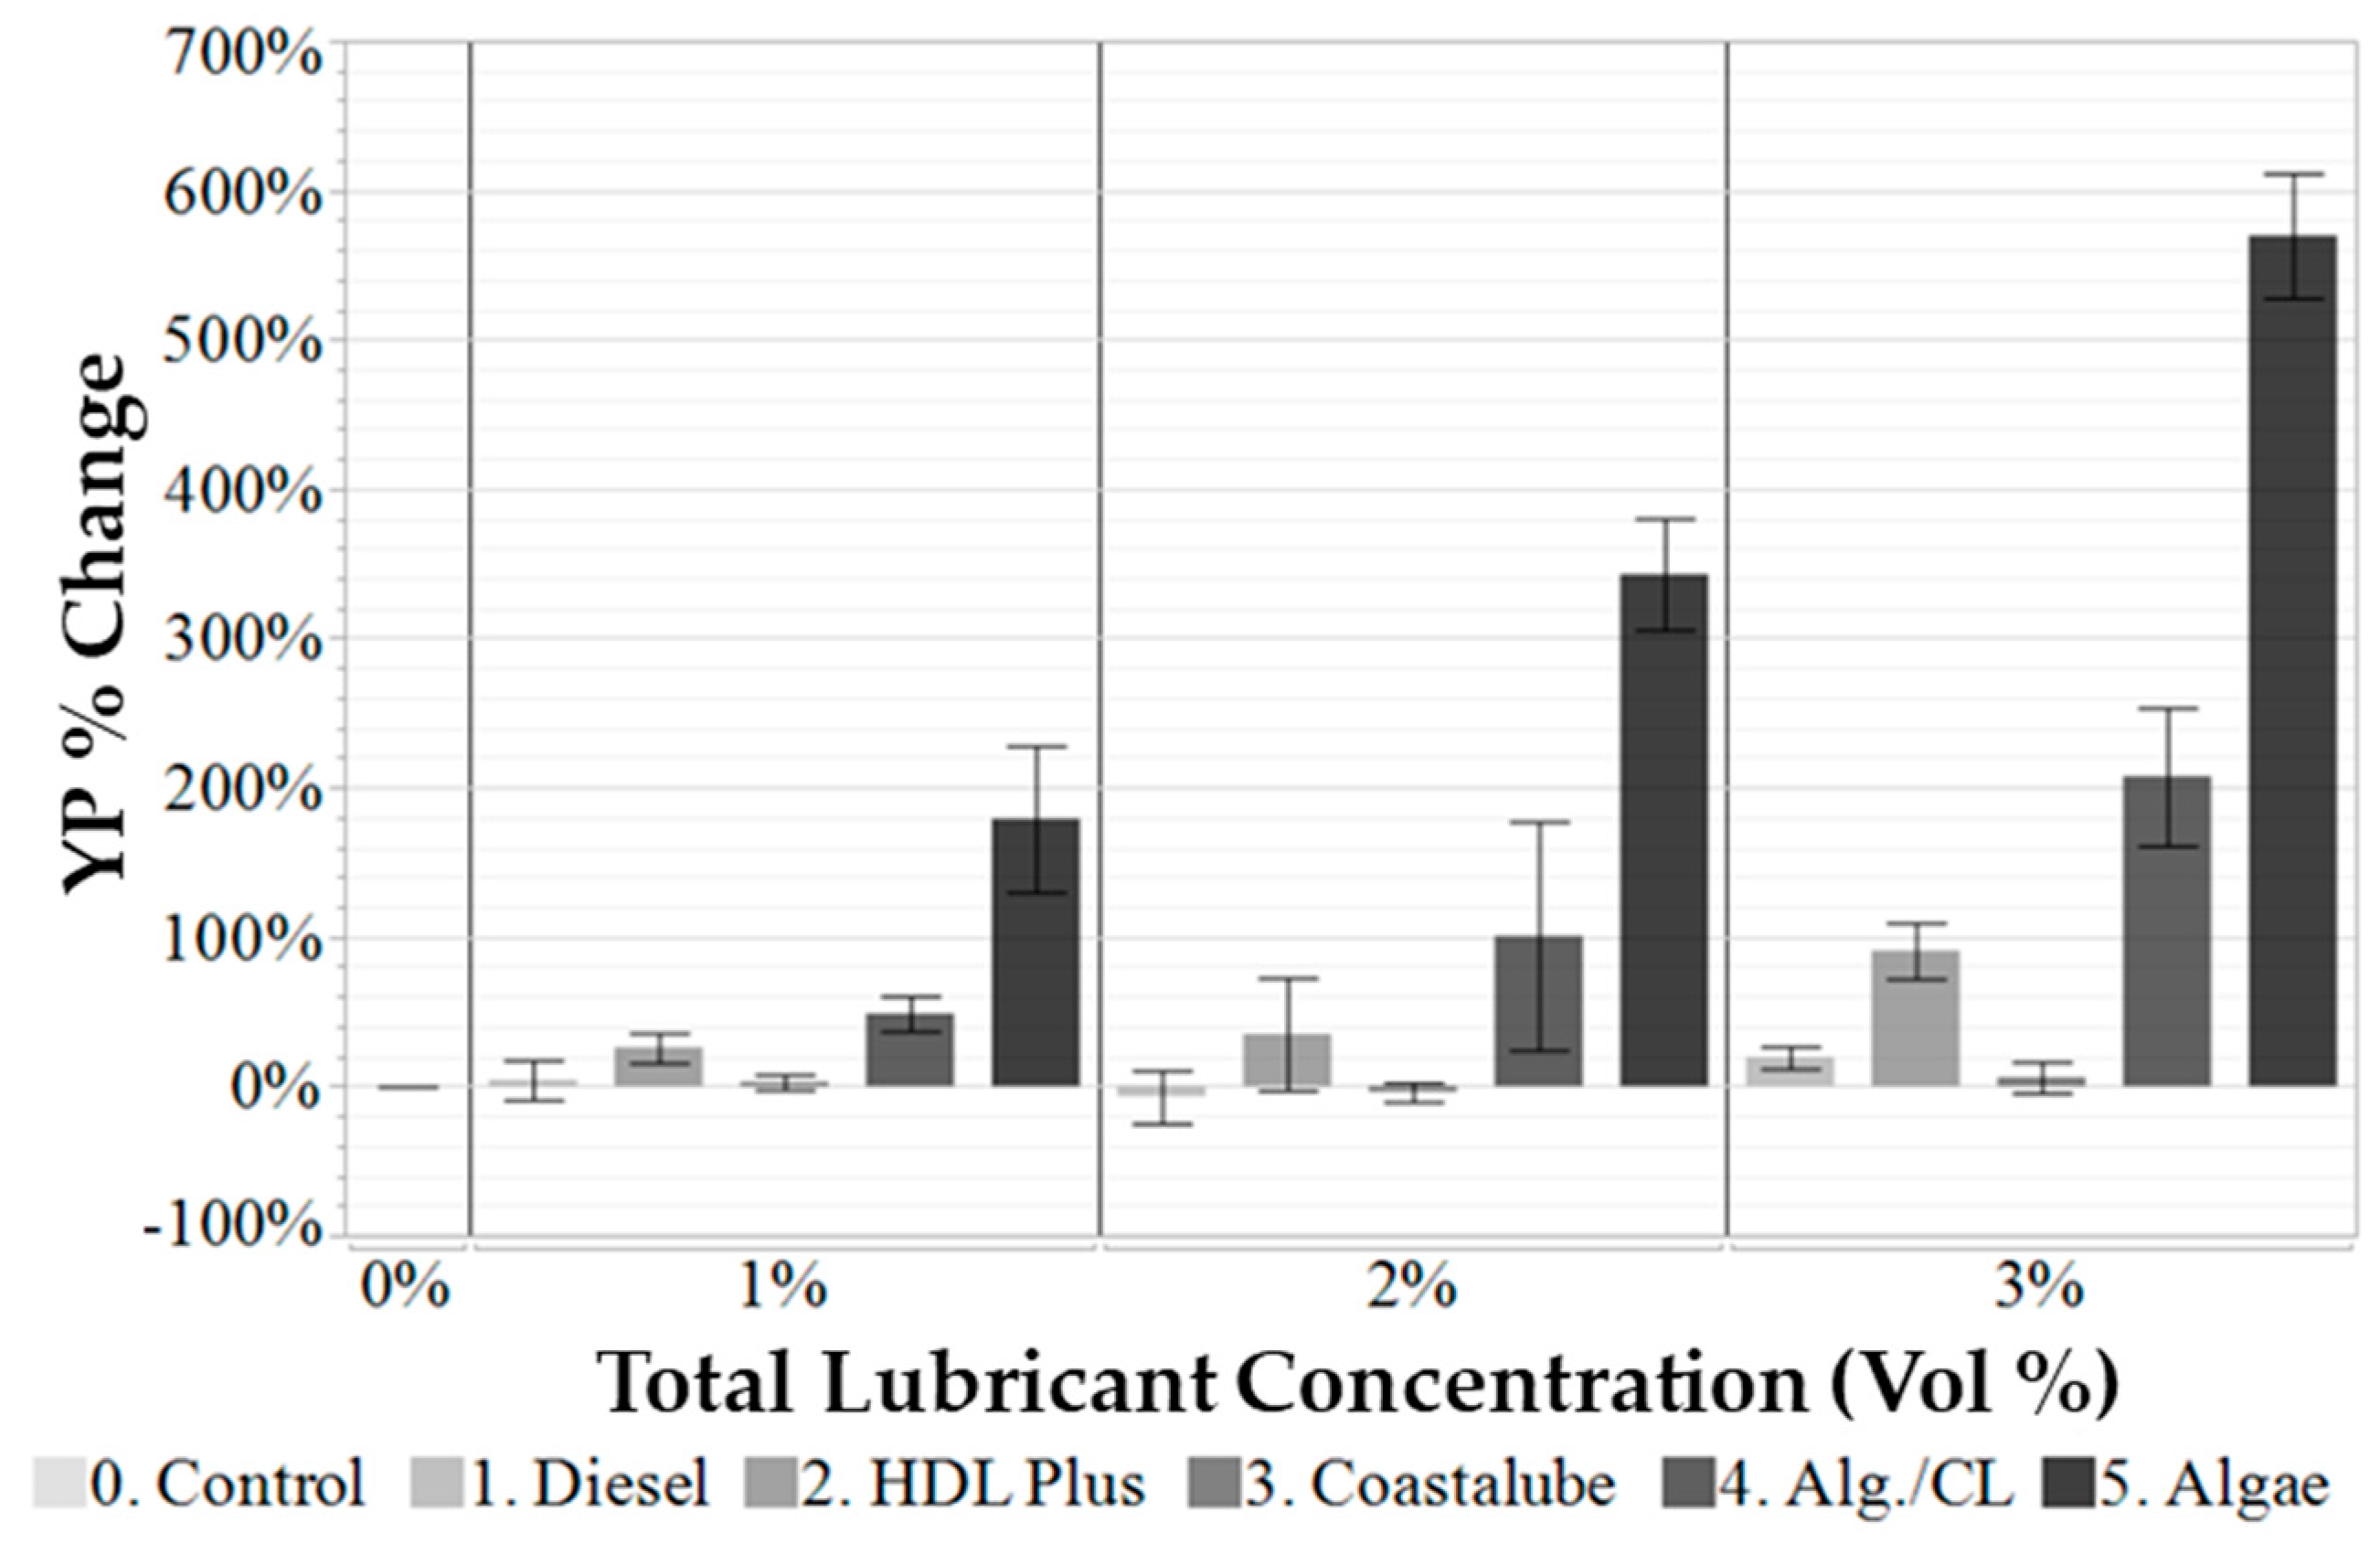
Figure 1 and Figure 2 show the PV and YP data for each of the fluid samples, while the data in Figure 3 and Figure 4 show the PV and YP percent changes from the baseline (control) fluid. The error bars indicate the standard deviation of the results from triplicate measurements. The two fluids with added Spirulina and Spirulina–Coastalube (CL) had the most significant influence on the PV and YP. HDL Plus exhibited a lesser effect. Compared to the control fluid, the fluid with a 3% Spirulina concentration exhibited increases of PV by nearly 380% and YP by 575%. On the other hand, the Spirulina–CL mix at a 3% concentration effected smaller increases of 175% for the PV and 205% for the YP. It is worth noting that foaming was apparent at three percent Spirulina but was not an issue at the same concentration of the Spirulina–CL mix.
While it is not the most accurate model across the rheological profile of a drilling fluid, the parameters from the Bingham plastic are the most commonly used parameters when characterizing rheological properties. Generally, in traditional drilling fluid applications, an increased plastic viscosity and yield point are desired; however, there are cases where this is not true. Increasing the yield point can shift the flow mechanism from turbulent flow to laminar flow, which is desirable for improved cutting transport and an improved rate of penetration (RoP). Higher-viscosity fluids do contribute to increases in the equivalent circulating density (ECD), which can be limited in some cases by the rig circulation system equipment. If a rig runs into an ECD limit, it would be better to use a thinner fluid at viscous flow conditions. It is best to avoid the unstable transition region between laminar and turbulent flow, where the flow regime can become unpredictable [23].
Based on these results, the Spirulina addition to the drilling fluid increases the yield point and plastic viscosity significantly more than diesel or either lubricant tested. This is partially due to the Spirulina being a powder rather than a liquid but also because of the nature of the protein chains in the Spirulina powder to unfold in the presence of a strong base such as sodium hydroxide. Studies have shown that heat and pH can affect the viscoelastic properties of the proteins and form gels, which offers a potential cause for the viscosity increase [24]. In a system where a low viscosity is necessary or desired, the Spirulina powder may not be a good fit as a lubricant; however, in such a case, the plastic viscosity and yield point increases could be reduced by using the Spirulina–CL mix instead of only Spirulina.

3.1.2. Herschel–Bulkley Model

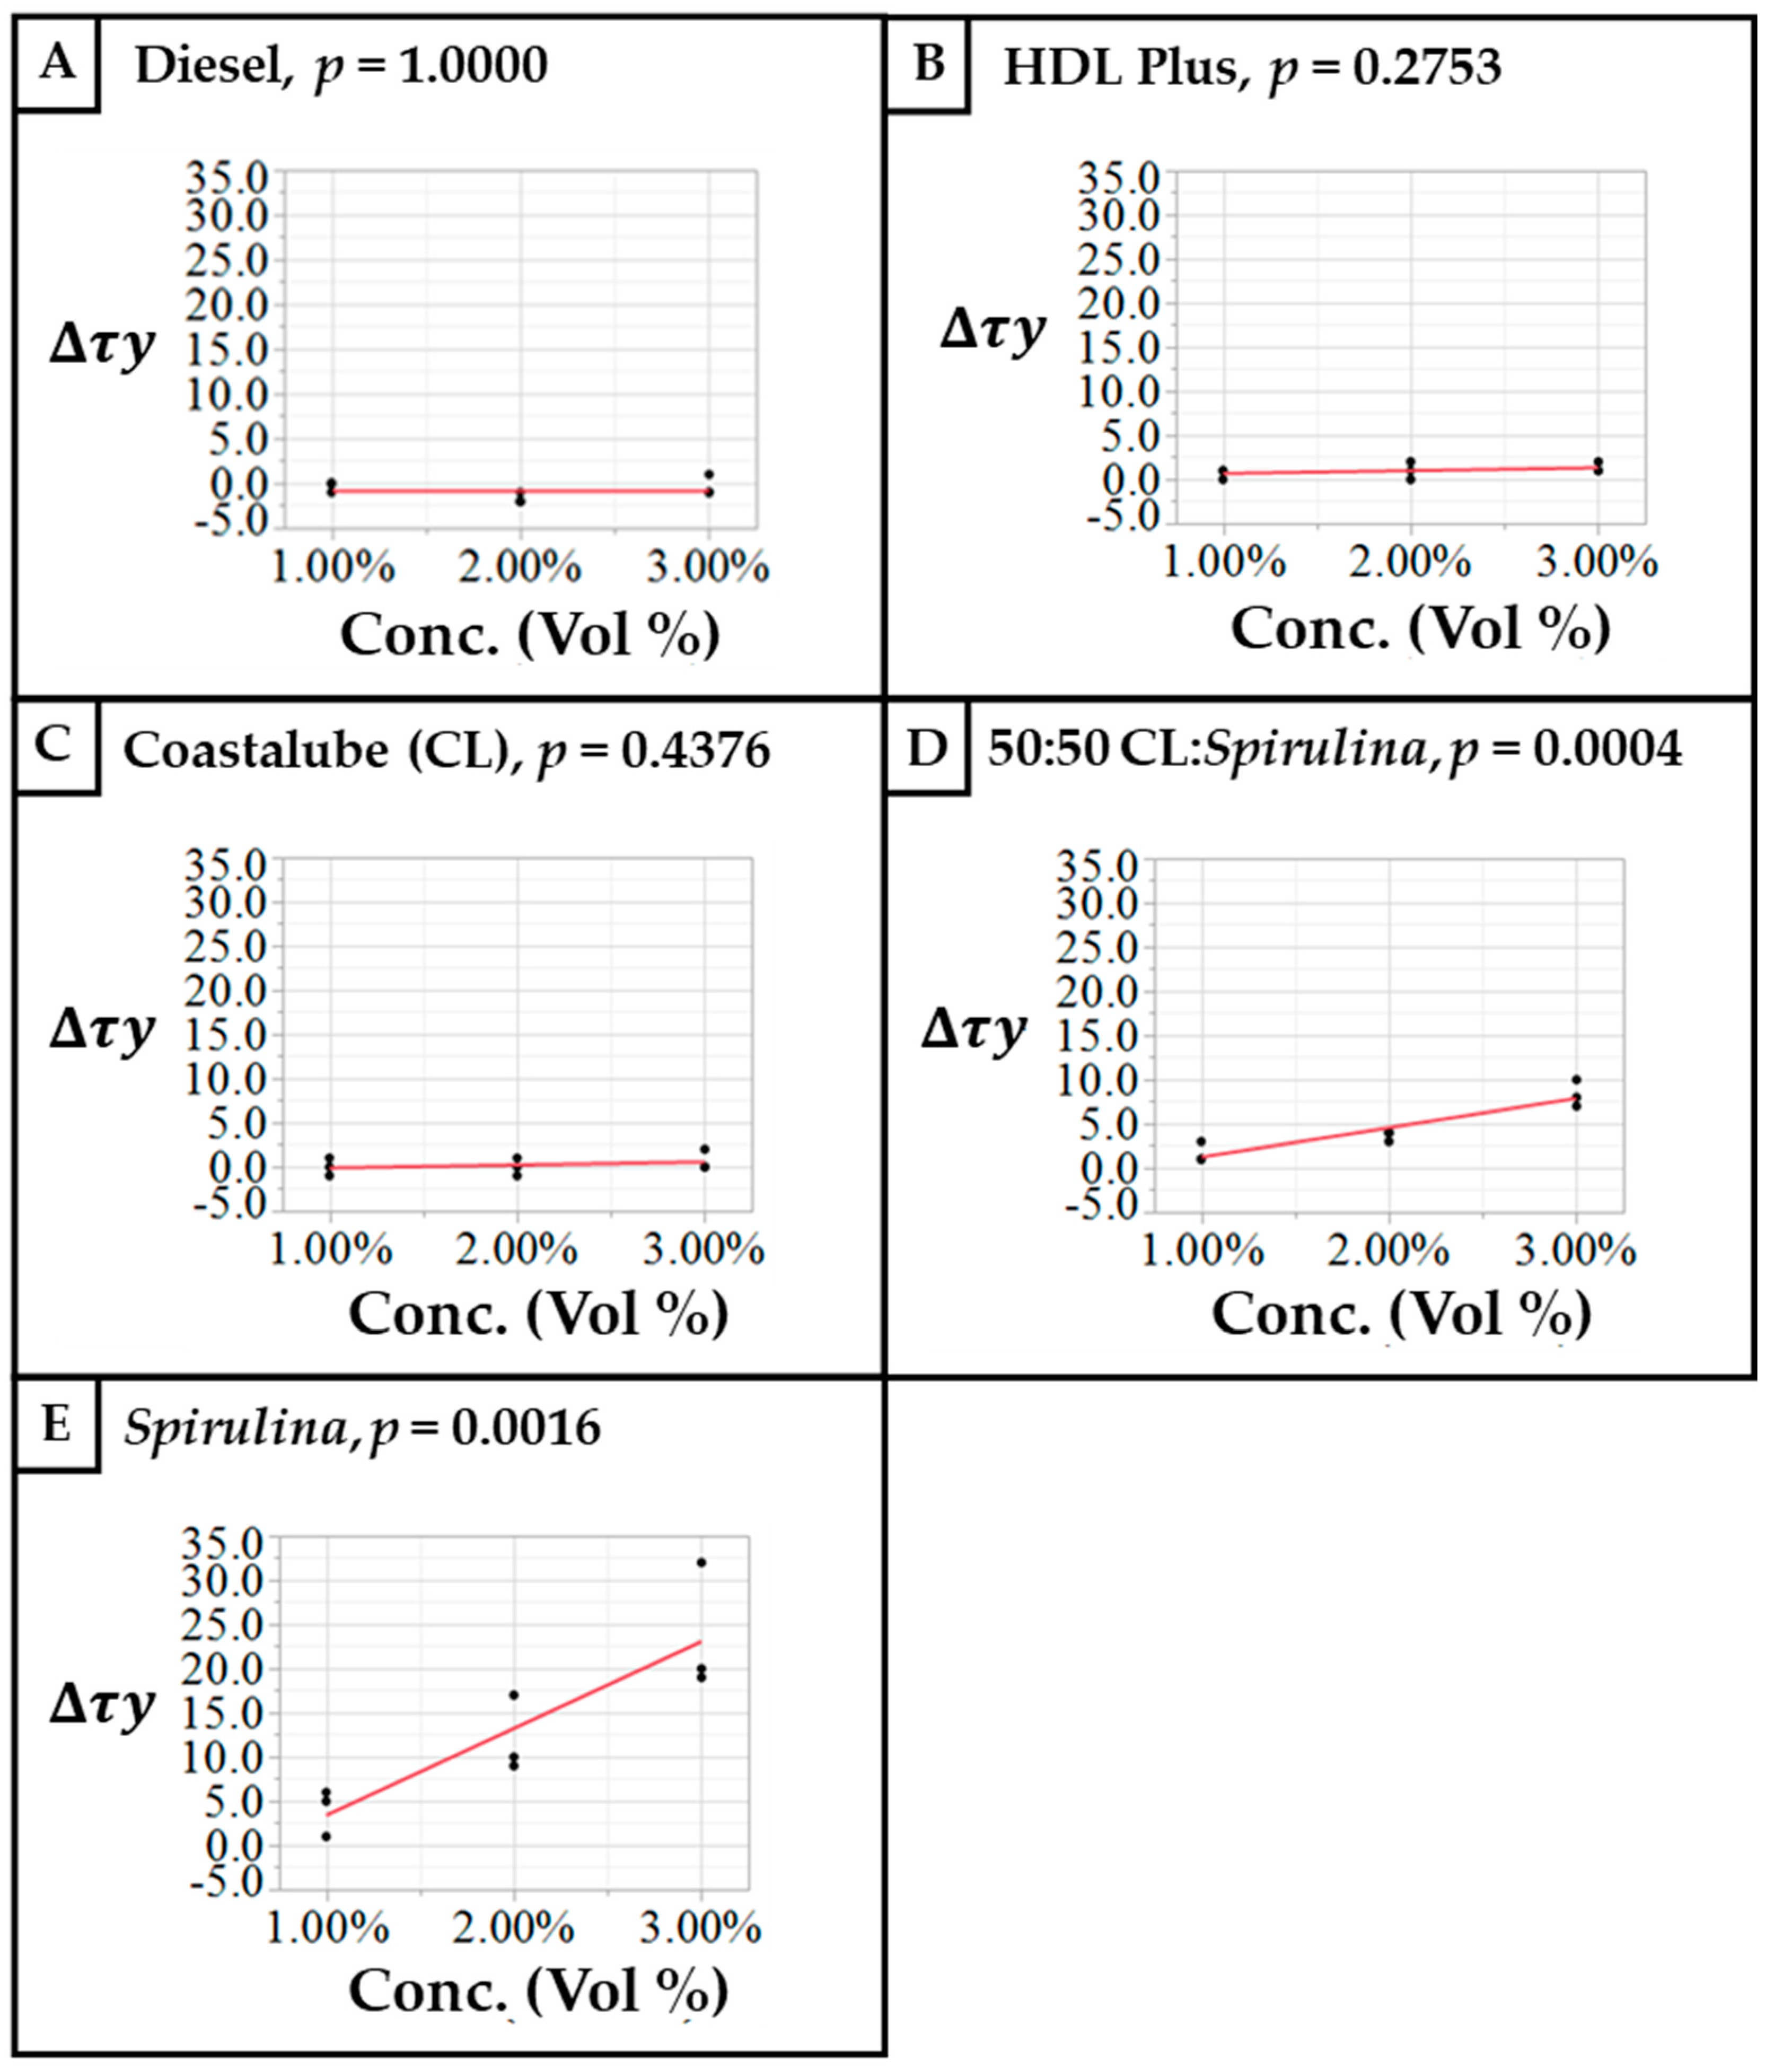
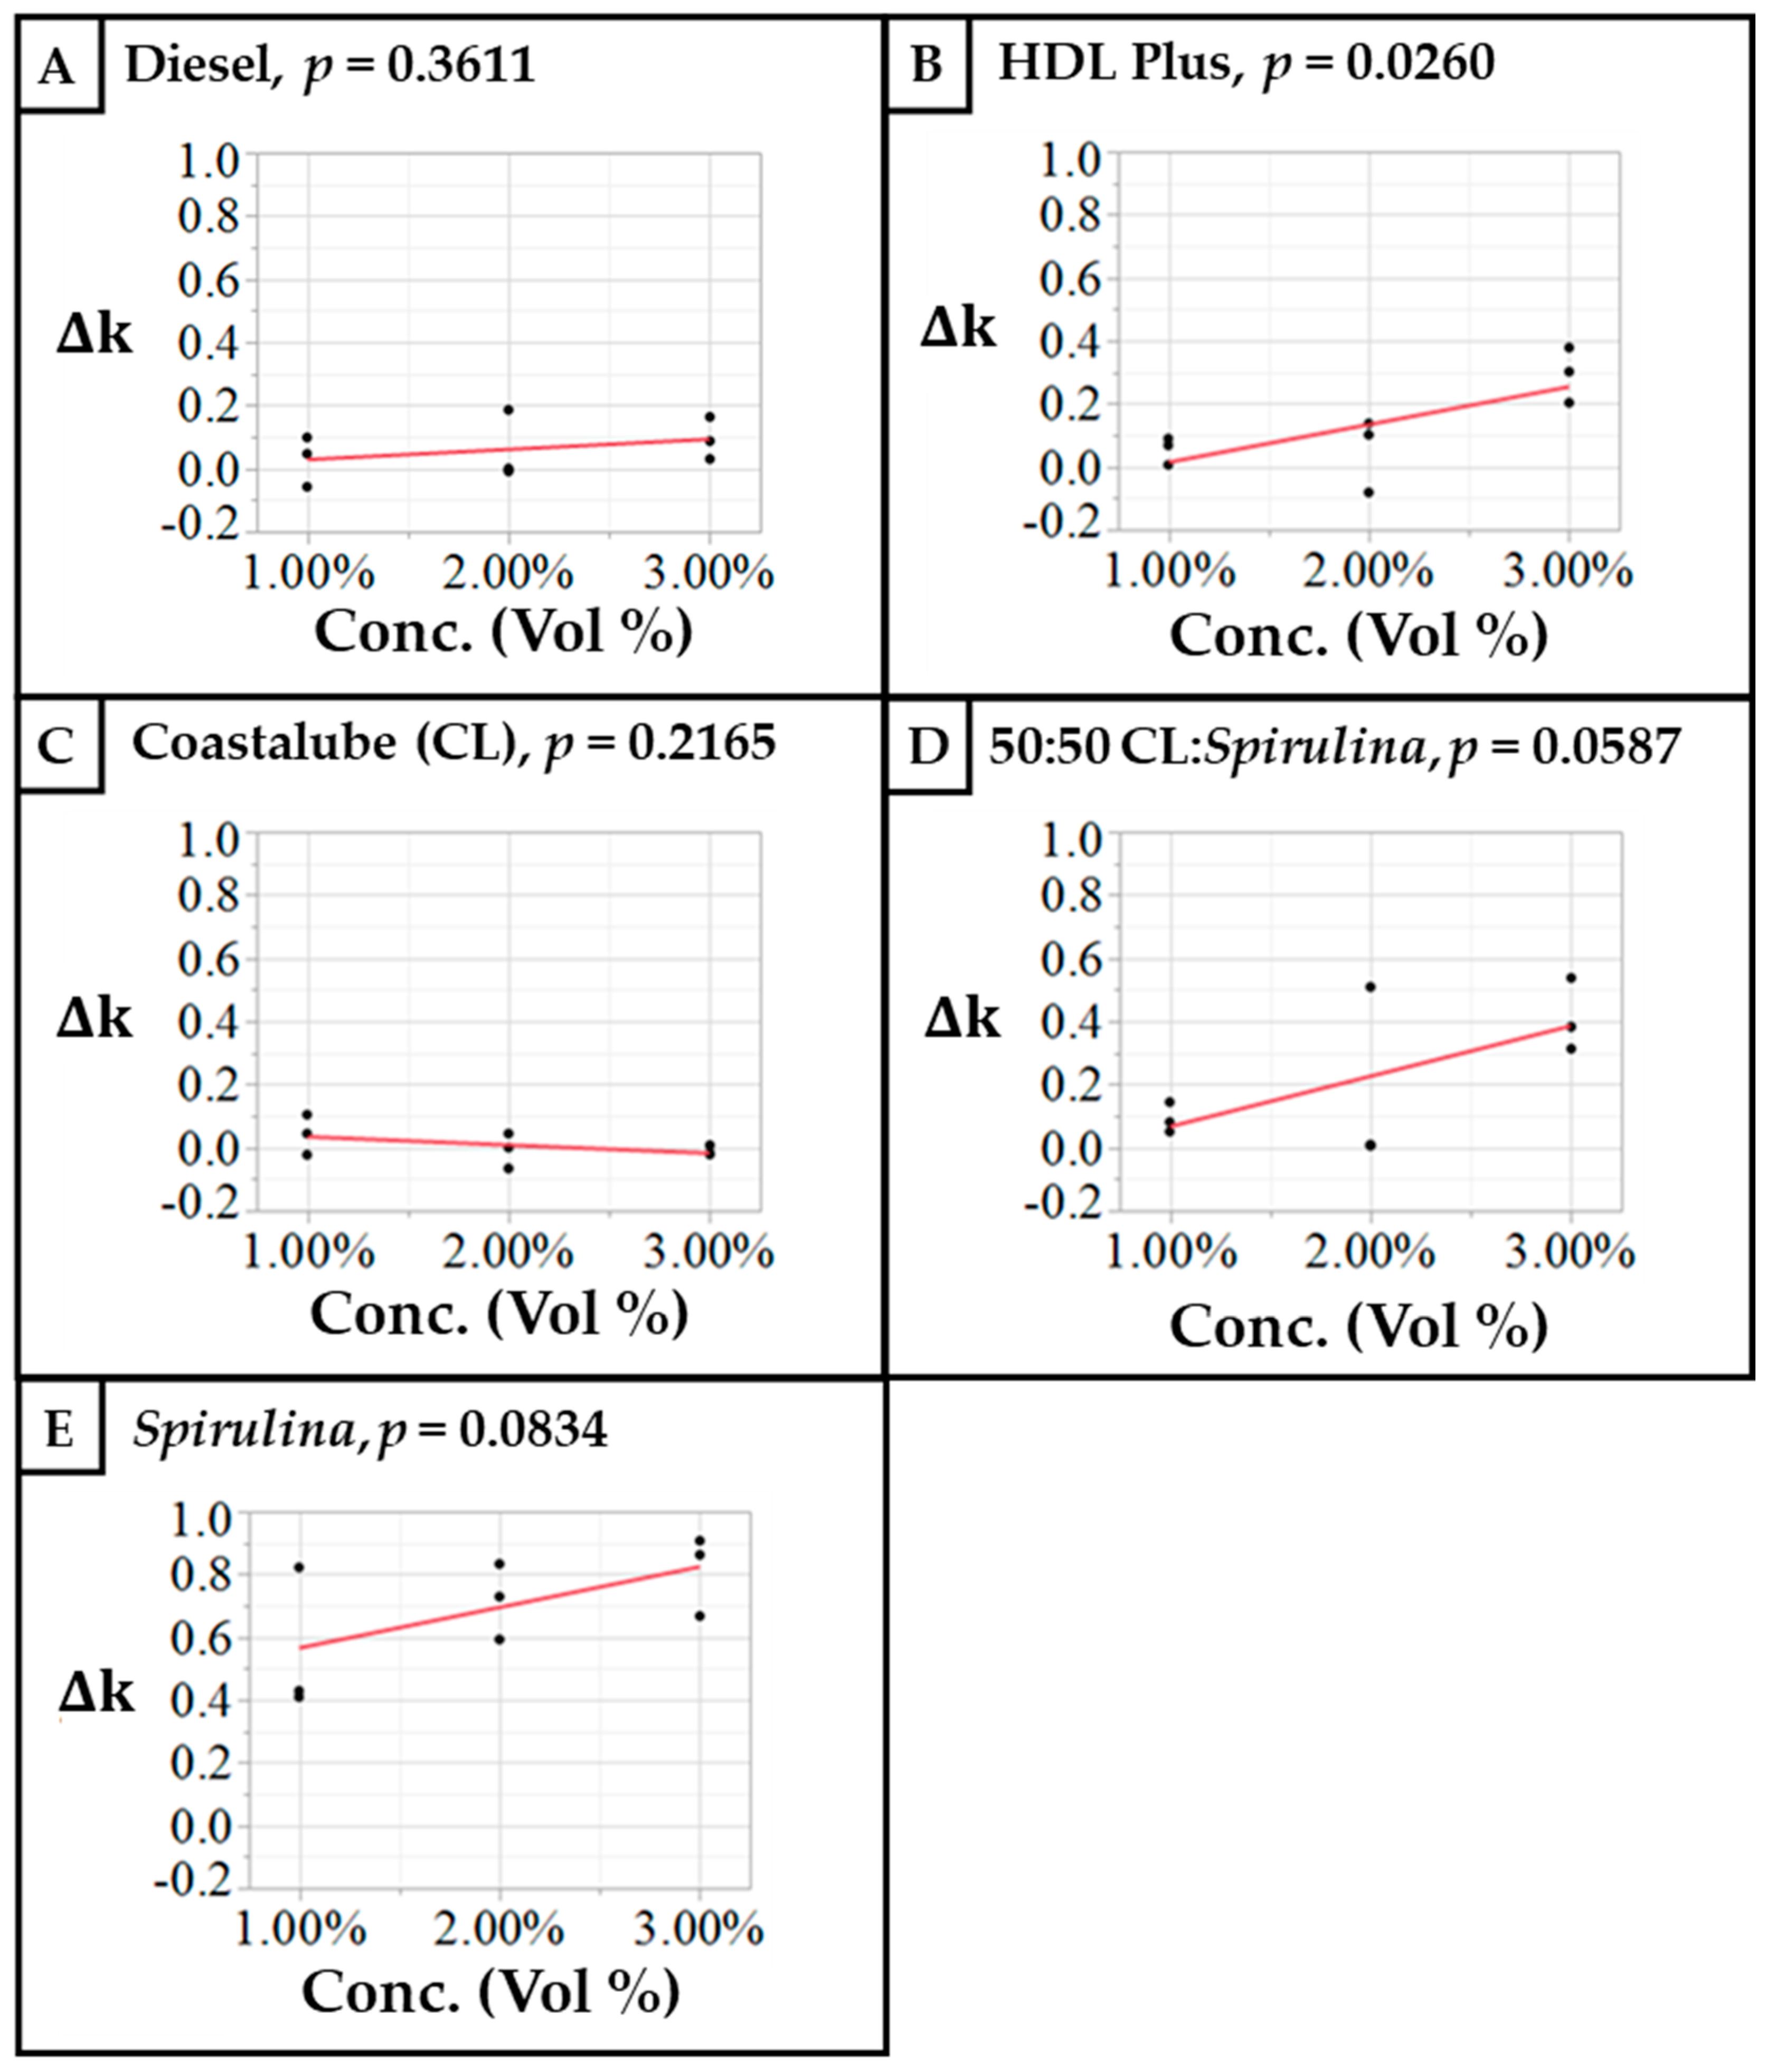
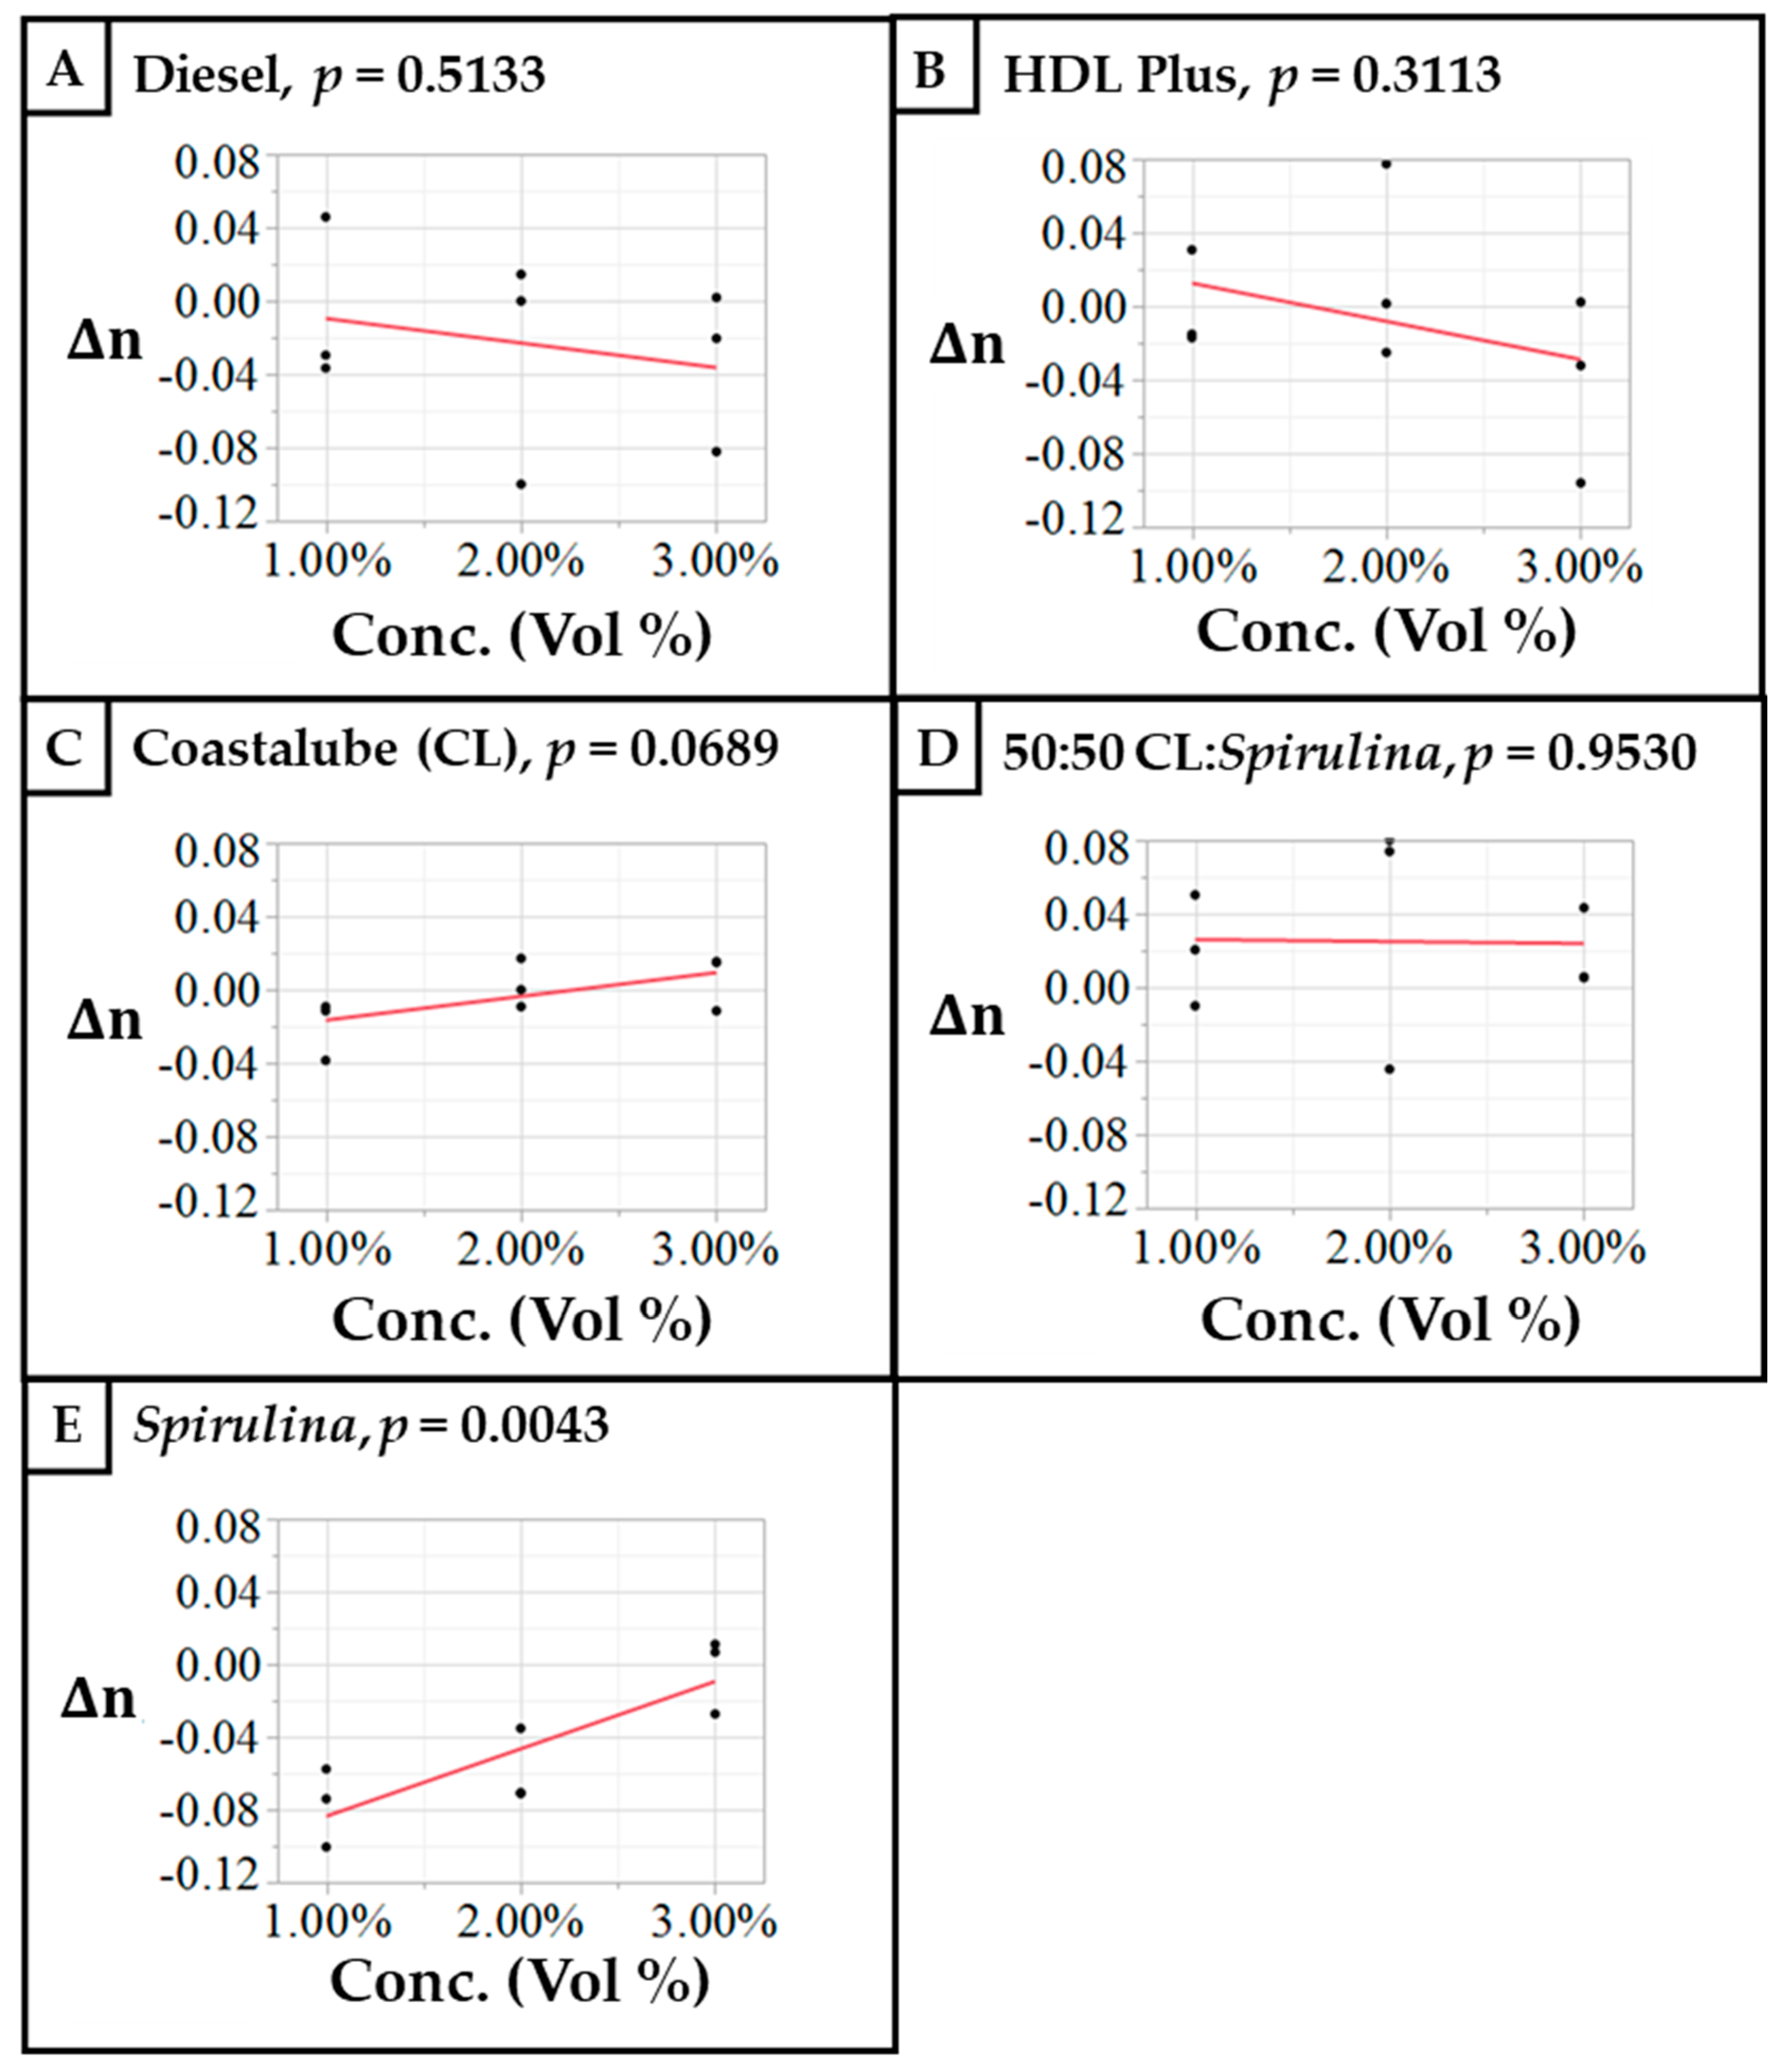
Table 3 displays the fitted parameter averages between the Herschel–Bulkley and Bingham plastic models. To have a better idea of the impact of each lubricant, the control values are subtracted from the given parameter to give the delta (Δ) values used in the bivariate significance fitting. The levels of significance between the lubricant concentration and the Herschel–Bulkley parameters are displayed in Table 4, which is based on bivariate plots with p-value data—yield stress (Figure 5A–E), the consistency factor (Figure 6A–E), and the flow behavior index (Figure 7A–E). Based on this analysis, diesel and Coastalube do not have a significant impact (p > 0.05) on any of the Herschel–Bulkley parameters. HDL Plus has a significant effect (0.01 < p < 0.05) on the consistency factor (k) only. Though the concentration of the Spirulina with and without Coastalube has a very significant (p < 0.01) effect on the yield stress (τy), only the Spirulina has a very significant fit (p < 0.01) with the flow behavior index (n) as well.
The results from fitting the Herschel–Bulkley model were comparable to that of the Bingham plastic model. The addition of Spirulina (with or without Coastalube) significantly affected the drilling fluid yield stress values. Since the Coastalube alone had no significant effect on any of the H-B parameters, it is logical that the yield stress effect seen in the mixture is due to the Spirulina and not the Coastalube. This hypothesis is backed by the similarity in the yield stress values of the two (2) percent Spirulina–CL mix and the one (1) percent Spirulina. Both fluids have the same Spirulina content and an average yield stress of 5.33 and 6.00, respectively.

3.1.3. Gel Strength

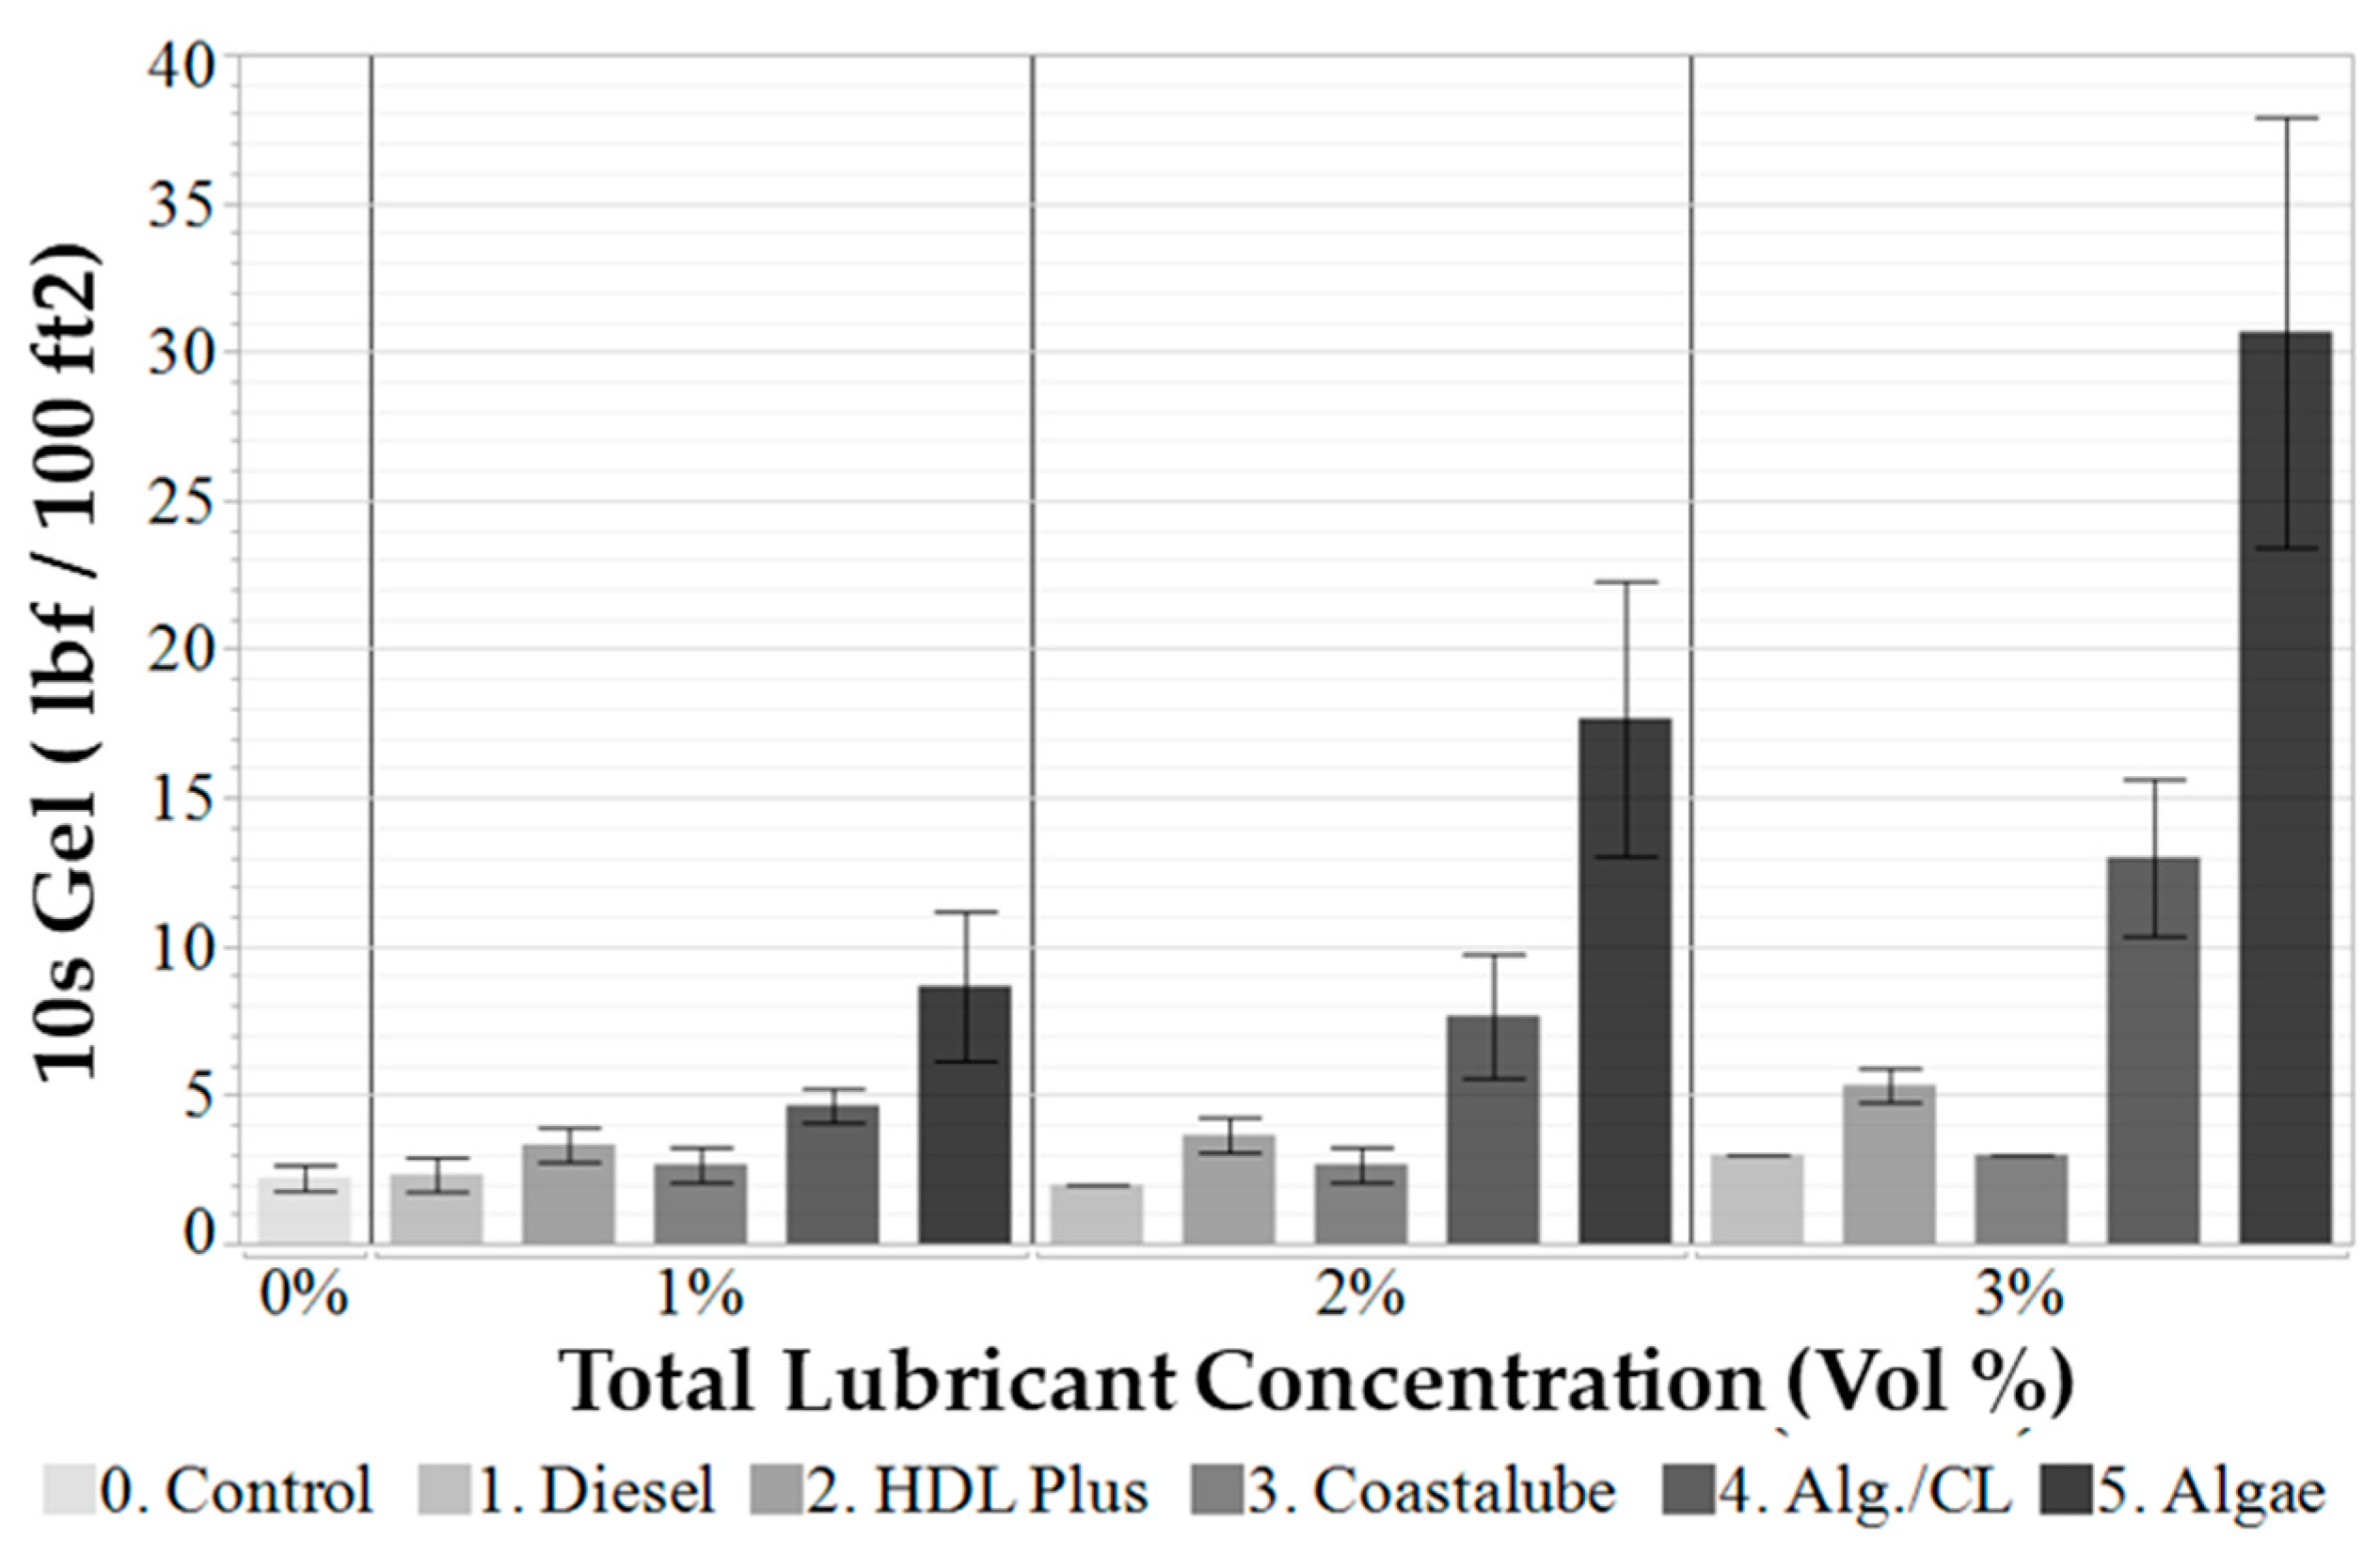
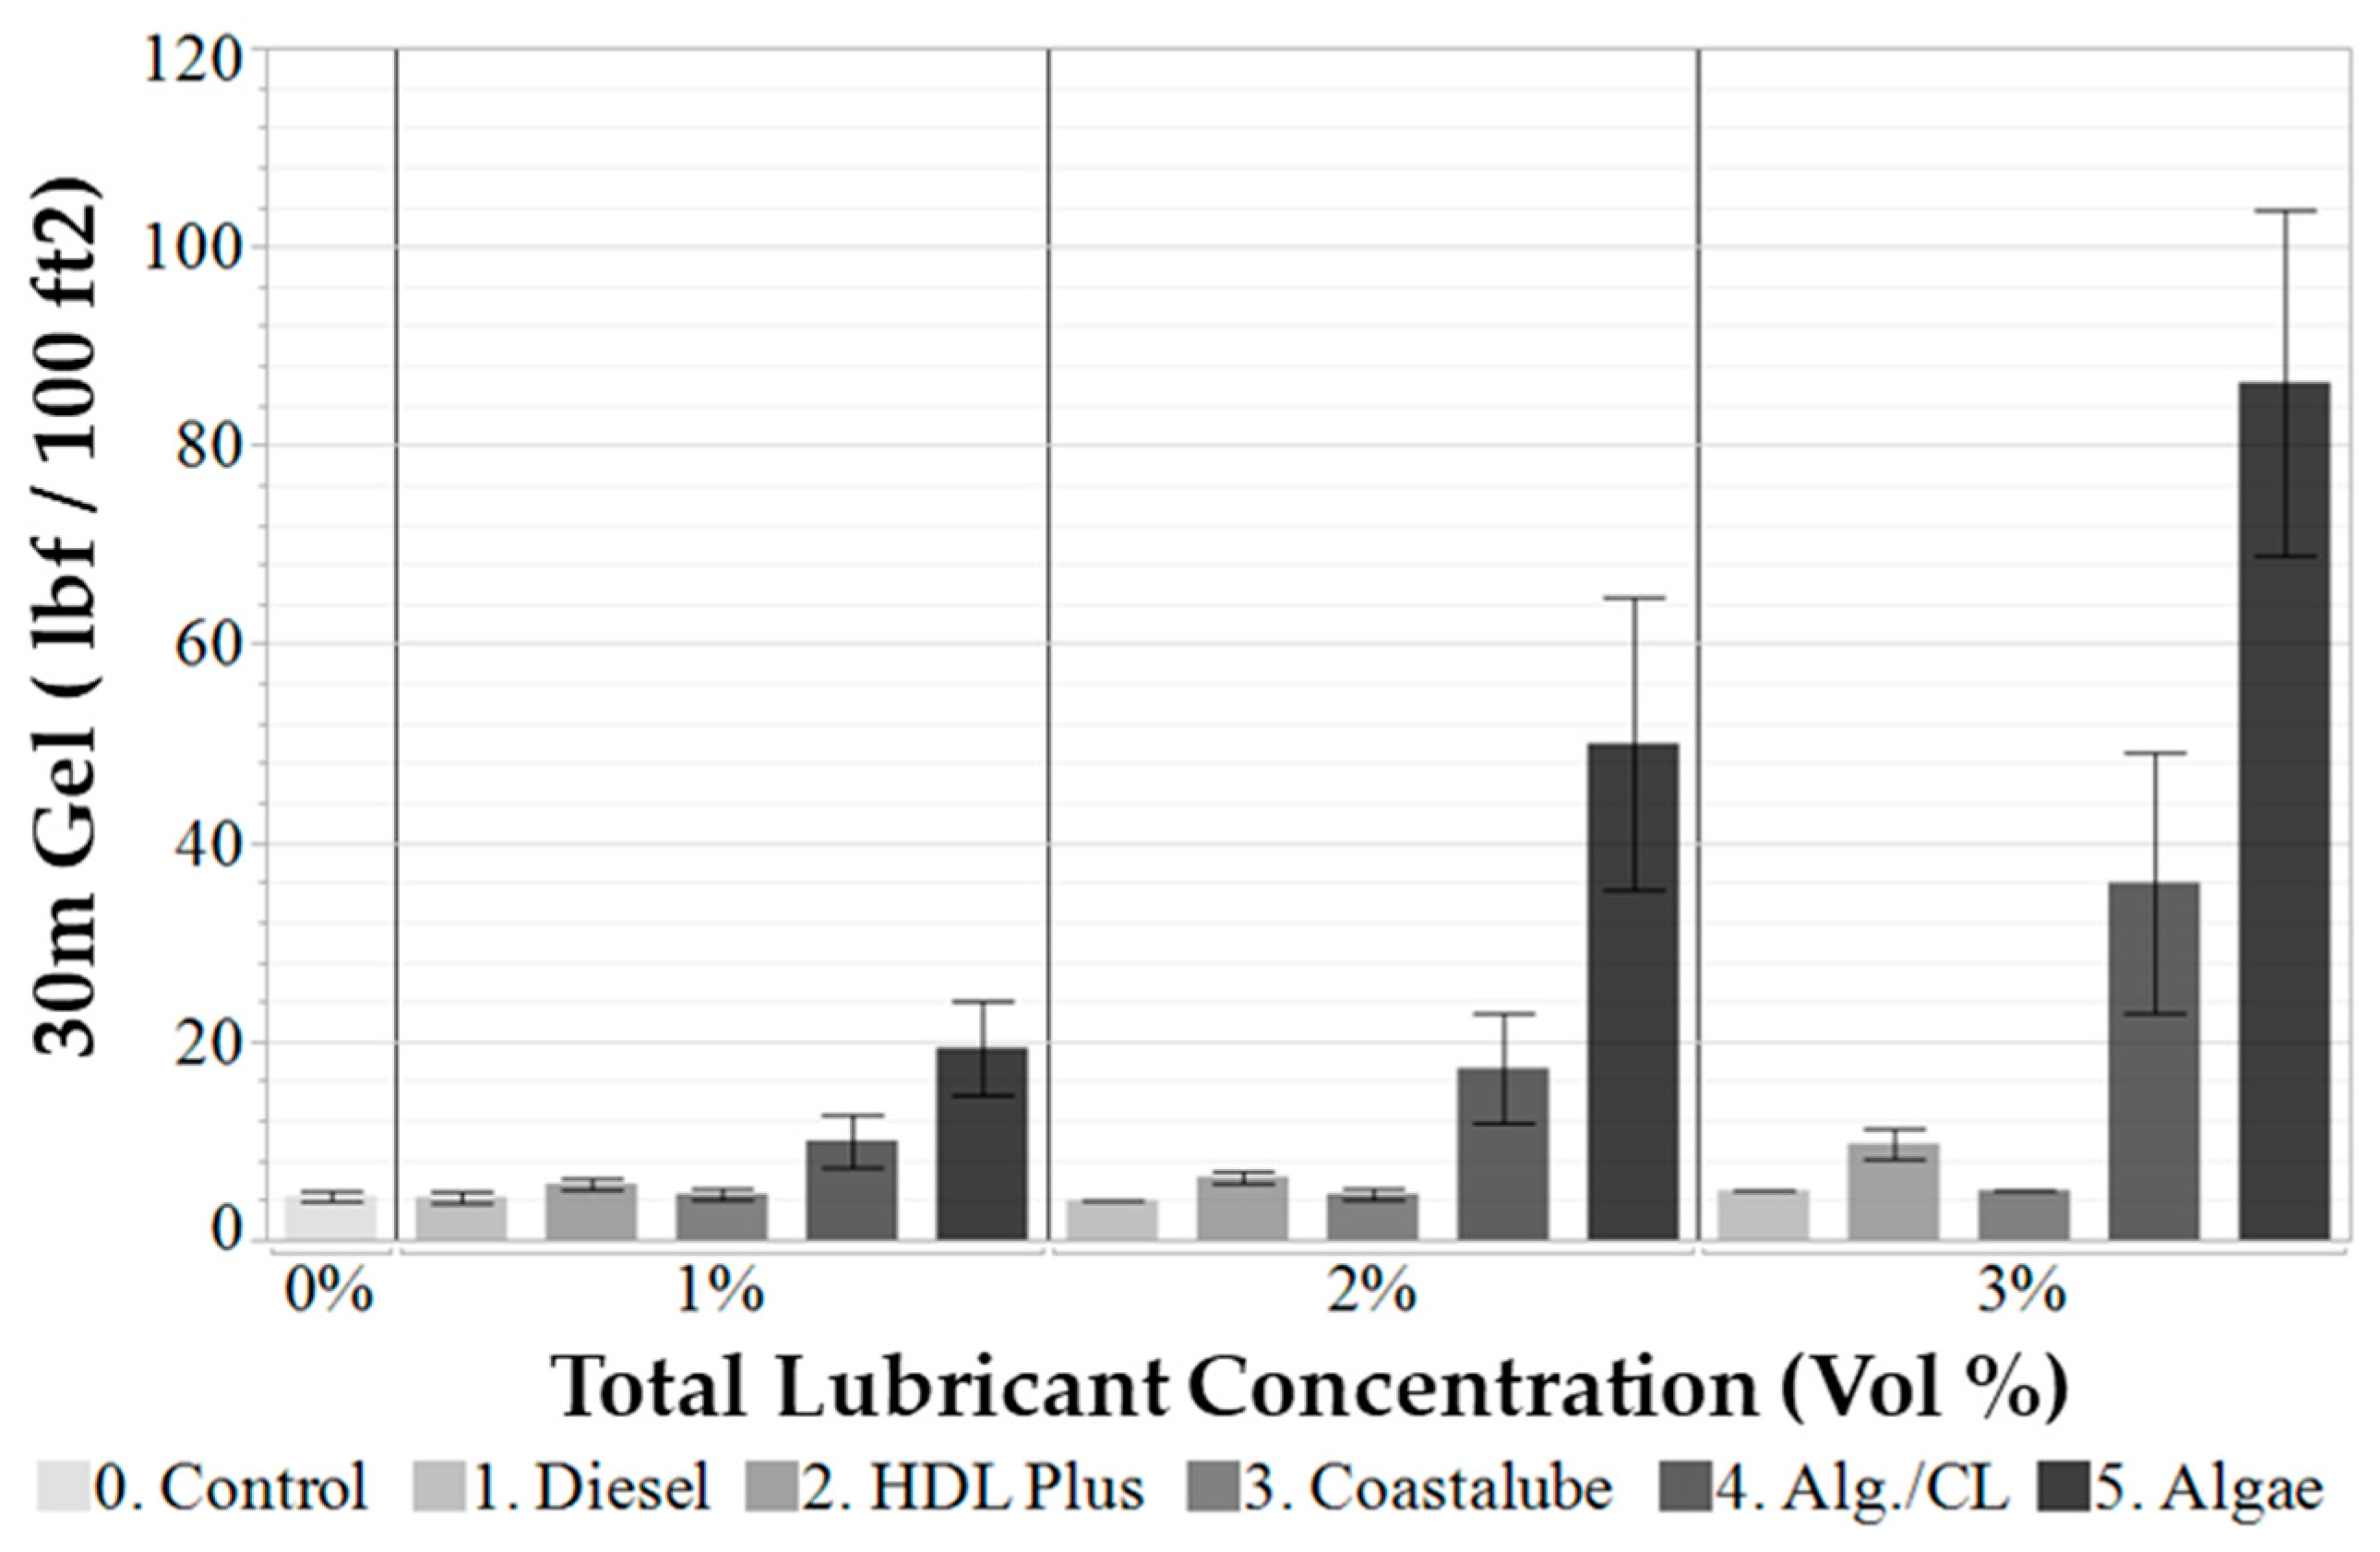
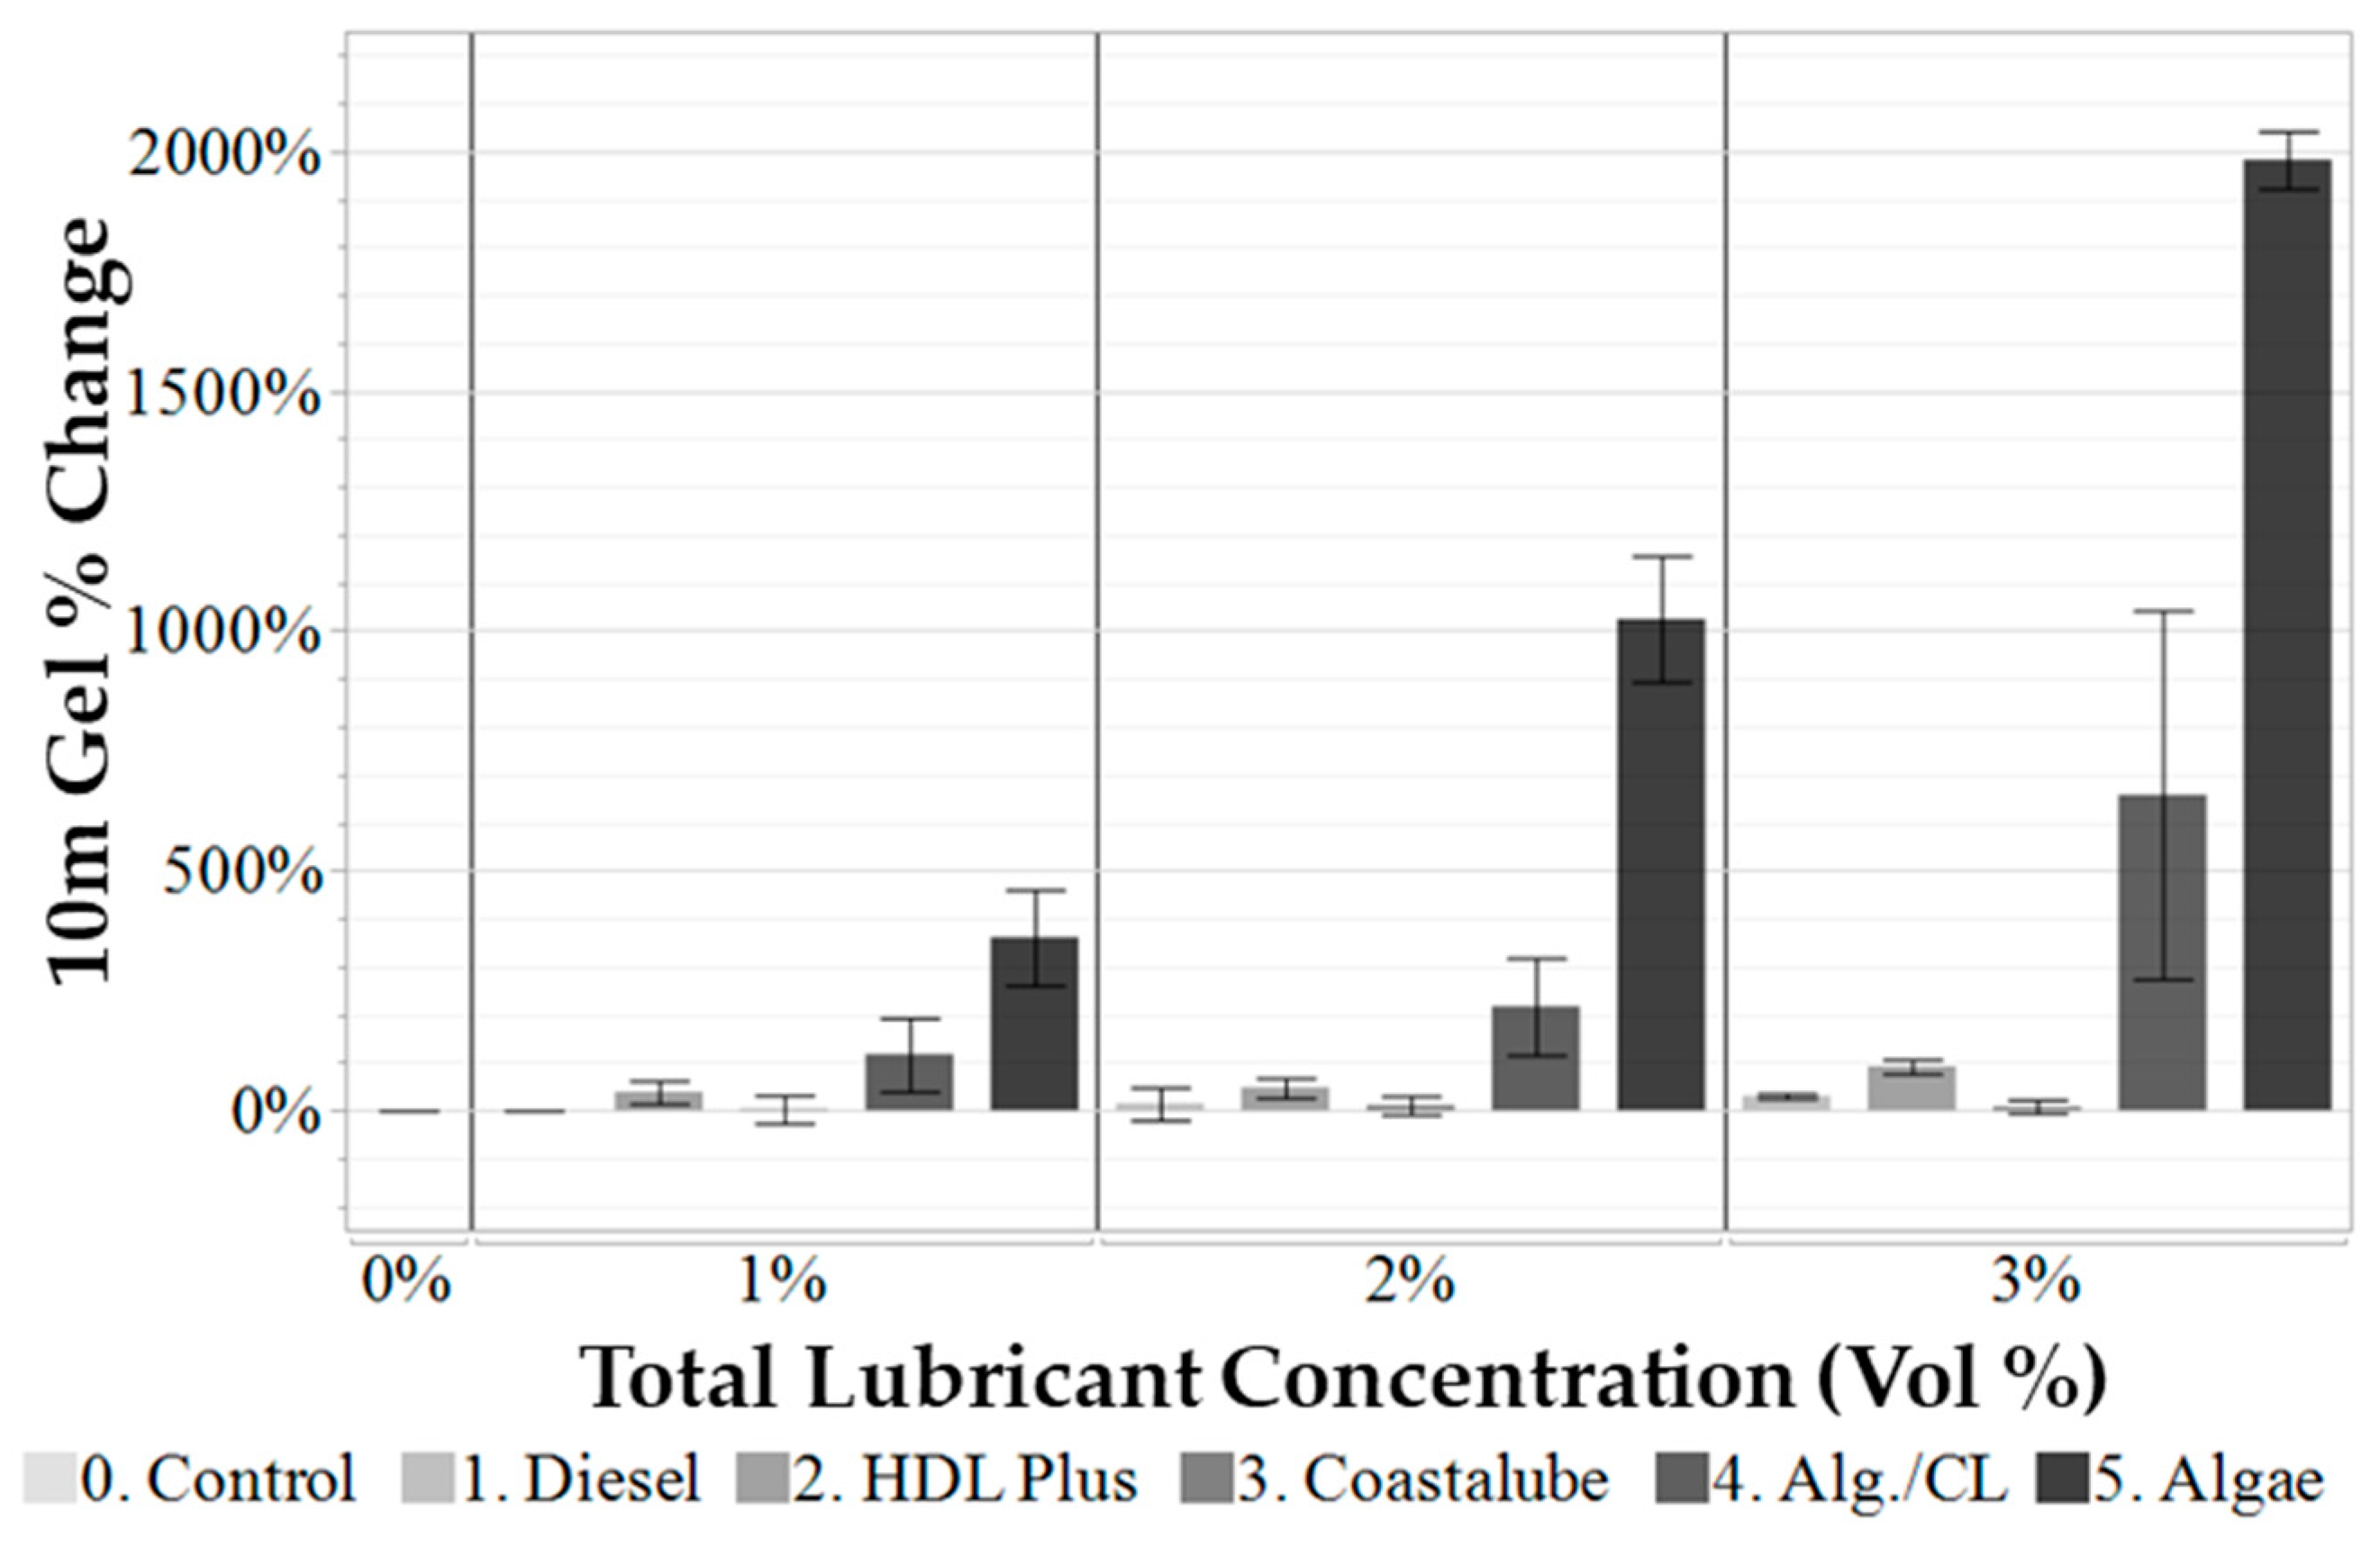
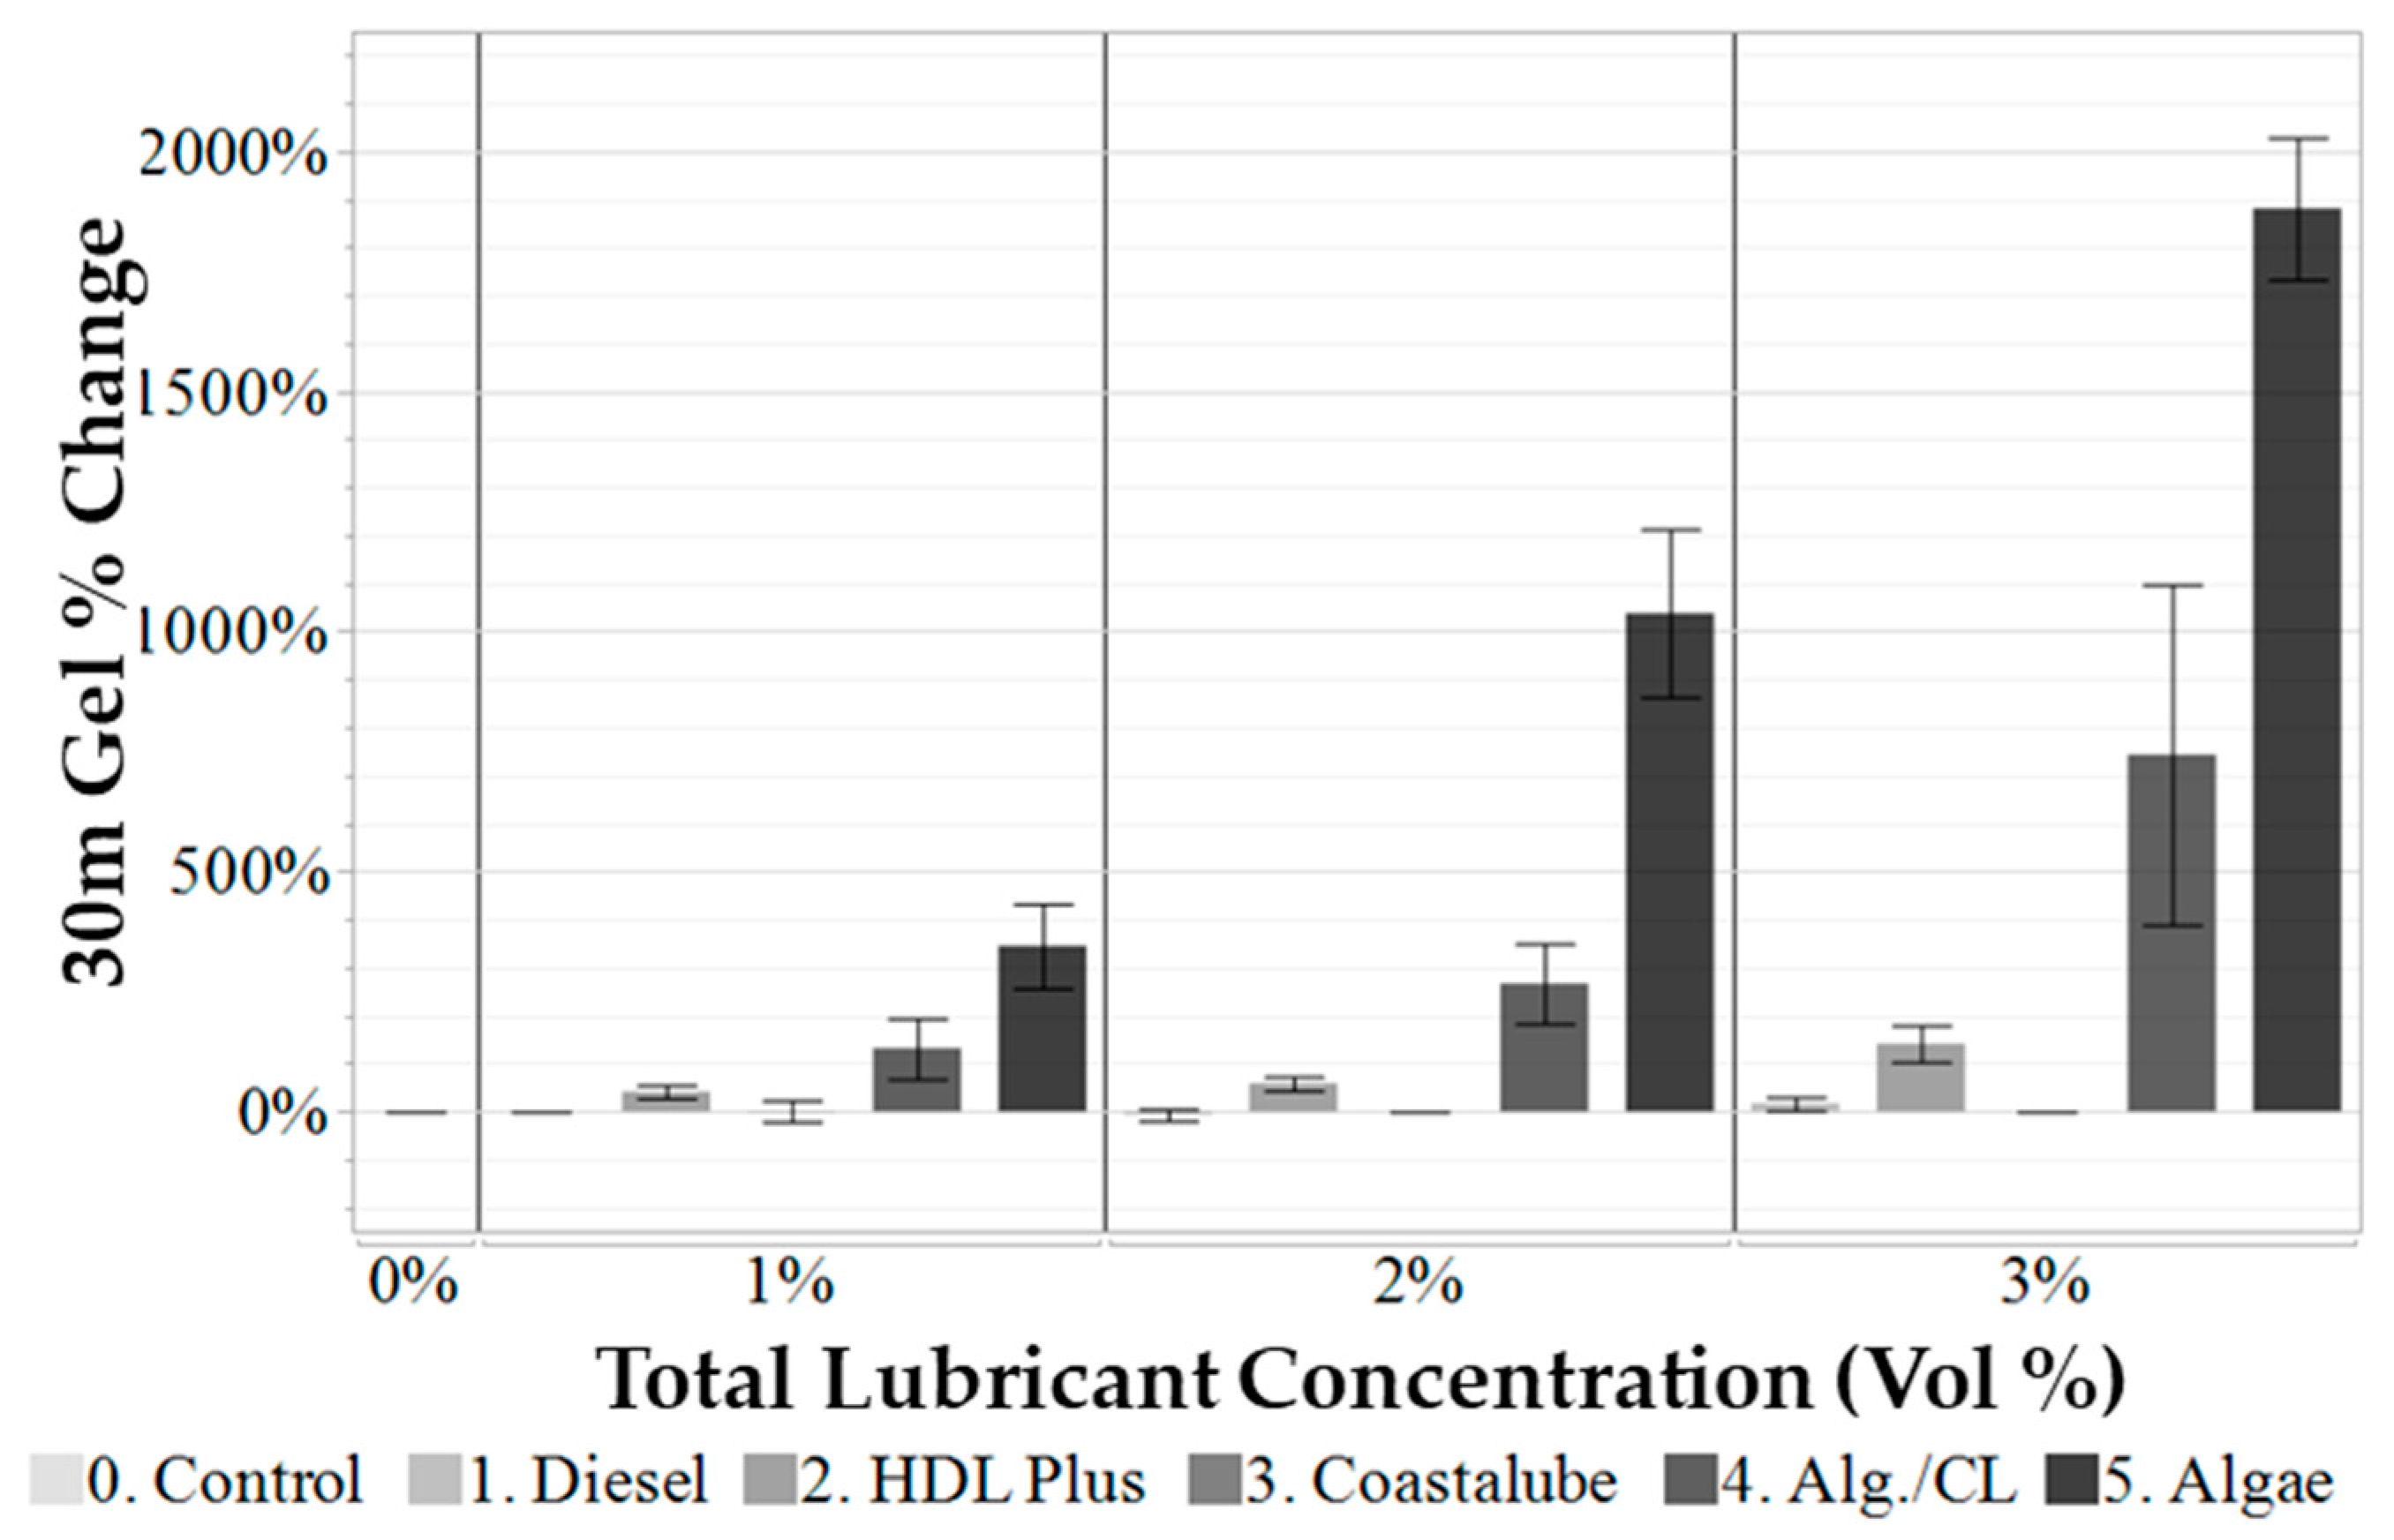
Gel strength assesses a fluid’s capacity to sustain its viscosity after a short duration of static rest. The results of the ten-second gel strength (Figure 8), ten-minute gel strength (Figure 9), and thirty-minute gel strength (Figure 10) are shown below. Though the gel strength readings were measured in viscometer units—degrees of deflection (°)—they are often reported in units of pounds force per hundred square feet (lbf/100 ft2) because the conversion is nearly one (1). Figure 11, Figure 12 and Figure 13 show the percent change in each of these terms relative to the control fluid. The error bars indicate the standard deviation of the results from triplicate measurements. The gel strength results are mostly unaffected by the presence of diesel or Coastalube, though HDL Plus shows a slight benefit and the Spirulina and Spirulina–Coastalube samples show a larger increase. The relative sample gel strength increase may appear to be very high as a result of the control fluid’s low gel strength. The increase in gel strength from only adding Spirulina ranged from approximately 300% to nearly 2000%, while the Spirulina–CL fluid increased gel strength by 100% and 750% at the same loading.
For all three time intervals that gel strength measurements were taken, the Spirulina gel strength was significantly higher than any of the other tested lubricants, although the Spirulina–CL mix also showed an increase in this value. Gel strength is important to a drilling fluid because it helps to maintain the suspension of cuttings and other solids when circulation is stopped, which can often be a problem area for water-based fluids. In most applications where a lubricant is needed, such as highly deviated or small-diameter wells, there will also be a need for a fluid with a proper cutting suspension to reduce the risk of differential sticking. The potential downside is a situation in which equivalent circulating density (ECD) is an issue. A fluid with a higher gel strength will put greater demand on circulating equipment when restarting circulation, and the drastically higher values of the Spirulina powder fluid could be a problem. However, this can again be mitigated by choosing to use the mix of Spirulina and Coastalube instead of just Spirulina.

3.2. Fluid Loss

The formulation’s ability to reduce or mitigate fluid loss to permeable rock formations can be evaluated through high pressure + high temperature filtrate testing. The results of the filtrate tests, as displayed in Figure 14 and Figure 15, show the percentage of change in filtrate volume from the control fluid sample [19]. The error bars indicate the standard deviation of the results from triplicate measurements. With fluid loss reductions of 28% and 52% at the low and high loading levels, the Spirulina powder exhibited the greatest performance across all concentrations. One may note that at concentrations of 2% lubricant, the Spirulina and Spirulina–CL fluids had nearly identical behaviors, despite the Spirulina–CL fluid having 50% less Spirulina in the composition.
As most lubricants are thin liquids with little to no solid content, it is not typical to see a major effect on the drilling fluid’s performance on its fluid loss capabilities [25]. Though some reduction in filtrate volume was observed for diesel, HDL Plus, and Coastalube, the overall results are within the margin of error, and no clear trend can be found between the concentration of lubricant and fluid loss. In the samples containing Spirulina, however, there is a further reduction in fluid loss with each increase in concentration. The mix does not perform as well as the Spirulina alone, which could mean that the fluid loss reduction is mainly due to the increase in solids content. The fluid loss reduction from this study is compared with other studies from the literature in Table 5. Though this is not the main driver or performance indicator for most lubricants, it is an added benefit that can help to increase the marketability and value of Spirulina as a solution to multiple problems.

3.3. Lubricity

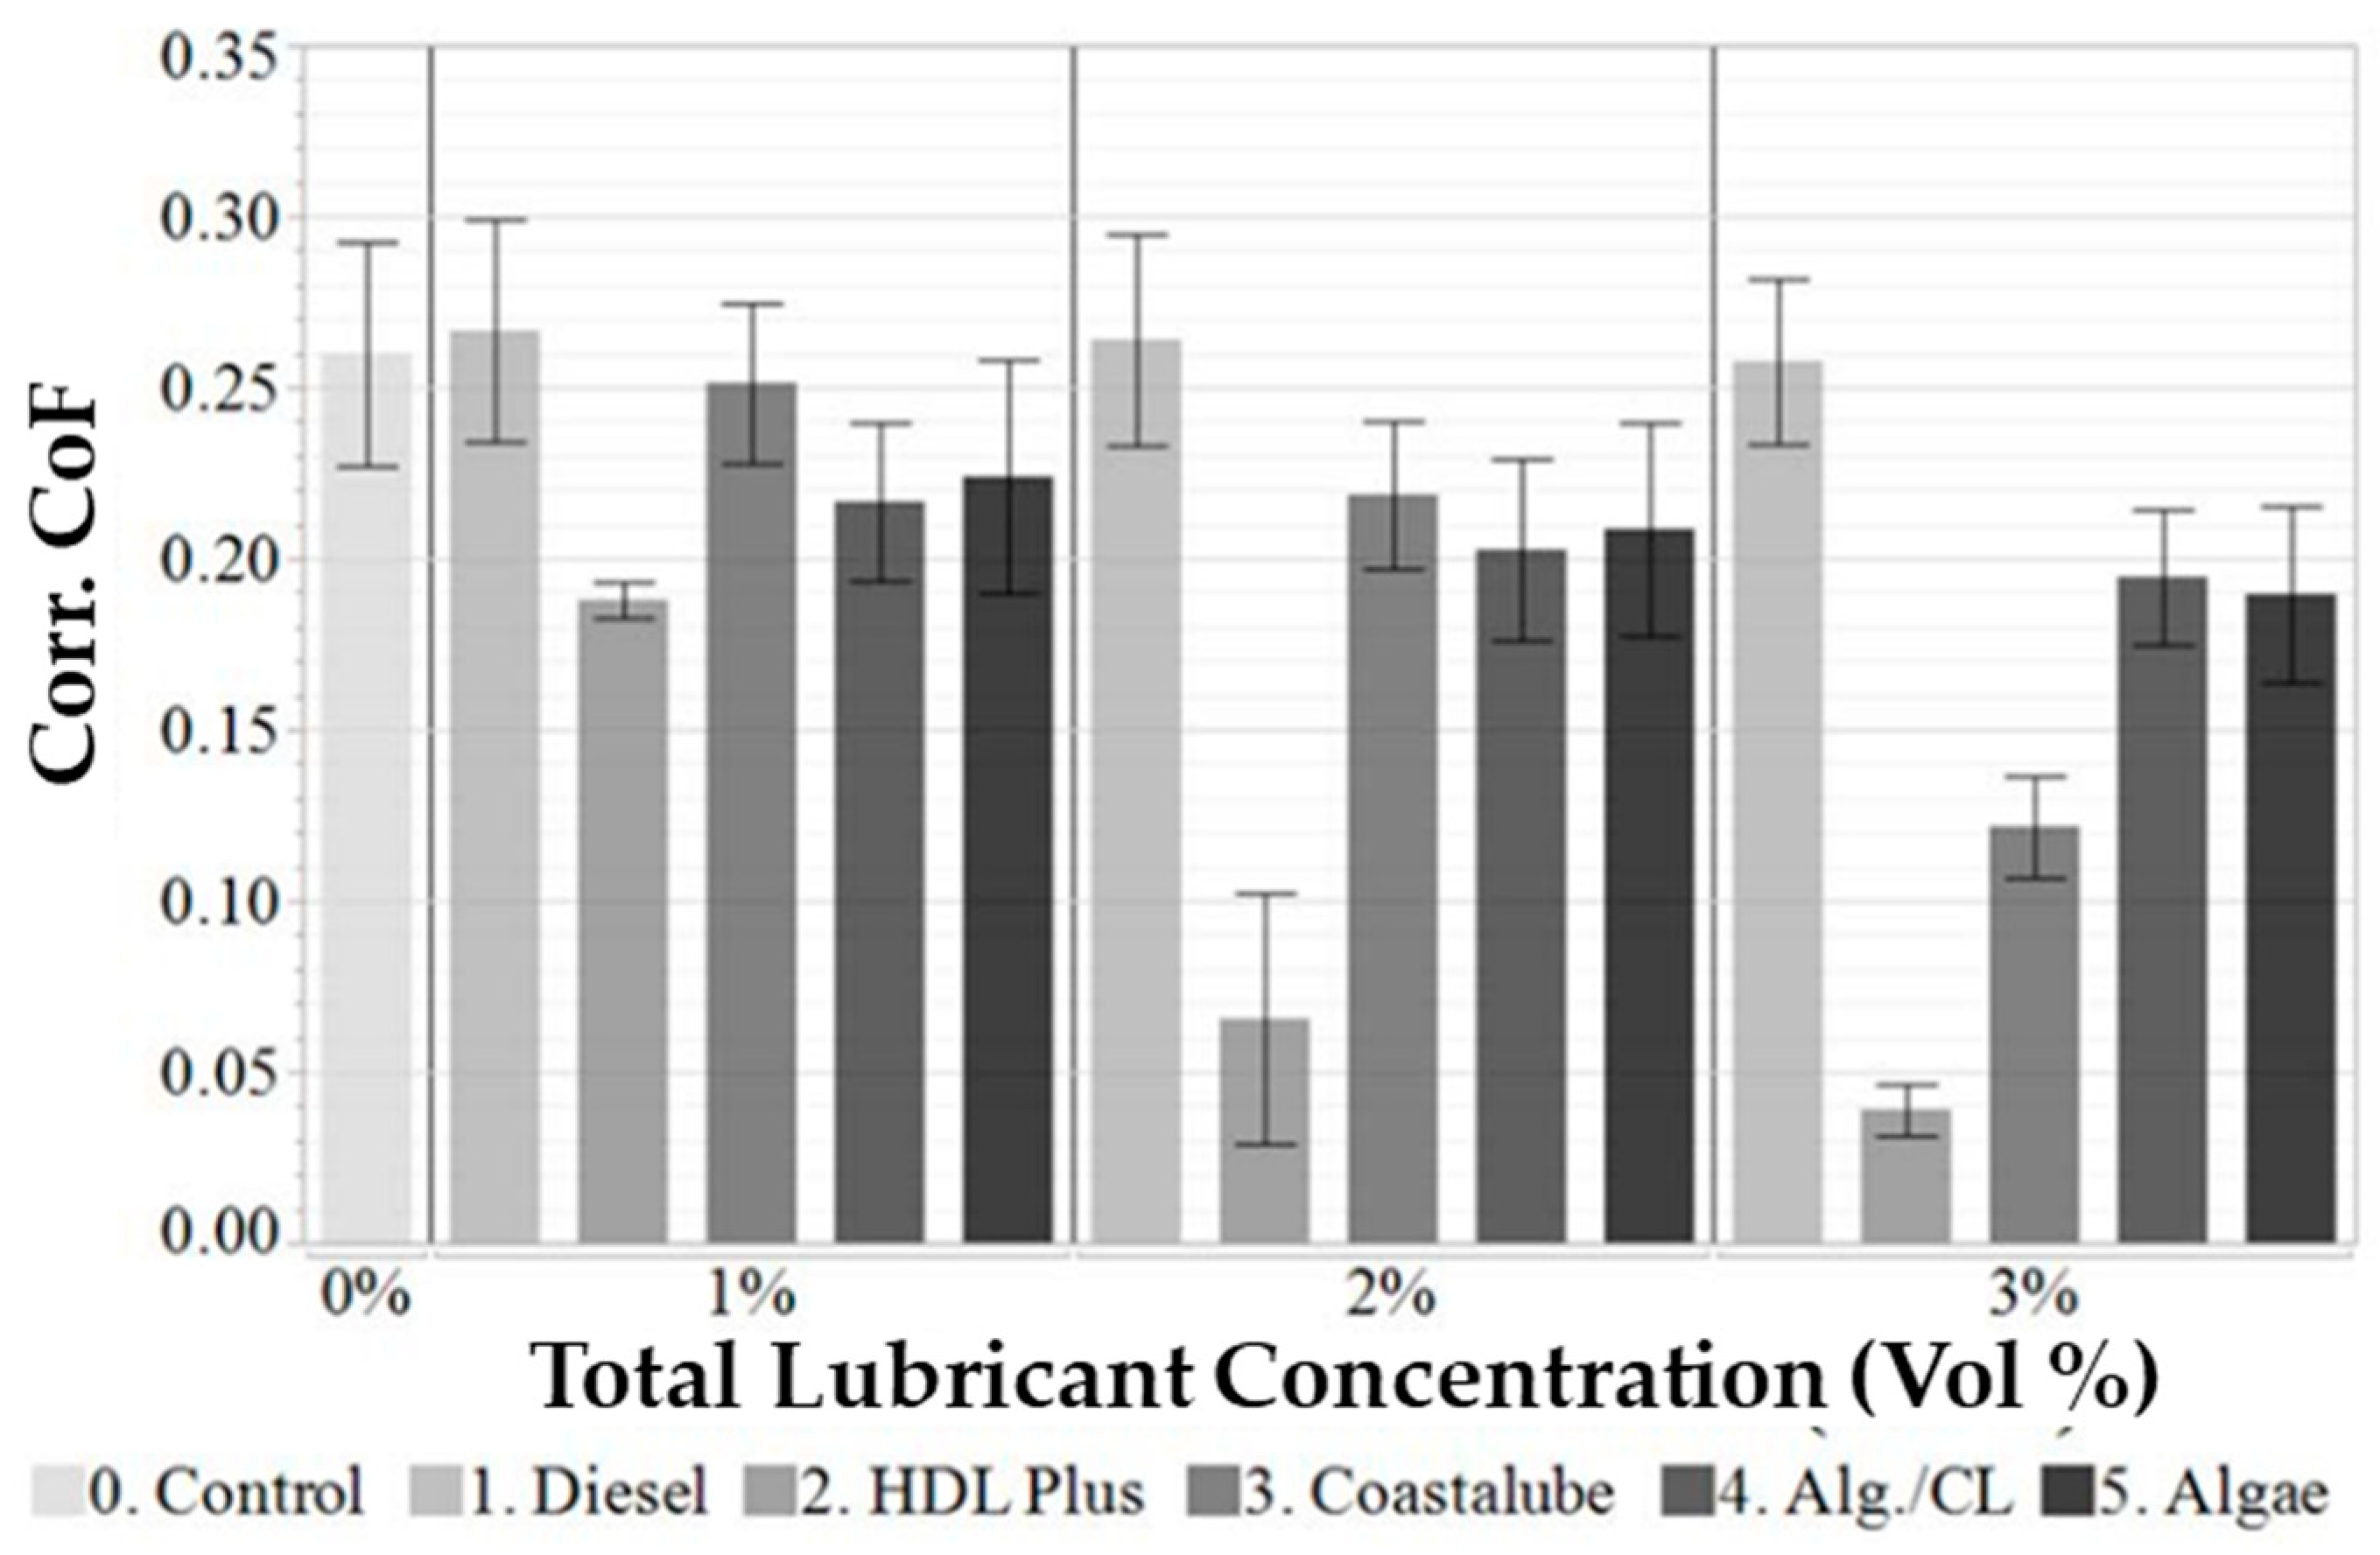
The reduction in a fluid’s coefficient of friction is a highly effective means to assess the lubricating properties of a fluid. Figure 16 displays all of the corrected coefficient of friction reduction values for each of the lubricants, which were calculated using Equation (12). The percent change of these values were calculated using Equation (13) and shown in Figure 17. The reported values are averaged from triplicate measurements, and the standard deviation is shown in error bars. HDL Plus exhibited the best coefficient of friction reduction at every concentration. However, one should note the Spirulina–CL fluid outperformed the Coastalube fluid at one percent and two percent concentrations. Across all concentrations, the Spirulina–CL mix performed as well as the Spirulina fluid despite the Spirulina–CL fluid having 50% less Spirulina in the composition.
The main focus of this study was to evaluate the lubrication performance of Spirulina powder as an additive for drilling fluids, primarily as assessed through the coefficient of friction. Though the HDL Plus performed the best by far, it contains EPA-regulated components regarding discharge, which limits its application in the United States and other areas. Even when the performance of Coastalube increases at the highest concentration, it does not measure up to the premium HDL Plus lubricant. This gap in performance is common since many of the components that make up high-quality lubricants are hazardous. The Spirulina powder reduced the coefficient of friction by 54%, 70%, and 91% at each increasing concentration. These values outperformed the diesel and Coastalube, except for Coastalube at three (3) percent by volume. This means that the Spirulina powder can compete with the commercially available Coastalube lubricant while giving additional rheological and fluid loss benefits that the Coastalube lubricant cannot provide. A comparison of lubricity improvement from this study with values from the literature is shown in Table 6. This combined with its low cost make the Spirulina powder a very attractive choice as an additive. Additionally, the performance of the Spirulina–Coastalube mix was not significantly different from that of the Spirulina alone. This would provide another option for situations in which a higher viscosity or solids content could cause other issues. The user still gains lubricity performance and some of the cost benefit while mitigating potential hydraulic issues.

4. Conclusions

This work presents the first comparative study evaluating the performance of Spirulina biomass as a potential waste-derived drilling fluid additive to enhance lubricity. Although the premium lubricant outperformed the Spirulina powder, it contains EPA-regulated components regarding discharge [35] and, therefore, is not a direct competitor as an environmentally benign dischargeable drilling fluid component. The results showed that similar lubricity performance could be achieved with the Spirulina and Coastalube mixed and the Spirulina alone. The mix can obtain the benefits of the Spirulina while only using half as much of the Coastalube product, which has the potential to substantially reduce operating costs. The other benefit of using the mix of the two is that the viscosity increase is severely scaled back from that of the Spirulina alone. This is desirable since the higher concentrations of Spirulina alone increased the viscosity of the fluid well beyond what was necessary. Overall, the Spirulina powder has a long list of drivers for using it as a lubricating additive or rheological modifier in drilling fluid formulations. The next steps for the course of this research are to study the stability and lubrication properties at higher temperatures, identify the lubricating mechanism (s) of the Spirulina biomass, and study the biodegradability of the Spirulina-based drilling fluids. This technology may be particularly valuable for use where there may be discharge to environmentally sensitive areas.

Supplementary Materials

The following supporting information can be downloaded at: https://www.mdpi.com/article/10.3390/lubricants13040149/s1, Table S1: p-Values of various properties vs. the independent variables of the different lubricants’ concentrations.

Author Contributions

G.M.T.: conceptualization, methodology, investigation, writing—original draft, writing—review and editing. N.A.B.: investigation, writing—original draft, writing—review and editing. W.M.C.: conceptualization, writing—review and editing, supervision, project administration. All authors have read and agreed to the published version of the manuscript.

Funding

This research received no external funding.

Data Availability Statement

The original contributions presented in the study are included in the article/supplementary material, further inquiries can be directed to the corresponding author.

Acknowledgments

The authors wish to acknowledge the student funding from the Graduate School of the University of Louisiana at Lafayette and supply funding from the Stuller Family/BoRSF Professorship. The authors thank Sloan Spears, Felipe Morado, Abdennour Seibi, and Carl McIntyre for providing insight and guidance.

Conflicts of Interest

The authors declare no conflict of interest.

References

  1. Batubara, M.; Purwanto, W.W.; Fauzi, A. Proposing a decision-making process for the development of sustainable oil and gas resources using the petroleum fund: A case study of the East Natuna gas field. Resour. Policy 2016, 49, 372–384. [Google Scholar] [CrossRef]
  2. Li, X.; Sun, L.; Lv, X.; Qi, J.; Lu, H.; Wu, Y.; Wang, B. Sustainable separation of petroleum hydrocarbons pollutant using hydrophobic deep eutectic solvents regulated by CO2. J. Environ. Chem. Eng. 2021, 9, 106280. [Google Scholar] [CrossRef]
  3. Tamala, J.K.; Maramag, E.I.; Simeon, K.A.; Ignacio, J.J. A bibliometric analysis of sustainable oil and gas production research using VOSviewer. Clean. Eng. Technol. 2022, 7, 100437. [Google Scholar] [CrossRef]
  4. Basik, M.; Mobin, M. 20—Environmentally sustainable corrosion inhibitors in the oil and gas industry. In Environmentally Sustainable Corrosion Inhibitors; Hussain, C.M., Verma, C., Aslam, J., Eds.; Elsevier: Amsterdam, The Netherlands, 2022; pp. 405–421. [Google Scholar] [CrossRef]
  5. Defining Sustainability in the Oil and Gas Industry. Available online: https://www.hydrocarbonprocessing.com/conference-news/2019/10/defining-sustainability-in-the-oil-and-gas-industry (accessed on 19 March 2022).
  6. National Pollutant Discharge Elimination System (NPDES) | California State Water Quality Control Board. n.d. Available online: https://www.waterboards.ca.gov/water_issues/programs/npdes/drinkingwatersystems.html (accessed on 19 March 2022).
  7. Arthur, J.D.; Hochheiser, H.W. Sustainable Drilling of Onshore Oil and Gas Wells; Department of Energy: Washington, DC, USA, 2011; pp. 1–19. [Google Scholar]
  8. Zhou, S.; Song, J.; Xu, P.; He, M.; Xu, M.; You, F. A review on tribology, characterization and lubricants for water-based drilling fluids. Geoenergy Sci. Eng. 2023, 229, 212074. [Google Scholar] [CrossRef]
  9. Agwu, O.E.; Akpabio, J.U. Using agro-waste materials as possible filter loss control agents in drilling muds: A review. J. Pet. Sci. Eng. 2018, 163, 185–198. [Google Scholar] [CrossRef]
  10. Zaleski, P.L.; Derwin, D.J.; Weintritt, D.J.; Russel, G.W. Drilling Fluid Loss Prevention and Lubrication Additive. Available online: https://patents.google.com/patent/US582669A/en (accessed on 18 March 2025).
  11. Sönmez, A.; Verşan Kök, M.; Özel, R. Performance analysis of drilling fluid liquid lubricants. J. Pet. Sci. Eng. 2013, 108, 64–73. [Google Scholar] [CrossRef]
  12. Thibodeaux, G.M.; Baudoin, N.A.; Chirdon, W.M. Investigation of proteinaceous algal biomass as a drilling fluid component. Results Eng. 2023, 19, 101364. [Google Scholar] [CrossRef]
  13. Chirdon, W.M. Utilization of biorefinery waste proteins as feed, glues, composites, and other co-products. In Algal Biorefineries: Volume 2: Products and Refinery Design; Springer: Cham, Switzerland, 2015. [Google Scholar] [CrossRef]
  14. Schexnayder, P.; Baudoin, N.; Chirdon, W.M. Enhanced oil recovery from denatured algal biomass: Synergy between conventional and emergent fuels. Fuel 2020, 287, 119533. [Google Scholar] [CrossRef]
  15. EPA Office of Land U, Management E. List of Lists: Consolidated List of Chemicals Subject to the Emergency Planning and Community Right- To-Know Act (EPCRA), Comprehensive Environmental Response, Compensation and Liability Act (CERCLA) and Section 112(r) of the Clean Air Act. 1986. Available online: https://www.epa.gov/system/files/documents/2024-11/consolidated-list-of-lists_updated-october-2024.pdf (accessed on 18 March 2025).
  16. Com, S. Enhancing Your Value Horizons SUN’S COASTALUBE ® CT EXCEPTIONAL COIL TUBING LUBRICITY USING SUN’S PAO TECHNOLOGY. Available online: https://sunspecialtyproducts.com/coastalube-ct/ (accessed on 18 March 2025).
  17. Chirdon, W.M.; Schexnayder, P.F.; Thibodeaux, G.M.; Baudoin, N.A. Sustainable Agents for Enhanced Oil Recovery and Drilling Additives Derived from Microbial Biomass. U.S. Patent 11739253, 29 August 2023. [Google Scholar]
  18. OFITE. Model 900 Viscometer Instruction Manual 2015. Available online: https://www.manualslib.com/manual/1231559/Ofite-900.html (accessed on 18 March 2025).
  19. American Petroleum Institute. Recommended Practice for Field Testing of Water-based Drilling Fluids; API Recomm: Washington, DC, USA, 2016. [Google Scholar]
  20. Wiśniowski, R.; Skrzypaszek, K.; Małachowski, T. Selection of a suitable rheological model for drilling fluid using applied numerical methods. Energies 2020, 13, 3192. [Google Scholar] [CrossRef]
  21. OFITE. 4-Unit HTHP Filter Press with Load Cell Option Manual; OFITE: Aracaju, Brasil, 2015; Available online: https://www.manualslib.com/manual/1593603/Ofite-170-00-4s.html (accessed on 18 March 2025).
  22. OFITE. EP (Extreme Pressure) and Lubricity Tester Instruction Manual; OFI Testing Equipment, Inc.: Aracaju, Brasil, 2015; Available online: https://www.manualslib.com/manual/2060618/Ofite-112-00.html (accessed on 18 March 2025).
  23. American Petroleum Institute. Rheology and Hydraulics of Oil-Well Drilling Fluids; Api Recommended Practice: Washington, DC, USA, 2010. [Google Scholar]
  24. Chronakis, I.S. Gelation of edible blue-green algae protein isolate (Spirulina platensis Strain Pacifica): Thermal transitions, rheological properties, and molecular forces involved. J. Agric. Food Chem. 2001, 49, 888–898. [Google Scholar] [CrossRef] [PubMed]
  25. Murtaza, M.; Alarifi, S.A.; Abozuhairah, A.; Mahmoud, M.; Onaizi, S.A.; Al-Ajmi, M. Optimum Selection of H2S Scavenger in Light-Weight and Heavy-Weight Water-Based Drilling Fluids. ACS Omega 2021, 6, 24919–24930. [Google Scholar] [CrossRef] [PubMed]
  26. Amanullah, M.; Ramasamy, J.; Al-Arfaj, M.K.; Aramco, S. Application of an indigenous eco-friendly raw material as fluid loss additive. J. Pet. Sci. Eng. 2016, 139, 191–197. [Google Scholar] [CrossRef]
  27. Barry, M.M.; Jung, Y.; Lee, J.-K.; Phuoc, T.X.; Chyu, M.K. Fluid filtration and rheological properties of nanoparticle additive and intercalated clay hybrid bentonite drilling fluids. J. Pet. Sci. Eng. 2015, 127, 338–346. [Google Scholar] [CrossRef]
  28. Ismail, A.R.; Aftab, A.; Ibupoto, Z.H.; Zolkifile, N. The novel approach for the enhancement of rheological properties of water-based drilling fluids by using multi-walled carbon nanotube, nanosilica and glass beads. J. Pet. Sci. Eng. 2016, 139, 264–275. [Google Scholar] [CrossRef]
  29. Tripuraneni, G.C. Performance Analysis of Enhanced Activated Sludge as Drilling Mud Additive; University of Louisiana at Lafayette: Lafayette, LA, USA, 2017. [Google Scholar]
  30. Geng, Y.; Zhang, Z.; Yan, Z.; Yuan, Y.; Zhou, X.; Yue, W.; An, Y. A novel graphene/triolein complex-based lubricant for improving high temperature water-based drilling fluid. RSC Adv. 2023, 13, 34772–34781. [Google Scholar] [CrossRef] [PubMed]
  31. Dong, X.; Wang, L.; Yang, X.; Lin, Y.; Xue, Y. Effect of ester based lubricant SMJH-1 on the lubricity properties of water based drilling fluid. J. Pet. Sci. Eng. 2015, 135, 161–167. [Google Scholar] [CrossRef]
  32. Ma, C.; Wen, R.; Zhou, F.; Zhao, H.; Bao, X.; Evelina, A.; Long, W.; Wei, Z.; Ma, L.; Liu, J.; et al. Preparation and application of an environmentally friendly compound lubricant based biological oil for drilling fluids. Arab. J. Chem. 2022, 15, 103610. [Google Scholar] [CrossRef]
  33. Mueller, H.; Herold, C.-P.; Von Tapavicza, S. Use of Selected Fatty Alcohols and Their Mixtures with Carboxylic Acid Esters As lubricant Components in Water-Based Drilling Fluid Systems for Soil Exploration. U.S. Patent 6,716,799, 6 April 2004. [Google Scholar]
  34. Liu, S.Q.; Chen, Z.R.; Meng, Q.N.; Zhou, H.L.; Li, C.; Liu, B.C. Effect of graphene and graphene oxide addition on lubricating and friction properties of drilling fluids. Nanosci. Nanotechnol. Lett. 2017, 9, 446–452. [Google Scholar] [CrossRef]
  35. Young, N. The NPDES General Permit for New and Existing Sources and New Dischargers in the Offshore Subcategory of the Oil and Gas Extraction Point Source Category for the Western Portion of the Outer Continental Shelf of the Gulf of Mexico (GMG290000). Available online: https://www.epa.gov/system/files/documents/2023-05/2023%20GMG290000%20Final%20Permit%20dated%20and%20signed_508.pdf (accessed on 18 March 2025).
Figure 1. Plastic viscosity (PV) raw data vs. lubricant type and concentration [17].
Lubricants 13 00149 g001
Figure 2. Yield point (YP) raw data vs. lubricant type and concentration [17]. Note: 1 lbf/ft2 = 47.9 Pa.
Lubricants 13 00149 g002
Figure 3. Plastic viscosity (PV) percent change vs. lubricant type and concentration [17].
Lubricants 13 00149 g003
Figure 4. Yield point (YP) percent change vs. lubricant type and concentration [17].
Lubricants 13 00149 g004
Figure 5. Bivariate fit of Δτy vs. different lubricant concentrations of (A) diesel, (B) HDL Plus, (C) Coastalube, (D) 50:50 Coastalube–Spirulina, and (E) Spirulina. The points represent calculations from each tested fluid along with a red, best-fit line for the data.
Lubricants 13 00149 g005
Figure 6. Bivariate fit of Δk vs. different lubricant concentrations of (A) diesel, (B) HDL Plus, (C) Coastalube, (D) 50:50 Coastalube–Spirulina, and (E) Spirulina. The points represent calculations from each tested fluid along with a red, best-fit line for the data.
Lubricants 13 00149 g006
Figure 7. Bivariate fit of Δn vs. different lubricant concentrations of (A) diesel, (B) HDL Plus, (C) Coastalube, (D) 50:50 Coastalube–Spirulina, and (E) Spirulina. The points represent calculations from each tested fluid along with a red, best-fit line for the data.
Lubricants 13 00149 g007
Figure 8. Ten-second gel raw data vs. lubricant type and concentration [17]. Note: 1 lbf/ft2 = 47.9 Pa.
Lubricants 13 00149 g008
Figure 9. Ten-minute gel raw data vs. lubricant type and concentration [17]. Note: 1 lbf/ft2 = 47.9 Pa.
Lubricants 13 00149 g009
Figure 10. Thirty-minute gel raw data vs. lubricant type and concentration [17].
Lubricants 13 00149 g010
Figure 11. Ten-second gel percent change vs. lubricant type and concentration [17].
Lubricants 13 00149 g011
Figure 12. Ten-minute gel percent change vs. lubricant type and concentration [17].
Lubricants 13 00149 g012
Figure 13. Thirty-minute gel percent change vs. lubricant type and concentration [17].
Lubricants 13 00149 g013
Figure 14. High-pressure, high-temperature filtrate volume vs. lubricant type and concentration [17].
Lubricants 13 00149 g014
Figure 15. High-pressure, high-temperature filtrate volume change vs. lubricant type and concentration [17].
Lubricants 13 00149 g015
Figure 16. Corrected coefficient of friction (CoF) results vs. lubricant type and concentration [17].
Lubricants 13 00149 g016
Figure 17. Corrected coefficient of friction (CoF) change vs. lubricant type and concentration [17].
Lubricants 13 00149 g017
Table 1. Components of base drilling fluid, functions, and concentrations [12].
ComponentFunctionConcentration (lb/bbl)
Tap waterBase fluidVaried
Gel NT (bentonite)Viscosifier20.0
Organic polymerDefoamer0.99
Caustic sodapH modifier0.50
LigniteThinner2.00
DescoDeflocculant2.00
Xanthan gumViscosifier0.50
BariteWeighting agentVaried
Lubricant—variedLubricationSee Table 2
Note: 1 lb/bbl is equal to 1.29 kg/L.
Table 2. List of fluids studied with the lubricant added to base formulation.
Fluid ID.Lubricant TypeConcentration (vol.%)
1None0.0
2Spirulina1.0
3Spirulina2.0
4Spirulina3.0
5Diesel1.0
6Diesel2.0
7Diesel3.0
8HDL Plus1.0
9HDL Plus2.0
10HDL Plus3.0
11Coastalube1.0
12Coastalube2.0
13Coastalube3.0
14Spirulina and Coastalube0.5 and 0.5
15Spirulina and Coastalube1.0 and 1.0
16Spirulina and Coastalube1.5 and 1.5
Table 3. Fitted Herschel–Bulkley parameters for fluids studied.
Fluid IDLubricant TypeConcentration (vol.%)τykn
1None0.01.7780.2540.712
2Spirulina1.06.0000.7630.649
3Spirulina2.014.0000.9280.668
4Spirulina3.025.6671.0220.723
5Diesel1.01.6670.2390.720
6Diesel2.00.3330.2690.698
7Diesel3.01.6670.3030.693
8HDL Plus1.02.6670.2970.713
9HDL Plus2.03.0000.2950.732
10HDL Plus3.03.3330.5370.672
11Coastalube1.01.3330.3410.682
12Coastalube2.01.3330.2920.704
13Coastalube3.01.6670.3240.697
14Spirulina and Coastalube0.5 and 0.53.3330.4000.709
15Spirulina and Coastalube1.0 and 1.05.3330.4640.735
16Spirulina and Coastalube1.5 and 1.510.0000.7190.707
Table 4. Significance of H-B parameters vs. concentration of lubricant from least squares fit.
Lubricant Type τ y kn
SpirulinaVSXVS
DieselXXX
HDL PlusXSX
CoastalubeXXX
Spirulina and CoastalubeVSXX
VS: very significant; S: significant; X: not significant.
Table 5. Comparison of HTHP fluid loss reduction in this study with values from the literature.
Lubricant TypeSourceConcentration (vol.%)
<1%1%2%3%
Diesel--−12%−5%−15%
HDL Plus--−7%−14%−1%
Coastalube--−16%−17%−19%
Spirulina and Coastalube--−16%−31%−33%
Spirulina--−28%−33%−51%
Date Seed Powder[26]-−60%--
Iron-oxide Nanoparticles[27]−28%---
Iron-oxide Clay Hybrid[27]−47%---
Aluminosilicate Clay Hybrid[27]−20%---
Table 6. Comparison of % change in the coefficient of friction in this study with values from the literature.
Lubricant TypeSourceConcentration (vol.%)
<1%1%2%3%
Diesel--−2%−3%−5%
HDL Plus--−24%−75%−84%
Coastalube--−2%−14%−56%
Spirulina and Coastalube--−19%−24%−28%
Spirulina--−18%−23%−30%
Nanosilica nanoparticles[28]−15%---
Carbon nanotubes[28]−22%---
Enhanced activated sludge[29]--−38%-
Raw activated sludge[29]--−31%-
Graphene/triolein complex[30]-−41.4%-−60%
SMJH-1[31]-−91.4%--
F-1[32]−88%---
Polyethylene glycol[33]−44.5%---
Graphene oxide[34]−12.5%---
Disclaimer/Publisher’s Note: The statements, opinions and data contained in all publications are solely those of the individual author(s) and contributor(s) and not of MDPI and/or the editor(s). MDPI and/or the editor(s) disclaim responsibility for any injury to people or property resulting from any ideas, methods, instructions or products referred to in the content.