1. Introduction
A linear motion with high accuracy and low friction can be realized using aerostatic linear bearings. Aerostatic linear bearings are widely used in the fields of precision engineering, in which precise linear motion is needed. There have been some studies on the feature of high accuracy of aerostatic linear bearings [
1,
2,
3,
4,
5]. However, most of the studies are focused on the improvement of the accuracy of motion, and there are few studies on the frictional characteristics of the aerostatic linear bearings.
We have been developing a method for precision measurement of dynamic force using an aerostatic linear bearing, which is known as the Levitation Mass Method (LMM). In the LMM, the inertial force of a mass levitated using an aerostatic linear bearing is used as the accurately-measurable force. The LMM has been applied for precision force measurements, such as dynamic calibration of force transducers [
6,
7,
8] and material testers without use of force transducers [
9,
10]. The results of these studies seem to be precise enough; however, there are some ambiguous points concerning the force acting on the moving part of an aerostatic linear bearing and there are few studies on the problem.
In order to solve the problem, we have investigated the frictional characteristics of an aerostatic linear bearing by modifying the LMM [
11]. In the study, it is shown that the dynamic frictional force acting on an aerostatic linear bearing is dependent on the velocity and the position of the bearing. However, there are still some ambiguous points in the frictional characteristics when the inner structure and the size of the bearing are changed.
In this paper, the dynamic frictional characteristics of a very small aerostatic linear bearing are accurately evaluated by modifying the developing method.
2. Experiment
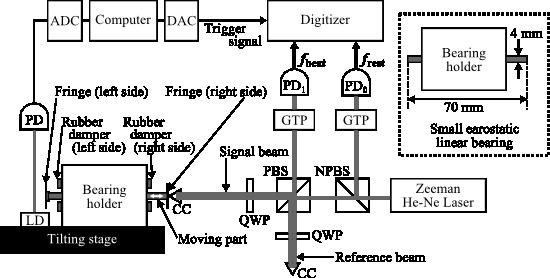
Figure 1 shows the experimental setup for measuring the force acting on the moving part of a small aerostatic linear bearing.
Figure 1.
Experimental setup. Code: LD = Laser diode, PD = Photo detector, CC = Corner cube prism, PBS = Polarizing beam splitter, NPBS = Non-polarizing beam splitter, GTP = Glan-Thompson prism, ADC = Analog-to-digital converter, DAC = Digital-to-analog converter.
Figure 1.
Experimental setup. Code: LD = Laser diode, PD = Photo detector, CC = Corner cube prism, PBS = Polarizing beam splitter, NPBS = Non-polarizing beam splitter, GTP = Glan-Thompson prism, ADC = Analog-to-digital converter, DAC = Digital-to-analog converter.
The small aerostatic linear bearing (GLS04A50/15-2573, NSK Ltd., Tokyo, Japan), with the aluminum sliding block with cuboid shape of 4 mm in height, 4 mm in width, 70 mm in length, which is called the sliding part in this study, is used in the experiment. A small cube-corner prism (CC) with the diameter 1/4 inch is attached to one end of the sliding part. The total mass of the moving part, which consists of the sliding part, fringes and the cube corner prism, is approximately 2.87 g. The range of free sliding of the moving part between the right damper and the left damper is restricted to approximately 20 mm. The direction of the coordinate system for the velocity, position, acceleration, and force is rightward in
Figure 1.
In this experiment, the initial velocity of the moving part is given manually to the fringe of right side in order to make the moving part firstly go to left. The moving part firstly rebounds from the right damper and slides to right. Then, the moving part rebounds from the left damper and slides to left. The moving part continues to slide and rebound until stopping.
The resultant force acting on the moving part can be considered as the product of the total mass of the moving part
M and the acceleration of the moving part
a, under the condition that the moving part is rigid enough. The acceleration
a is calculated by differentiating the velocity
v. The velocity
v is calculated from the Doppler-shift frequency
fDoppler measured in the interferometer, which is described in the Equation (1):
where
λair is the wavelength of the signal beam which is
m in the experiment,
fbeat is the beat frequency, which is the frequency difference between the signal beam and the reference beam, and
frest is the rest frequency which is the value of
fbeat when the moving part is at standstill. The beat frequency
fbeat changes around
frest of approximately 2.7 MHz, depending on the velocity of the moving part.
A Zeeman-type two-frequency He-Ne laser (5517C, Hewlett-Packard Com., Palo Alto, CA, USA) is used as the light source. Two frequency counters (R5363, Advantest Corp., Tokyo, Japan) are used to measure the beat frequency fbeat and the rest frequency frest. The counters measure each frequency 500 times with a sampling interval of , where f is the value of fbeat or frest, without any measurement dead-time. The sampling period of the counter is approximately 15 ms at the frequency of 2.7 MHz.
A sharp trigger is generated by a digital-to-analog converter and the two frequency counters are triggered when the moving part cuts the light switch composed of a laser diode (LD) and a photo detector (PD).
In the experiment, the CC attached to the moving part is too small to offset the beam incident onto the CC itself perfectly. Therefore, some light comes back to the laser head, and the frequencies of the emitted laser lights get unstable by the optical feedback effect. To avoid the optical feedback effect enough, the quarter-wave plates (QWP) are also used. The signal beam firstly passes through the PBS, then, it reflects at the PBS after passing through QWP twice. While the reference beam firstly reflects on the PBS, it then passes through the PBS after passing through QWP twice. By these modifications on the optical interferometer, the laser lights are stable enough in the experiment.
3. Results
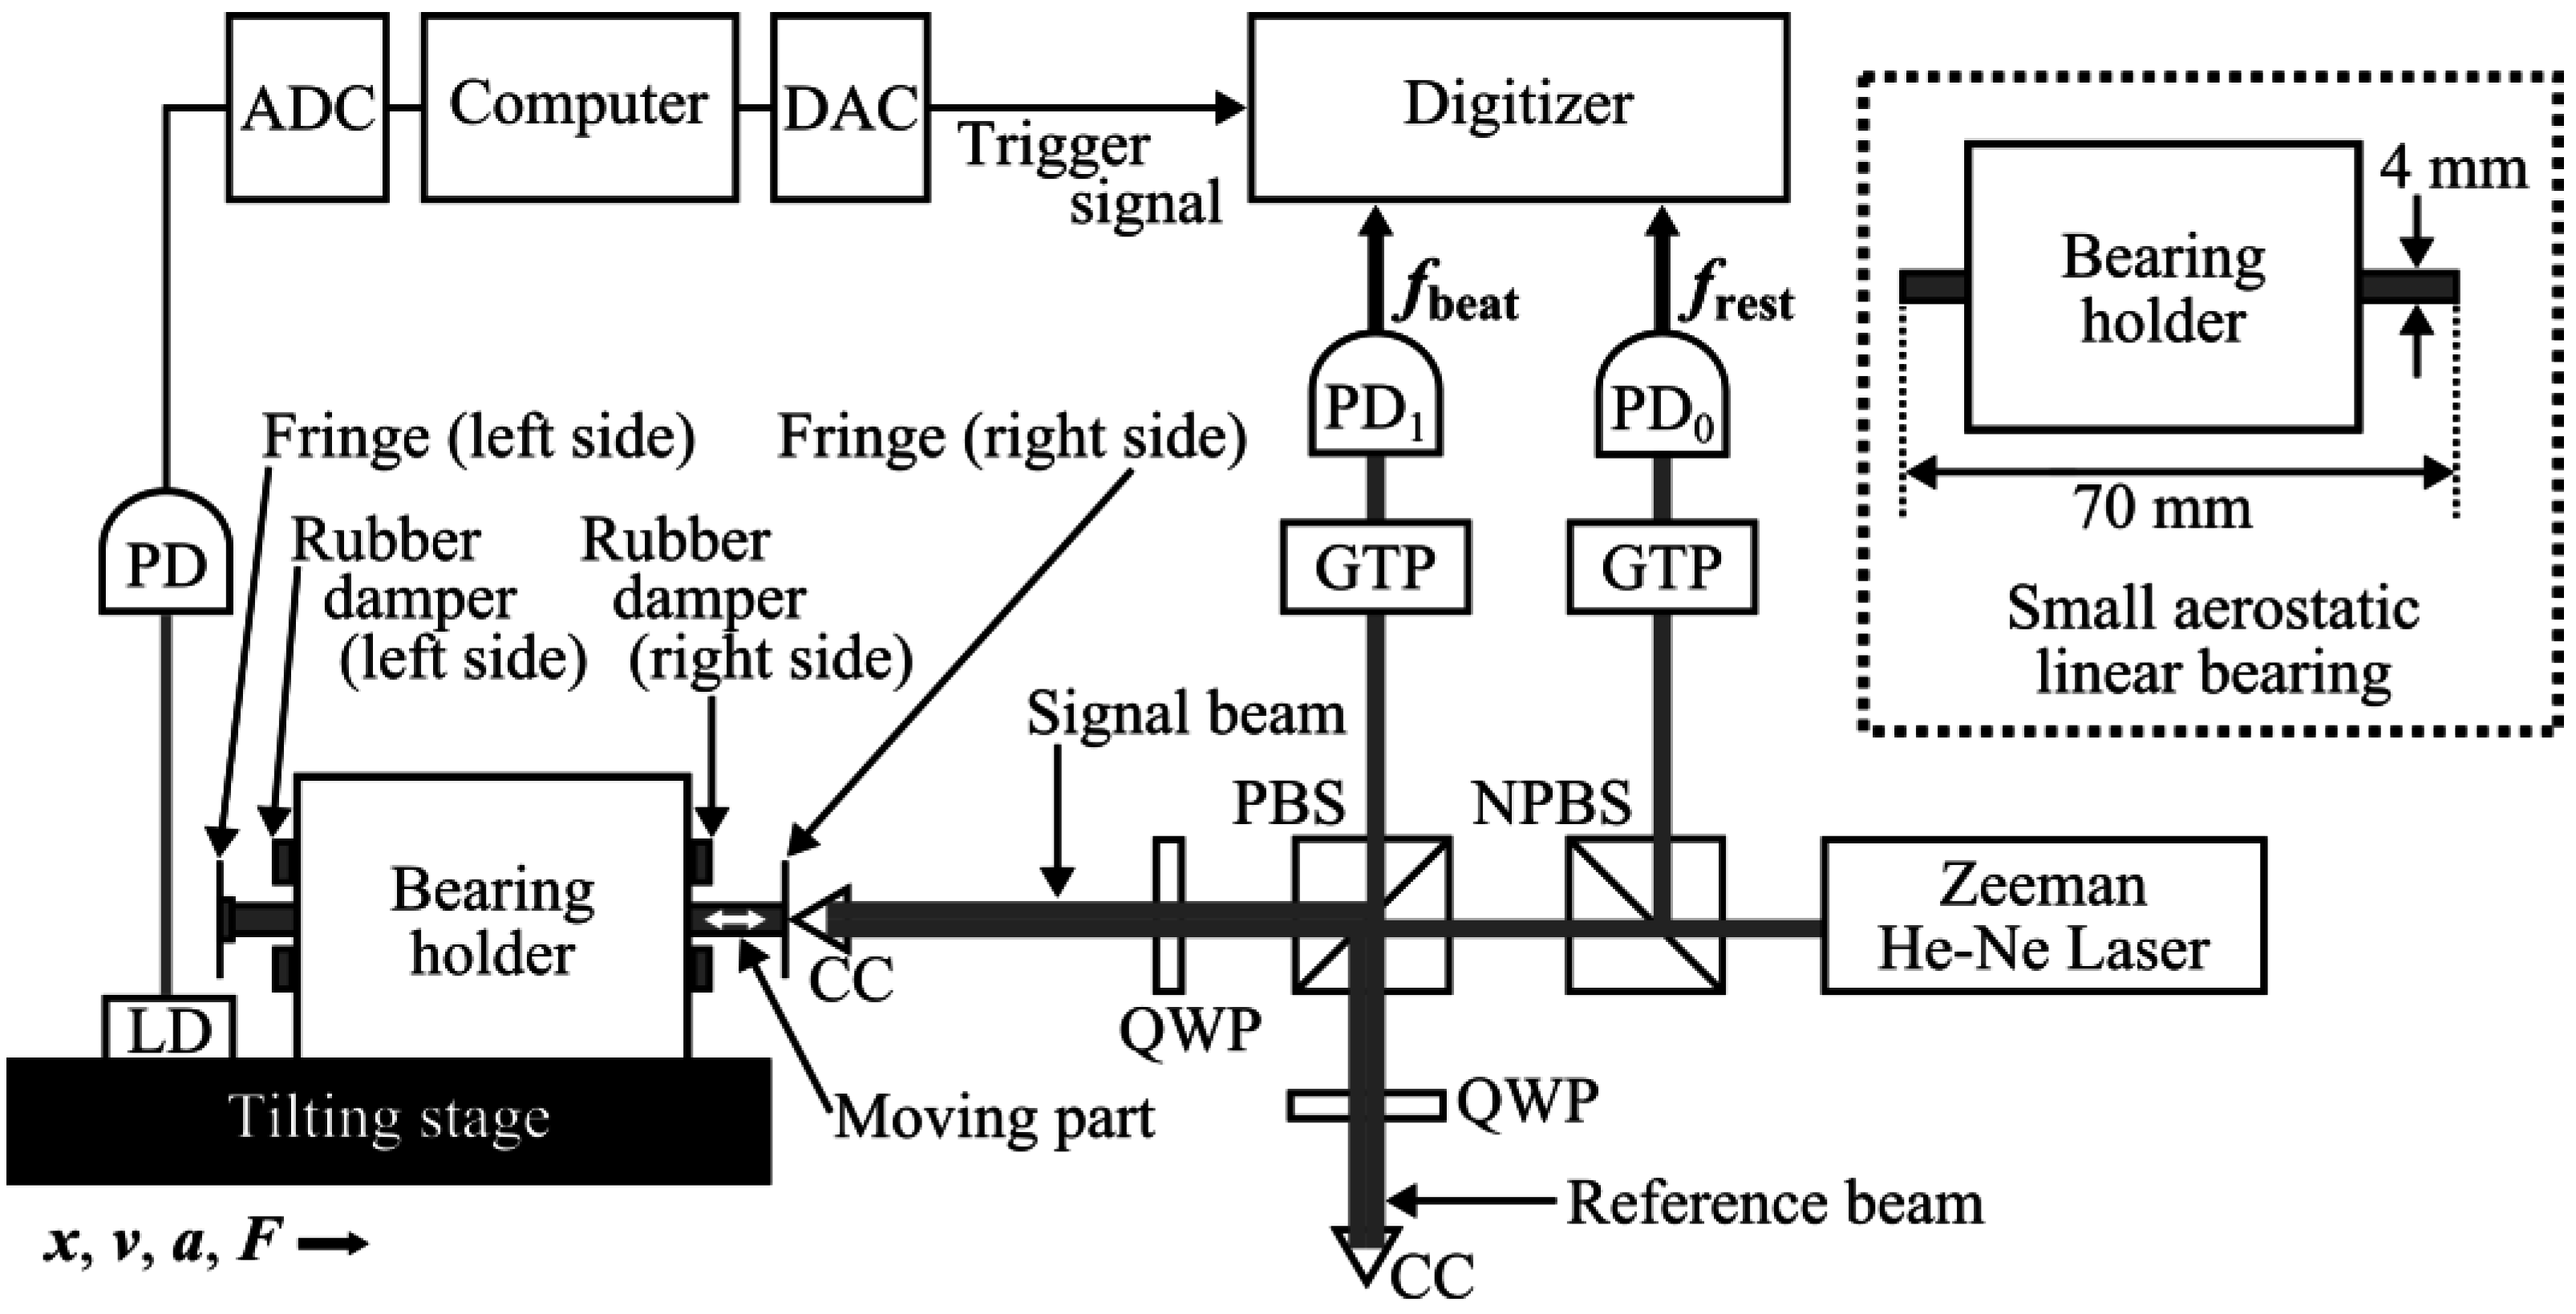
Figure 2 shows the data processing procedure for calculating the force acting on the moving part in the experiment. In this experiment only the two frequencies,
i.e.,
frest and
fbeat, are obtained using the optical interferometer and the frequency counter. The velocity
v is calculated using Equation (1). The position
x can be calculated by integrating the velocity
v, and the acceleration
a can be calculated by differentiating the velocity
v, by time, respectively. The force acting on the mass
Fmass is expressed as the product of the total mass of the moving part
M and the acceleration
a. Thus, all the quantities used in this study can be calculated from
frest and
fbeat. In
Figure 2, the collision of the moving part with the side dampers results the sudden change of the beat frequency
fbeat and also the velocity
v, and sharp pulses appear in the acceleration
a and the force
Fmass acting on the moving part. The origin of both of the position
x and the time
t are set to be the point at the first collision of the moving part with the right damper.
Figure 2.
Data processing procedure for measuring the force acting on the moving part in the experiment.
Figure 2.
Data processing procedure for measuring the force acting on the moving part in the experiment.
To investigate the frictional characteristics of the bearing, the force during free slide should be deliberated.
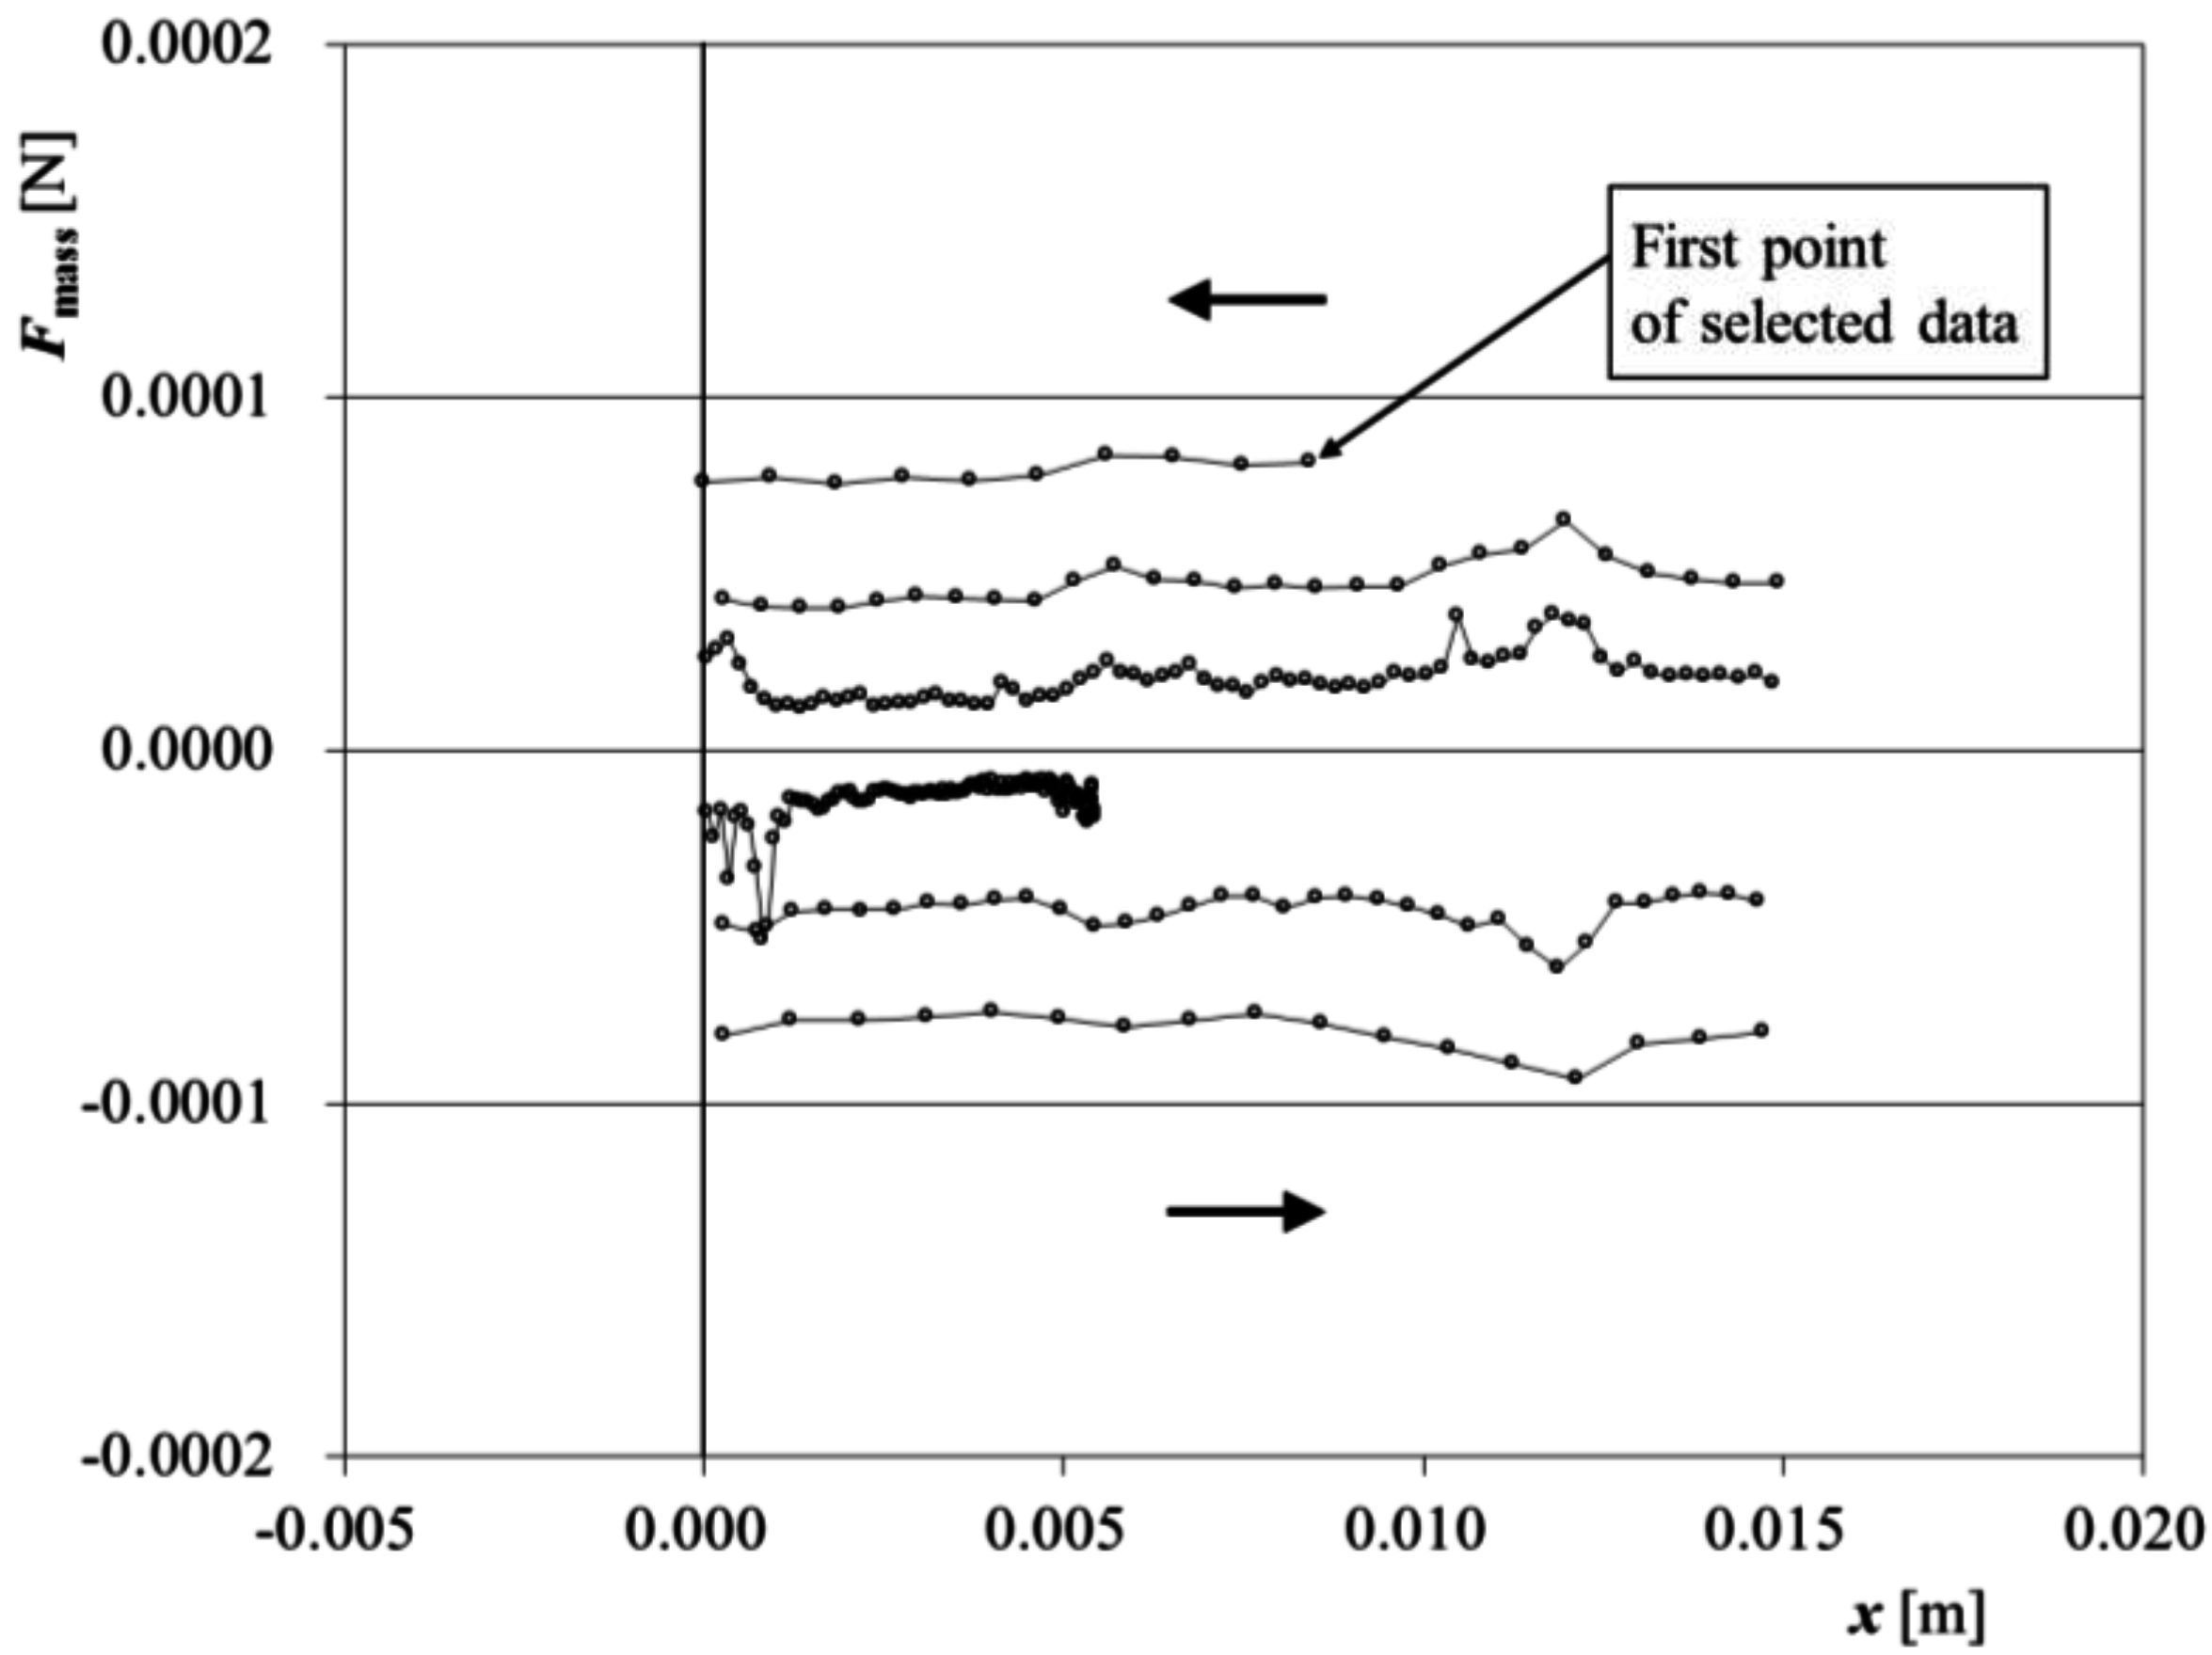
Figure 3a shows an enlarged view of the force against time
Fmass in
Figure 2.
Figure 3b shows the selected data chosen for the analysis, in which the position
x is between 0.0 to 15.0 mm. There are 282 data sets shown in
Figure 3b. Each set consists of time, velocity, position, acceleration and force data. In the subsequent analysis described below, the same data sets are used.
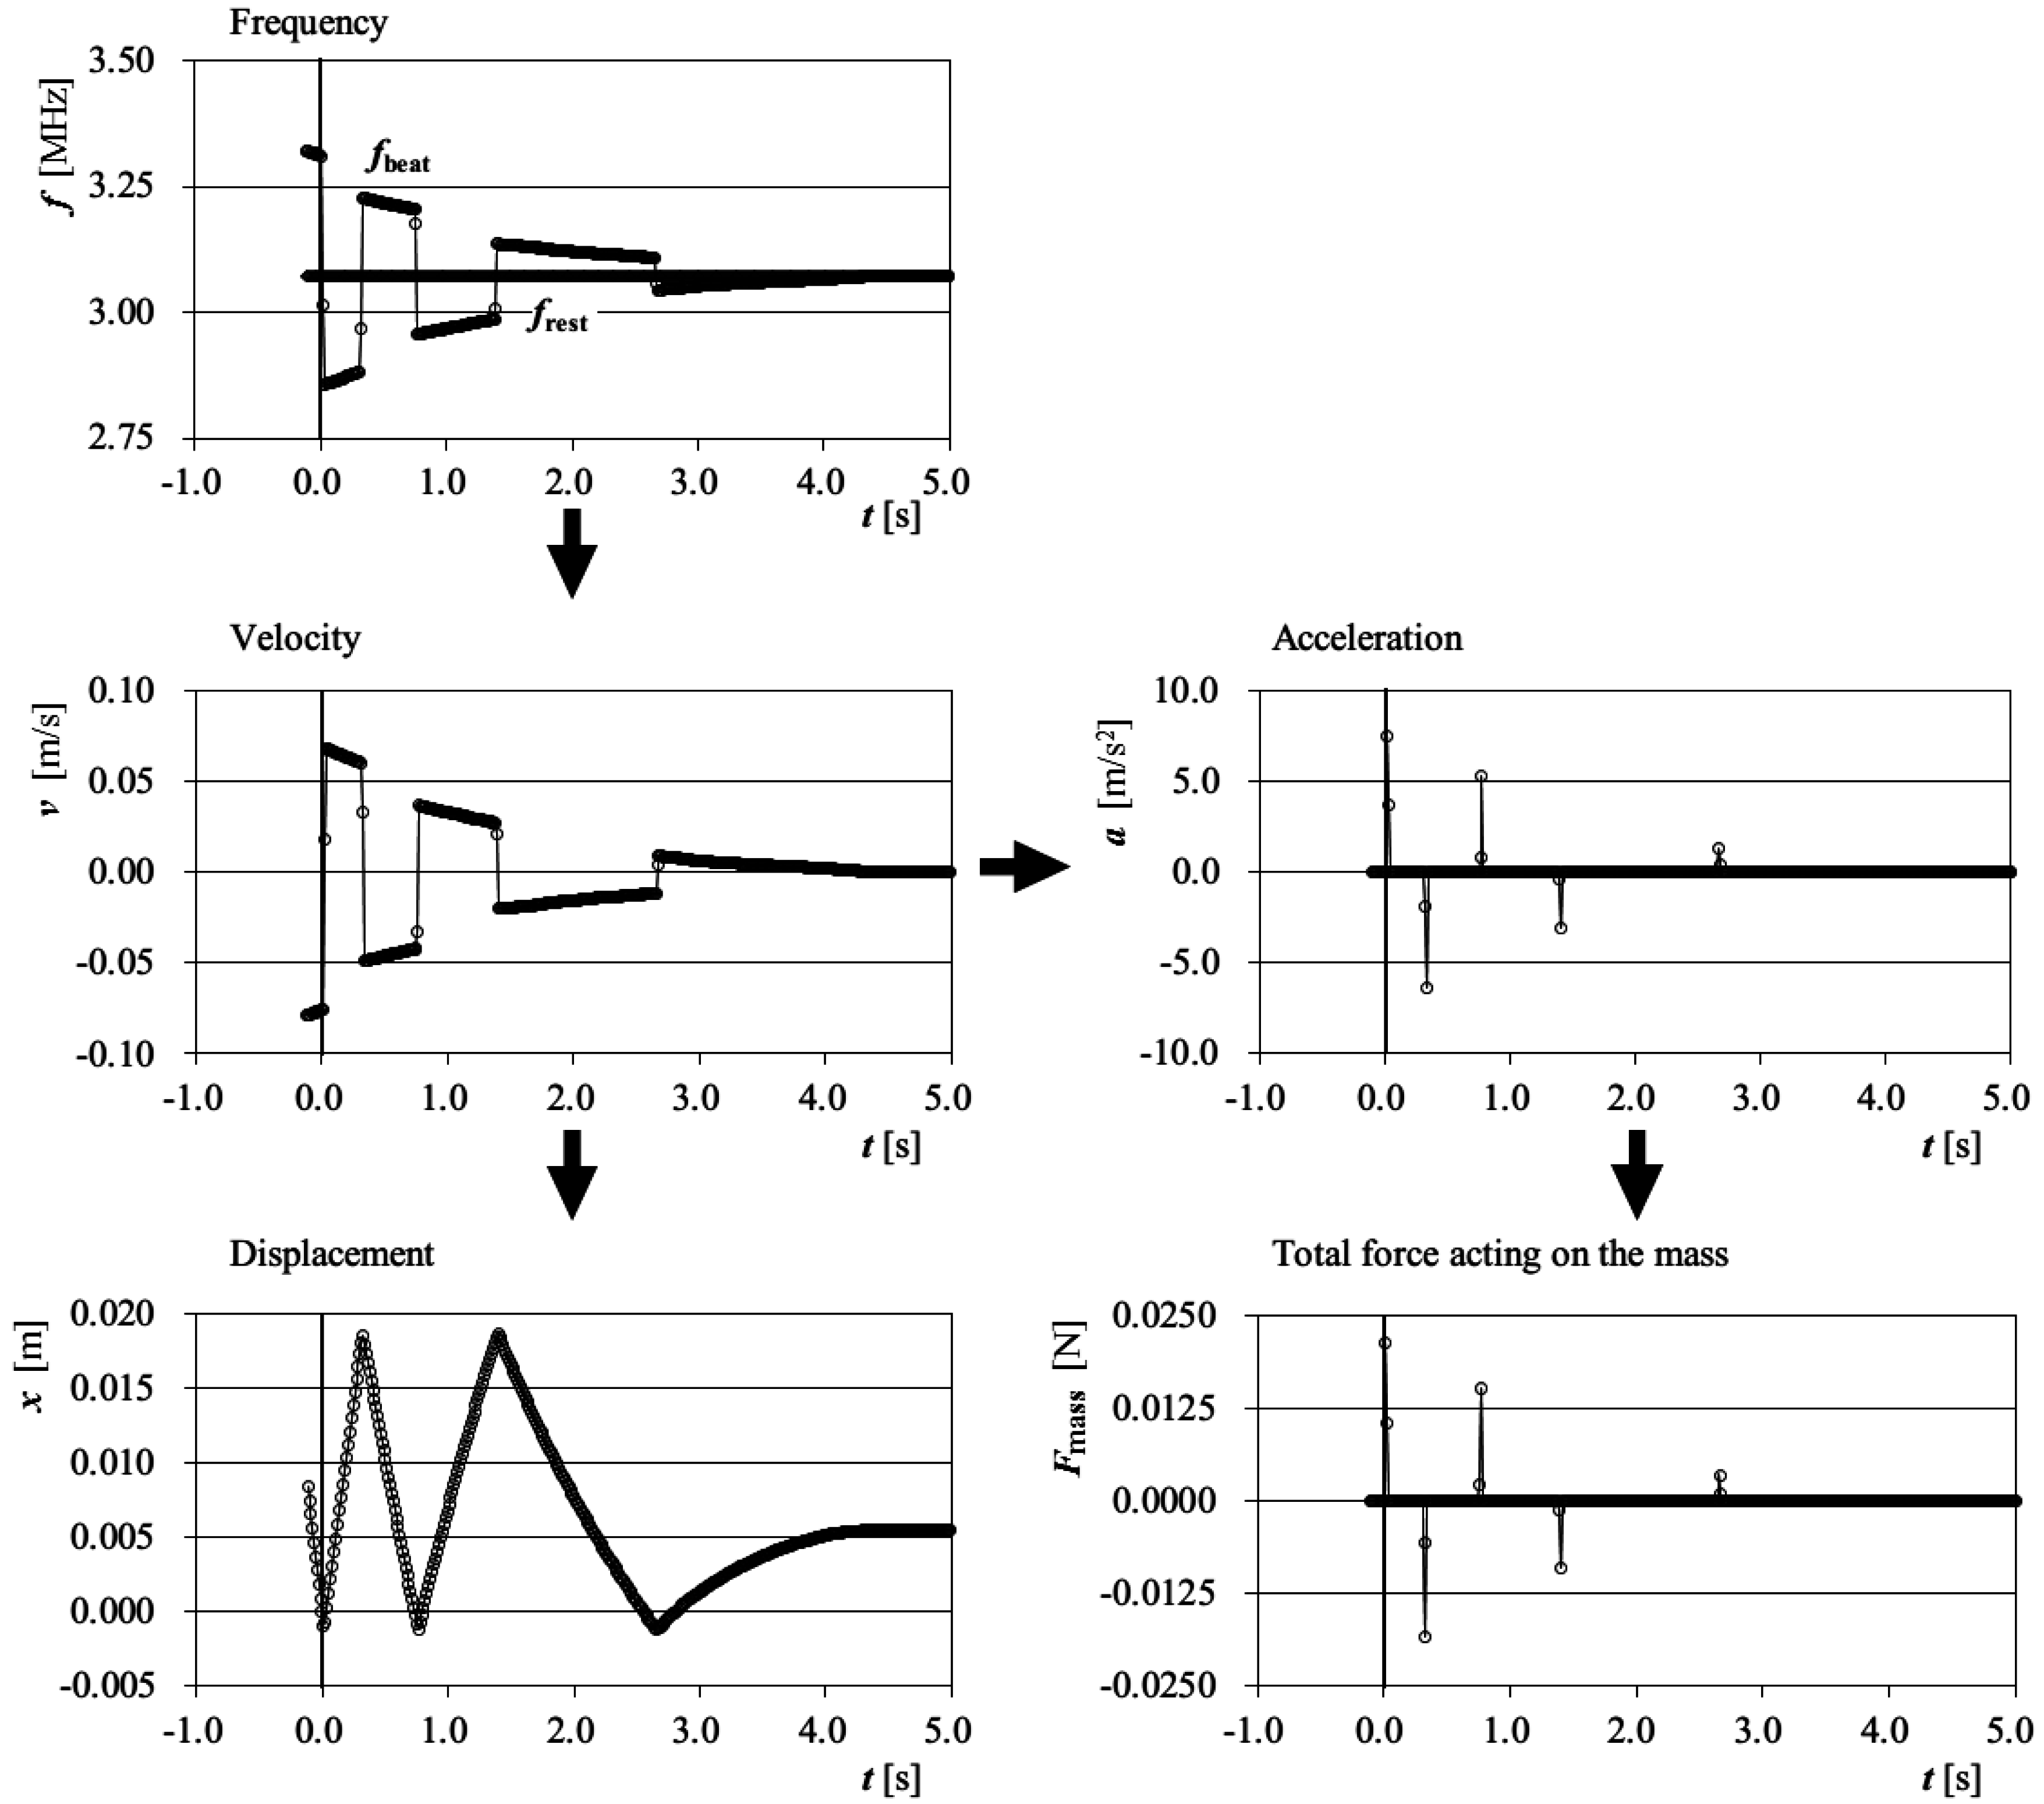
Figure 4 shows the change in force
Fmass against position
x. The friction becomes locally bigger at the position of 0.012 m. It is observed that friction around
m is bigger than other area.
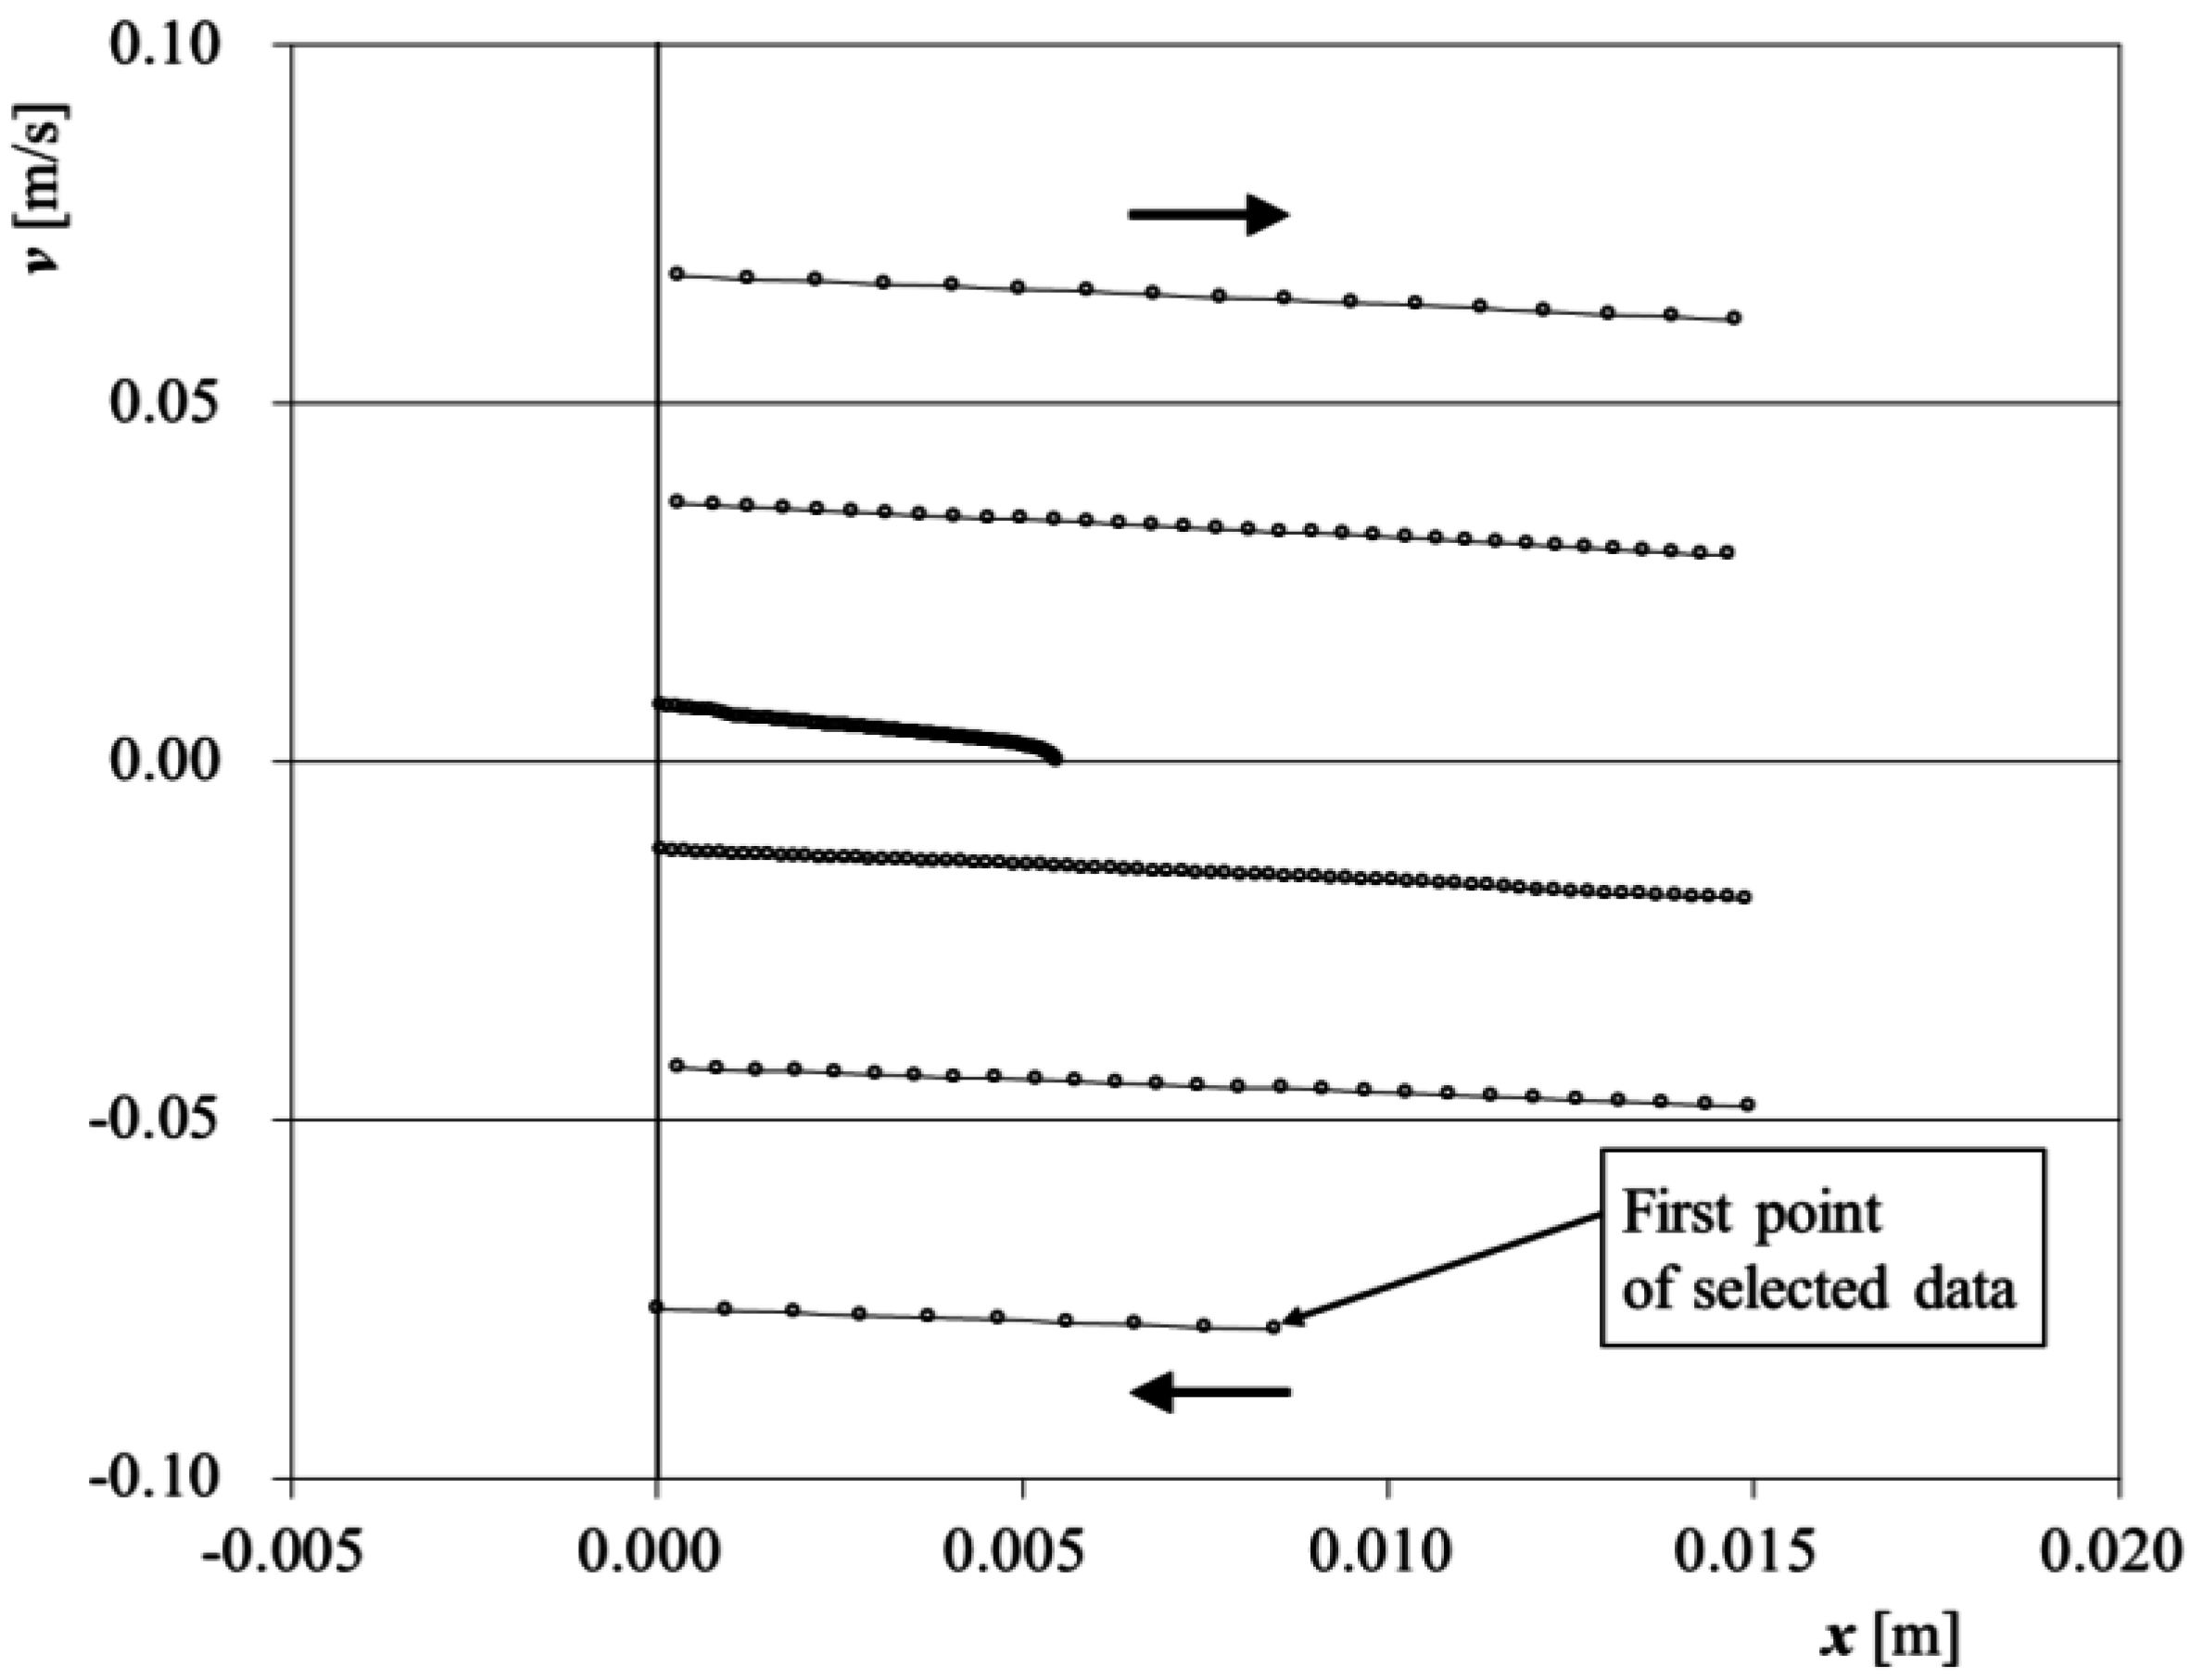
Figure 5 shows the change in velocity
v against position
x. The selected data sets until the moving part stops are shown in
Figure 5.
Figure 3.
(
a) The enlarged view of the force against time
Fmass in
Figure 2; (
b) The selected data chosen for analysis.
Figure 3.
(
a) The enlarged view of the force against time
Fmass in
Figure 2; (
b) The selected data chosen for analysis.
Figure 4.
The change in force Fmass against position x.
Figure 4.
The change in force Fmass against position x.
Figure 5.
The change in velocity v against position x.
Figure 5.
The change in velocity v against position x.
Under the assumption of our previous study [
6] that the force acting on the moving part of the aerostatic linear bearing in the experiment is the sum of velocity component, position component, component of velocity direction, and constant value which is resulted from down-slope component of gravity acting on the moving part, the Equation (2) is obtained:
Each component in Equation (2) is calculated using the least squares method using the 282 data sets shown in
Figure 3b.
Using the data sets shown in
Figure 3b, the coefficients of the Equation (2),
A1,
A2,
A3, and
A4, can be calculated using the least squares method as shown in
Table 1. In the table, the coefficients theoretically estimated are also shown, which is explained in the discussions section.
Table 1.
The coefficients obtained experimentally and theoretically.
Table 1.
The coefficients obtained experimentally and theoretically.
| Coefficient | Experimental Results | Theoretical Estimates |
|---|
| A1 | −0.000031 | 0 |
| A2 | −0.001016 | −0.00144 |
| A3 | −0.000007 | 0 |
| A4 | −0.000004 | 0 |
Figure 6 shows the relationship between the force measured in the experiment
Fmass and the force calculated using the Equation (2)
Fcal. The root mean square (RMS) value of the difference between
Fmass and
Fcal is approximately
N. The RMS value corresponds to approximately 0.02% of the gravitational force of approximately
N, which demonstrates the accuracy of the force measurement and the validity of the regression.
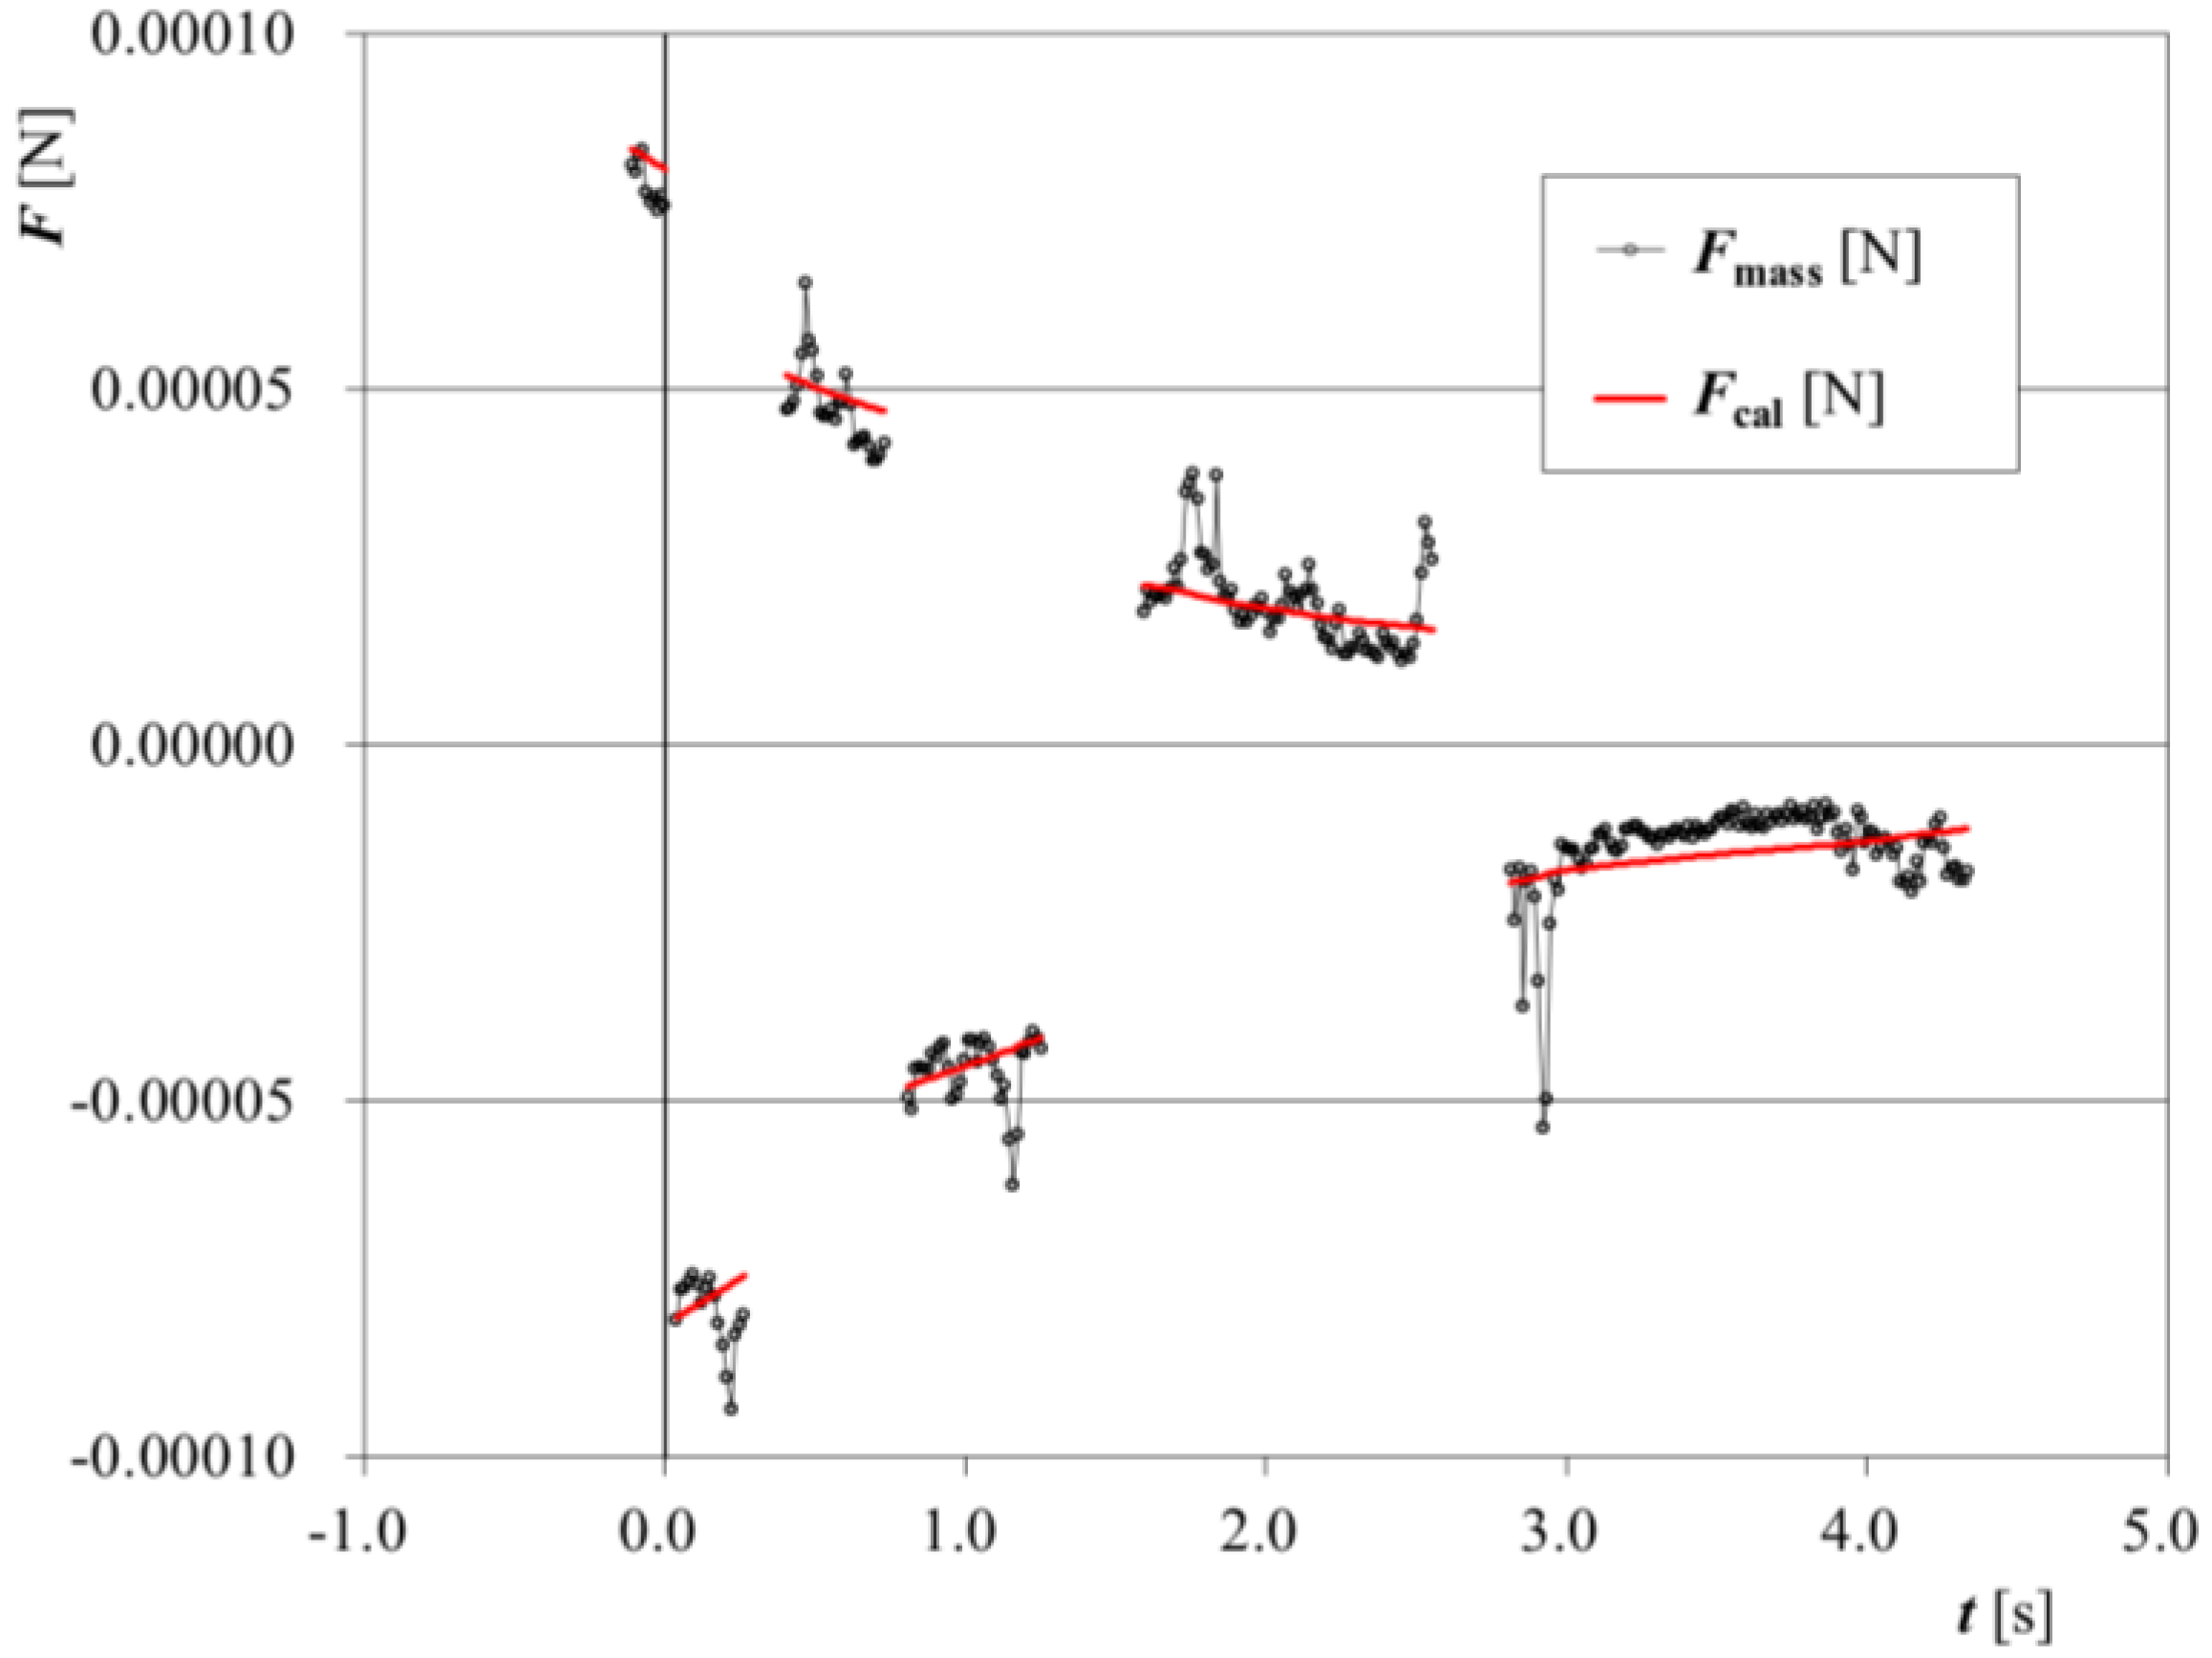
Figure 7 shows the comparison between the force measured in the experiment
Fmass and the force obtained by calculation using the least squares method
Fcal. The regression is carried out well, though the unexpected value caused by the damage of the air bearing is on the
Fmass. If the value in the frictional force can be considered, the regression analysis is considered to agree with the experimental results more.
Figure 6.
The relationship between the force measured in the experiment Fmass and the force calculated using the Equation (2) Fcal.
Figure 6.
The relationship between the force measured in the experiment Fmass and the force calculated using the Equation (2) Fcal.
Figure 7.
The comparison between the force measured in the experiment Fmass and the force obtained by the calculation using Equation (2) Fcal.
Figure 7.
The comparison between the force measured in the experiment Fmass and the force obtained by the calculation using Equation (2) Fcal.
4. Discussions
The uncertainty composed of three sources that we consider in the determination of the instantaneous value of the force measured in the experiment is evaluated as follows:
The uncertainty originating from the electric counter R5363 with sampling interval of is estimated to be approximately 1 Hz. This uncertainty of the beat frequency corresponds to an uncertainty of the velocity of the moving part of approximately m/s, according to the relational expression . This corresponds to an uncertainty of the acceleration and force of approximately 0.003 m/s2 and N, respectively.
The major source of uncertainty in the optical alignments is the inclination of the signal beam of 1 mrad, and it results in a relative uncertainty in the velocity of approximately .
The uncertainty of measuring the mass of the moving part is approximately 0.01 g, which corresponds to 0.3 % against the mass of the moving part.
Considering the uncertainty sources described above, the standard uncertainty in the experiment is estimated to be approximately N.
Each coefficient shown in
Table 1 is obtained using the least squares method. The experimental and theoretical coefficients are discussed and compared as follows:
The coefficient A1 corresponds to the force component proportional to the position of the moving part. From the structure of the bearing, the theoretical value is 0. The experimental value is approximately , which corresponds to the force of N when the position of the moving part is at the end of the range, i.e., x = 0.015 m. This is negligible.
The coefficient
A2 corresponds to the component proportional to the velocity. This force is thought to correspond to the Couette flow in a thin air film, which can be expressed as:
where
μair is the coefficient of viscosity of air which is
in the experimental condition,
S is the surface area of moving part contacting with the air film between the moving part and the bearing holder,
h is the thickness of the air film of which nominal value is approximately
m in this study,
v is the velocity of the moving part. The coefficient
A2 is calculated to be
as shown in
Table 1, using the surface area
S of
m
2. From this discussion, the force is dependent on the component proportional to the velocity of the moving part, and almost following the theory of Couette flow in the air film.
The coefficient A3 is the component of the direction of the velocity and corresponds to the component of the dynamic frictional force whose sign depends on velocity. The value of v/|v| can only get −1 or 1 depending on the direction of the velocity. The theoretical value of A3 is zero, and the experimental value is approximately . This is negligible.
The coefficient A4 corresponds to the tilt of the experimental setup. The value of A4 should be zero under ideal conditions of which setup does not tilt. The experiment result of approximately is small enough to be ignored.
The coefficient A2 is the most significant value and the force obtained in the experiment can be explained by the theory of the Couette flow in a thin air film.
The results prove that the frictional characteristics of a small air bearing can be evaluated well. The regression analysis is carried out to the results obtained in the experiment.
In our previous study [
11], the bigger air bearing was tested with similar method and it showed that the force acting on the moving part is dependent both on the position and on the velocity. However, in this study, the force is dependent only on the velocity. This difference is thought to come from the difference of the inner structures of aerostatic linear bearings used in the previous study and in this study.
The proposed method for measuring the frictional characteristics of a small aerostatic bearing can be modified for measuring the frictional characteristics of other kinds of linear bearings, such as linear ball bearing or linear oil-film bearing.
The accurate measurement data obtained by the proposed method will contribute to the better understanding of the frictional characteristics of aerostatic linear bearings and the improvements of them.
5. Conclusions
Frictional characteristics of a small aerostatic linear bearing are accurately evaluated by means of a method, in which the force acting on the moving part of the bearing is measured as the inertial force. An optical interferometer is newly developed to measure the Doppler shift frequency of the laser light reflected on the small moving part. Quarter-wave plates (QWP) are used to control the effect of the optical feedback. It is confirmed that the dynamic frictional force acting inside the bearing is almost proportional to the velocity of the moving part and is similar to the theoretical value calculated under the assumption that the flow inside the bearing is the Couette flow.


