3.1. FTIR
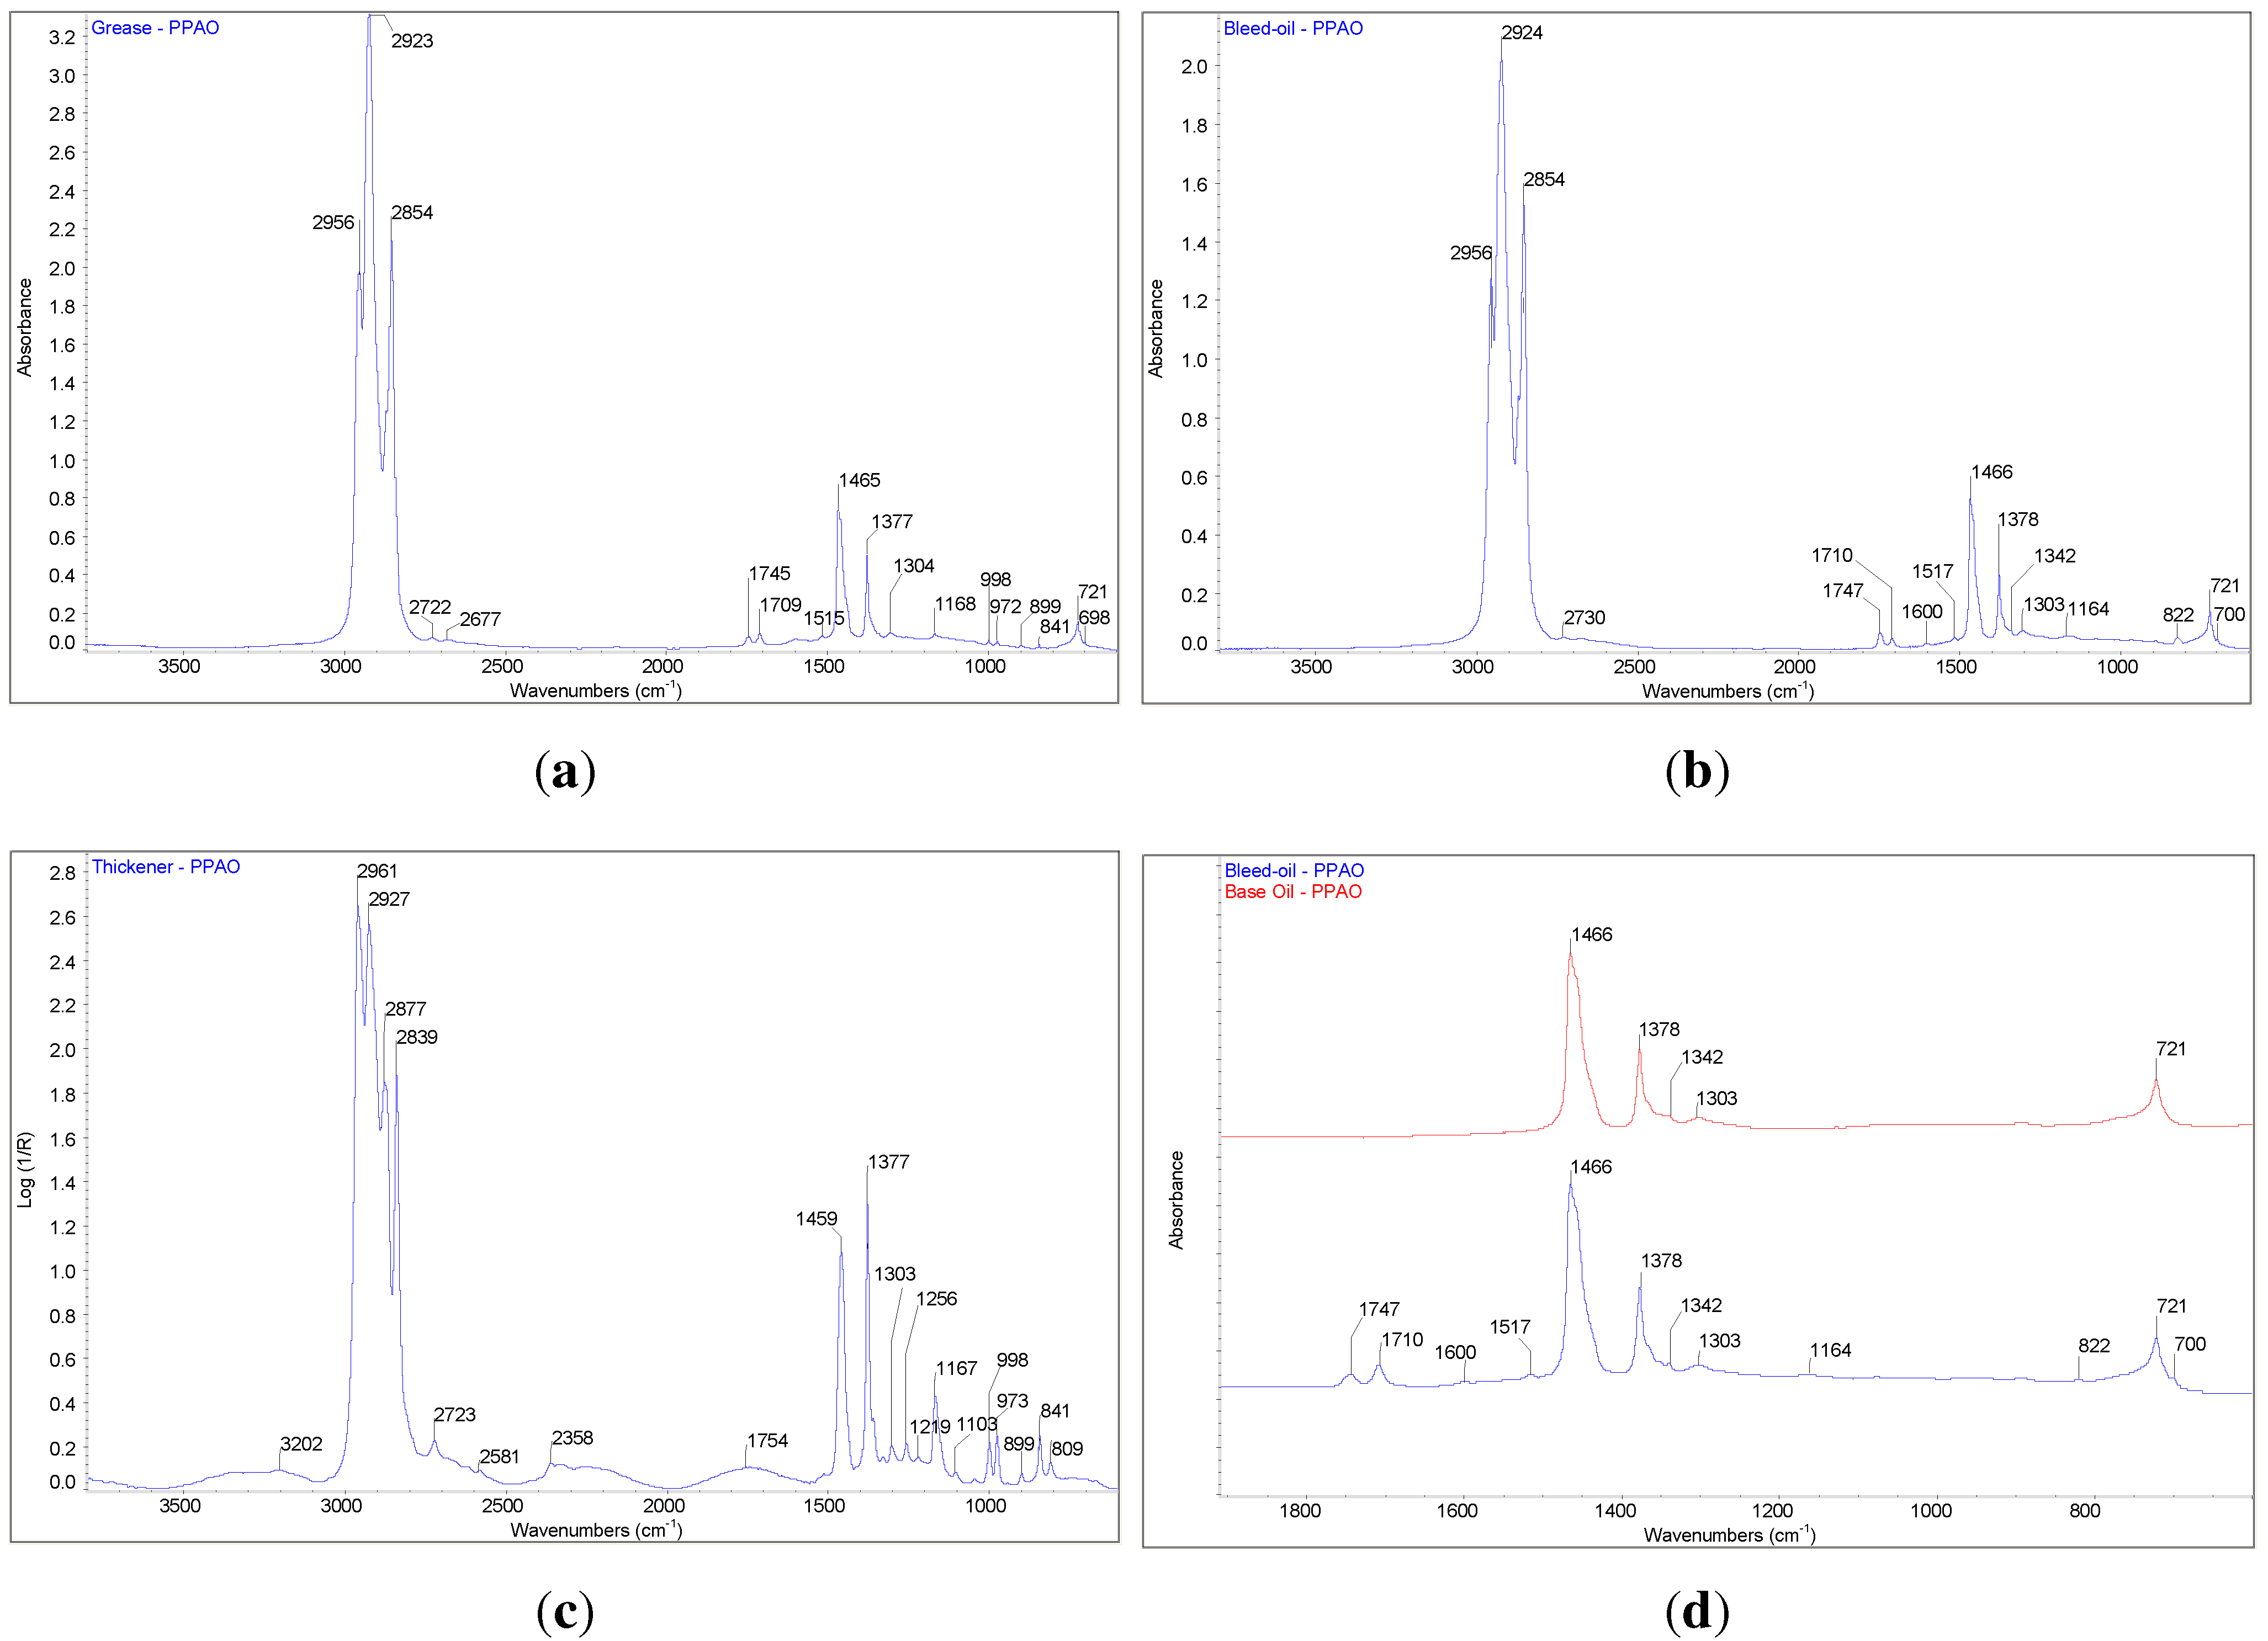
Infra-red spectroscopy analysis of the fresh samples (grease, thickener, base and bled oils) showed the peaks on the grease spectrum that belong to the thickener, to the base oil and to the additives. It also showed that most of the additives (if not all) remained in the oil during the bleeding process. The additives identified in the bled oil spectra were absent in the base oil spectra, as expected. A few absorbance peaks that might be related to the thickener were observed in the bled oils spectra, as well.
Figure 1 shows the (a) grease, (b) bled oil, (c) thickener and (d) a comparison between PPAO base and bled oil spectra as an example. Note that the sinusoidal shape at the base line of
Figure 1(c) is due to internal equipment noise and does not represent the thickener characteristics. The infra-red response of LiM1 and LiCaE are given ahead when fresh and aged lubricants are compared.
The main observation from the FTIR analysis of the fresh samples are given below.
Figure 1.
FTIR spectra of PPAO. (a) Grease; (b) bled oil; (c) thickener; (d) comparison between base and bled oil spectra in the fingerprint zone.
Figure 1.
FTIR spectra of PPAO. (a) Grease; (b) bled oil; (c) thickener; (d) comparison between base and bled oil spectra in the fingerprint zone.
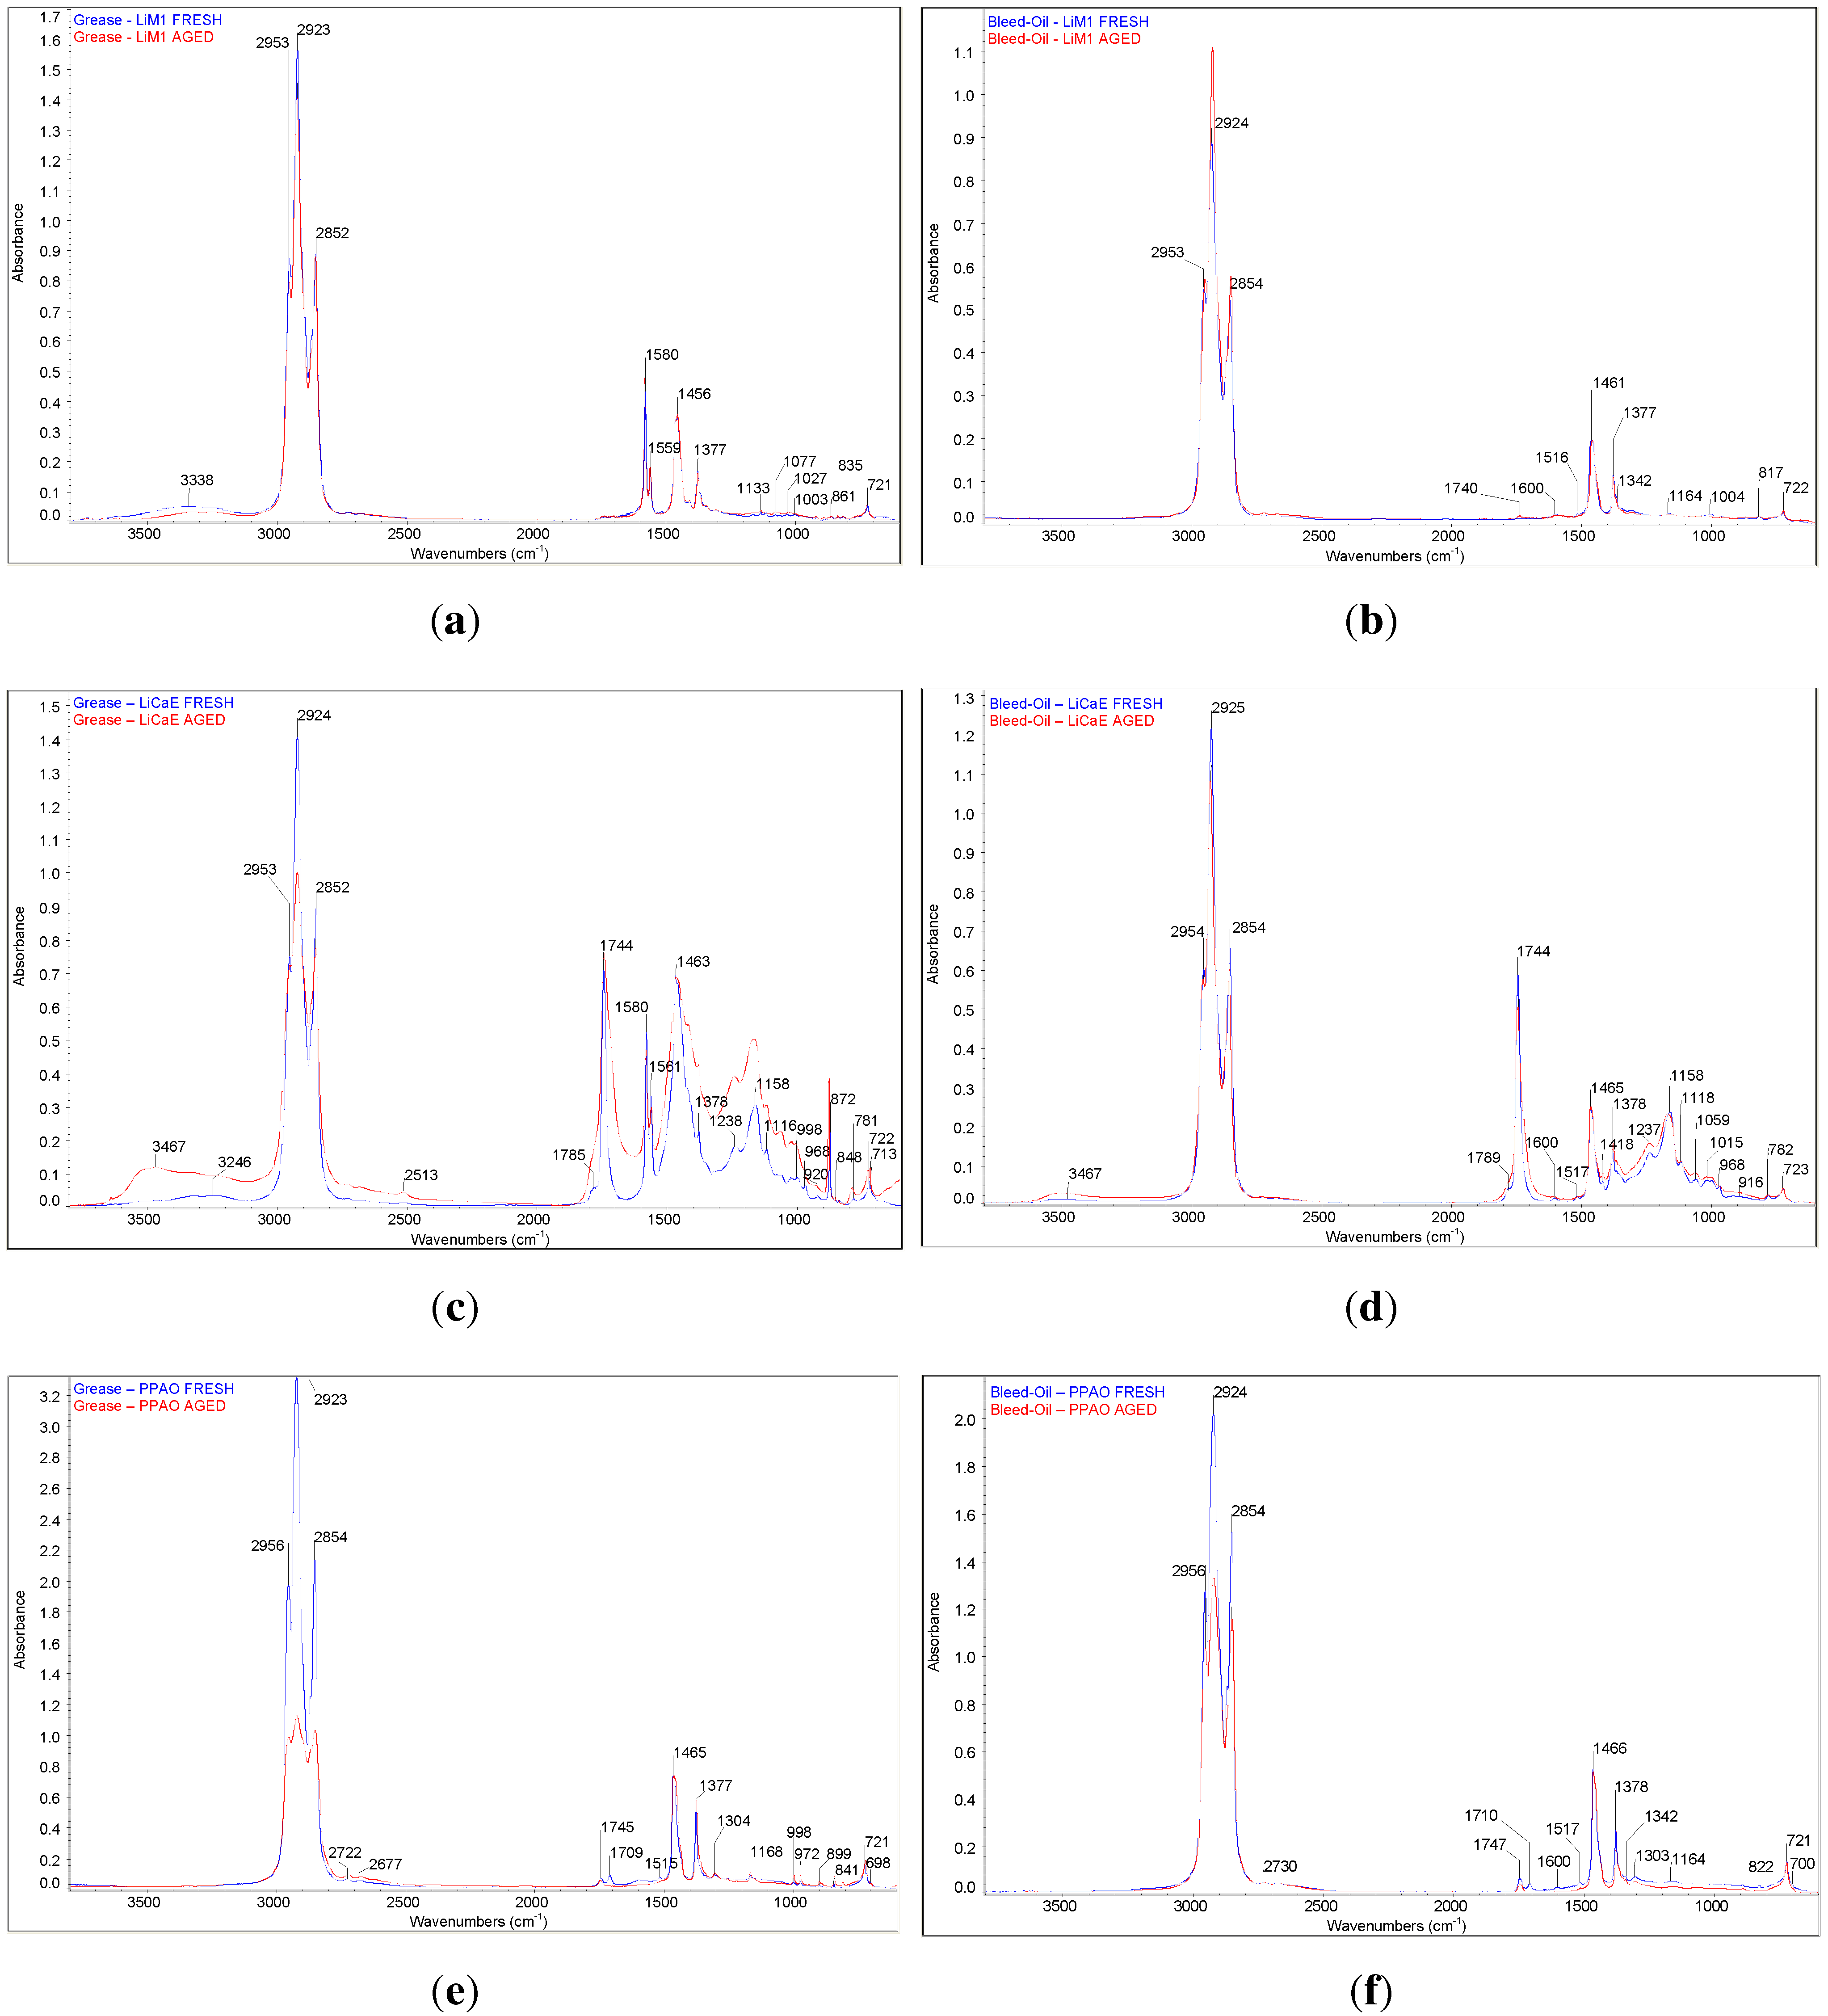
Figure 2 shows the infra-red spectra of aged and fresh samples of the lubricating greases and their bled oils. Significant changes were observed after aging. It was ascertained that LiM1 grease and its bled oil were not or only slightly oxidized (absence of peaks at the 1750–1700 cm
range), but additive consumption (reduction of the peaks at 1600, 1516, 1164 and 1004 cm
) and base oil evaporation were observed (increase of the lithium peaks: 1580 and 1560 cm
). A slightly increase of the 1740-cm
band caused by oxidation products in the bled oil spectrum was also observed.
LiCaE grease showed moderate to high levels of oxidation by the increase of the base line at the 3700–3000 and 1900–800-cm
range, the broadening of the 1740 and 1460 cm
bands and the increase in intensity of absorbance of the 1239 and 1165 cm
ester peaks [
32]. The IR spectra also showed changes in thickener concentration by the relative decrease in intensity of the lithium peak at 1580 cm
and the increase of the calcium peak at 872 cm
with the normalized one at approximately 1460 cm
. The aged LiCaE bled oil spectra showed an increasing height of the 3467, 1417 and 1240 cm
bands and the broadening of the peak at 1740 cm
, indicating that it is oxidized. Additive depletion was observed by the reduction of the peaks at 1602 and 1517 cm
.
In the PPAO spectra, it was noticeable that no or just slight oxidation occurred. However, the consumption of AW additives at 1745 cm
and the depletion of the extreme pressure and anti-wear additive at 1709 cm
(bismuth) are clear. Furthermore, a significant decrease in intensity of the peaks in the region of 2853–2953 cm
suggests that the C-H and C-C long chains of PP and/or PAO were broken [
33].
3.2. XRF and Remaining Oil Percentage Analysis
Table 3 shows the most common elements used on grease additivation and their concentration as a function of the total mass (wt%
) after the aging process. The relative decrease/increase in percentage of each element after the aging process is also given in the table by
.
The decreased content of some common elements usually used as additives (P, S, Ca, Zn, Pb, Bi) was observed by comparing the XRF data of fresh and aged grease samples. This supports the FTIR analysis presented in the previous section.
Table 3 also shows an increase of the iron content (Fe) in the LiM1 (28.2%) and LiCaE (535.7%) greases, which could be related to the grease’s ability to protect the contacting surfaces, either by forming a hydrodynamic film or a boundary film (thickener and/or additives). As shown by Hurley
et al. [
19], oxidation occurs more rapidly and reaches higher levels in the presence of metallic debris. Therefore, the high content of Fe together with the low additization of the LiCaE grease are likely to be the main reason for its high level of oxidation.
Figure 2.
FTIR spectra of fresh and aged samples. (a) LiM1 grease; (b) LiM1 bled oil; (c) LiCaE grease; (d) LiCaE bled oil; (e) PPAO grease; and (f) PPAO bled oil.
Figure 2.
FTIR spectra of fresh and aged samples. (a) LiM1 grease; (b) LiM1 bled oil; (c) LiCaE grease; (d) LiCaE bled oil; (e) PPAO grease; and (f) PPAO bled oil.
Table 3.
Concentration in percentage of total mass (wt% ) of the chemical content of aged grease samples and their .
Table 3.
Concentration in percentage of total mass (wt% ) of the chemical content of aged grease samples and their .
| | P | S | Ca | Zn | Pb | Bi | Fe |
|---|
| Aged LiM1 | 82.5 | 696.5 | 3.0 | 156.4 | 8.0 | 0.0 | 6.3 |
| 31.3 | 57.8 | 0.0 | 45.1 | 0.0 | 0.0 | −28.2 |
| Aged LiCaE | 23.5 | 63.4 | 1958.0 | 12.3 | 0.0 | 0.0 | 17.8 |
| 36.6 | 37.8 | 37.7 | 57.6 | 0.0 | 0.0 | −535.7 |
| Aged PPAO | 2.2 | 123.4 | 0.2 | 0.0 | 11.4 | 643.6 | 2.9 |
| 64.2 | 78.8 | 99.0 | 0.0 | 18.8 | 10.2 | 0.0 |
3.3. Viscosity Evaluation and Oil Loss
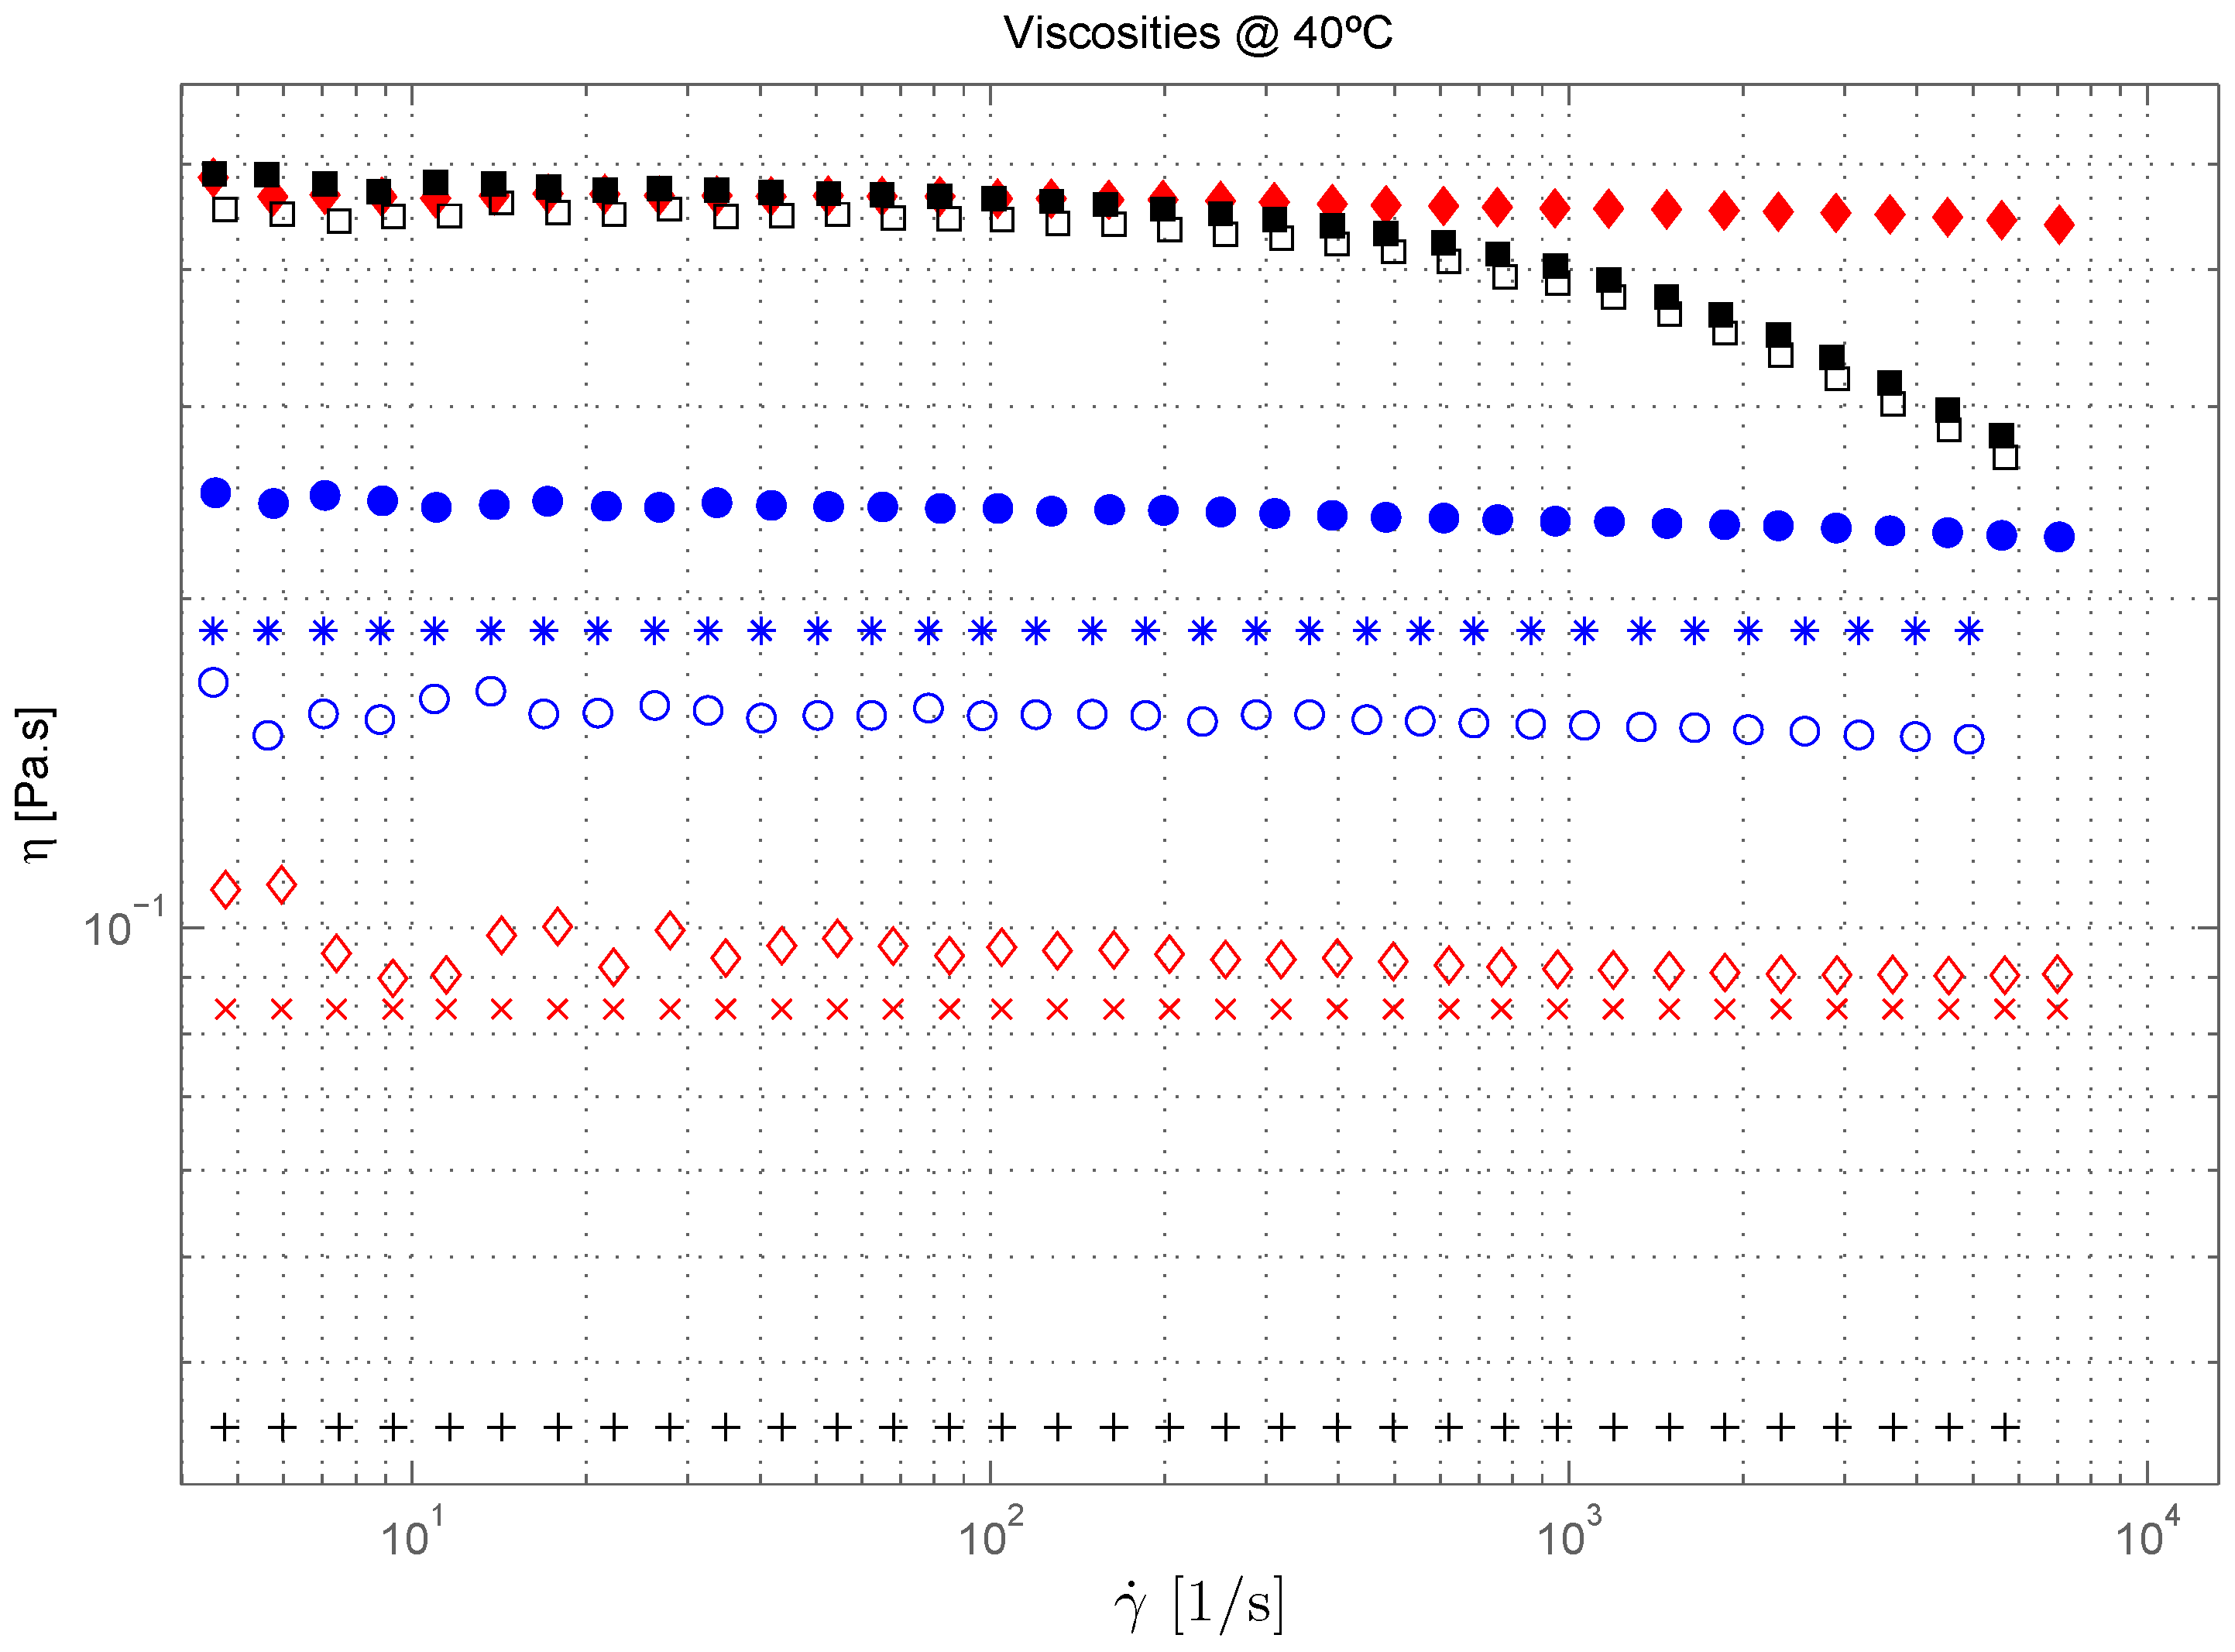
Figure 3 shows the measured dynamic viscosity of the fresh and aged base and bled oils
versus the shear rate (
) at 40 °C .
Fresh and aged base and bled oils of LiM1 and LiCaE presented a Newtonian behavior, while the fresh and aged bled oils of PPAO showed a significant shear thinning behavior. Besides, base and bled oil viscosities were shown to be quite different.
Table 4 shows these differences in the low shear rate range, where:
Figure 3.
Flow curves at 40 °C . LiM1 base oil (), LiM1 bled oil (), LiM1 aged bled oil (), LiCaE base oil (), LiCaE bled oil (), LiCaE aged bled oil (), PPAO base oil (), PPAO bled oil () and PPAO aged bled oil ().
Figure 3.
Flow curves at 40 °C . LiM1 base oil (), LiM1 bled oil (), LiM1 aged bled oil (), LiCaE base oil (), LiCaE bled oil (), LiCaE aged bled oil (), PPAO base oil (), PPAO bled oil () and PPAO aged bled oil ().
Three different trends were observed when fresh base and bled oil viscosities were compared at 40 °C . LiCaE grease presented similar values for base and bled oil viscosities. In the case of LiM1 grease, the viscosity of the bled oil was 17% lower than the viscosity of the base oil, while in the case of PPAO grease, the viscosity of the bled oil was 1150% higher than the one of the base oil.
Table 4.
Base and bled oils viscosity difference in the low shear rate range at 40 °C .
Table 4.
Base and bled oils viscosity difference in the low shear rate range at 40 °C .
| | LiM1 | LiCaE | PPAO |
|---|
| (%) | −17 | 12 | 1150 |
| (%) | 54 | 382 | 6.8 |
The IR-spectra had already shown different compositions between base and bled oils, and therefore, distinct physical and rheological properties were already expected. According to the manufacturer of the PPAO grease, the very high viscosity of its bled oil is mainly due to the co-thickener, which has a large affinity with the base oil and always bleeds out together during the bleeding process. The co-thickener was found in the bled oil IR spectrum (
Figure 2(e)).
Aged bled oils showed the same viscosity behavior of their corresponding fresh bled oils, but at higher levels, as shown in
Table 4 and
Figure 3.
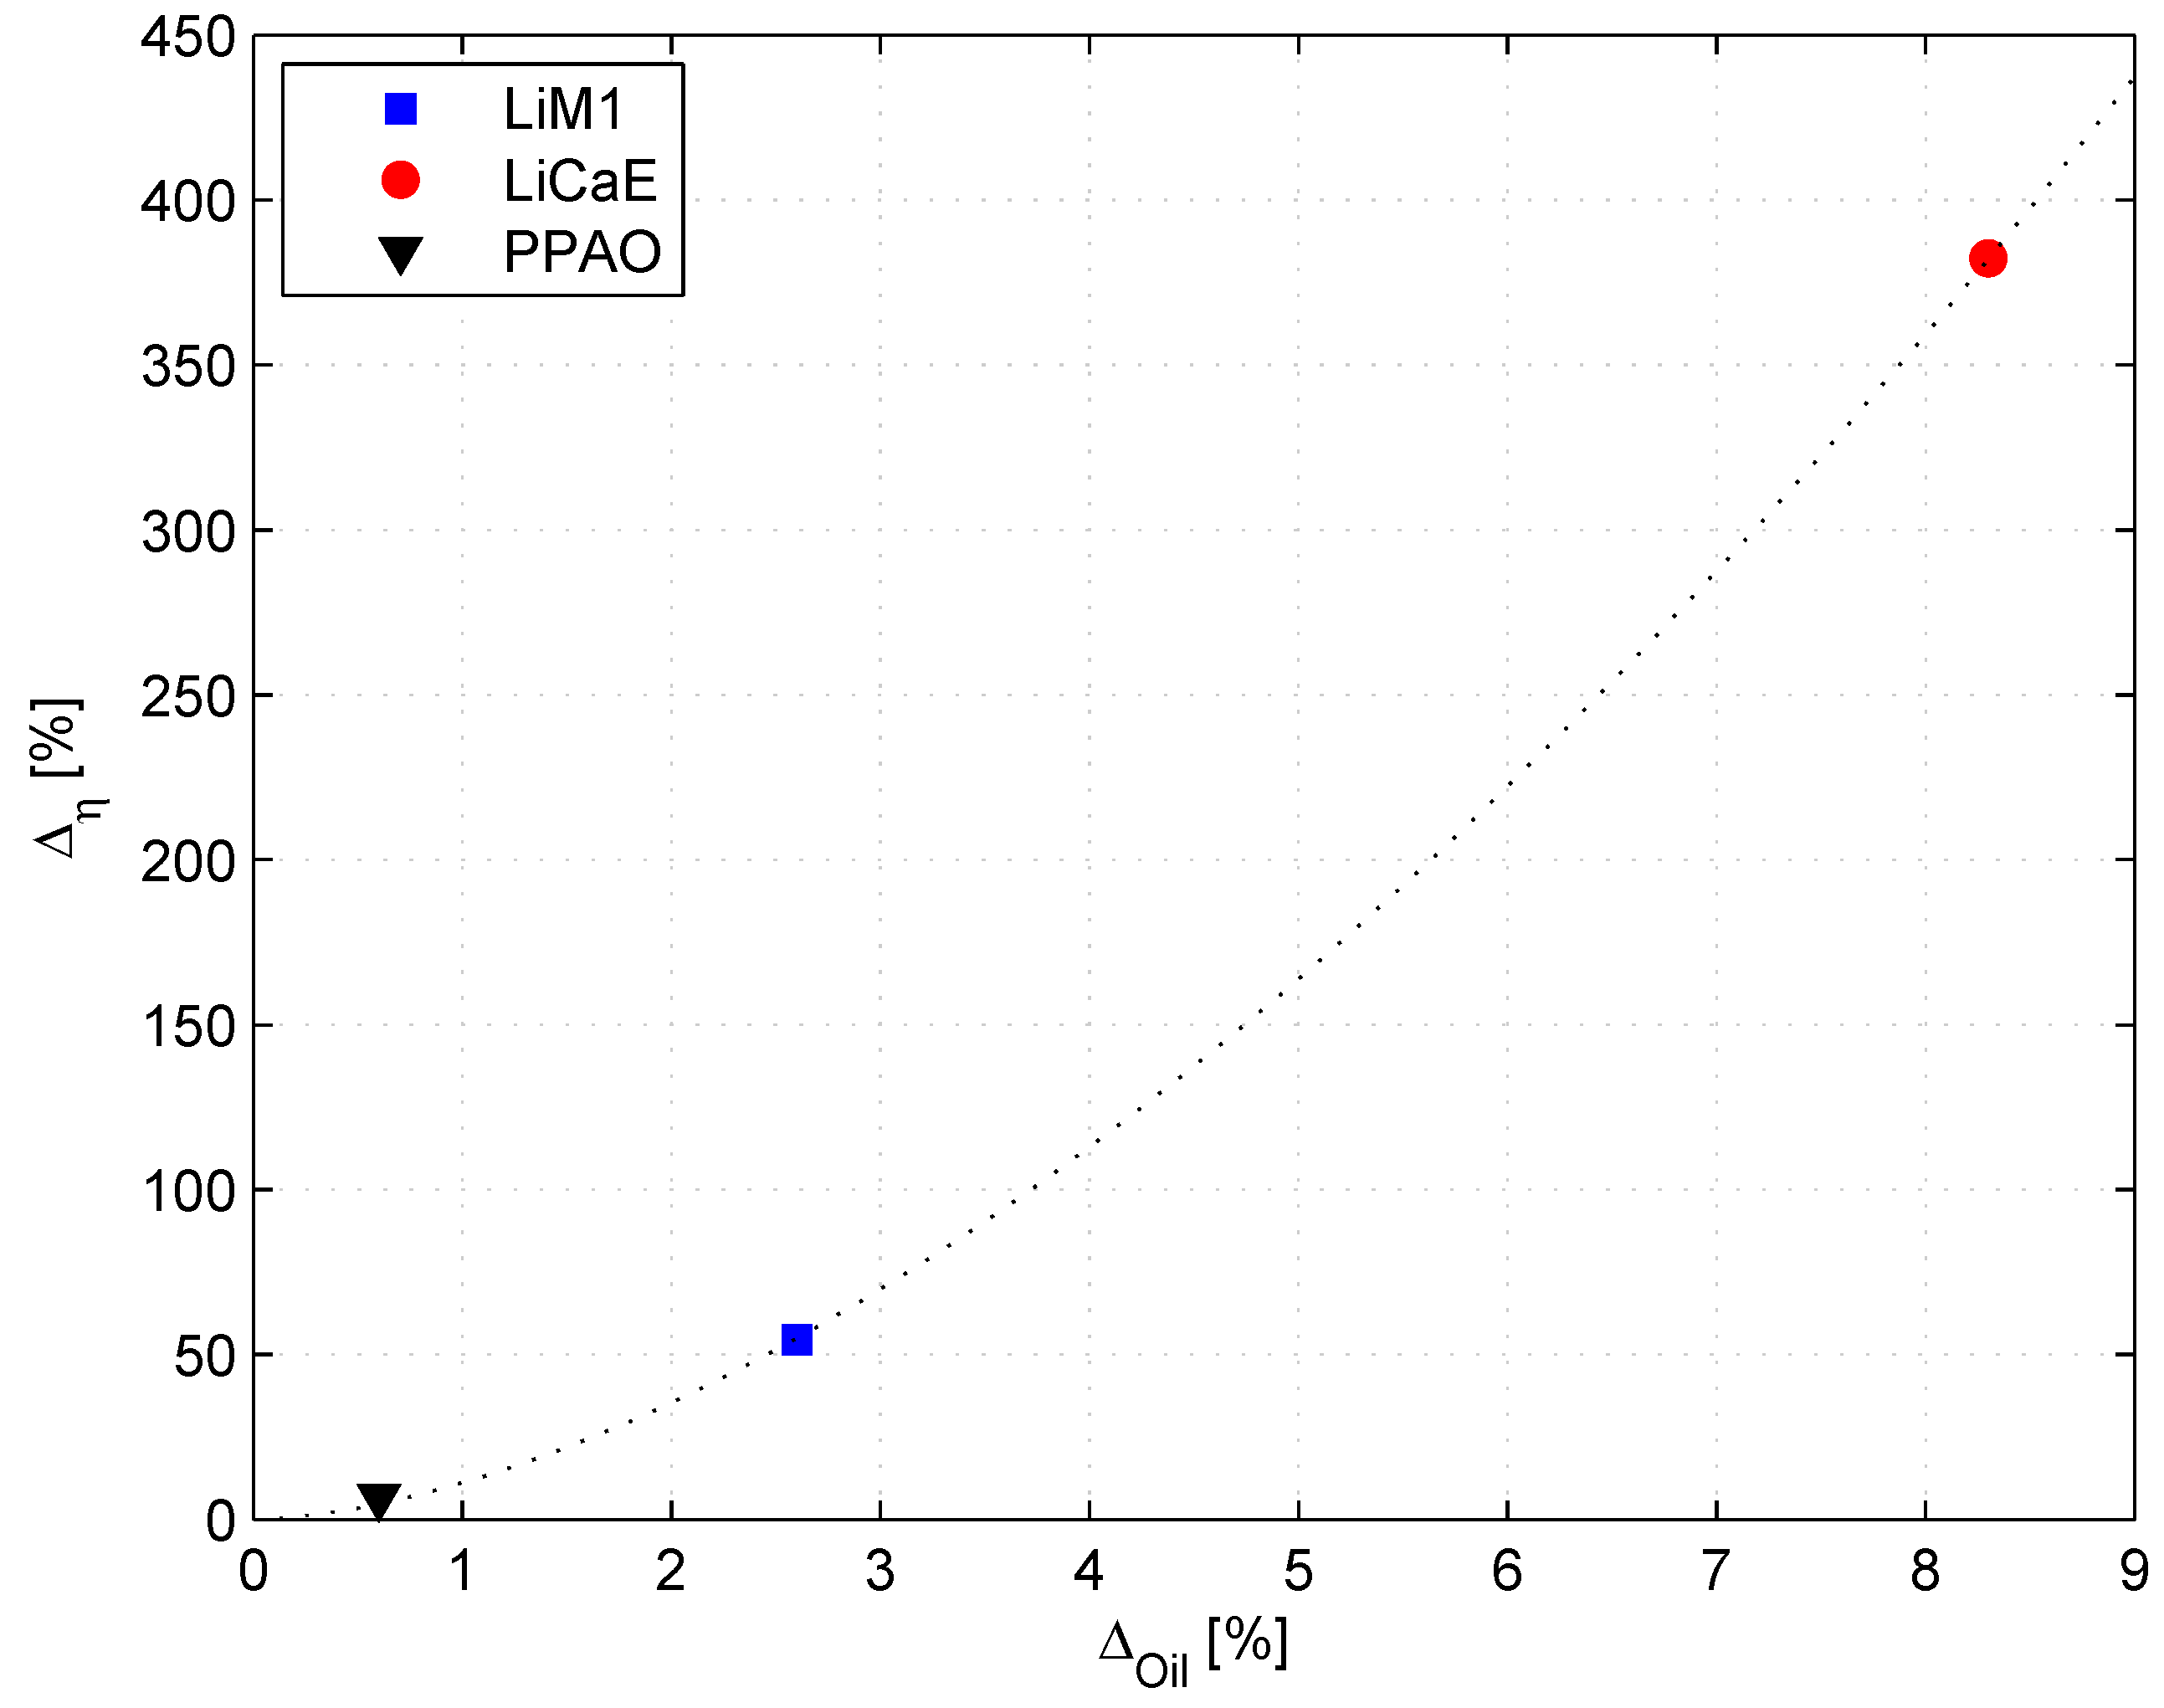
Figure 4 shows that
increases in a power law fashion with increasing oil loss (
). Grease oil loss most likely occurs due to evaporation and/or bleeding that occurred during the aging process; and the increase in viscosity can be related to different reactions that occur during the aging process, such as evaporation of the low weight compounds of the base oil and formation of high molecular weight molecules (polymerization). Due to the low level of oxidation observed in the LiM1 and PPAO lubricants, the increase in viscosity is probably due to the evaporation of the low weight compounds of the base oil, while the significant increase in the bled oil viscosity observed in the case of LiCaE is also attributed to polymerization, since LiCaE is highly oxidized.
Thermo-gravimetric analysis should be performed to confirm the results.
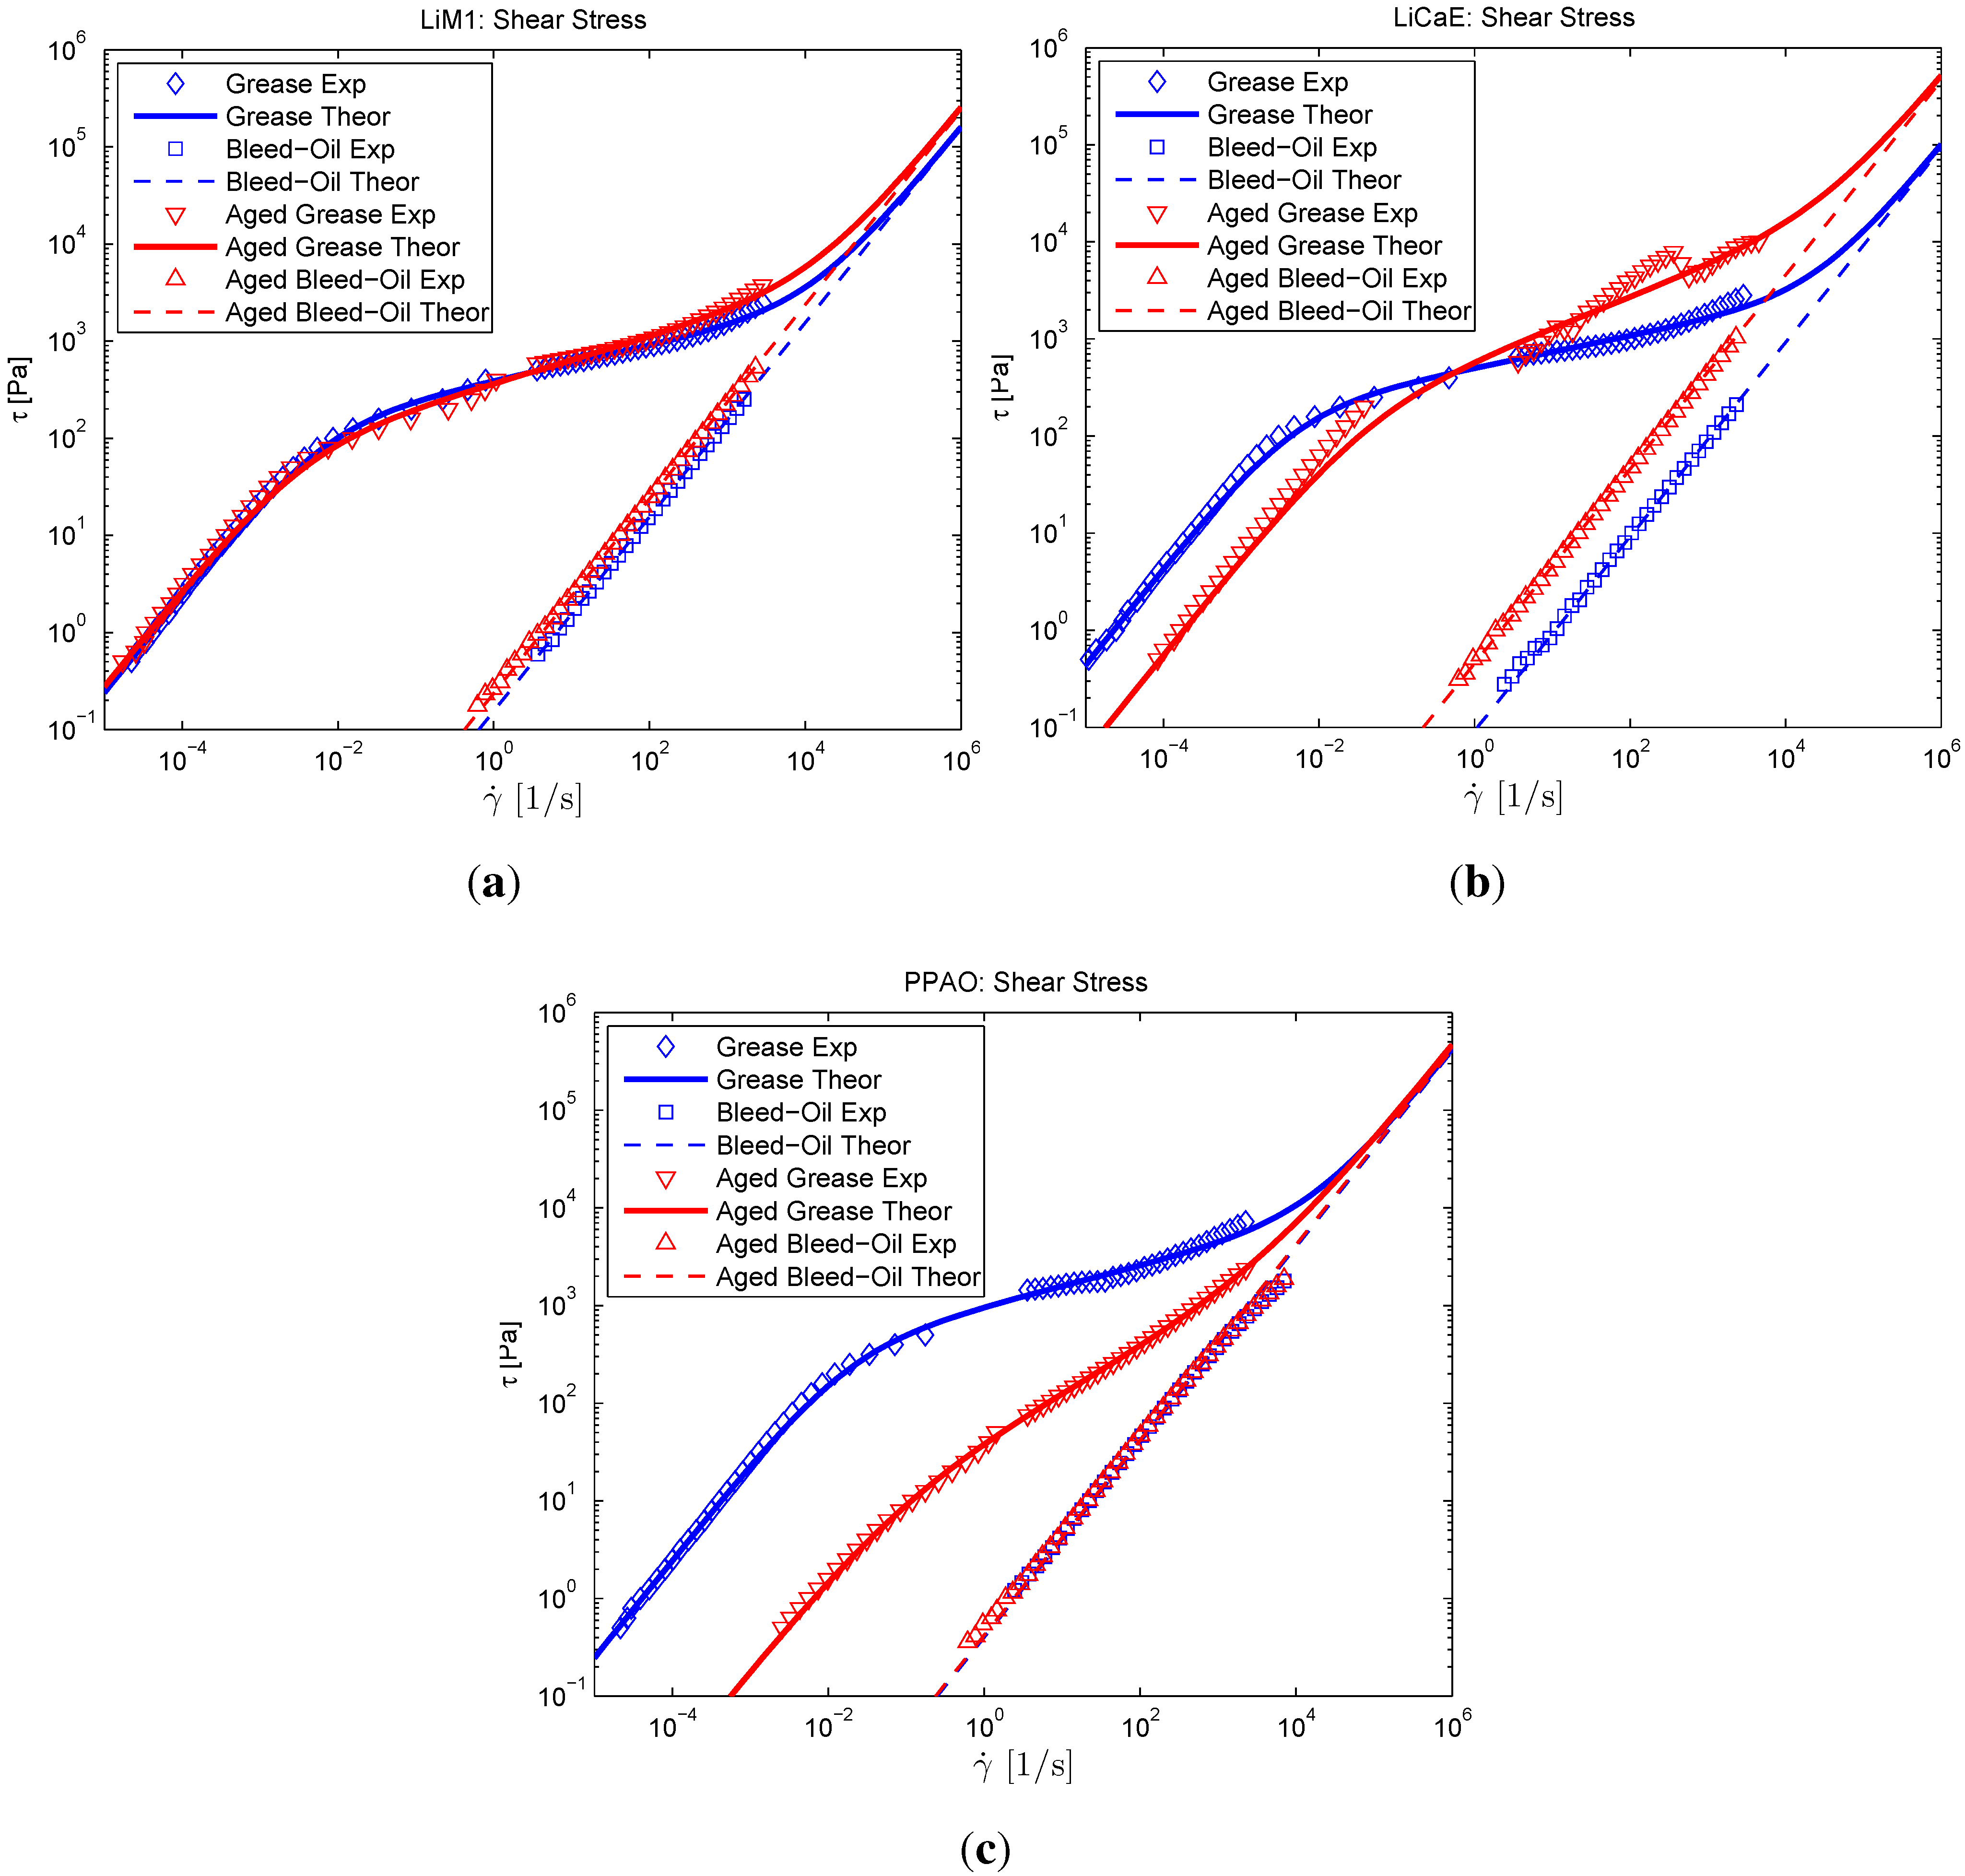
3.4. Rheological Analysis of the Lubricating Greases
The flow curves of fresh and aged lubricating greases and their bled oils are shown in
Figure 5. The theoretical values were calculated using the Cross model (re-written in terms of shear stress) for pseudo-plastic flow (see Equation (
1)) [
34]. This model describes the variation of the shear stress for the full shear rate range with reasonable accuracy and reads:
where
is the viscosity at very low shear rates (obtained from the oscillatory tests),
is the viscosity at medium to high shear rates (obtained from flow tests) and
K and
m are model constants, known as the critical stress and the power-law index, respectively. In the present work,
is assumed to be equal to the bled oil viscosity, and the model constants
K and
m were determined from Equation
1 by fitting them with the experimental results. The grease viscoelastic parameters obtained from the oscillatory tests are presented in
Table 5.
Figure 4.
Relative dynamic bled oil viscosity versus oil loss (Δη × Δoil).
Figure 4.
Relative dynamic bled oil viscosity versus oil loss (Δη × Δoil).
Although aged samples of LiM1 are not or just slightly oxidized, additive consumption, oil loss and increased bled oil viscosity were observed. This suggests evaporation of the low weight compounds in the base oil. The oil loss, due to bleeding and evaporation, promotes grease stiffening, which was observed by the increase of all rheological parameters ( and ).
Aged samples of LiCaE showed significant oxidation, thickener degradation and oil loss. Consequently, a significant increase in bled oil viscosity was observed. At low stresses (low shear rate or low shear stress), where the rheological response of lubricating greases are dominated by their thickener structure, the aged LiCaE sample showed a softening behavior, which is likely due to thickener breakdown (chain-scission reactions) and might be related to the formation of oxidation products. This can be observed by its lower oscillatory parameters (
and
) and lower shear stress values at the low shear rate range (
10 s
) in the flow curve (
Figure 5). However, at higher stresses (high oscillatory stress and high shear rate), where the rheological response of the lubricating greases are dominated by their oil, the LiCaE aged sample showed a stiffening behavior due to its increased bled oil viscosity. This was verified by its higher oscillatory parameters (
and
) and higher shear stress values at high shear rates
10 s
in the flow curve.
Aged samples of PPAO were not or just slightly oxidized; the oil loss and viscosity increase were low, but significant chemical changes in the range of 2853–2953 cm
, representing chain-scission reactions, were observed. Chain scission reactions shorten PP chain length and consequently lead to decreasing values of apparent viscosity and other rheological properties [
35], which decreases significantly the grease consistency. This was noted in all rheological parameters (
and
) that were measured.
Figure 5.
Shear stress versus shear rate. Comparison between fresh and aged samples. (a) LiM1; (b) LiCaE; and (c) PPAO.
Figure 5.
Shear stress versus shear rate. Comparison between fresh and aged samples. (a) LiM1; (b) LiCaE; and (c) PPAO.
Table 5.
Storage and loss moduli versus oscillatory stress. Comparison between fresh and aged samples at 40 °C in the visco-elastic region (LVE) region.
Table 5.
Storage and loss moduli versus oscillatory stress. Comparison between fresh and aged samples at 40 °C in the visco-elastic region (LVE) region.
| Grease | (Pa) | (Pa) | (Pa) | (Pa) |
|---|
| LiM1 | 23,690 | 27,523 | 2,778 | 2,958 |
| LiCaE | 44,893 | 5,847 | 5,895 | 2,740 |
| PPAO | 24,957 | 28 | 4,394 | 56 |
It is important to notice that the PPAO aged grease viscoelastic response (
Figure 5(c) and
Table 5) has practically vanished, and its consistency decreased considerably. This has serious implications on grease performance, since lubricating greases should be attached to the seals, bearing shoulders or cage, forming a lubricant reservoir and providing a sealing action. Without a proper viscoelastic behavior under low stress level (
), lubricating greases cannot provide an appropriate lubrication, as observed by Lundberg
et al. [
18,
36].
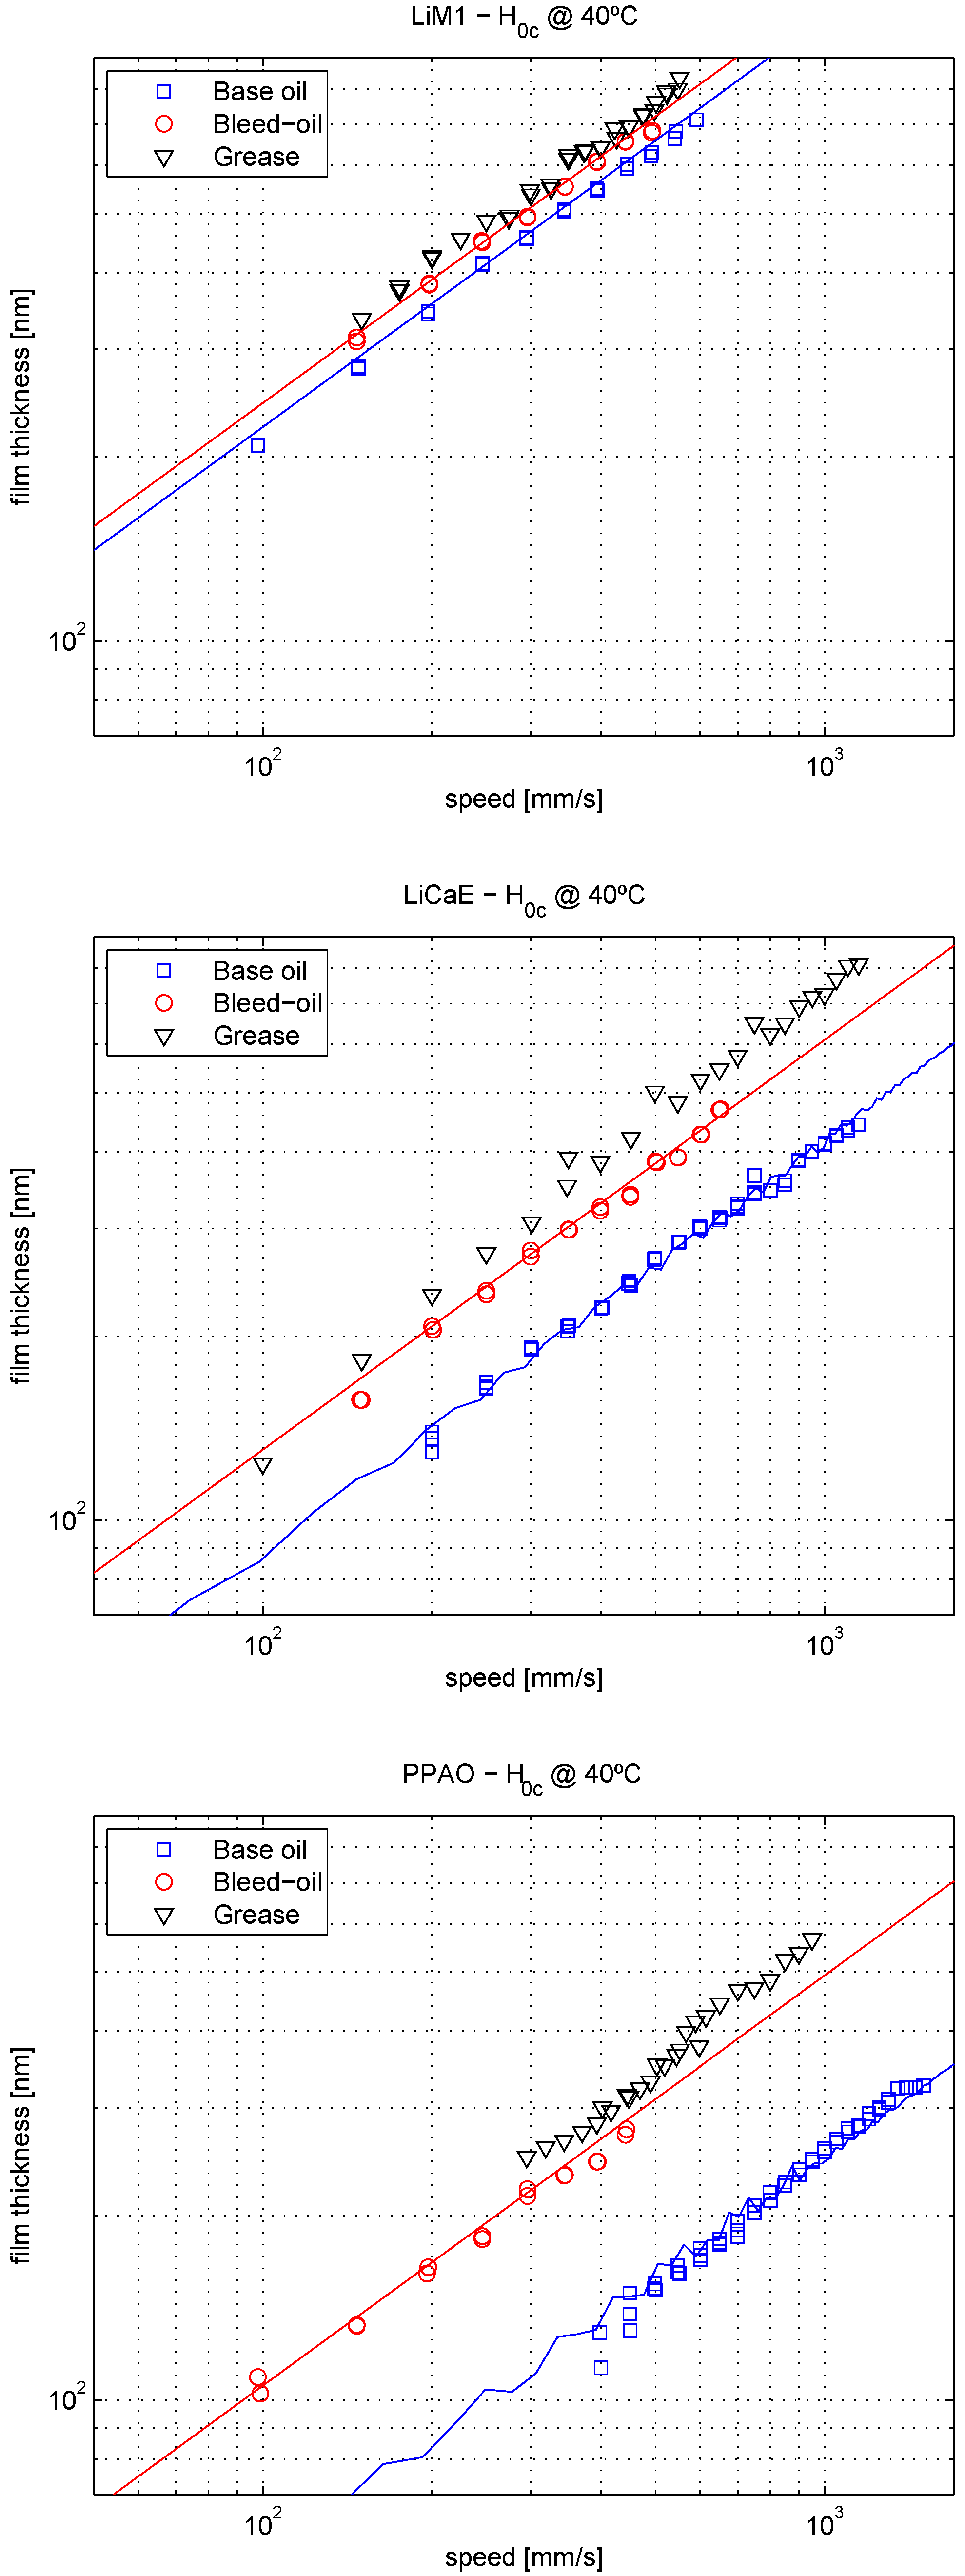
3.5. Film Thickness: Fully-Flooded
Figure 6 shows the central film thickness
versus the entrainment speed of the fresh lubricating greases, their corresponding base and bled oils at a constant temperature of ≈40 °C . The results at 60 and 80 °C showed the same trends and can be seen in [
2].
This figure showed the typical increase of the film thickness with an entrainment speed at a rate of approximately
for all lubricants, suggesting a Newtonian behavior in the inlet region [
37]. This figure also shows that the mineral lubricants have the highest film thickness values, followed by the ester ones, which are just slightly higher than the PAO lubricants. It is important to notice that film thickness does not follow the same order of the bled oils low shear viscosity due to the shear thinning characteristics of the PAO bled oil, as detailed in [
38]. Furthermore, it is shown that each grease and its bled oil generated a similar central film thickness, which is higher than the ones generated by the base oils.
Other evidence showing that bled oil better characterizes lubricating grease film formation than its base oil was shown by Per-Olof Larsson [
39] in 1996 and by Couronné
et al. [
40] in 2003, both of whom obtained bled oil through static bleed tests.
The recent publication of Morales
et al. [
3] showed that grease film thickness prediction using the base oil properties might differ significantly from the measured ones depending on the grease type and operating conditions. In a further work, Morales [
41] attempted to predict the film thickness of the lubricating greases that behaved different than their base oils using the bled oil properties, which did not work as well. These results are extremely important, because they showed that, for some types of grease, film thickness prediction under fully-flooded lubrication is still a challenge. This brings back the focus of the study of EHL film formation on grease-lubricated contacts, which so far has been considered to be equal to the base oil film thickness. It also opens new research lines to predict grease film formation considering the grease properties under typical EHL conditions instead of film measurements.
The relative film increment between base and bled oils (or greases and their base oils, since
) is particular to each lubricant and depends on the operating conditions. At 40 °C , this difference is ≈80% in the case of the PPAO, 40% in the case of the LiCaE and only 10% in the case of the LiM1. Such differences were shown to increase significantly with temperature [
2].
Cann
et al. [
6] also studied the difference in central film thickness between greases and their base oils. She observed differences from 2.5% to 24.8% for lithium greases formulated with conventionally-refined base stocks and that this difference increased up to 88% when calcium was blended with the lithium, although thickener concentration, base oil type and viscosity were kept constant.
The lines shown in
Figure 6 represent the film thickness prediction of base and bled oils considering the measured temperature, which explains the stepwise shape of these curves. The used methodology to calculate these values considers the shear thinning behavior of the PAO oils and is presented in [
38].
Figure 6.
Film thickness versus entrainment speed: comparison between grease, base oil and bled oil at 40 °C .
Figure 6.
Film thickness versus entrainment speed: comparison between grease, base oil and bled oil at 40 °C .
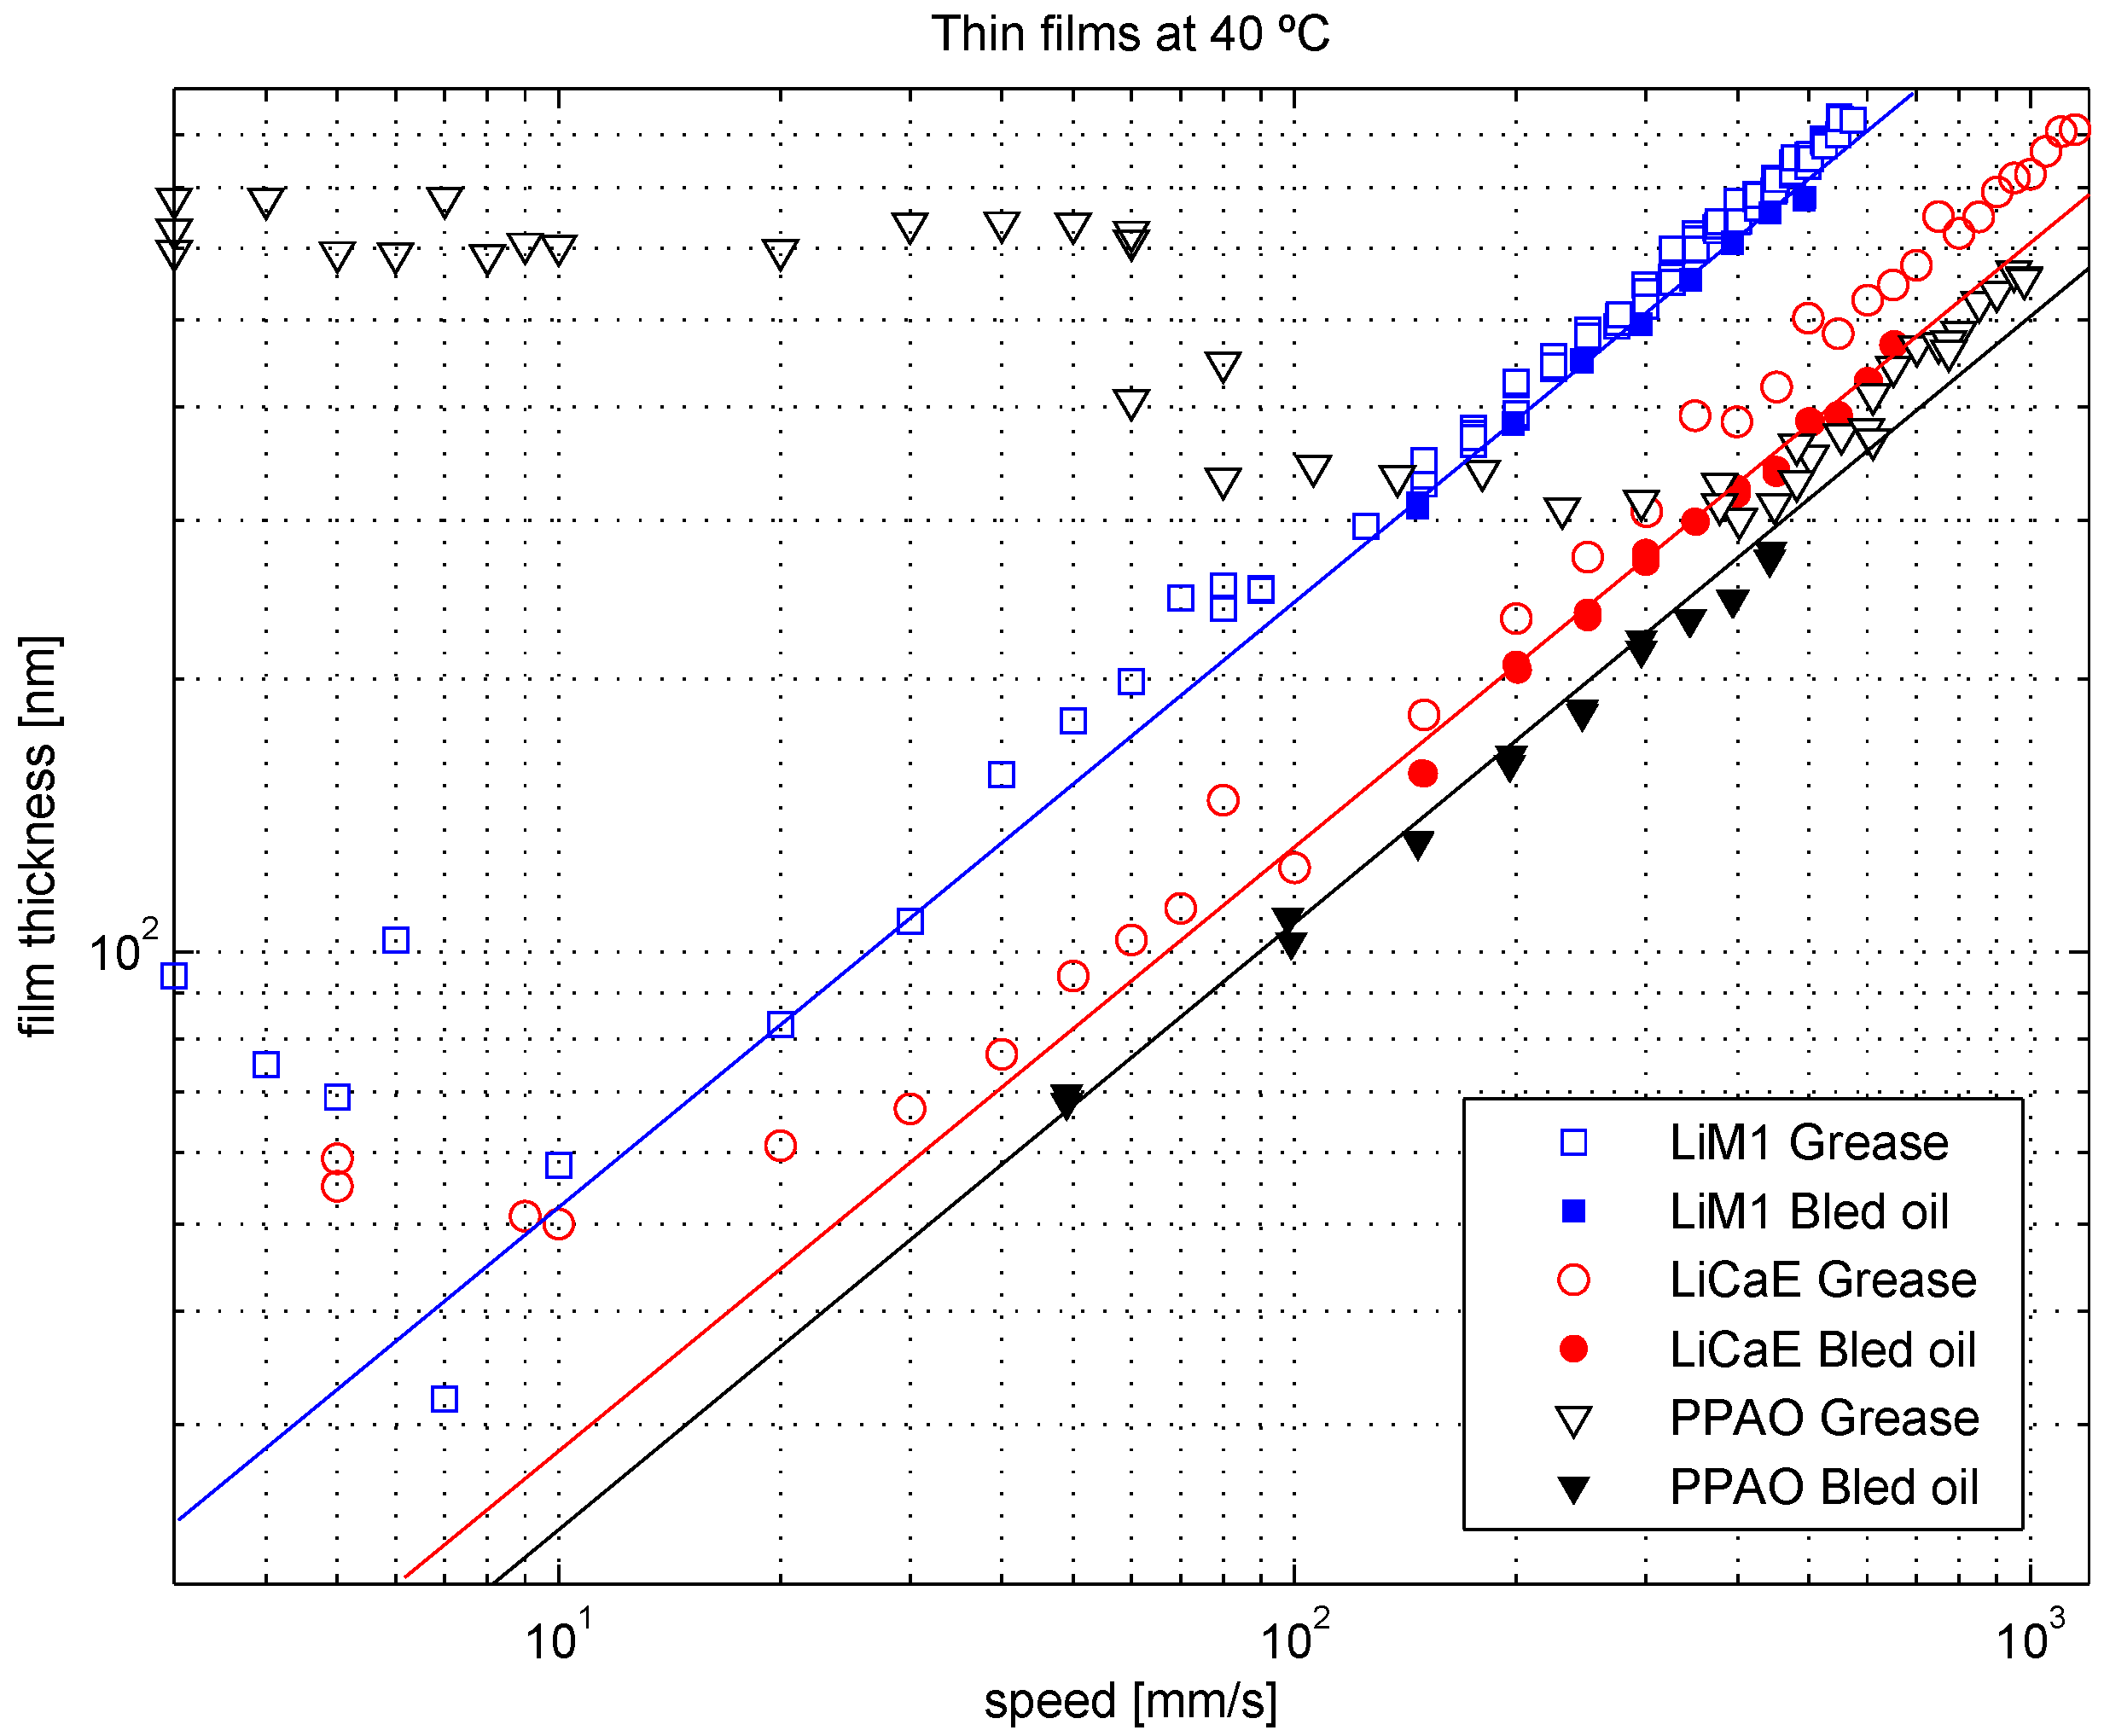
3.6. Film Thickness: Fully Flooded and Low Speeds
Figure 7 shows the measured (markers) and predicted (continuous lines) film thickness values
versus entrainment speed for all lubricating greases and their bled oils.
Figure 7.
Thin film thickness measurements versus entrainment speed at 40 °C and P0 = 0.5 GPa. Greases and bled oils.
Figure 7.
Thin film thickness measurements versus entrainment speed at 40 °C and P0 = 0.5 GPa. Greases and bled oils.
The grease film thickness behavior (e.g., ) mostly differs from that of its bled oil at low speeds. While the bled oil film thickness decrease rate () remains constant when the speed goes towards zero, lubricating greases show a decreased rate that goes from at high speeds, pass by a minimum value () and increase again up to very high values when the speed goes towards zero. In this last region, measurements fluctuate wildly, the standard deviation is very high and the increasing film thickness with decreasing speeds is not always linear (in a log-log plot).
The speed value with which the film thickness changes its manner () depends on grease formulation. LiM1 changed the traditional Newtonian behavior when mm/s, LiCaE at mm/s and PPAO at mm/s. At speeds lower than , lubricating greases showed an increasing trend, with PPAO grease reaching values of nm.
The PPAO lubricating grease showed a better capacity for forming a thick film at low speeds, followed by the LiCaE and LiM1. This is most likely related to the thickener type, morphology and concentration, since such behavior was not as evident in the bled oils, where several additives, but no or hardly no thickener, were evidenced (see
Figure 1). It is also important to notice that whatever contributed to the film formation at low speeds did not contribute (or its contributions are negligible) at higher speeds, where the grease film thickness is similar to the bled oil film thickness. This suggests that the film thickness at low speeds is mostly governed by the thickener, co-thickener and additives passing through the contact instead of chemical absorption.
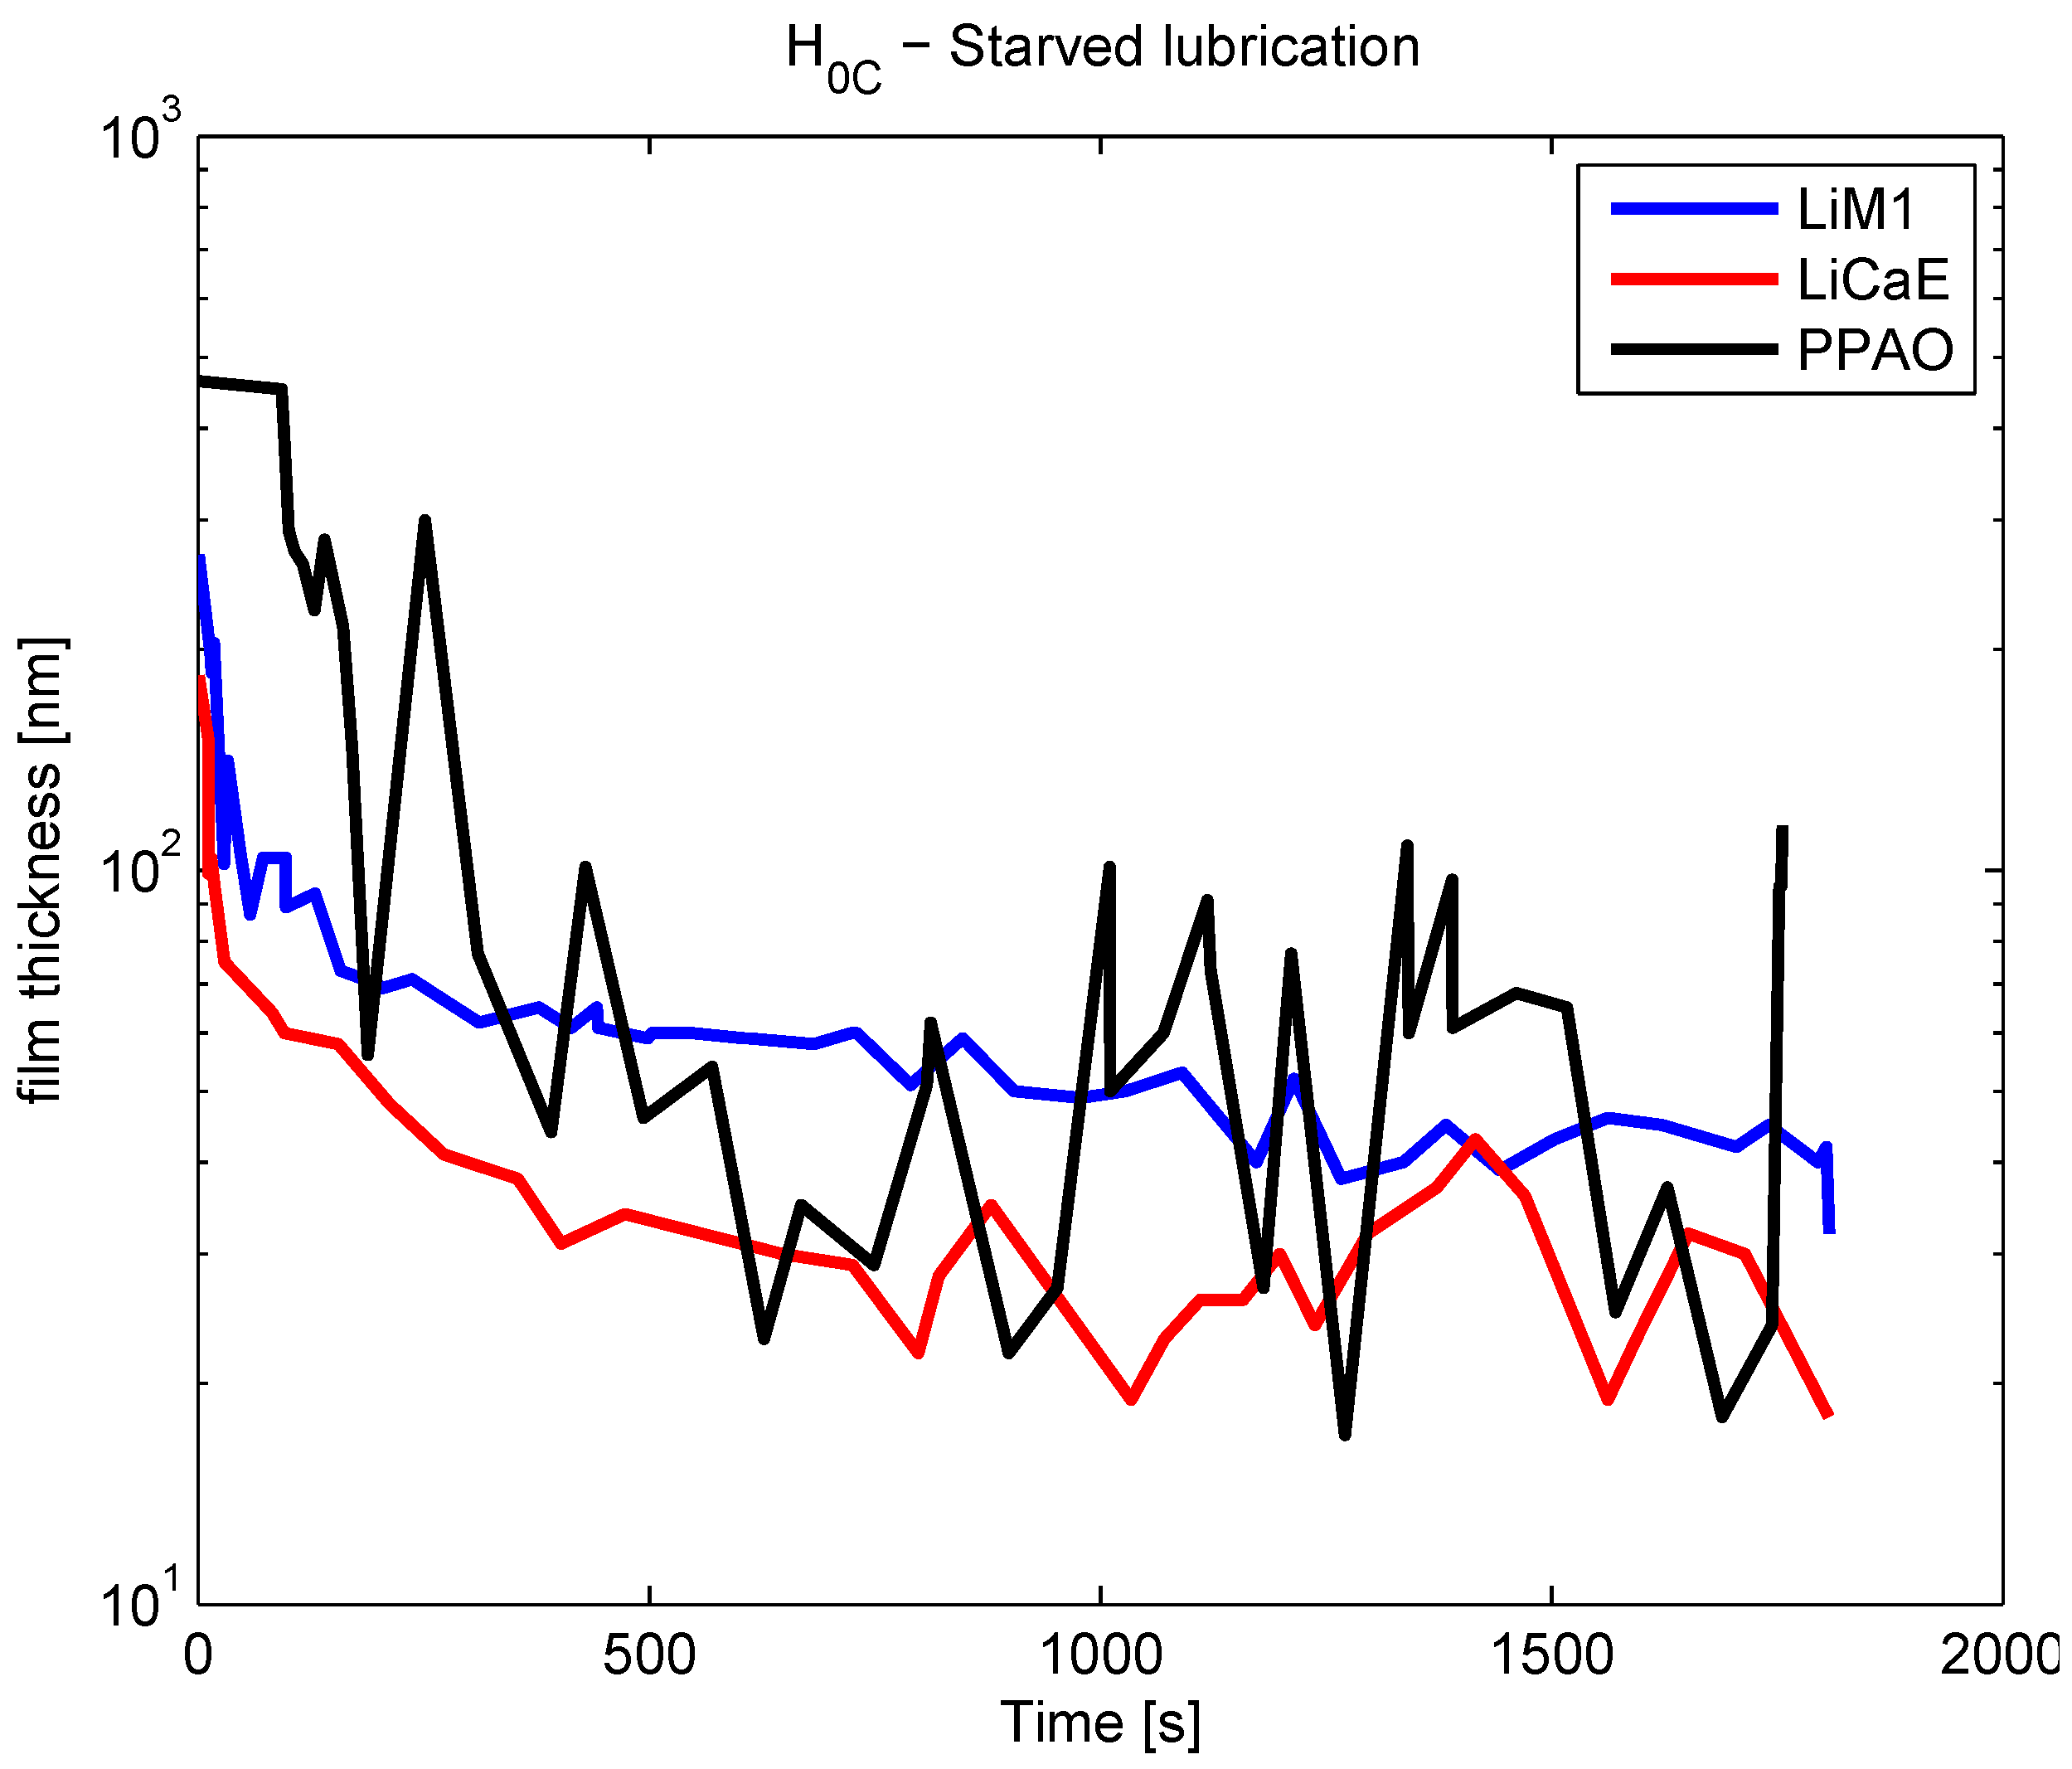
3.7. Film Thickness under Starved Lubrication
Figure 8 shows the film thickness measurements under starved conditions during
t = 30 min at 40 °C and
m/s. All greases revealed a quick film thickness decay followed by a significant reduction of the decay rate with time (stabilization).
Table 6 shows the average film thickness for
t > 1250 s.
Figure 8.
Starved grease film thickness versus time at P0 = 0.5 GPa, T = 40 °C and mm/s.
Figure 8.
Starved grease film thickness versus time at P0 = 0.5 GPa, T = 40 °C and mm/s.
Table 6.
Average film thickness for t > 1250 s. GPa, T = 40 °C, mm/s.
Table 6.
Average film thickness for t > 1250 s. GPa, T = 40 °C, mm/s.
| | LiM1 | LiCaE | PPAO |
|---|
| Film thickness (nm) | 50.4 | 28.3 | 63.2 |
| Variation (nm) | ±16 | ±12 | ±45 |
The very high standard deviation in these measurements is related to grease materials crossing the contact, as already reported by [
9,
37,
42]. This may indicate that the constituents of PPAO grease pass through the contact more often and in larger lumps than the constituents of LiM1 and LiCaE, which is in agreement with the findings of Couronné
et al. [
40] and Cann
et al. [
43] and with the thickener size presented in a previous work [
17].
Longer test periods and measurements at zero speed should be performed for a better evaluation of a grease’s capacity to form a film under starved lubrication. The results shown in
Figure 8 only indicate that PP seems to contribute the most to increasing the film locally, Li seems to contribute the least, whilst Ca is in between the two. This could be related to the thickener’s capacity to survive mechanical work to which it is submitted, and thus, the thickener that survives this work with larger lumps is more likely to generate higher local film increasing.
In case the local increase in film thickness were disregarded after stabilization (time >1250 s), the film thickness would be higher for LiM1 grease (≈40 nm), followed by LiCaE, which is only slightly higher than PPAO (both ≈20 nm). This suggests that the lubricant film is formed by a thin layer of bled oil and is constantly, but momentarily, increased by the thickener passing through the contact.
3.8. Film Thickness: Aged and Fresh Greases under Fully-Flooded and Starved Lubrication
Throughout
Section 3.1 to
Section 3.4, several significant changes to the lubricating greases and their bled oil viscosities due to aging (degradation) were shown. Changes to the pressure-viscosity coefficient, therefore, are also expected, as verified by Bair
et al. [
44]. Consequently, the capability of aged greases to form and keep a separating film might be different from fresh greases.
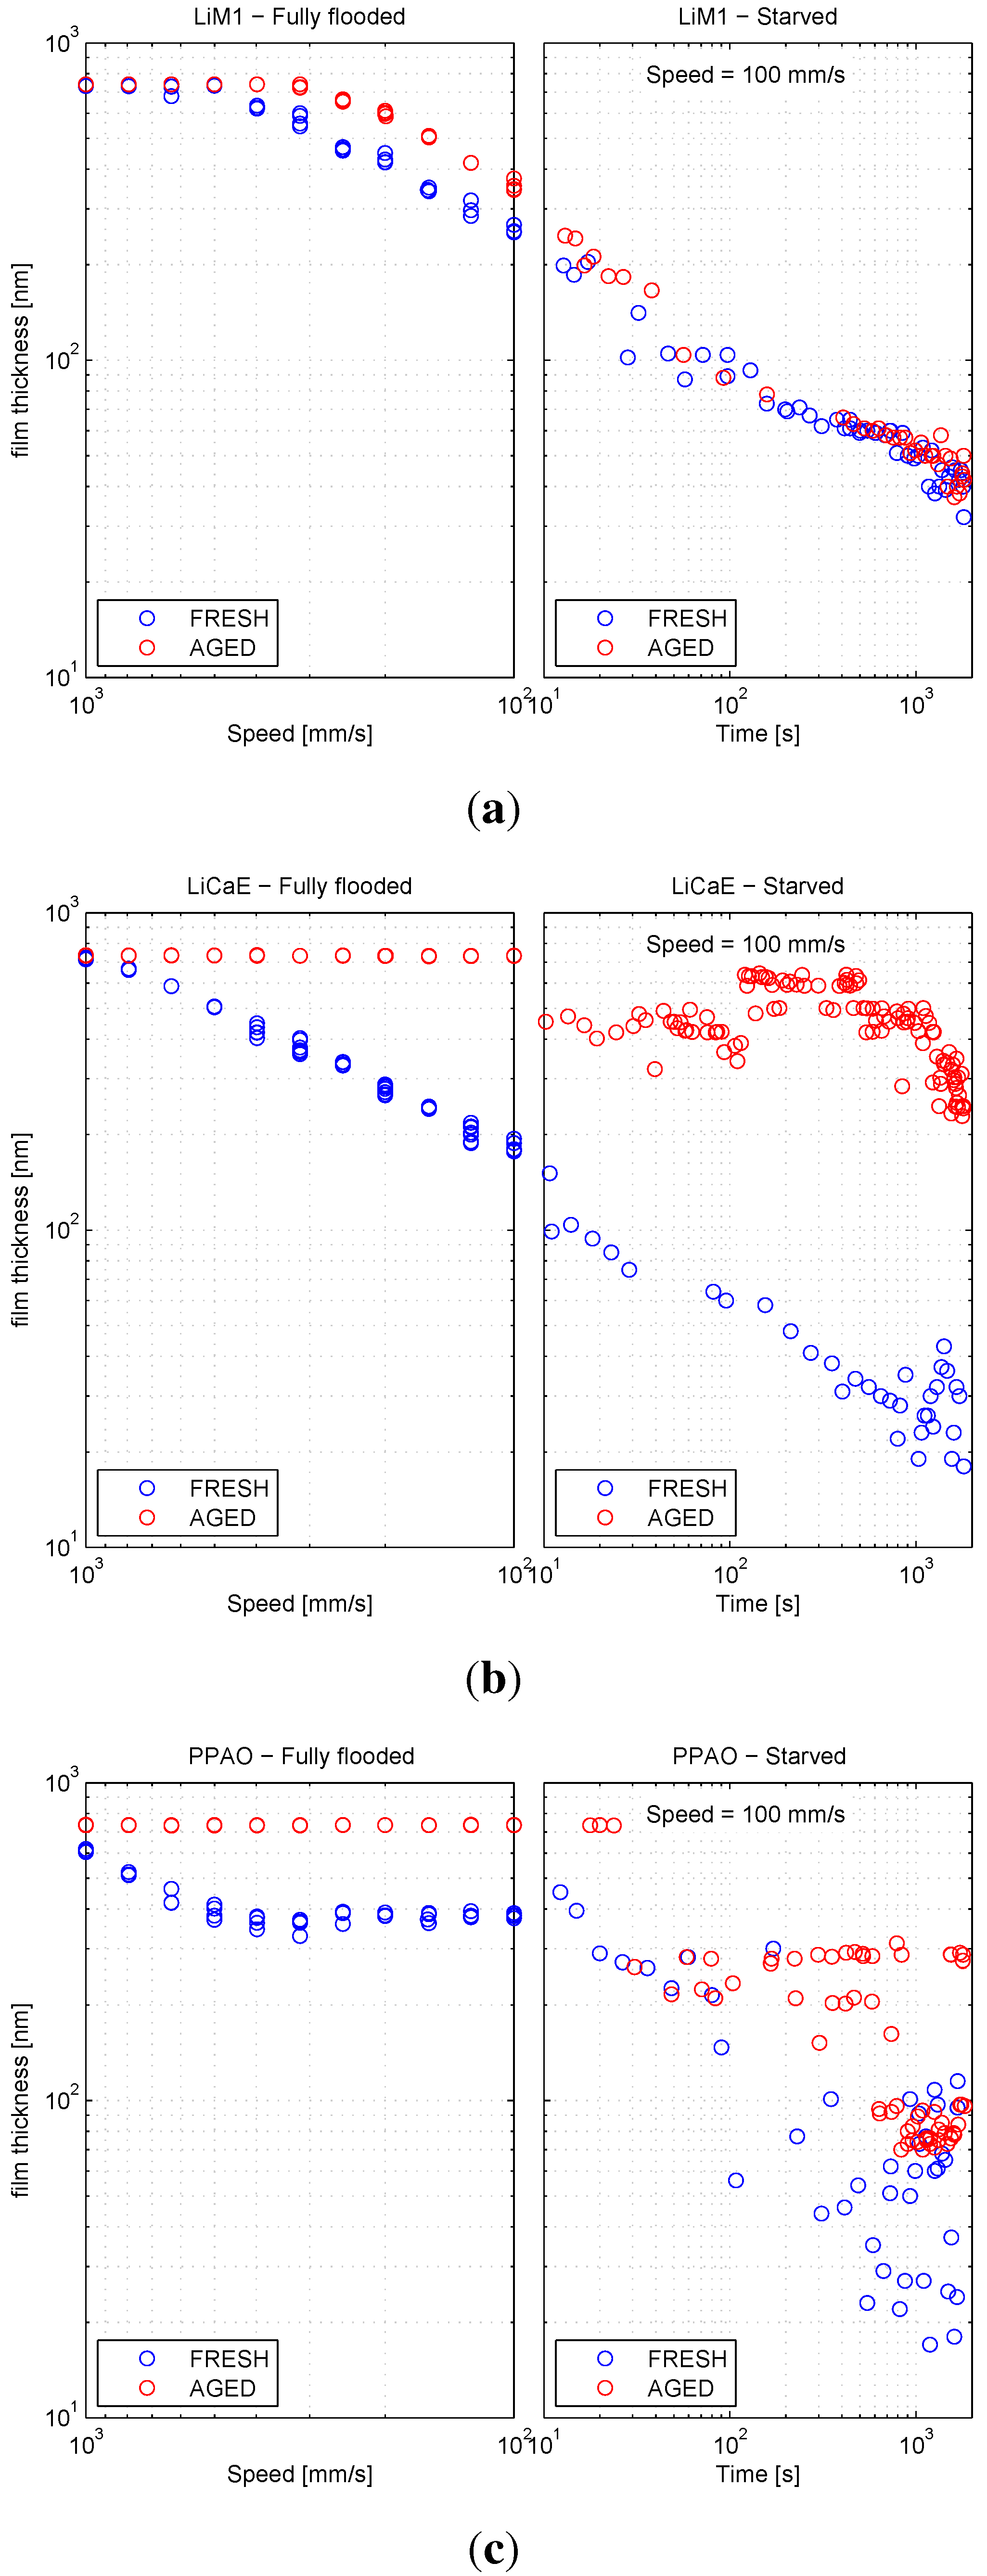
These differences are shown in
Figure 9, where the film thickness measurements under fully-flooded (left) and starved (right) conditions are presented for the fresh and aged grease samples.
All of the aged greases generated higher film thickness values than the fresh ones. Some of those were above the measuring limit (≈750 nm) of the optical device. This is depicted by the constant film thickness values of ≈750 nm observed in the figures.
In the case of aged LiM1 grease, oil loss and low levels of oxidation and of rheological changes, together with the significant increase in bled oil viscosity 54.6%, suggest that the grease lubrication mechanisms are still similar to the fresh one, although the bled oil is more viscous. Therefore, this increase in viscosity might explain the increased film thickness of 40%.
Under starved conditions, fresh and aged LiM1 samples showed similar film thickness decay with time. According to the thin layer flow model developed by Venner,
et al. [
45], lubricating greases with higher oil viscosity at the contact inlet should present a lower decay rate with time. This was not observed here, which may indicate that the other constituents of the grease play a role in the film decay rate.
LiCaE grease showed much higher film thickness values after the aging process. Even at a low speed (100 mm/s), the measured film thickness values were above the limit of the optical device (≈750 nm). Contrary to the LiM1, aged LiCaE was highly oxidized, lost a significant amount of oil, presented several rheological changes, additive consumption and an increase in bled oil viscosity of 382%. Furthermore, when submitted to the centrifugal oil bleed test (ASTM D4425), it did not release any oil during 72 h running at high speeds (2000 rpm; that is, ≈20 m/s) and at 70 °C . This suggests that the lubrication mechanisms of the aged LiCaE grease are not solely governed by its more viscous oil (which would not justify by itself the film thickness increasing), but also by a material with enhanced viscosity or a solid-like thick film, which may be formed by oxidation products and/or thickener material and/or bled oil.
Under starved lubrication, the aged sample of LiCaE retained a significantly high film thickness over time, while the fresh sample decayed rapidly. The film thickness values of the aged sample are approximately one hundred-times higher than the fresh one when 30 min. The almost time-independent film thickness of the aged grease supports the idea of the active film having an enhanced viscosity that is not easily ejected by pressure or centrifugal forces or being a deposited solid-like layer.
Figure 9.
Film thickness versus entrainment speed. Comparison between fresh and aged samples (a) LiM1, (b) LiCaE and (c) PPAO.
Figure 9.
Film thickness versus entrainment speed. Comparison between fresh and aged samples (a) LiM1, (b) LiCaE and (c) PPAO.
In fact, Cann [
46] showed that the presence of additives seems to prevent thickener deposition and that non-additized greases generated deposited films consisting mostly of degraded thickener as high as 600 nm (after 300 min), while additized greases did not form such thick films. In the case of LiCaE, where most of additives were consumed after aging, it is likely that the film is not solely controlled by the bled oil properties, but also by a solid-like or enhanced viscous film formed mostly of degraded grease with a high thickener content deposited in the track.
Under fully-flooded lubrication, PPAO also showed higher film thickness values after the aging process. At a speed of 300 mm/s (
), the relative film thickness increment is at least 110%. This film thickness increment is not clear. This does not seem to be related to the bled oil properties, because the increasing in viscosity with aging was small
, which most likely implies small changes of the pressure-viscosity coefficient,
, when, for a perfect
R fitting with the measured film thickness values, a
of at least ≈112% would be required. This also does not seem to be related to the level of oxidation, because PPAO grease was not or just slightly oxidized. Grease softening, which is often related to contact replenishment [
47], may not show significant effects in the case of fully-flooded tests, because replenishment is imposed. This suggests that the film thickness increment is mostly related to additive consumption, which “allowed” for the deposition of thick layers of grease material in the track.
Under starved lubrication, the aged sample of PPAO retained higher film thickness values than the fresh sample. According to Kaneta
et al. [
47], grease shear degradation results in thicker films due to the suppression of starvation,
i.e., softening of the grease will improve its flow, thus improving contact replenishment. Besides, as stated earlier, consumption of additives might allow for the deposition of degraded grease in the track, which also increases film thickness. Aged PPAO also showed high local fluctuations in film thickness values, although lower than the fresh sample. The reduction of local fluctuations in film thickness may also be attributed to thickener degradation [
47], which reduces the size of grease material entering the contact.


