Abstract
Lubricating greases are colloid disperse systems consisting of a base oil and a thickener (additional additives). The lubricant is modeled as a tribological system, and the reaction of a fluid friction stress is investigated. The energetic situation of the volume element is analyzed and the system entropy described. The description of the structural degradation and the used entropy was realized with the help of rheometer tests.
1. Introduction
Friction processes lead to irreversible effects inside a tribological contact. The most well-known phenomenon is called wear and can be observed, for example, as a loss of material. Until today, it has been an ambitious task to model the tribological process. This is due to the complex structure of engineering surfaces, severe contact deformation mechanisms, complex lubricant behavior, etc. [1].
The focus of the presented work is the irreversible effects of friction inside the grease film and the reaction of the observed system from an energy point of view.
Tribo-systems are essentially energy-driven systems influenced by thermodynamic constraints. The system’s situation is determined by these constrains. This means that the entropy generation and transport (as such, constraints) decide the integrity of the involved materials [2]. The work of friction as a disordered form of energy is released as a consequence of applied friction force to the system. The result is a disturbance of the order of the tribo-system and the attempt of the system to extinguish the source of disorder.
That means that a combination of dissipation mechanisms is initiated to dissipate the disturbance energy (see Figure 1; the change of stable and unstable state as an interaction between the system and the test conditions).
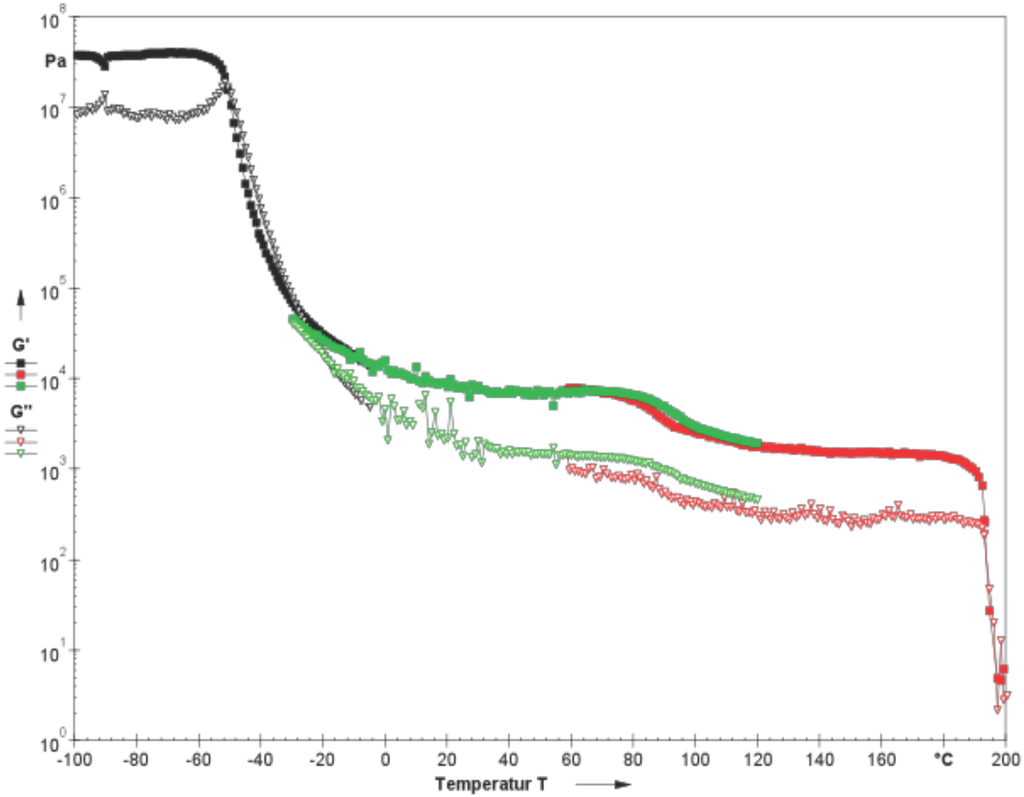
Figure 1.
Behavior of grease sheared with a constant small deformation (oscillation) over a wide temperature range.
Figure 1.
Behavior of grease sheared with a constant small deformation (oscillation) over a wide temperature range.

Applied to the modeled sub-tribo-system inside the grease film, the energetic stress induced a process to lower the energy level of the system by adopting a dissipative mechanism, like structural degradation. The energy dissipation due to the change (degradation) of the thickener structure characterizes the irreversibility of the observed tribological process. As seen in a number of papers, irreversible thermodynamics seems to be a natural candidate to study the friction and wear processes [3,4,5].
2. Theoretical
2.1. General Remarks
Equilibrium thermodynamics is based on the principle of energy conservation (first law) and the consideration that every flowing process has only one direction (time arrow). The produced entropy has to be ≥0 (second law). The observation of tribological processes means an investigation of processes situated in non-homogenous and non-equilibrium systems.
Irreversible thermodynamics is based on the assumption that systems with irreversible processes are characterized by a finite number of state variable fields. The flow of these processes is expressed by a dependence on time and a local dependence. It is required that volume elements are situated in thermodynamic equilibrium, called the local equilibrium.
We know from the first and second law of thermodynamics that essential information about extensive parameters, like inner energy and entropy, were obtained in the form of balance equations. This kind of equation is also important for the non-equilibrium thermodynamics.
In the entropy balance equation, a source term (the strength of entropy source or entropy generation density) arises [6]. This term obtains essential information about the flowing irreversible processes.
2.2. Balance Equation
We observe an extensive parameter S inside a defined volume. The amount of that parameter can be changed by a transfer across the boundary of the system (flow into or out of the system ) or by a production inside the volume (). Related to time, it can be obtained:
with:
The amount of —the flow through the surface of the defined volume and related to time—can be expressed by:
where presents the total flow S, Ω the surface of V and the surface element. The amount is generated inside the volume element V and can be expressed by:
The strength of entropy source γ is defined as entropy produced per unit time and per unit volume. It is:
Here, s is the entropy per unit mass. Using the equations above, the local form of Equations (1) and (2) can be obtained with:
where presents the difference of (). The entropy production term gives the important information for every real process:
With the assumption of local equilibrium and related to time, the total differential is given by the Gibbs-relation:
Neglecting chemical reactions and using balance of mass, balance of energy and balance impulse [7], it can be obtained:
The first term on the right side of Equation (9) presents the entropy flux; the other terms belong to the entropy production.
Abdel-Aal [8] investigated the change of the heat conduction behavior of solids due to friction. He applied the general information from Equation (9) to an open tribological system and obtained for the strength of the entropy source:
We find three contributions to a net balance of the entropy source for an open system. The first term presents the traction work (intrinsic dissipation); the second term presents the heat conduction (thermal dissipation); and the third term considers the exchange of material.
As illustrated in Figure 2 and explained in the following sections, these three contributions can be described for the investigated tribological system inside the grease film.
2.3. General Modeling
The idea of the heat flow, mass exchange and entropy transport for the developed model is illustrated in Figure 2. A volume element inside the grease film is investigated. This volume element comes in sliding contact with a number of grease volume elements (only one contact zone of that theoretical concept is considered). Each of them is characterized by different properties, like density, elastic behavior, accumulation behavior, etc. The so-called fluid friction generates a heat amount that partially enters a contact zone () and increases the inner energy of that region. A heat amount of that thermal load () is conducted (related to the temperature gradient) into the stressed volume. The stress leads to a change of the grease structure, and that degraded thickener structure () is transported out of the system. Concurrently, an amount of fresh grease structure () enters the volume element (mass exchange). In summary, we find a heat supply entering the contact zone due to work done by friction and two heat amounts that leave the system due to conduction and mass exchange.

Figure 2.
Illustration of the heat flow inside the model (left), the exchange of mass (right) and the entropy transport (bottom).
Figure 2.
Illustration of the heat flow inside the model (left), the exchange of mass (right) and the entropy transport (bottom).
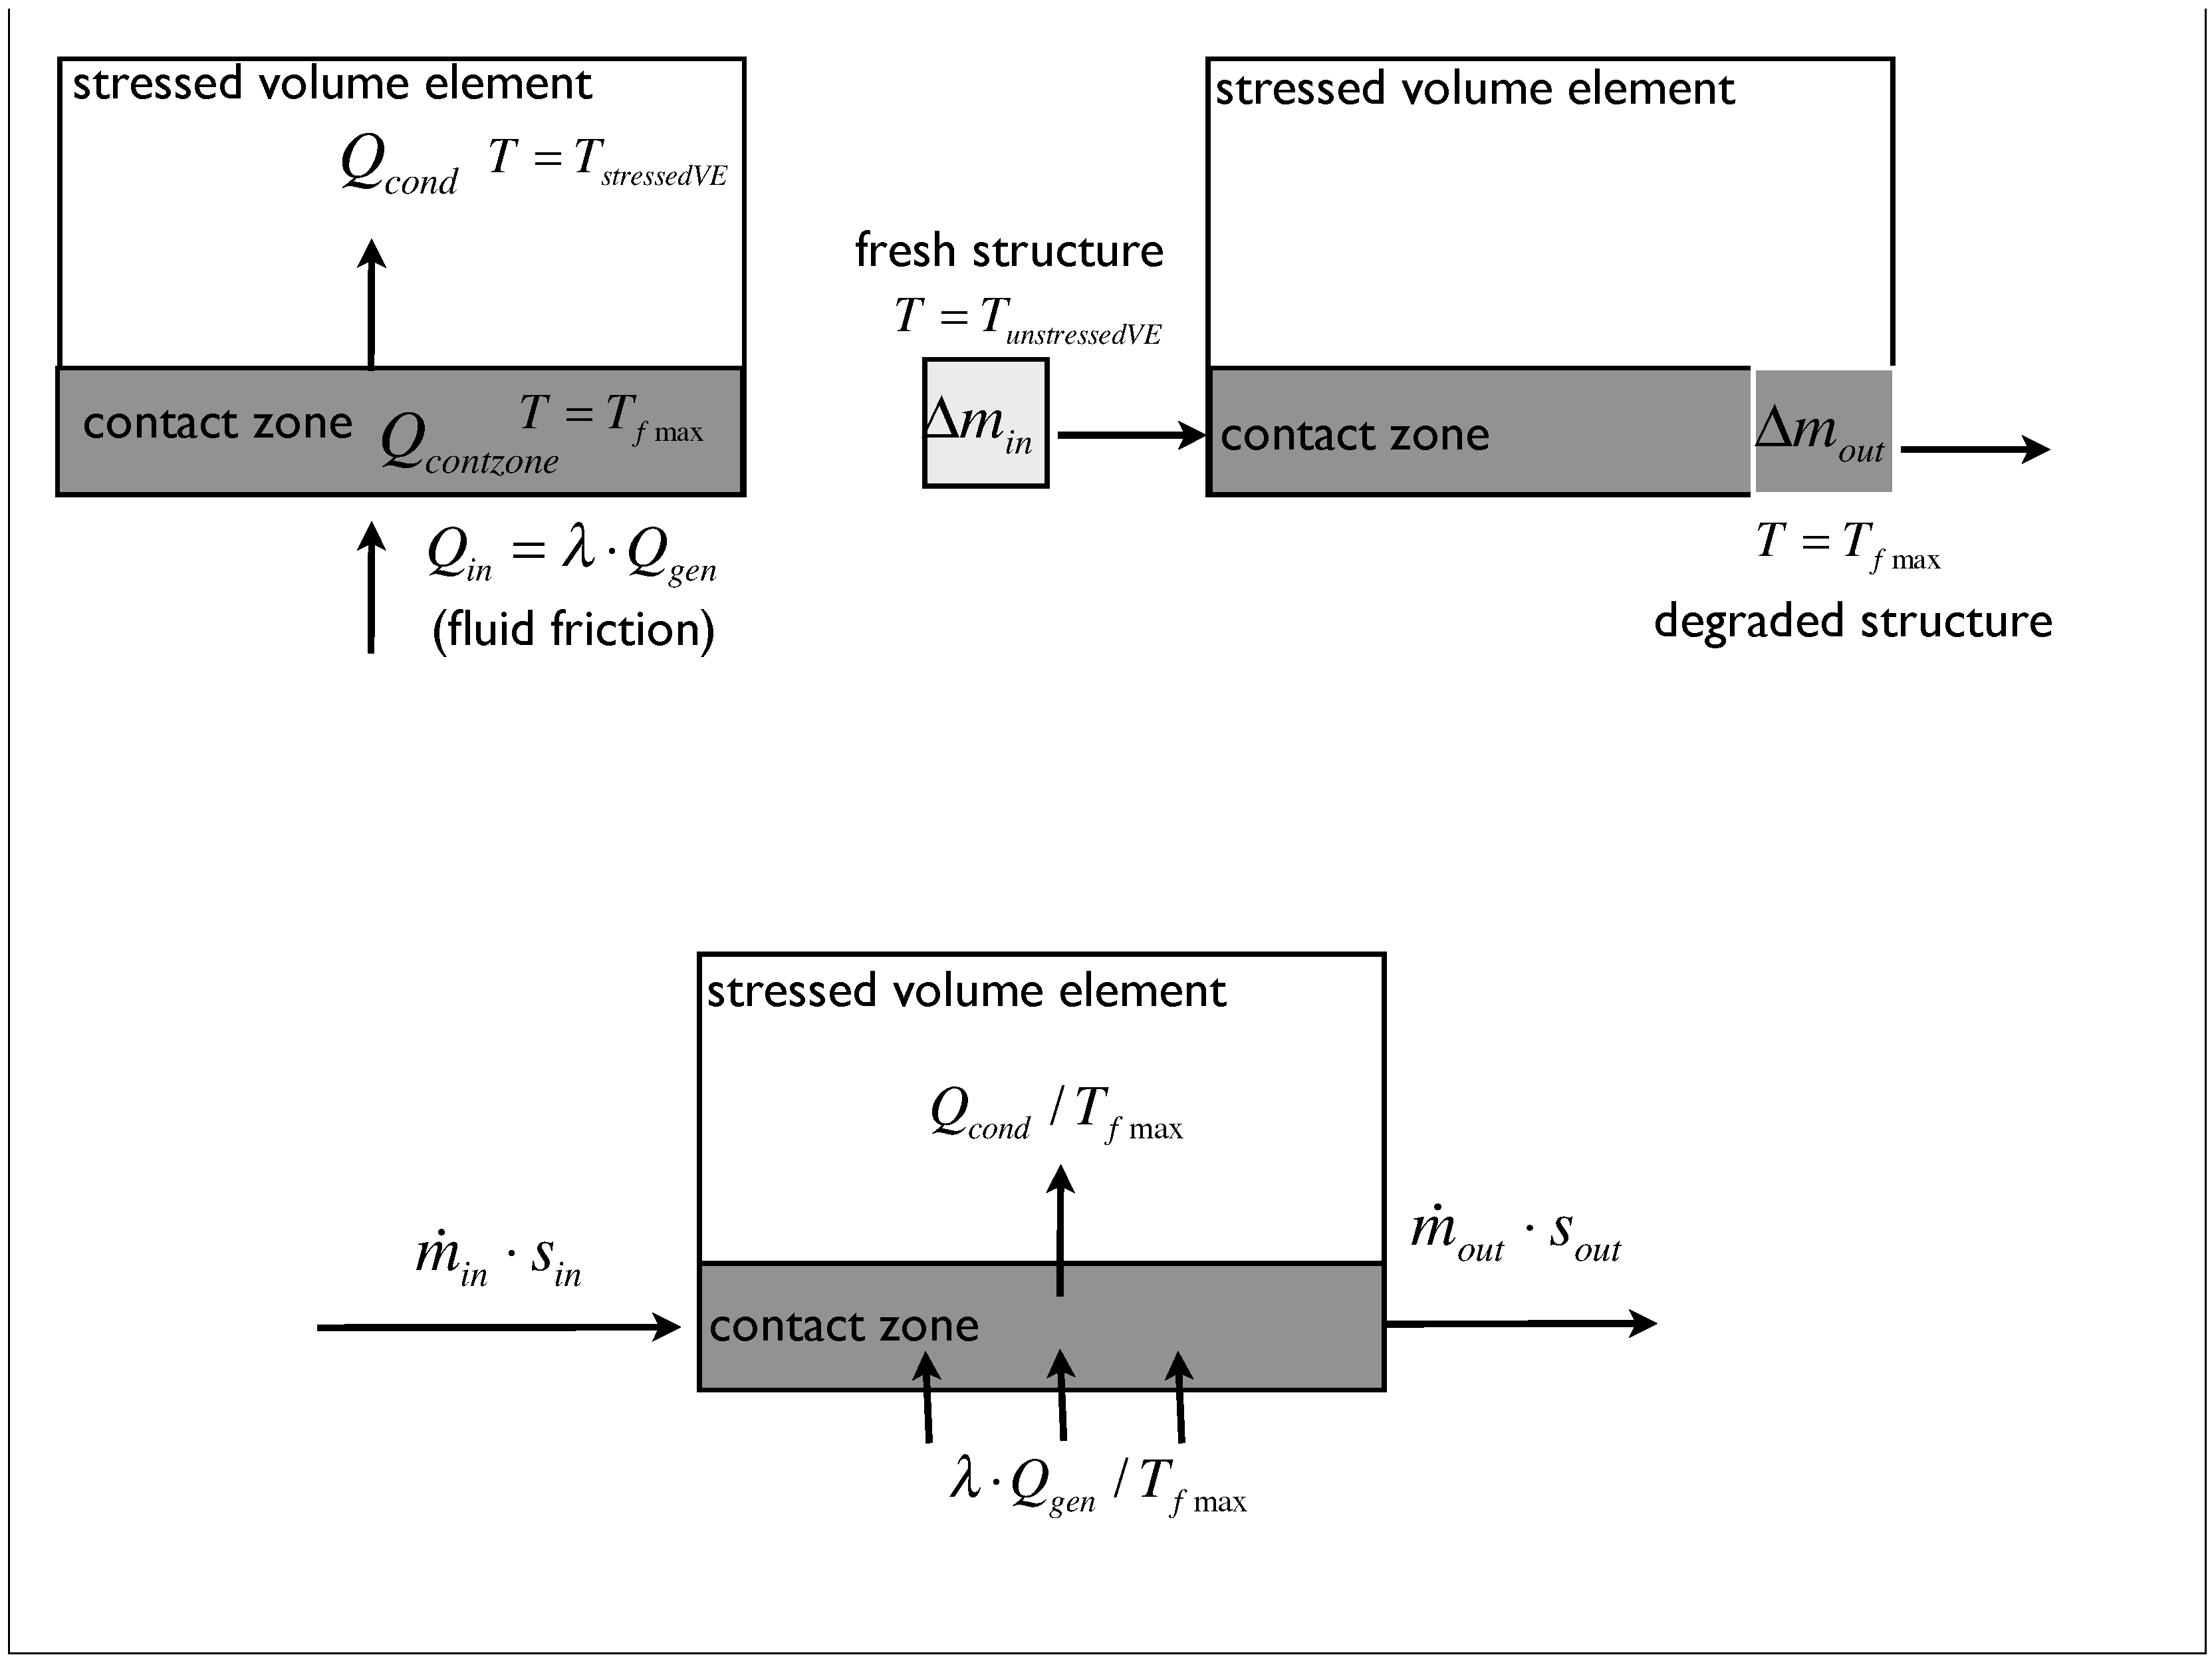
Finally, the entropy transport is illustrated schematically. The mass exchange delivers an additional entropy transport, because of the different temperature and heat amounts of the transported structure. It can be deduced from the theoretical concept shown in Figure 2 that the different temperatures of the observed regions are:
The aim of modeling is to get information about the influence of entropy generation and entropy transport on the structure of the degradation process.
All terms were observed inside the modeled system (for the last two terms, the difference is important), and each of them presents an entropy production.
With some assumptions (uniform temperature inside the observed area, homogenous composition of thickener volume, etc.) and the use of average values, we can write for the specific entropies (Figure 2):
2.4. Working with the Tribological Parameter
By observing the stationary non-equilibrium and by substituting the entropy generation through friction energy with the related temperature , it can be obtained:
The parameter presents the apparent rheological frictional energy density (J/m3) (the description parameter of the tribological system [9]), and presents the entropy density linked with the mass transport (degraded grease structure) out of the system.
It can be found that a big amount of entropy density connected to the mass leaving the system leads to a higher ability to sustain the tribological stress. In other words, if the system is able to connect a high amount of entropy density with the material that leaves the volume element, there is no need to produce a big volume of wear to obtain an energetic release.
3. Experimental Section
The general model is applied to the friction and wear behavior of some selected model grease samples. The aim of that investigation is to obtain information about the influence of entropy production and entropy flow on the tribological behavior of the used lubricating greases.
3.1. Materials
All of the tests were conducted with model greases (only base oil and thickener, no additives), whose properties are listed in Table 1.

Table 1.
Properties of the studied model greases.
| Name | Base Oil | Thickener | NLGI category | Soap Content (%) |
|---|---|---|---|---|
| Li2 | poly alpha olefin+ mineral | Li-12-hydroxy stearate | 2 | 9.4 |
| GEL2 | poly alpha olefin + mineral | high disperse(HD)silica | 2 | 8.6 |
3.2. Monitoring of the Effects of Friction
An algorithm was developed to find a measure of the structural degradation of a stressed grease and to compare the tribological behavior of the used samples. A rheometer was used to stress the grease like in a state of fluid friction (shear stress). The tests were realized with an Anton Paar MCR301 device with a plate-plate system. The upper plate has a diameter of 25 mm. The test gap was 1 mm.
Different types of experiments were done with the rheometer:
- transient shear stress experiments with constant shear rate ;
- oscillating tests with a variation of the deformation γ (amplitude sweep).
The first series of tests include a stress period of 900 s with a constant shear rate (rotation mode). Immediately after finishing the shear stress time, an oscillating experiment starts (constant frequency) until the crossover point is reached.
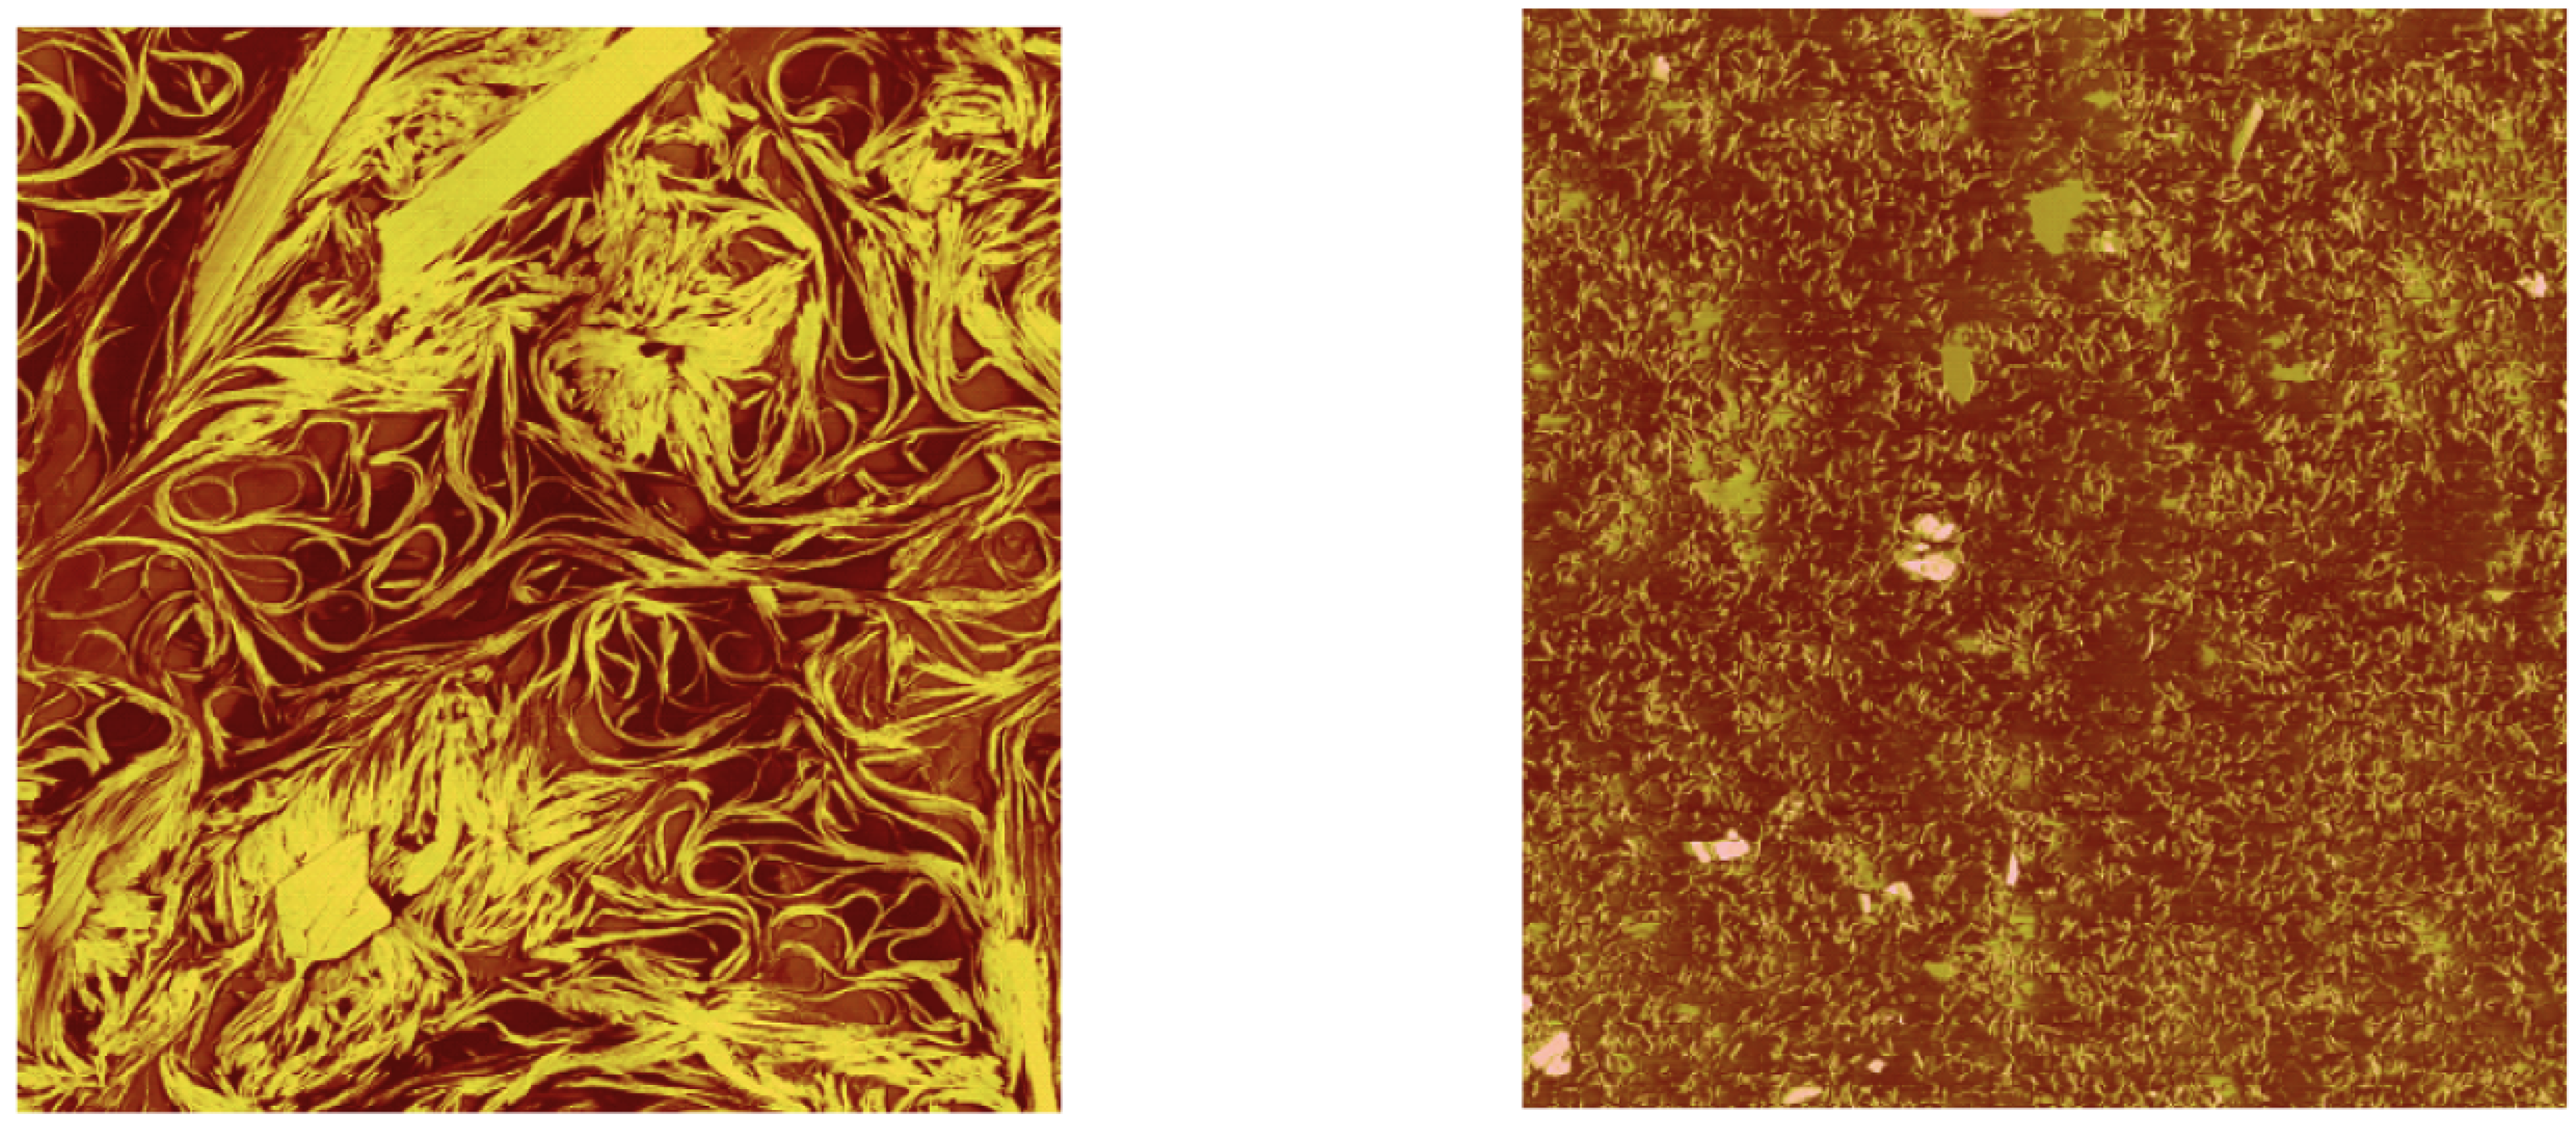
The expected structural degradation due to shear stress (rotation test) is illustrated in Figure 3.

Figure 3.
Left: fresh Li-grease; right: same sample stressed in a rheometer (AFM investigation of [10]).
Figure 3.
Left: fresh Li-grease; right: same sample stressed in a rheometer (AFM investigation of [10]).
The second series are shear tests with constant shear rate and a test duration of 900 s. During the test, the change of temperature is measured with the rheometer.
The expended energy to reach the crossover point is proposed as a comparative measure for the structural degradation.
3.3. Measurements of Expended Energy
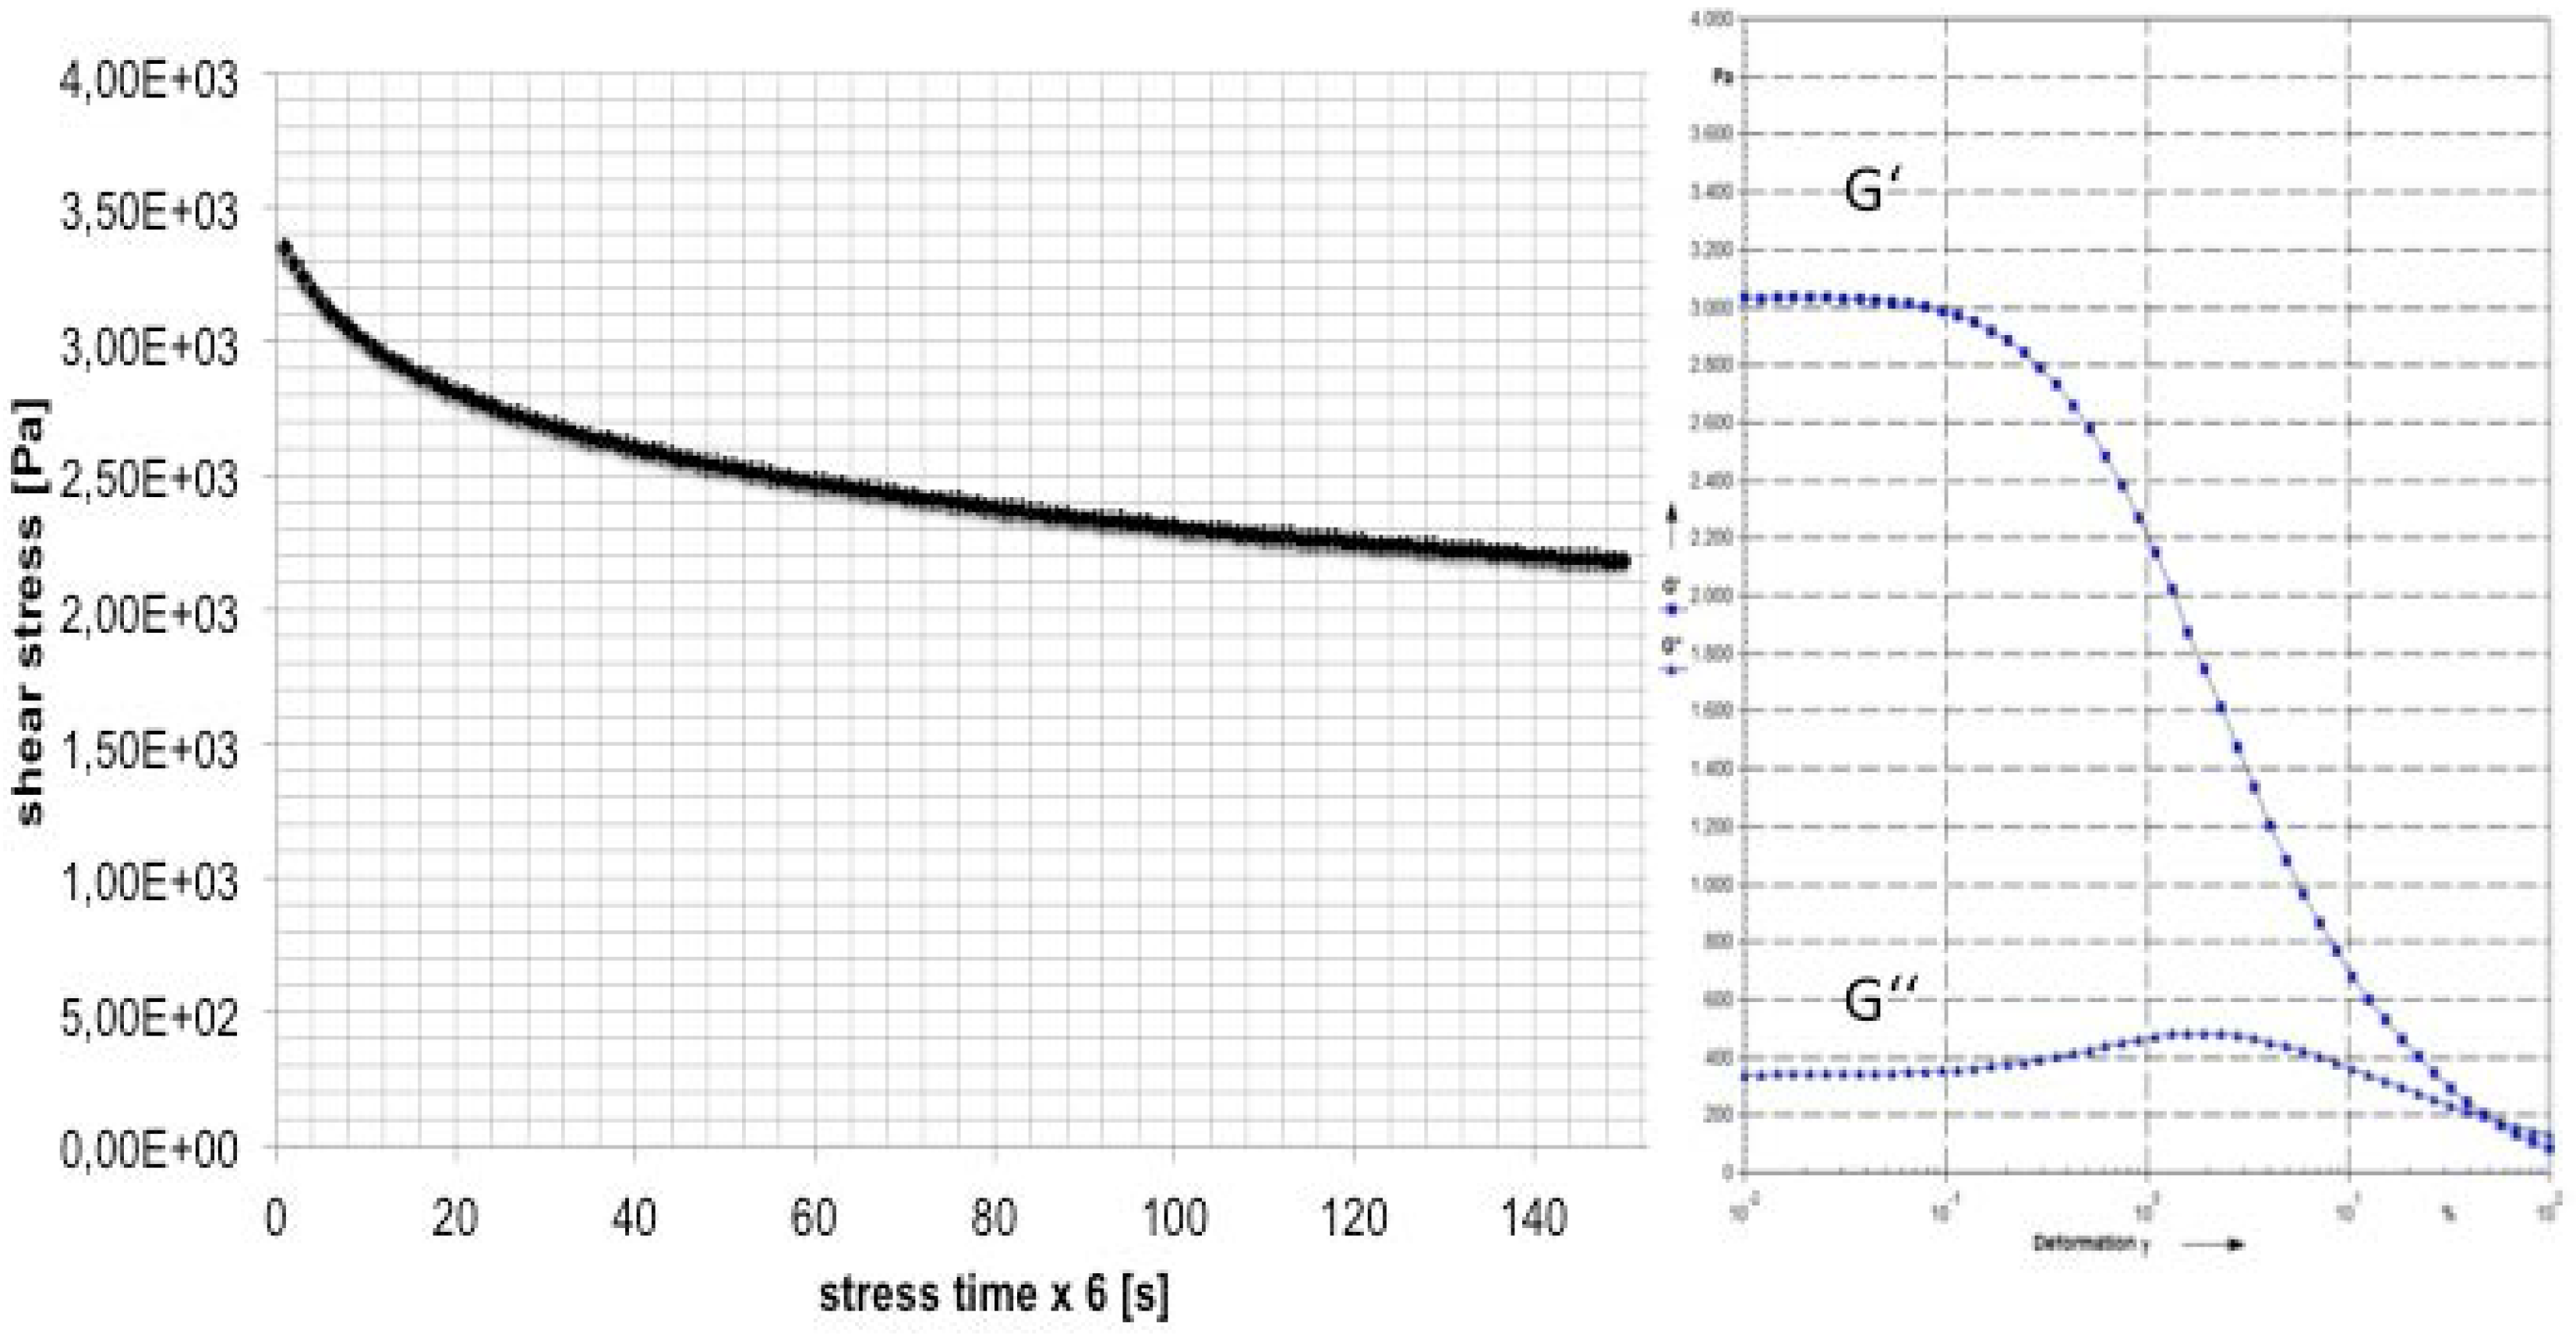
An example for measurement is shown in Figure 4. Two sections are illustrated: the shear stress period with constant shear rates and the oscillating measurement until the crossover point. During the first part, the grease is stressed, and a degradation process of the grease structure is initiated. The tests were done with different shear rates to simulate different stages of degradation and with a variation of the test temperature to get an impression of the temperature influence.
The energy density (J/m3) expended during the shear tests comes from [11,12]:
with and
The sum of energy to reach the crossover point comes from the rheometer torque and oscillating amplitude.

Figure 4.
The first part of rheometer experiment: stress period of 900 s with constant shear rate ; and the second part with an oscillating measurement with a constant frequency.
Figure 4.
The first part of rheometer experiment: stress period of 900 s with constant shear rate ; and the second part with an oscillating measurement with a constant frequency.
3.4. Temperature Measurements
Temperature measurements were done to gain insight into the heat evolution during the grease friction inside the grease film. The measurement point is inside the lower plate of the rheometer. The obtained temperature arises from the conducted heat from the grease film to the lower plate (middle temperature). This is the first step in observing the heat that is caused by fluid friction in a rheometer, and it has to be considered that it is a rough measurement (the measurement resolution was K).
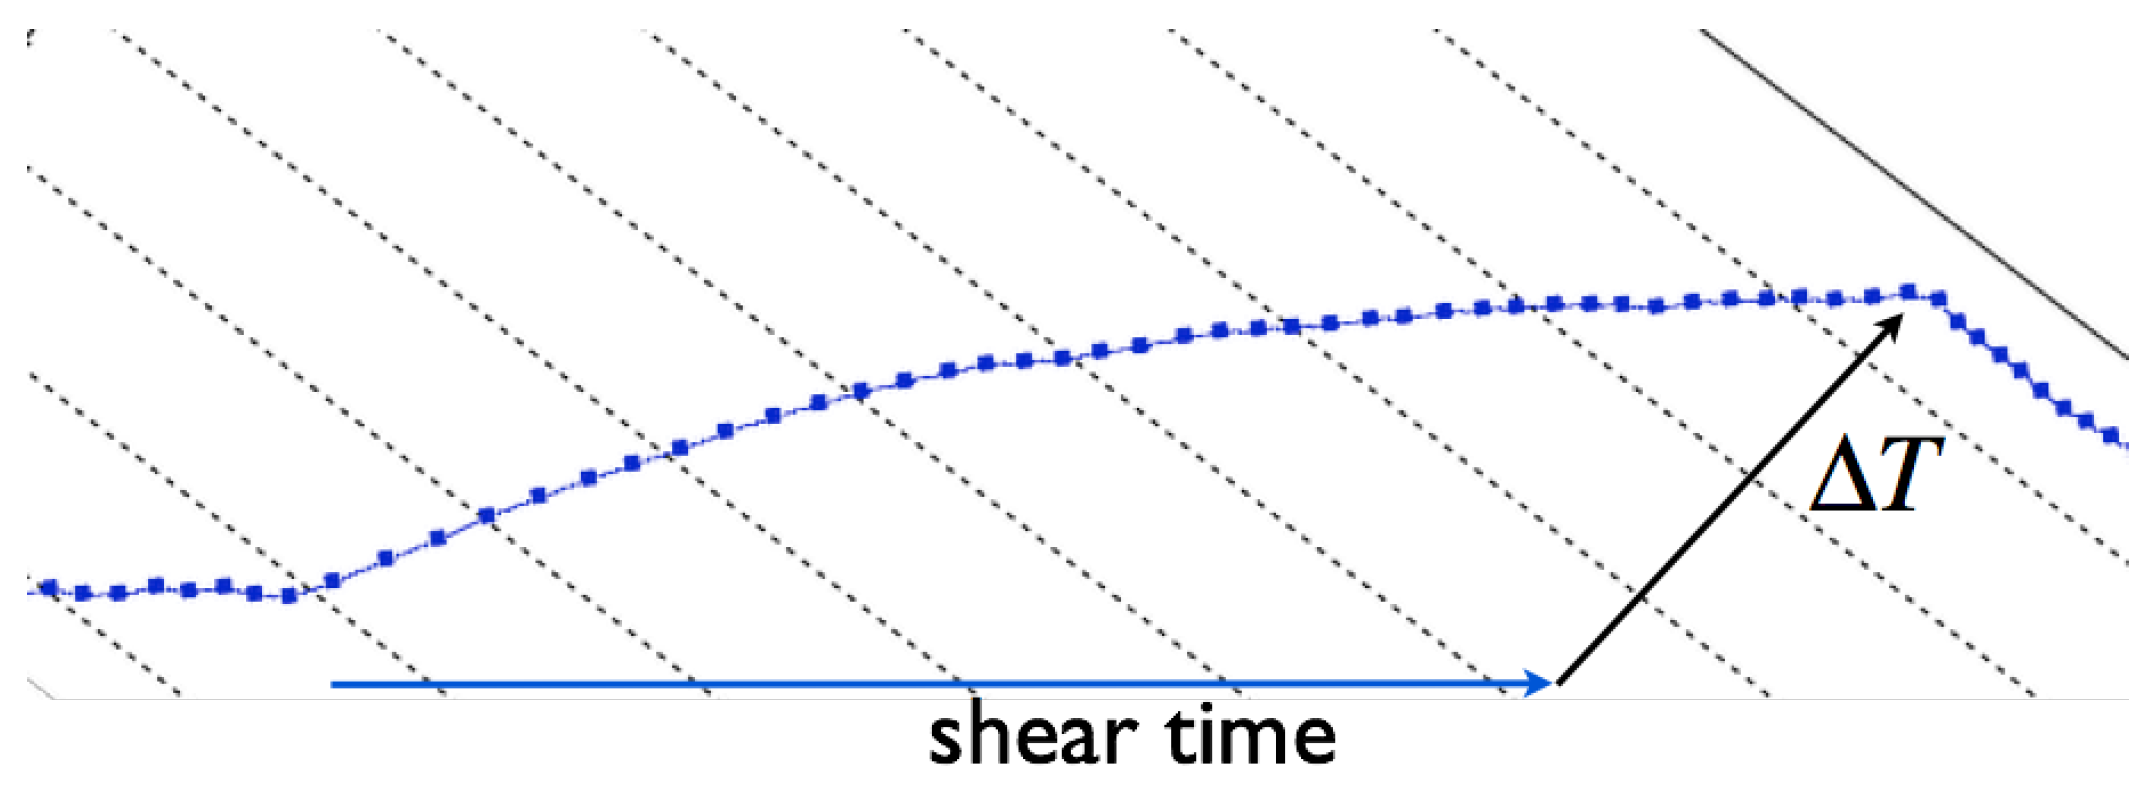
For clarification, a measurement protocol is shown in Figure 5. After the shear stress period of , the test is stopped, and a continuous cooling period is affiliated.

Figure 5.
Example for an increasing temperature during the shear test.
Figure 5.
Example for an increasing temperature during the shear test.
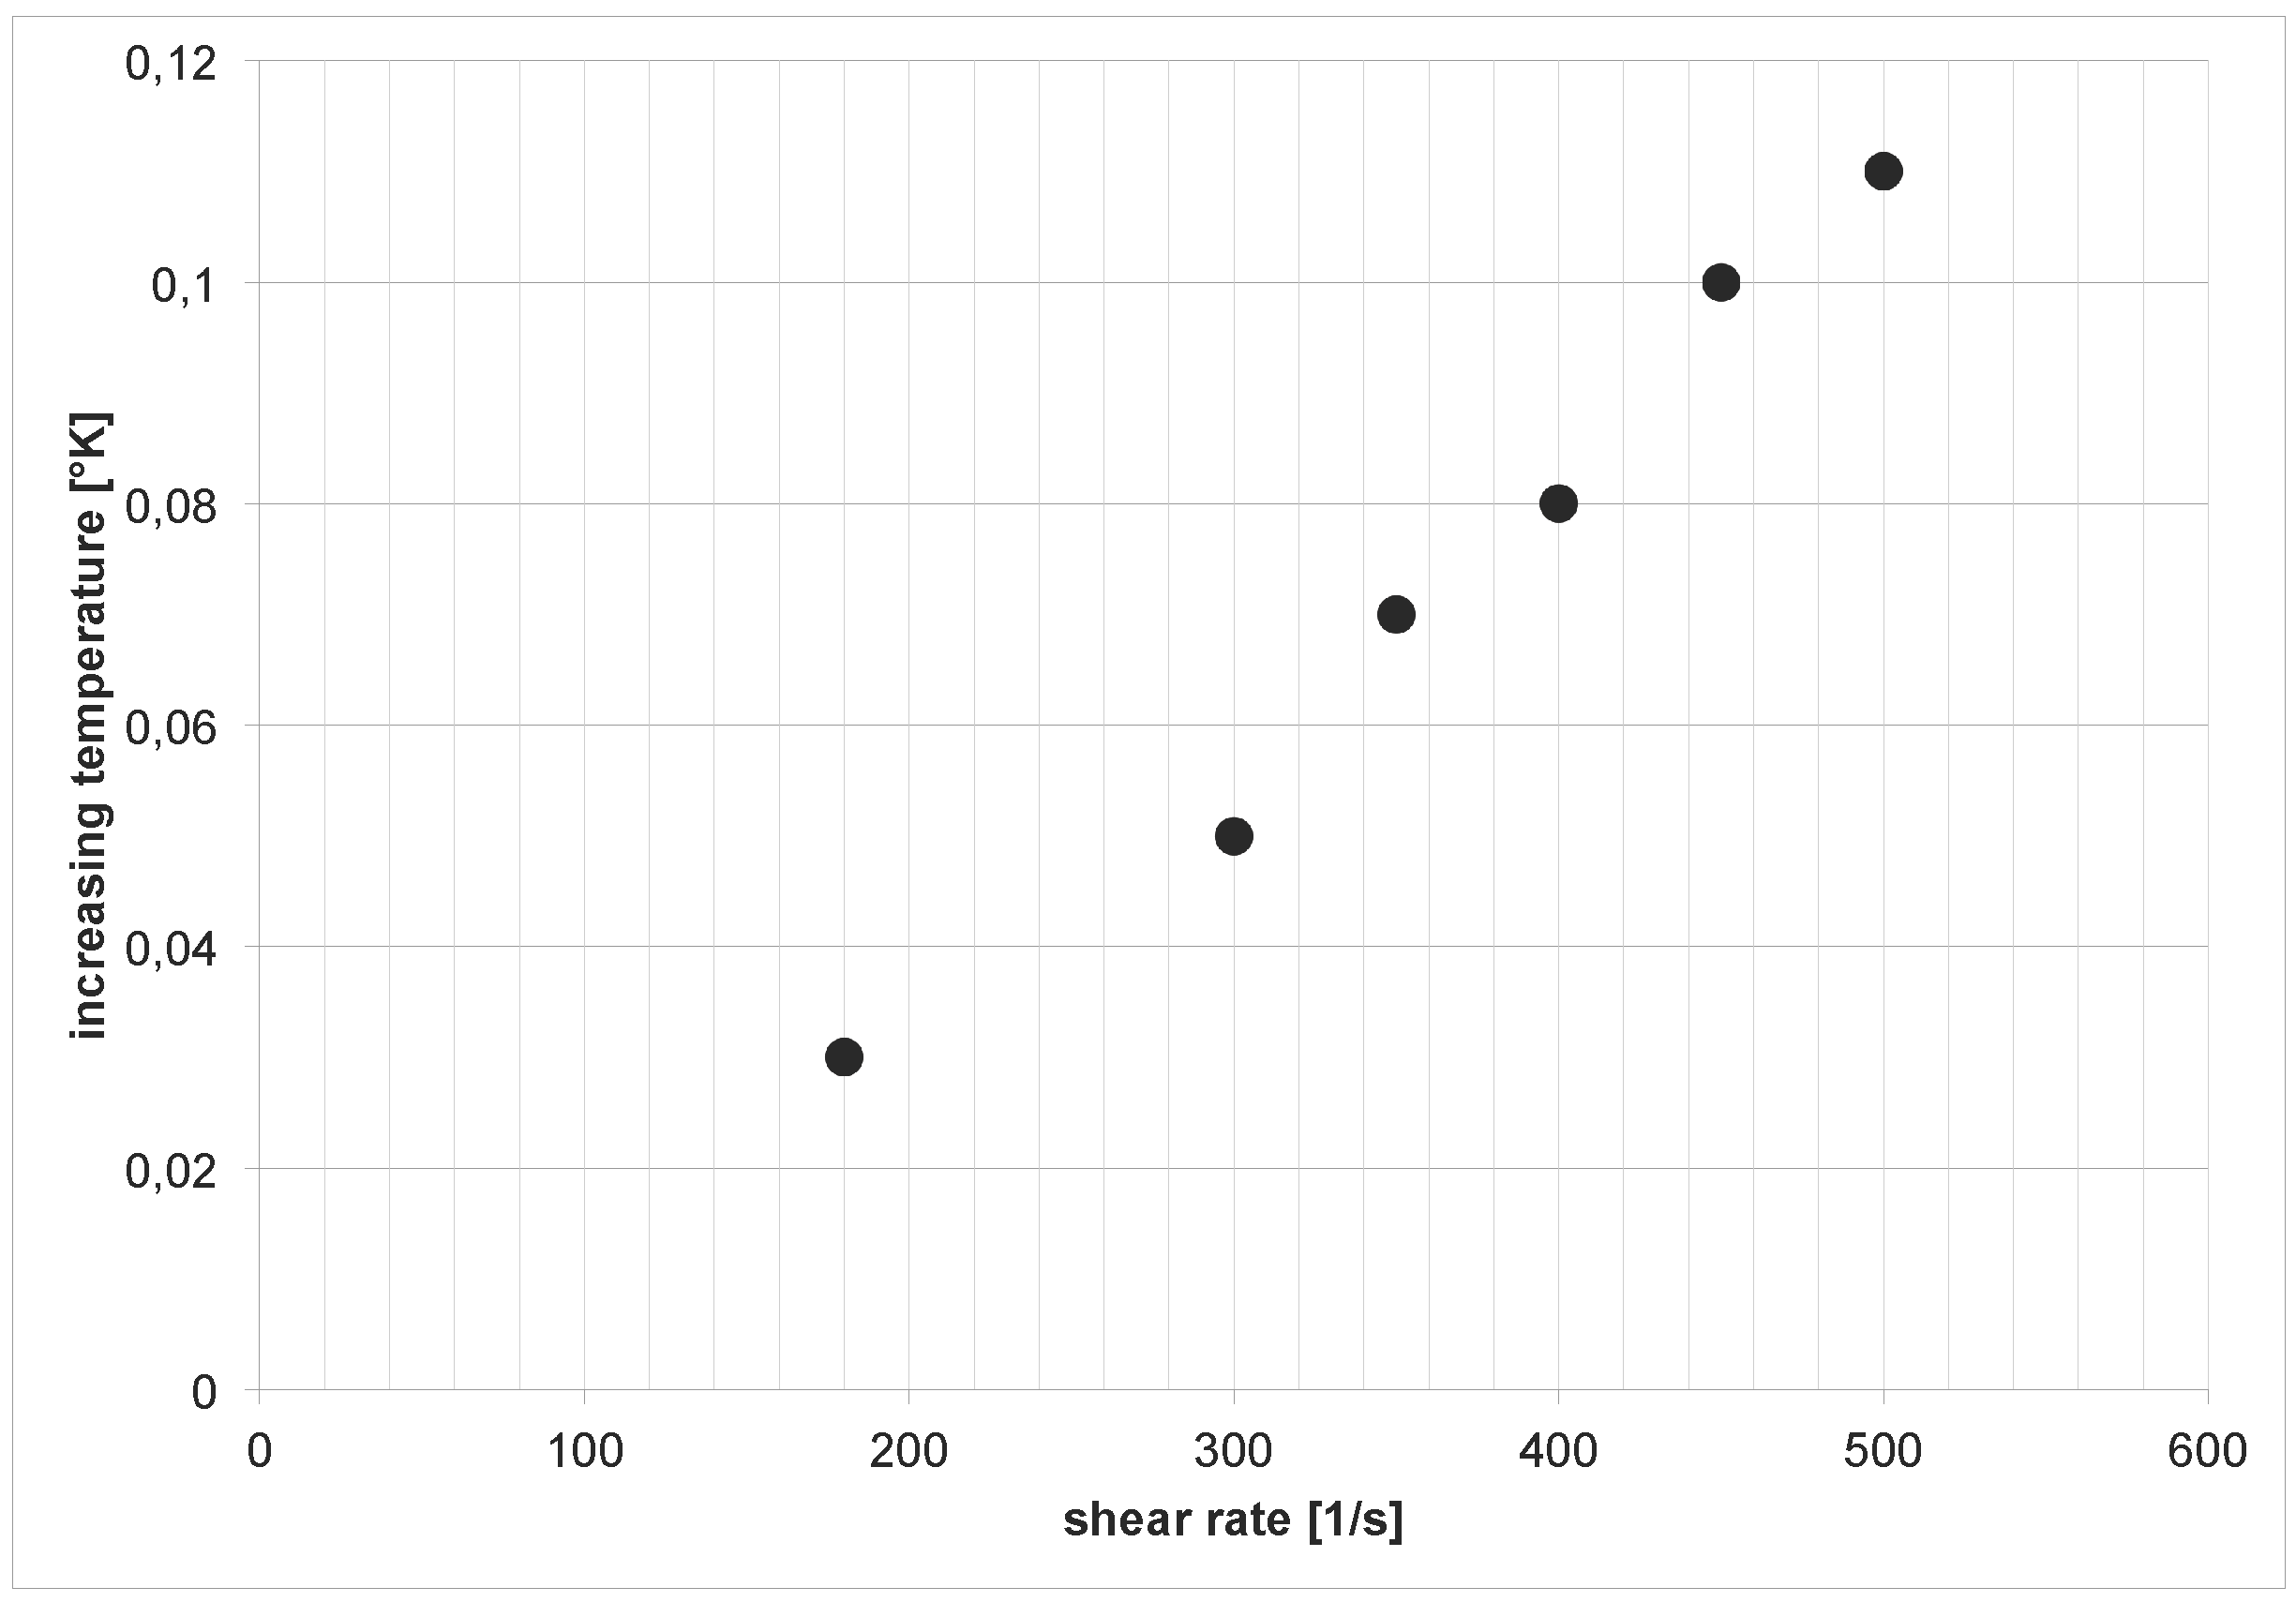
The measurements of the temperature during the shear stress experiments deliver an increasing temperature with an increasing shear rate (Figure 6).

Figure 6.
Evolution of temperature for different shear rates.
Figure 6.
Evolution of temperature for different shear rates.
4. Results and Discussion
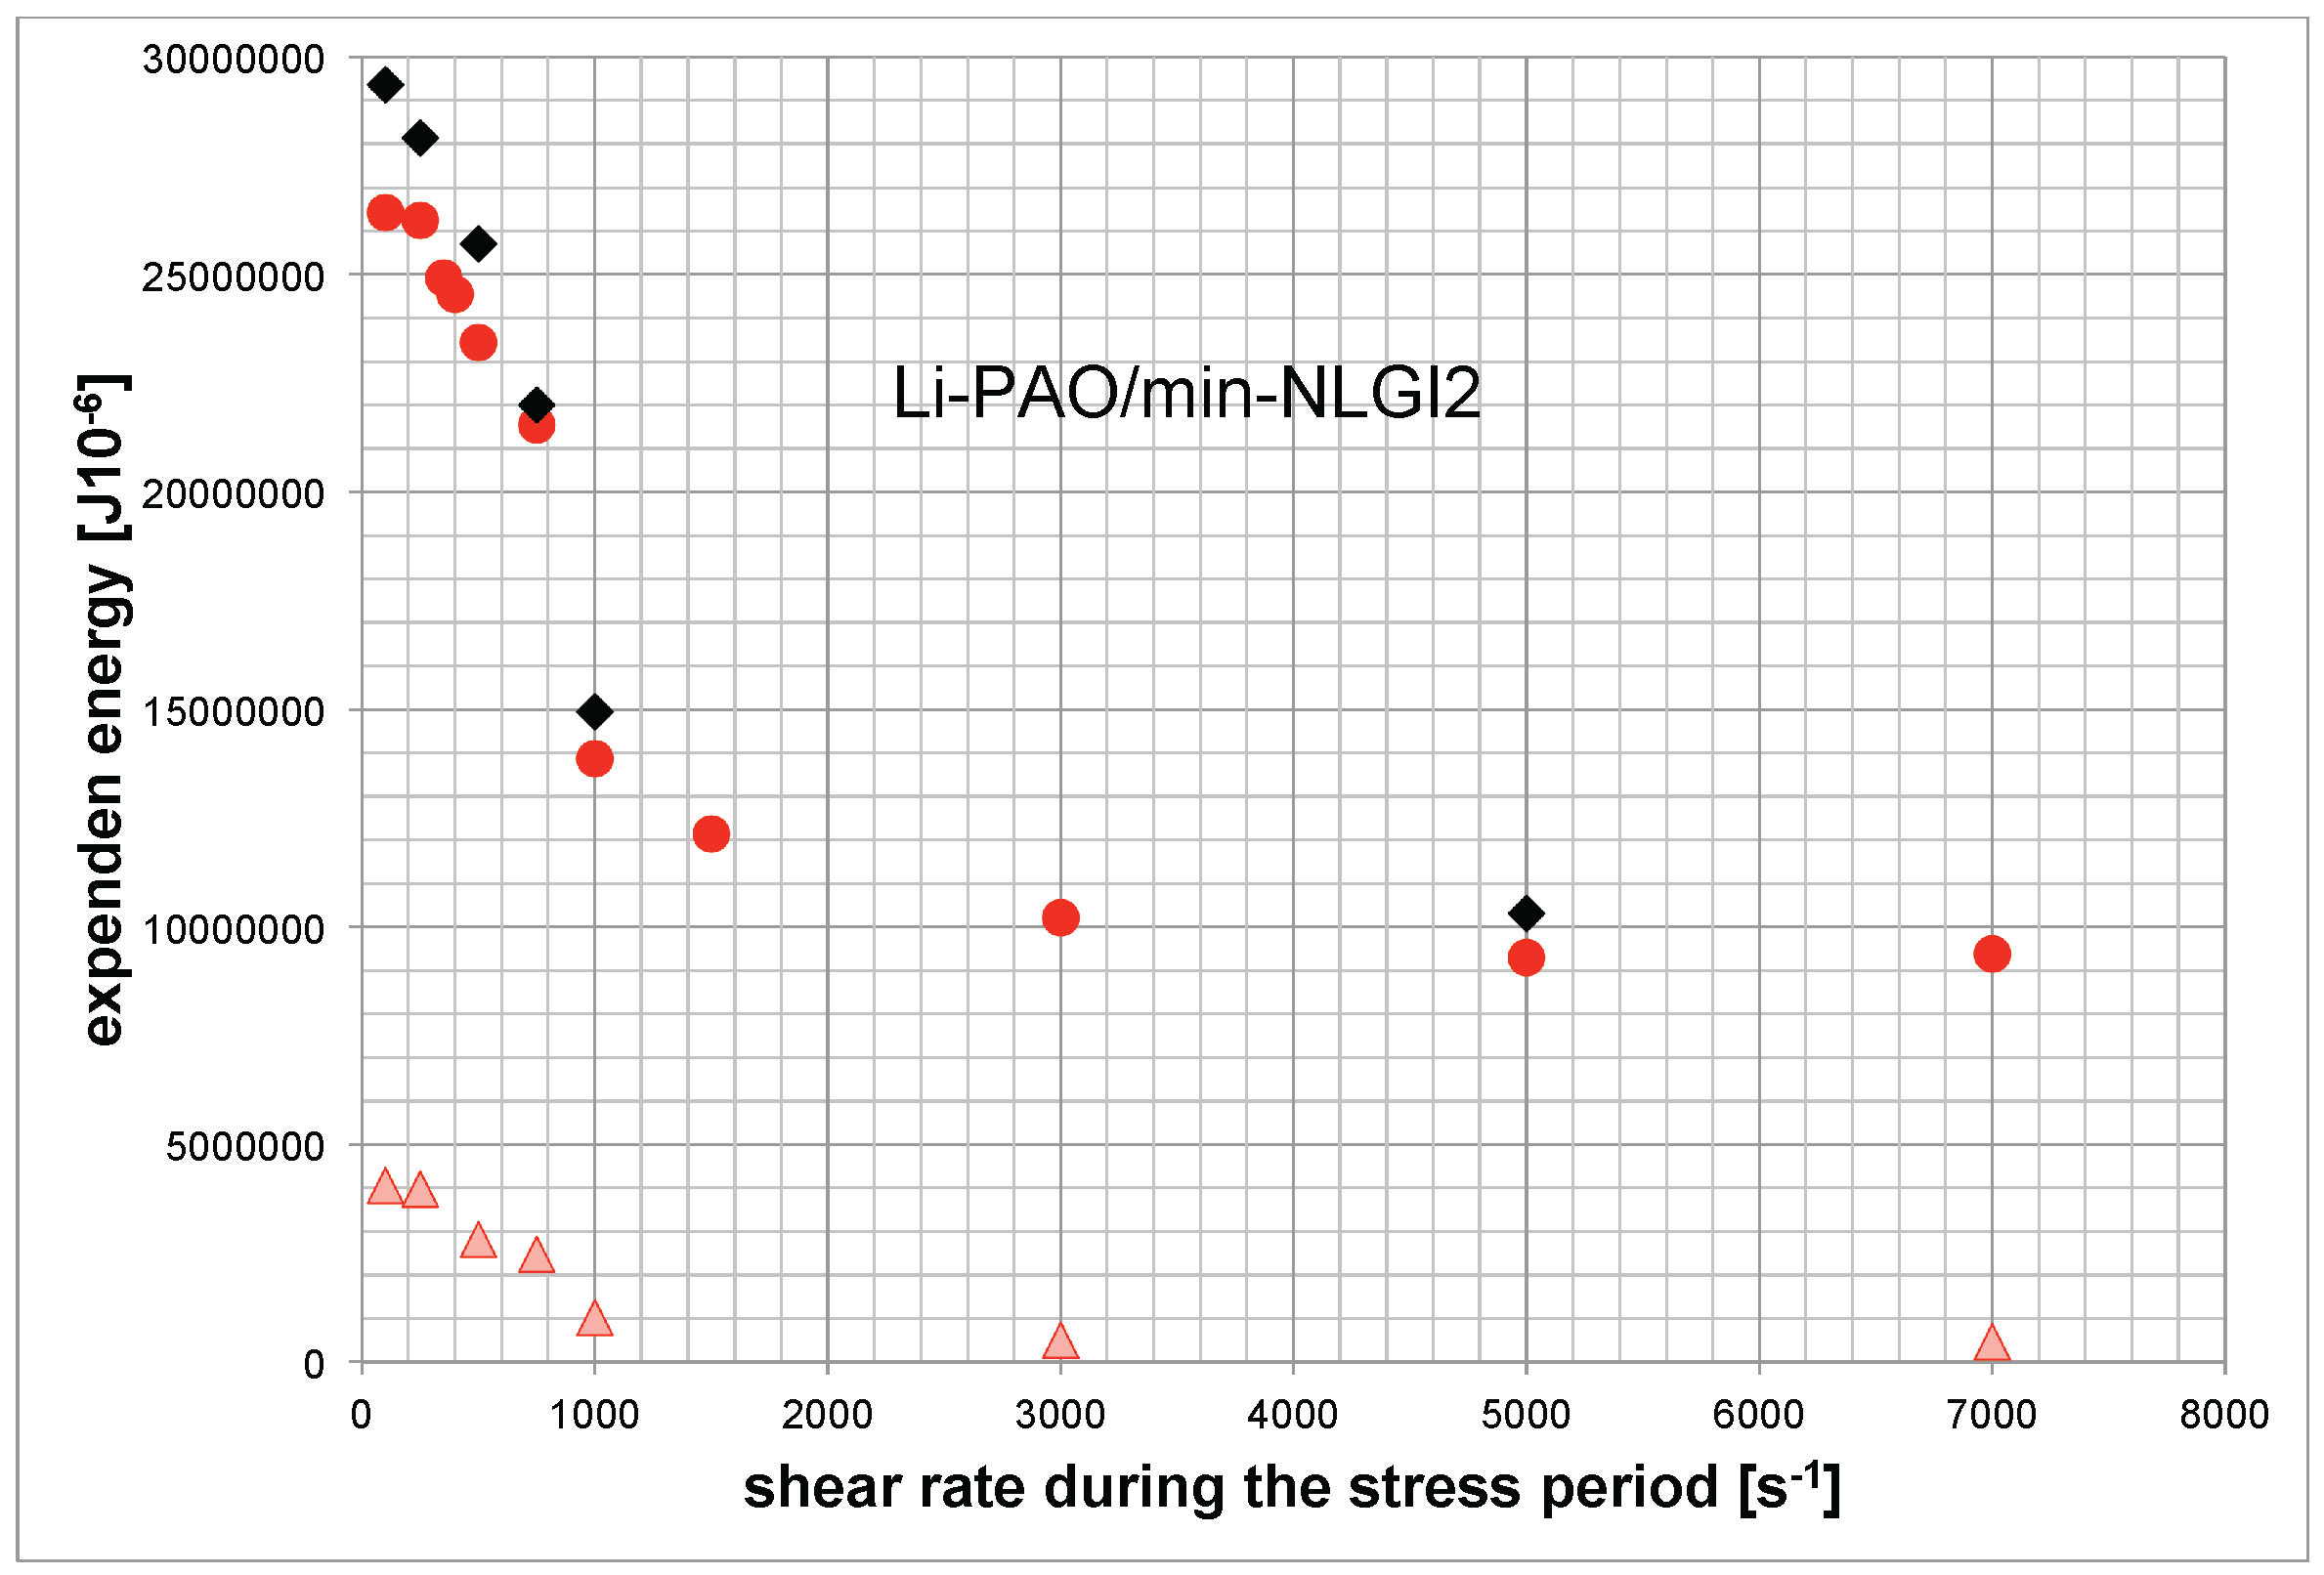
As described below, the proposed measure for the structural degradation of a lubricating grease is the sum of expended energy to obtain the crossover point in an oscillating measurement. It is expected for a model grease that the structural breakdown is more intensive with higher shear rate during the shear test. This means that a higher amount of mechanical energy is applied to the grease sample.
As presented in Figure 7, we find a decreasing expended energy amount to obtain the maximum of structural degradation with an increasing shear rate during the stress period. Additionally, the test temperature was varied. Higher test temperature leads to a smaller amount of energy that is needed to come to the crossing point.

Figure 7.
Expended energy to reach the crossover point (Li-sample). , , (bottom).
Figure 7.
Expended energy to reach the crossover point (Li-sample). , , (bottom).
The same tests were made with high disperse silica model grease and are presented in Figure 8. The comparison shows a big difference between the structural degradation expressed by the sum of expended energy. The curves of both samples look very similar and show a change from a progressive into a degressive shape.
The structural degradation was normalized (related to the maximum value of degradation), and the same procedure was done for the entropy supply to the volume (). The behavior of structural degradation (in the sense of our investigation, this is wear of a lubricating grease) for the Li-NLGI2sample related to the entropy supply to the volume is plotted in Figure 9. It is presented for each of the realized shear rates .

Figure 8.
Expended energy to reach the crossover point. . First, HD-silica sample; second, the comparison of both NLGI2 samples.
Figure 8.
Expended energy to reach the crossover point. . First, HD-silica sample; second, the comparison of both NLGI2 samples.
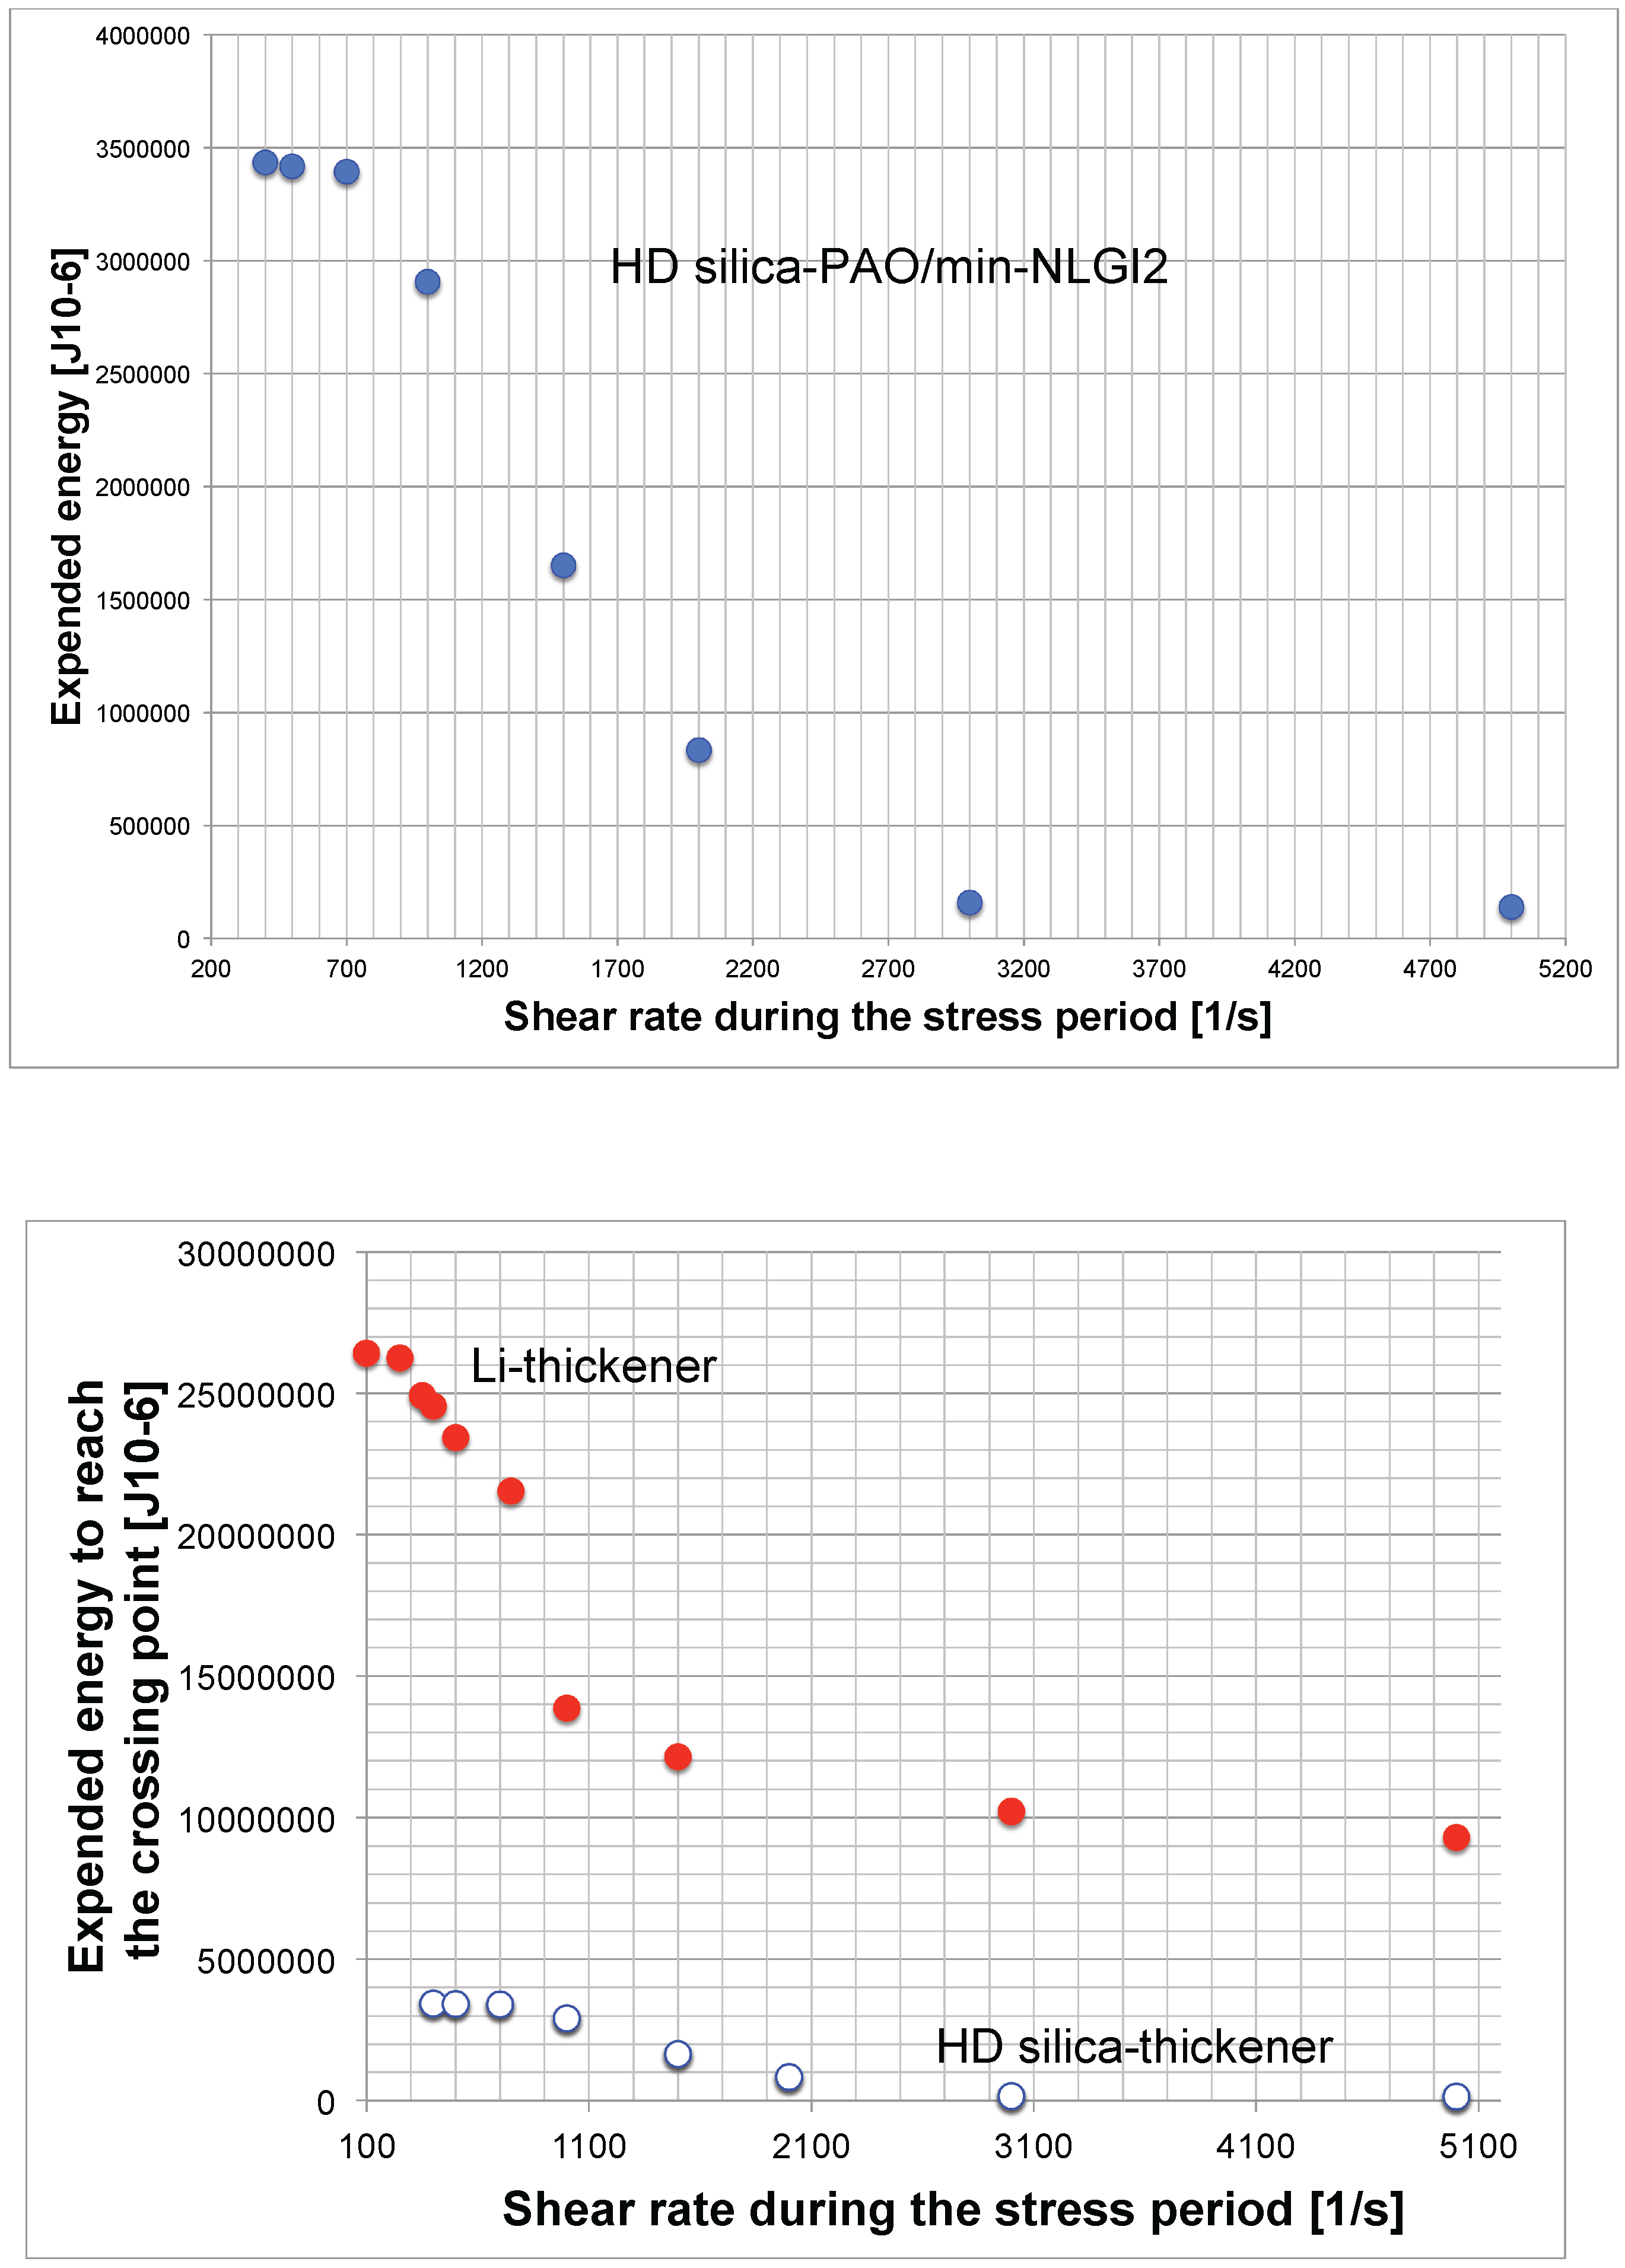
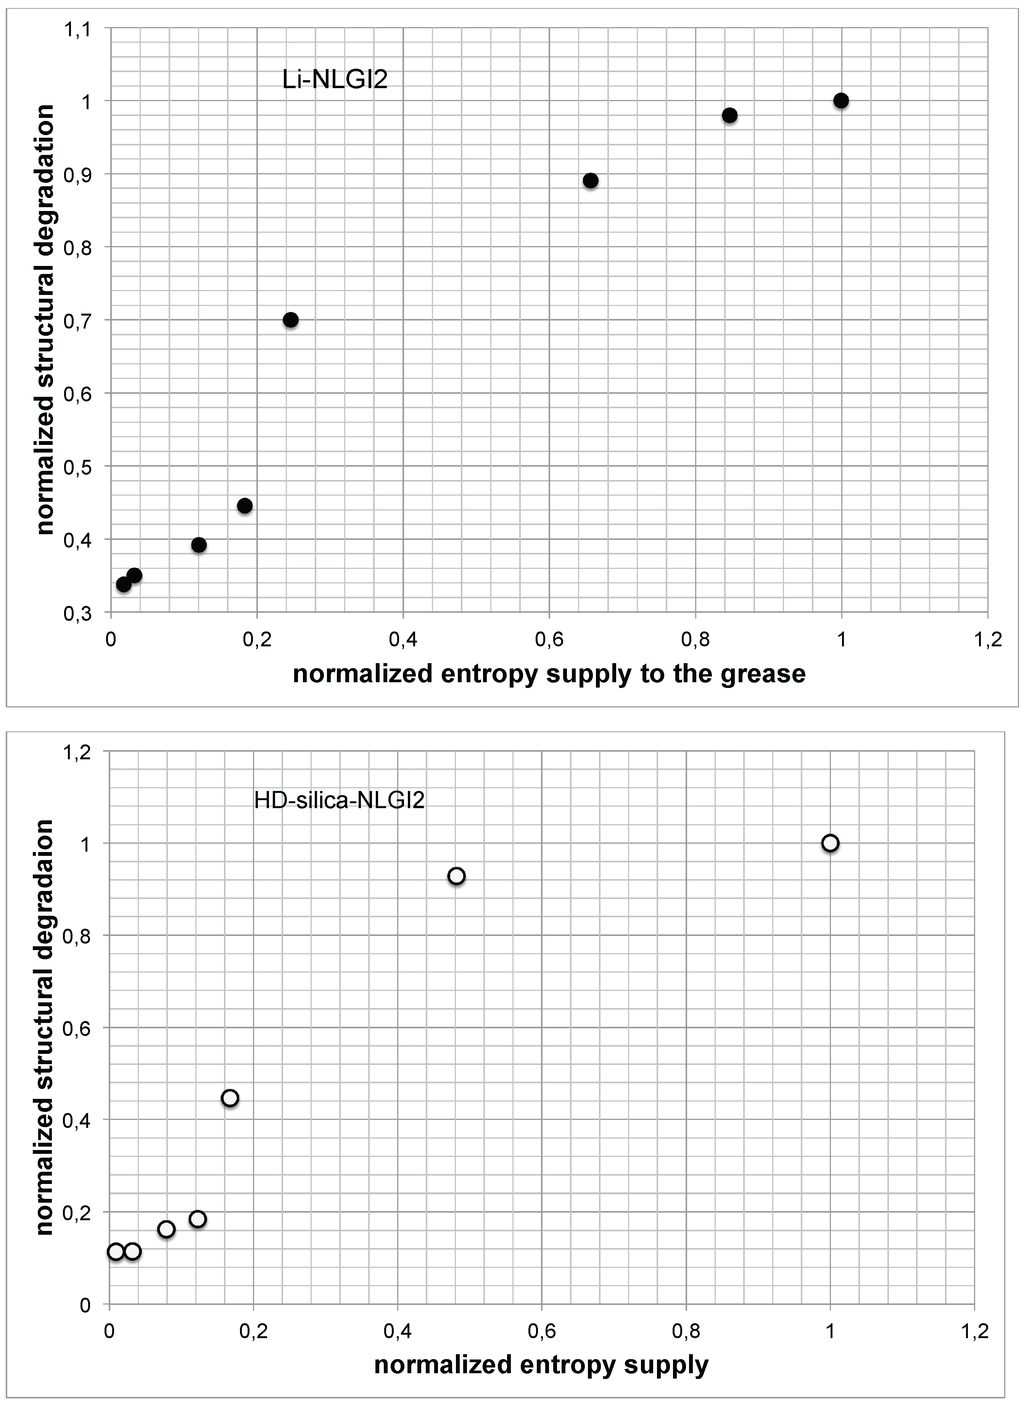
Figure 9.
Normalized structural degradation vs. normalized entropy supply to the volume (top, Li-grease sample; bottom, HD silica grease sample).
Figure 9.
Normalized structural degradation vs. normalized entropy supply to the volume (top, Li-grease sample; bottom, HD silica grease sample).
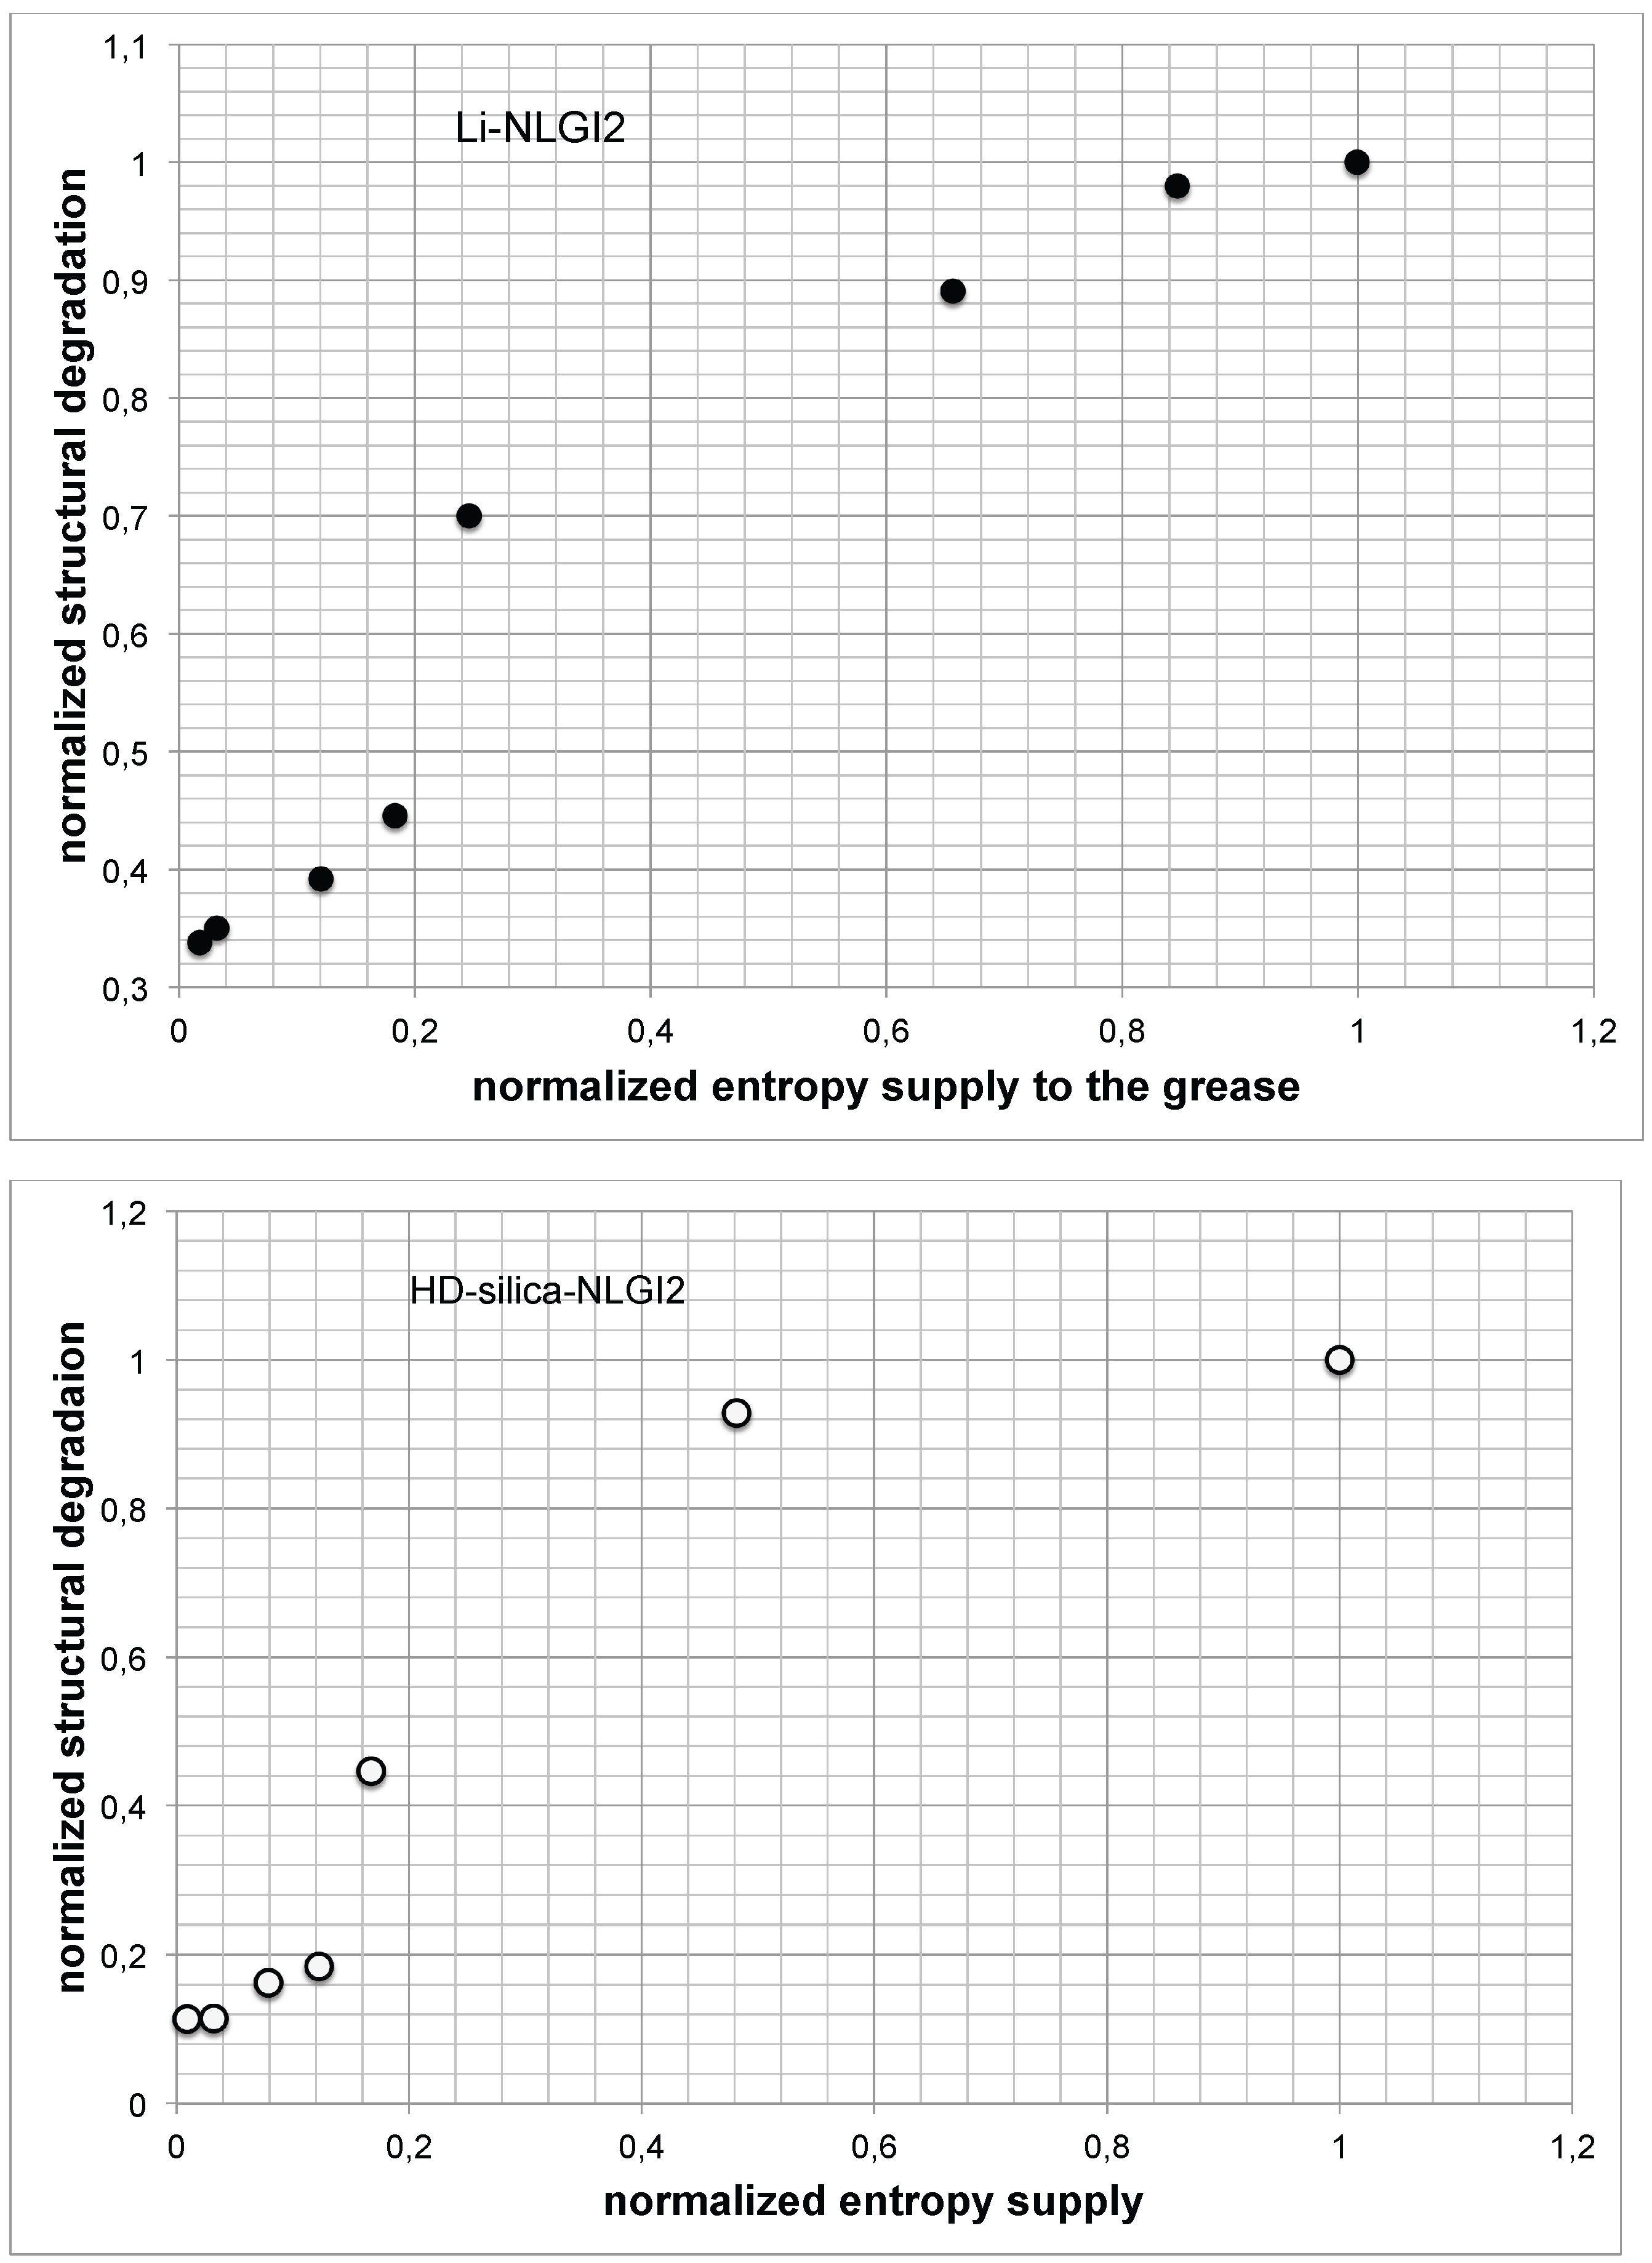
It is noted that the structural degradation in general increases with the increase of the entropy supply. It can be assumed that the curve evolution shows the same change from progressive to degressive curve behavior, and it seems that it reaches a plateau at higher shear rates.
Finally, the behavior during a shear test procedure (a number of tests with different shear rates) for the same sample was observed. An energy density is defined as a measure of degradation behavior. This means that we investigate the energy per volume that is necessary to reach the crossover point (assumption ) for different stressed (rotational test) grease samples. Additionally, the specific entropy that leaves the system during the rotational shear tests (see Equation (14)) is used to connect two tests of the same investigation.
Figure 10 tries to combine these results from both experiments (for the same sample).

Figure 10.
Expended energy density vs. specific entropy leaving the system for Li-NLGI2 sample.
Figure 10.
Expended energy density vs. specific entropy leaving the system for Li-NLGI2 sample.
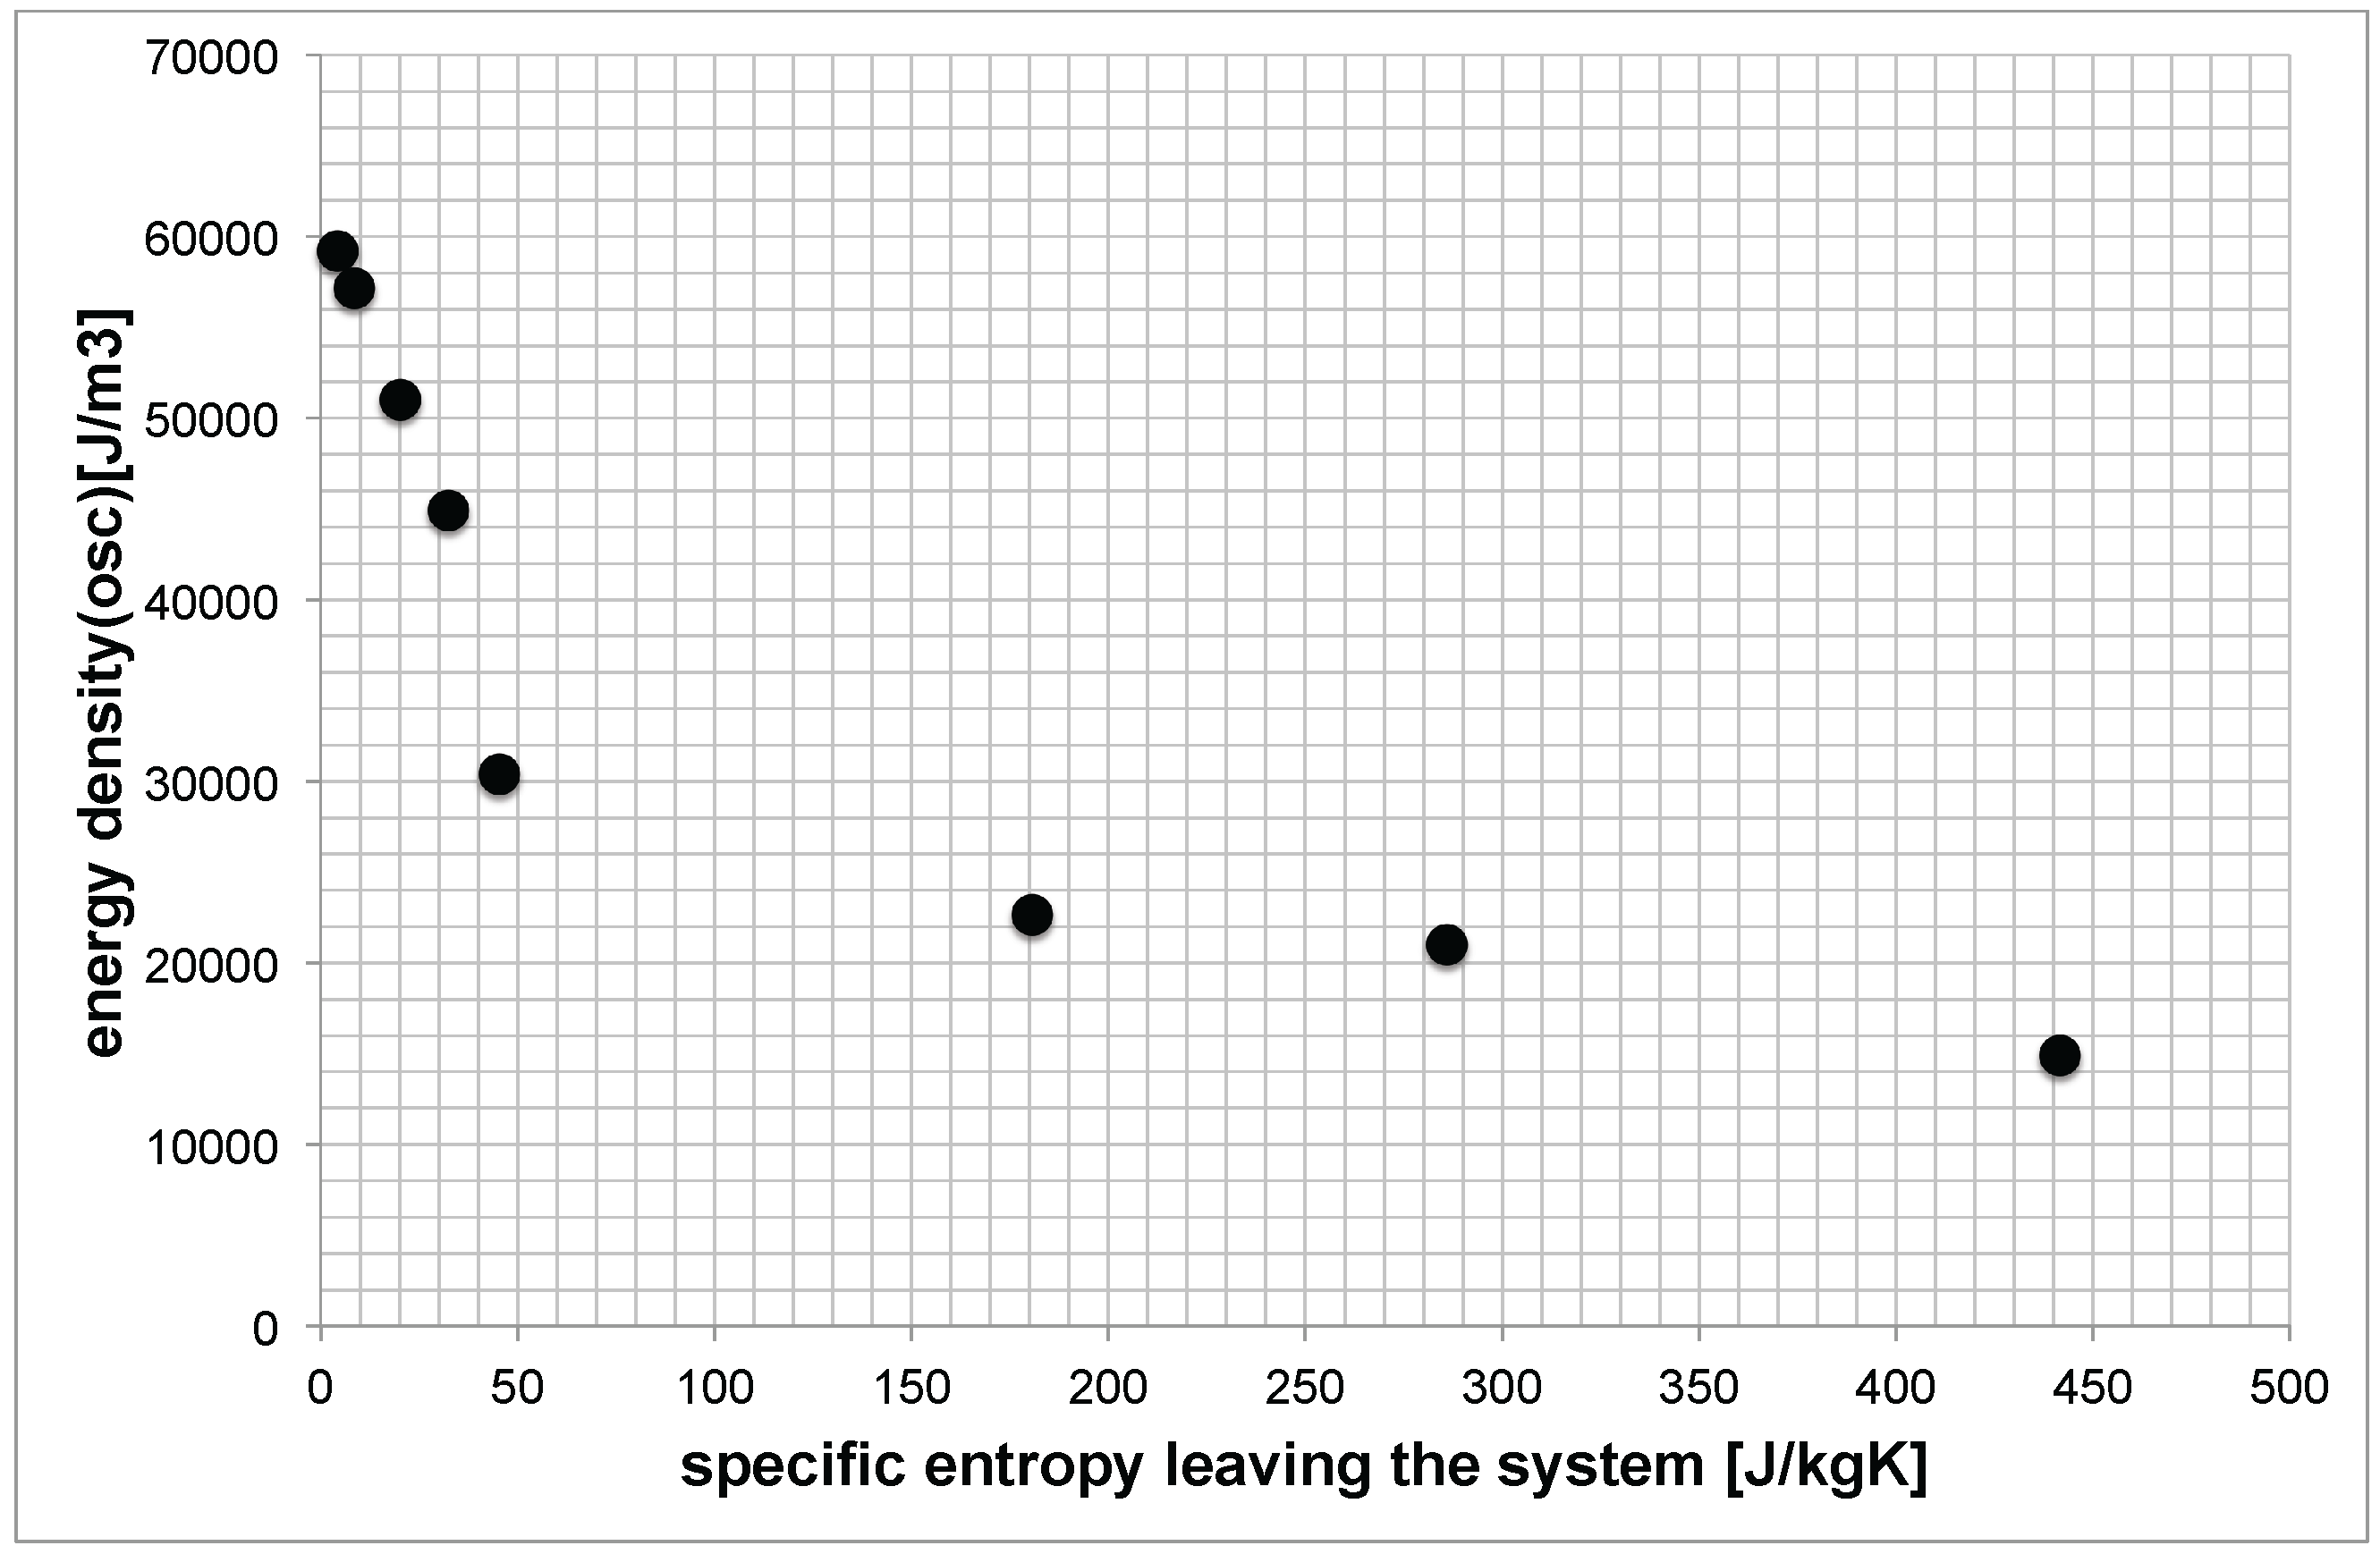
Again, please note that the abscissa presents the shear test in rotational mode, and the ordinate presents the oscillating test with the sheared grease sample. Small values of express the case that the generation of structural degradation was not the dominant path for the system to dissipate the energetic stress by friction (during the rotational shear stress test). It may be that the heat conduction was more in the front, and the following oscillating measurement, of course, shows a high value of . On the other side, a high value of shows a significant structural degradation, and the initiated heat conduction is not able to dissipate the disturbance (friction) of the system sufficiently. The following oscillating measurement shows a lower energy level of the highly sheared sample.
5. Conclusions
The following conclusions can be drawn based on the printed investigations.
- Fluid friction inside the grease film breaks down the structure of the grease thickener (mechanical degradation).
- When the friction process starts, the modeled system is crowded out of equilibrium (caused by friction work). To dissipate this disturbance, different possibilities are available, at least to reach a stationary non-equilibrium. If initiated mechanisms (or selected path) cannot dissipate all disturbances, structural breakdown arises. Structural degradation is an expression of the constant effort of the system to find a path to a stable state.
- The expended energy to reach the crossover point in an oscillating measurement is proposed as a measure of the structural degradation of lubricating greases.
- The structural degradation vs. entropy supply forms a logistic function, as illustrated in Figure 9.
- The apparent frictional energy density is proportional to the entropy density linked to the matter transported out of the system.
- A concept is developed that tries to apply the principles of irreversible thermodynamics to investigations of the structural degradation of stressed lubricating greases (in dependence of the investigations of solid wear and entropy, for example [8]).
Acknowledgments
The author is thankful to Jose M. Franco (University of Huelva) and Hisham Abdel-Aal (Drexel University, Philadelphia) for a number of helpful discussions.
Conflicts of Interest
The authors declare no conflict of interest.
References
- Abdel-Aal, H. The relation between wear and irreversible entropy generation in the dry sliding metals. In Proceedings of the Leeds-Lyon Symposium, Lyon, France; 2005. arXiv:1008.0412[cond-mat.mtrl-sci]. [Google Scholar]
- Abdel-Aal, H. Concerning the thermo-thermodynamical aspects of wear regime transition in dry tribosystems. Ann. Univ. Dunaries Jos Galati, Fascicle VIII 2005, 1221–4590, 41–47. [Google Scholar]
- Bryant, M.D. Entropy and dissipative processes of friction and wear. FME Trans. 2009, 37, 55–60. [Google Scholar]
- Rezasoltani, A.; Khonsari, M.M. On the correlation between mechanical degradation of lubricating greases and entropy. Tribol. Lett. 2014. [Google Scholar] [CrossRef]
- Kuhn, E. Friction and wear in a grease lubricated contact—An energetic Approach. In Tribology-Fundamentals and Advancements; Gegner, J., Ed.; InTech: Rijeka, Croatia, 2013; ISBN 978-953-51-1135-1. [Google Scholar]
- Kluge, G.; Neugebauer, G. Basics of Thermodynamic (in German); Deutscher Verlag der Wissenschaften: Berlin, Germany, 1976. [Google Scholar]
- De Groot, S.R.; Mazur, P. Basics of Thermodynamic of Irreversible Processes (in German); Bibliographisches Institut: Berlin, Germany, 1984; ISBN 13:978-341001620. [Google Scholar]
- Abdel-Aal, H. Thermodynamics of Wear. In Encyclopedia of Tribology; Wang, Q.J., Chung, Y.-W., Eds.; Springer US: New York, NY, USA, 2013; ISBN 978-0-387-92896-8. [Google Scholar]
- Fleischer, G. The energetic level of friction couples (In German). Schmierungstechnik 1985, 16, 12. [Google Scholar]
- Franco, J.M.; Delgado, M.A.; Valencia, C. Combined oxidative-shear resistance of castor oil-based lubricating greases. In Proceedings of the 3rd Arnold Tross Colloquium, Hamburg, Germany; 2007. [Google Scholar]
- Kuhn, E.; Balan, C. Experimental procedure for the evaluation of the friction energy of lubricating greases. Wear 1997, 209, 237–240. [Google Scholar] [CrossRef]
- Kuhn, E. An algorithm to estimate the friction energy of a grease lubricated contact. Ind. Lubric. Tribol. 2000, 52, 4. [Google Scholar] [CrossRef]
© 2015 by the authors; licensee MDPI, Basel, Switzerland. This article is an open access article distributed under the terms and conditions of the Creative Commons Attribution license (http://creativecommons.org/licenses/by/4.0/).