Abstract
This paper deals with the development of an original apparatus called TRIBOLUMEN designed specifically for friction experiments on transparent materials. The friction measurement is synchronized with an acoustic emission (AE) sensor and the device is also equipped with a high-speed camera offering a direct view at the interface to gain a deeper understanding of tribological mechanisms. The TRIBOLUMEN device is in ball-on-flat contact configuration with a range of strokes from 5 to 500 µm and an oscillation frequency from 5 to 600 Hz. The experiments showed that this device has an adequate rigidity and can detect subtle friction modifications of the oscillating contacts. The observation of a steel-on-glass contact in real-time highlighted the initiation of Hertzian cracks followed by the formation of debris in the contact. Using the synchronous measurement, these mechanisms were clearly associated with different stages in the friction measurement and in the AE signals, which permitted to identify the AE signature of Hertzian cracks.
1. Introduction
Acoustic emission (AE) defines transient mechanical waves produced by the release of elastic stress energy caused in a solid material under mechanical stress [1]. In tribology, the AE technique is used as a very promising technique, for a better understanding of tribological mechanisms. Different accommodation mechanisms can occur in a sliding contact between two materials, which can be related to AE sources [2,3,4]. Mechanisms such as asperities adhesion and asperities plowing [5], generation of material debris [6,7] and cracking [8,9] are sources of AE that can generate specific acoustic signatures.
Several studies have investigated the relationships between AE signals and tribological phenomena as reviewed by Feng et al. [10]. Hase et al. [11] built an interesting correlation map of AE frequency spectra and several phenomena associated with deformation and fracture. The correlation between AE frequency and tribological phenomena, such as rolling and collisions of surface asperities [12,13,14], detachment and transfer of material consecutive to an adhesive interaction and plastic deformations and cutting, ploughing or fragmentation by relatively sharp asperities [15], were also investigated. In addition, the relationship between AE amplitude and wear production, on one side, and internal plastic flow of the tribological circuit, on the other side, were explored [16]. The AE counts rate and wear mechanism relationship were also examined [17]. AE energy measurement was correlated to sliding velocity changes [18] and friction work during the slip [19]. Concerning more specific interfacial mechanisms, a correlation between AE averaged signals (root mean square average, RMS) and oxides formation in a dry sliding contact [20] and material transfer in a lubricated sliding contact were also highlighted [21].
In the particular case of fretting, which is a tribological phenomenon associated with a very small alternated displacement amplitude between two surfaces in contact, the AE technique was also used to investigate the damage mechanisms of fretting contacts in different regimes. A considerable number of studies are conducted on the evaluation of tribological mechanisms using AE amplitude [22,23,24,25,26,27]. For instance, they show that the debris generation on the surfaces during fretting and the ploughing action of the contact can lead to an increase of AE amplitude during a test. Moreover, correlations between AE signals and fretting cracks formation and propagation was also established by using the AE hits location [28,29]. Otherwise, a relationship between AE frequency and surface roughness has been examined and showed that that AE signals generated from smooth surfaces had a larger frequency range (0–1 MHz) than those obtained from rougher surfaces (0–200 kHz) [30].
Eventually, for sliding contact between two materials, the region of interest is in the contact and near the contact area, which remains hidden from view or inspection using traditional surface characterization methods. Recently, several tribometers were used to directly observe the third body behavior through the transparent first body (glass and sapphire) and to correlate it to friction events and wear [31,32,33,34,35]. Several benefits can be obtained by performing tribological measurements in real-time. First, it simplifies the correlation between friction data and interface mechanisms. Second, it eliminates the need to remove the sample and thus greatly reduces the risk of surface contamination and loss of debris. As different accommodation mechanisms can be activated simultaneously at different sites of the sliding contact, the interpretation of AE signals and the correlation between acoustic emission signatures and elementary mechanisms is obviously difficult.
The object of this study is to combine these two techniques (real-time observation and AE) in an original device called “TRIBOLUMEN” designed and developed at LGP laboratory specifically for friction experiments on transparent materials. This new device provides instantaneous and real-time observations of sliding contacts to gain a deeper understanding of tribological elementary mechanisms in relation to acoustic emission signals. For optical observations and visible light, one of the sliding surfaces must be transparent. A glass sample is used to show the competency of this combination. The change in the contact area is then correlated to fluctuations in friction and AE signals.
2. Materials and Methods
2.1. Tribolumen
The TRIBOLUMEN apparatus was developed and designed to simulate the fretting phenomena and reciprocating sliding close to fretting conditions on transparent materials. This apparatus was characterized by a large range of strokes (5–500 µm), frequencies (5–600 Hz) and a load capacity up to 100 N.
TRIBOLUMEN was composed of (Figure 1)
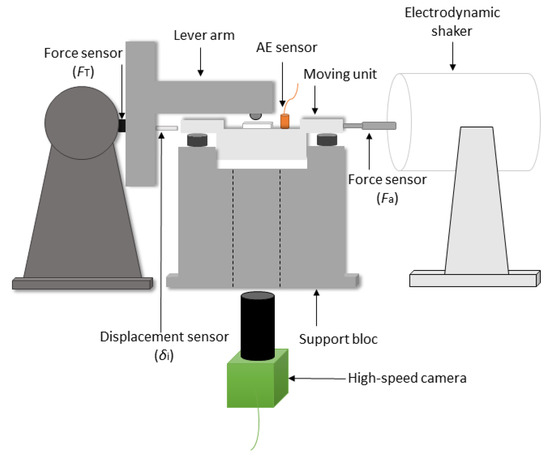
Figure 1.
A schematic view of TRIBOLUMEN showing the principal components.
- An electrodynamic shaker (LDS—V406/8™) generating a reciprocating motion with a controlled displacement amplitude and frequency. The maximum tangential force delivered was about 100 N.
- A moving unit with a flat specimen holder.
- An upper lever arm with a ball holder allowing the application of the load.
- A force sensor located at the outlet of the shaker and in contact with the platform allowing the measurement of the actuator force Fa.
- A force sensor fixed on the upper arm for the tangential force measurement FT.
- A magnetic contactless sensor for the contact displacement measurement δi.
TRIBOLUMEN command system can impose the displacement amplitude or the actuator force amplitude. The set-up was based on ball-on-flat configuration where the flat transparent specimen was placed at the bottom. The minimum frequency of oscillating motion was 5 Hz. The maximum reachable sliding frequency depended on the imposed displacement and on the contact friction (Figure 2a). The device could impose a displacement amplitude until 6 µm with high accuracy (Figure 2b).
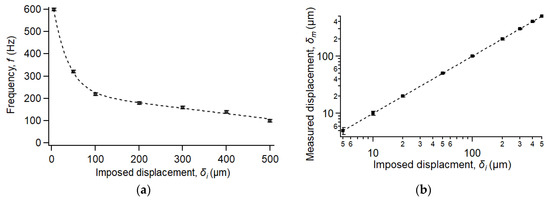
Figure 2.
TRIBOLUMEN operating limits: (a) maximum frequency vs. imposed displacement without contact and (b) measured displacement vs. imposed displacement.
The stiffness of TRIBOLUMEN was checked to ensure the system response avoiding vibrational disturbances. For this purpose, a preliminary reciprocating test was carried out with a displacement of 200 µm, a normal load of 15 N and a frequency ramp from 5 to 50 Hz at a rate of 0.25 Hz/s. The materials pair is a steel ball of 100Cr6 steel (AISI 52100; 6 mm in diameter) and a glass sample. In those conditions, the friction force spectrogram displayed harmonics (see Figure 3). The most intense red fringe (in the lower position) corresponded to the fundamental frequency H0 i.e., the excitation frequency at which the test was carried out with an evolution from 5 to 50 Hz. The odd harmonics H2n+1 were less intense than then the even harmonics H2n, which correspond to a friction signal tending to a common square-like form as in dry contacts. Friction was weakly dependent to the sliding velocity respecting Amontons-Coulomb’s law. Furthermore, this spectrogram shows that the harmonics were very clear and distinct and did not show any great disturbance or interference with horizontal modes. In other words, the device vibration modes did not interfere with the measured signal of friction, which implies that the device had an appropriate stiffness avoiding any vibrational disturbance in the contact [36].
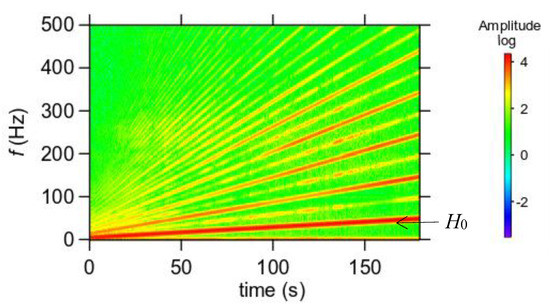
Figure 3.
Time–frequency analysis of the friction force: the even harmonics (more intense) and the odd harmonics (less intense).
2.2. Acoustic Emission (AE) System
Acoustic emission acquisitions were performed using two sensors fixed close to the contact on the moving unit and on the upper arm. As the sensors gave similar signals, only the signals from the one fixed on the moving unit with greater signals amplitude was considered in the rest of this article. The sensor (Pico sensor from Euro Physical Acoustic) was a large band type operating whose maximum sensitivity ranged between 100 and 1000 kHz. The sensor was set using a water-based adhesive containing styrene acrylic copolymer. This adhesive allows a good transmission of acoustic signals, dries in a few seconds and the sensor is easily detached after the experiments. The sensor coupling was then controlled by the Hsu-Nielsen source method described by the standard NF EN 1330–9. The device synchronizes acoustic emission signals with mechanical data acquired by the device, which triggers the high-speed camera.
Before an experimental campaign, a threshold value of 40 dB was chosen to get a finer detection without being disturbed by environmental conditions. Acquisition parameters of AE signals with the peak definition time (PDT), the hit definition time (HDT) and the hit lockout time (HLT) are described in a previous study [5]. Defined values are respectively 200, 800 and 1000 µs. An amplifier that operates with a single-ended was set at 40 dB. The sample rate was set at 1 MSPS (Mega Samples Per Second) for better resolution of the waveform.
2.3. Experimental Conditions
Some preliminary tests were carried out to assess the performance of TRIBOLUMEN by choosing the operating parameters such as the control mode, the excitation frequency, the normal load and the number of cycles.
The experimental settings for this study are described below:
- A ball-on-flat steel/glass contact where the ball was 100Cr6 steel with a diameter of 6 mm.
- A constant normal load of 5 N applied on glass flat. This load corresponded to a maximum contact pressure of 700 MPa and a contact radius of 58 µm.
- A linear sweep of the oscillating frequency from 5 to 50 Hz with a constant increment of 0.25 Hz/s.
- An amplitude of displacement of ±100 µm (i.e., a stroke distance of 200 µm), which corresponded to an alternative friction, closet to fretting conditions and an amplitude of displacement of ±50 µm corresponding to fretting conditions.
- A high-speed camera JAI GO-5100C-USB was positioned on the transparent sample side and passed through the support bloc. The maximum resolution of this camera was about 2464 (H) × 2056 (V) with a pixel size of 3.45 µm and a maximum frame rate of 74 Hz. The camera was set at 1000 pixels × 1056 pixels using a frame rate of 180 fps.
- An optical fiber fixed on the optical system was used to illuminate the contact area between steel ball and glass sample. A modular zoom lenses (magnification × 12) that could be configured to fit nearly the contact area is fixed on the camera. Adapter tubes were also added to the camera in magnification ×1 and ×2.
3. Results
3.1. Friction Analysis
Figure 4 shows the evolution from 5 to 50 Hz of displacement and tangential force in alternative friction. The displacement signal was sinusoidal and its amplitude was set at ± 100 µm. In parallel, the tangential force exhibited a different amplitude according to the frequency with an almost square shape.
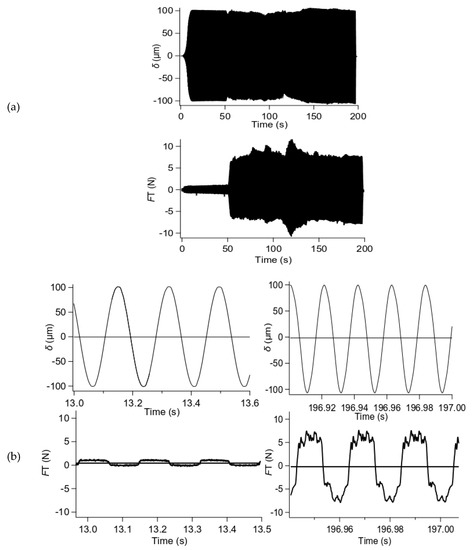
Figure 4.
Displacement and tangential force evolution: (a) from 5 to 50 Hz for a steel ball of 100Cr6 steel against the glass sample at δi = ± 100 µm, FN = 5 N and (b) zoom at 5 Hz (left) and zoom at 50 Hz (right).
The friction coefficient µ was calculated by the ratio of the instantaneous tangential force to the constant normal load. Figure 5a shows the RMS friction coefficient evolution during a test. In this example, the friction coefficient displayed three different stages:
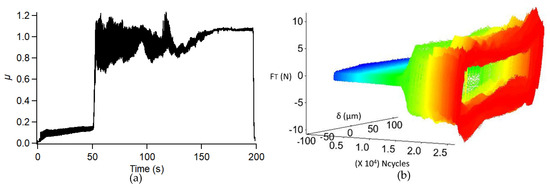
Figure 5.
Time evolution of friction: (a) friction coefficient average (RMS) and (b) friction–displacement log representation.
- An initial stage with a slight increase of the friction between 0 and 0.2 until 50 s.
- An intermediate stage appearing with an abrupt change of friction reaching values between 0.5 and 1.5 with a large discrepancy (0.9 ± 0.4).
- A final steady state stage with an average value of 1.0 ± 0.1.
These observations were related to the changes at the interface between the steel ball and the glass sample. In the literature, those friction variations are usually related to several tribological mechanisms well described by the third body concept [37,38] (e.g., contact conformation, crack propagation in the bodies in contact and the formation, circulation and release of debris out of the contact).
Figure 5b presents the 3D log diagram with the tangential force, the displacement and the number of cycles. It can be observed that the loops took a parallelogram-like shape. Again, the log clearly displayed the three different stages.
3.2. Contact Observation
The observation of the contact between the glass sample and the steel ball in real-time is shown in Figure 6. Newton’s rings of concentric circles, caused by interference fringes due to the elastic deformation of the glass counterface could be observed [39,40]. The inner light grey area defines the extent of the contacting surface. The radius of the contacting surface was about the same as the theoretical diameter calculated from the Hertzian theory and was about 58 µm.
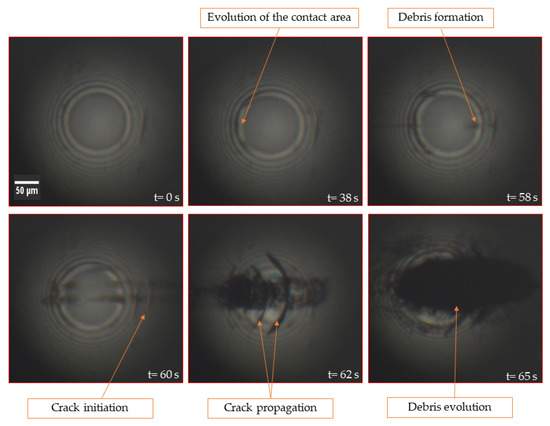
Figure 6.
Series of images extracted from the video of the real-time observation showing the changes of mechanisms in a reciprocating sliding contact for a steel ball of 100Cr6 steel against the glass sample.
Figure 6 presents a series of images extracted from the video of the real-time observation. It illustrates the changes of mechanisms at various times during the reciprocating sliding and can be directly associated with the three stages of friction coefficient previously observed:
- During the initial stage, no damage was observed in the contact area.
- The intermediate stage began by the emission of debris from the glass sample and the formation of Hertzian cracks on the glass surface near the outside edge of the contacting surface. This type of crack propelled by Hertzian contacts was generated only when a significant zone of tension was present [41], and was found only in truly brittle materials such as glass and certain ceramics. These cracks had a semicircular shape whose concave curvature was oriented with the direction of the steel ball.
- The steady stage generated a large amount of debris (the contact area became slightly darker), which formed a homogeneous third body.
Thus, the first debris was related to the first slight increase of friction. The unsteady intermediate stage appeared with an abrupt change of friction and corresponded to the initiation and propagation of large Hertzian cracks (greater than a contact size). They were formed at regular intervals in each sliding passage. Eventually, the accumulated debris forming the homogeneous third body was at the origin of the friction last steady state.
In addition, a comparative test was carried out in the same experimental conditions described above with the amplitude of displacement of 50 µm. In fretting conditions, the real-time observation shows that Hertzian cracks were not observed throughout the entire test. Only the third body composed of particles detached from the rubbing surfaces appeared. Thus, the decrease of displacement amplitude delayed the cracks initiation.
3.3. AE Analysis
During the experiments, acoustic emission was generated in the contact between the glass sample and the steel ball. Figure 7 presents the friction loop synchronized with the displacement and tangential force signals, built from AE hits for the experiment carried out at ±100 µm of displacement, an increase in frequency from 5 to 50 Hz at a constant normal force of 5 N.
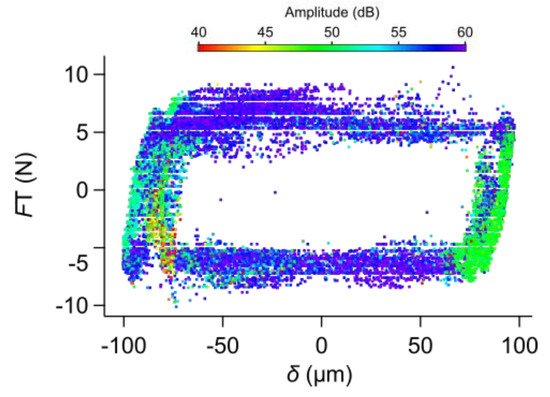
Figure 7.
Amplitude of acoustic emission hits along the friction–displacement loops in the reciprocating regime.
After the first stage of friction, the acoustic activity was detected all over the cycles. It followed the same increasing behavior as for the tangential force. The acoustic activity was slightly more accentuated at the cycle’s extremities where some hits were more pronounced as a consequence of the contact change direction.
During experiments, two signal characteristics were considered: the absolute energy and the centroid frequency. The absolute energy represents the integral of the squared signal over the burst duration. The centroid frequency represents information of the frequency center of mass of AE signals.
The friction evolution could be retrieved using the cumulative absolute energy expressed in attojoules (1 attojoule = 10−18 J) versus time as shown in Figure 8:
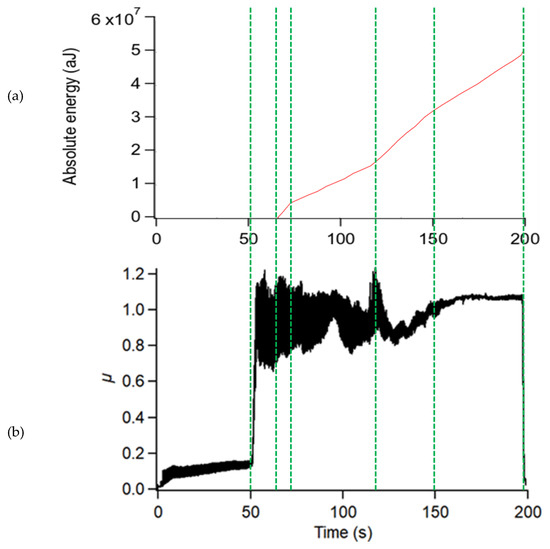
Figure 8.
(a) Representation of different stage for the absolute energy and (b) correlation between absolute energy and coefficient of friction.
- In the initial stage of friction, no events were recorded.
- In the intermediate stage of friction, an increase of cumulative absolute energy was observed. Additionally, a change in the slope can be distinguished. It could be related to the debris formation and crack initiation and propagation.
- In the steady stage of friction, the cumulative energy displayed a monotonous growth.
This synchronization of real-time visualization inside the contact area and AE signatures gave a better understanding of the contact mechanisms. The results showed that the variation of absolute energy and centroid frequency were obviously related to phenomena occurred during the experiments.
The comparison between two experiments carried out at 200 µm (reciprocating conditions) and 100 µm (fretting conditions) shows a clearly dissimilarity in terms of AE signals (see Figure 9). In fretting conditions, the absolute energy became negligible, which had to be related to the absence of the Hertzian crack. This result implies that the initiation of Hertzian crack could be accurately associated with a centroid frequency at 188 ± 1 kHz.
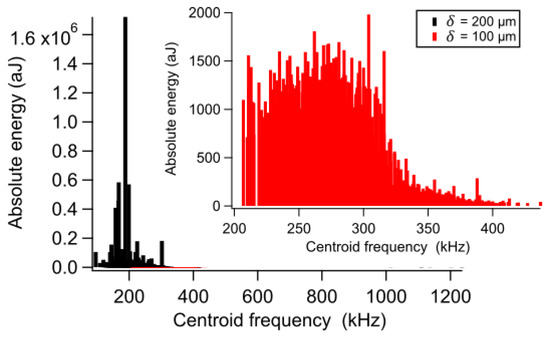
Figure 9.
Comparative absolute energy between the reciprocating regime and the fretting regime (with a zoom on the absolute energy in the fretting regime).
4. Conclusions
The TRIBOLUMEN device was especially developed to investigate the friction behavior of semitransparent contacts. The apparatus could also operate in fretting or in reciprocating conditions and could then give information on the regime changes. In this way, it was equipped with high-speed camera and an AE system and force sensors. The ambition with this tribometer was to clearly and accurately associate elementary tribological mechanisms occurring in a close contact and acoustic emission signals generated by this contact.
Concerning the TRIBOLUMEN device, it was observed that:
- This novel apparatus had an adequate rigidity and could detect subtle friction modifications of oscillating contacts.
- It was characterized by its available large range of frequencies and displacements.
Finally, the following results were obtained with a steel ball-on-flat glass contact:
- In specific tribological conditions, the friction coefficient could be displayed following three reproducible distinct stages.
- These stages were clearly associated with interfacial mechanisms directly observed in the contact during the experiment (low friction, Hertzian cracks and third body formation).
- The tribological mechanisms occurring in the contact were monitored by the acoustic emission acquisition system. The Hertzian crack mechanism affecting the friction was identified at a precise centroid frequency of 188 ± 1 kHz.
Author Contributions
Conceptualization, Methodology & Project administration M.Y. and J.-Y.P.; Investigation, Data curation & Formal analysis, K.J.; Writing-original draft preparation, K.J., M.Y. and J.-Y.P.; Supervision & Review, M.Y., J.-Y.P. and J.D. All authors have read and agree to the published version of the manuscript.
Funding
This research was funded by the French Ministry of Higher Education, Research and Innovation.
Conflicts of Interest
The authors declare no conflict of interest.
References
- Hartman, W.F. Towards standards for acoustic emission technology. In ASTM: Nondestructive Testing Standards 19–21; Berger, H., Ed.; Gaithersburg, Md.: Baltimore, MD, USA, 1977; pp. 138–146. [Google Scholar] [CrossRef]
- Boness, R.J.; McBride, S.L. Adhesive and abrasive wear studies using acoustic emission techniques. Wear 1991, 149, 41–53. [Google Scholar] [CrossRef]
- Sun, J.; Wood, R.J.K.; Wang, L.; Care, I.; Powrie, H.E.G. Wear monitoring of bearing steel using electrostatic and acoustic emission technique. Wear 2005, 259, 1482–1489. [Google Scholar] [CrossRef]
- Baranov, V.; Kudryavtsev, E.; Sarycgev, G.; Schavelin, V. Acoustic Emission in Friction; Elsevier: Amsterdam, The Netherlands, 2007. [Google Scholar]
- Yahiaoui, M.; Chabert, F.; Paris, J.-Y.; Nassiet, V.; Denape, J. Friction, acoustic emission, and wear mechanisms of a PEKK polymer. Tribol. Int. 2019, 132, 154–164. [Google Scholar] [CrossRef]
- Hase, A.; Mishina, H.; Wada, M. Acoustic emission in elementary processes of friction and wear: In-situ observation of friction surface and AE signals. J. Adv. Mech. Des. Syst. Manuf. 2009, 3, 333–344. [Google Scholar] [CrossRef]
- Hase, A.; Wada, M.; Mishina, H. The relationship between acoustic emissions and wear particles for repeated dry rubbing. Wear 2008, 265, 831–839. [Google Scholar] [CrossRef]
- Mastrogiannis, D.; Antsygina, T.N.; Chishko, K.A.; Mavromatou, C.; Hadjicontis, V. Relationship between electromagnetic and acoustic emissions in deformed piezoelectric media: Microcracking signals. Int. J. Solids Struct. 2015, 56, 118–125. [Google Scholar] [CrossRef]
- Johnson, M.B.; Ozevin, D.; Washer, G.A.; Ono, K.; Gostautas, R.S.; Tamutus, T.A. Acoustic Emission Method for Real-Time Detection of Steel Fatigue Crack in Eyebar. Transp. Res. Rec. 2012, 2313, 72–79. [Google Scholar] [CrossRef]
- Peipei, F.; Borghesani, P.; Smith, W.A.; Randall, R.B.; Peng, Z. A review on the relationships between acoustic emission, friction and wear in mechanical systems. Appl. Mech. Rev. 2019, 72, 020801. [Google Scholar] [CrossRef]
- Hase, A.; Mishina, H.; Wada, M. Correlation between features of acoustic emission signals and mechanical wear mechanisms. Wear 2012, 292, 144–150. [Google Scholar] [CrossRef]
- Asamene, K.; Sundaresan, M. Analysis of experimentally generated friction related acoustic emission signals. Wear 2012, 296, 607–618. [Google Scholar] [CrossRef]
- Ferrer, C.; Salas, F.; Pascual, M.; Orozco, J. Discrete acoustic emission waves during stick-slip friction between steel samples. Tribol. Int. 2010, 43, 1–6. [Google Scholar] [CrossRef]
- Chung, K.H.; Oh, J.K.; Moon, J.T.; Kim, D.E. Particle monitoring method using acoustic emission signal for analysis of slider/disk/particle interaction. Tribol. Int. 2004, 37, 849–857. [Google Scholar] [CrossRef]
- Hase, A.; Wada, M.; Mishina, H. Scanning electron microscope observation study for identification of wear mechanism using acoustic emission technique. Tribol. Int. 2014, 72, 51–57. [Google Scholar] [CrossRef]
- McBride, S.L.; Boness, R.J.; Sobczyk, M.; Viner, M.R. Acoustic emission from lubricated and unlubricated rubbing surfaces. J. Acoust. Emiss. 1989, 8, 192–197. [Google Scholar]
- Lingard, S.; Yu, C.W.; Yau, C.F. Sliding wear studies using acoustic emission. Wear 1993, 162, 597–604. [Google Scholar] [CrossRef]
- Mills-Dadson, B.; Islam, A.I.; Asamene, K.; Sundaresan, M. Monitoring Friction Related Surface Degradation Using Acoustic Emission Technique. Nondestruct. Charact. Composite Mater. Aerospace Eng. Civil Infrastruct. Homeland Secur. 2013, 2013, 8694. [Google Scholar] [CrossRef]
- Taura, H.; Nakayama, K. Behavior of acoustic emissions at the onset of sliding friction. Tribol. Int. 2018, 123, 155–160. [Google Scholar] [CrossRef]
- Benabdallah, H.S.; Aguilar, D.A. Acoustic Emission and its Relationship with Friction and Wear for Sliding Contact. Tribol. Trans. 2008, 51, 738–747. [Google Scholar] [CrossRef]
- Wang, L.; Wood, R.J.K. Acoustic emission from lubricated hybrid contacts. Tribol. Int. 2009, 42, 1629–1637. [Google Scholar] [CrossRef]
- Wade, A.; Copley, R.; Clarke, B.; Alsheikh Omar, A.; Beadling, A.R.; Liskiewicz, T.; Bryant, M. Real-time fretting loop regime transition identification using acoustic emissions. Tribol. Int. 2019, 145, 106149. [Google Scholar] [CrossRef]
- Ito, S.; Shima, M.; Jibiki, T.; Akita, H. The relationship between AE and dissipation energy for fretting wear. Tribol. Int. 2009, 42, 236–242. [Google Scholar] [CrossRef]
- Benítez, A.; Denape, J.; Paris, J.-Y. Interaction between systems and materials in fretting. Wear 2016, 95, 368–369. [Google Scholar] [CrossRef][Green Version]
- Merhej, R.; Beguin, J.-D.; Paris, J.-Y.; Denape, J. Acoustic emission for investigations on fretting wear of ceramic-metal contacts. Eur. Conf. Tribol. 2009, 1, 1–6. [Google Scholar]
- Jibiki, T.; Shima, M.; Akita, H.; Tamura, M. A basic study of friction noise caused by fretting. Wear 2001, 251, 1492–1503. [Google Scholar] [CrossRef]
- Asamene, K.; Williams, W.; Sundaresan, M. Experimental Analysis of Fretting Related Acoustic Emission Signals. In Proceedings of the Volume 7981, Sensors and Smart Structures Technologies for Civil, Mechanical, and Aerospace Systems, San Diego, CA, USA, 15 April 2011. [Google Scholar] [CrossRef]
- Meriaux, J.; Boinet, M.; Fouvry, S.; Lenain, J.-C. Identification of fretting fatigue crack propagation mechanisms using acoustic emission. Tribol. Int. 2010, 43, 2166–2174. [Google Scholar] [CrossRef]
- Cadario, A.; Alfredsson, B. Fretting fatigue experiments and analyses with a spherical contact in combination with constant bulk stress. Tribol. Int. 2006, 39, 1248–1254. [Google Scholar] [CrossRef]
- Alam, M.T.; Sundaresan, M. Characterization of Fretting related Acoustic Emission Signals. Proc. SPIE 2010, 7650. [Google Scholar] [CrossRef]
- Descartes, S.; Berthier, Y. Rheology and flows of solid third bodies: Background and application to an MoS1.6 coating. Wear 2002, 252, 546. [Google Scholar] [CrossRef]
- Shockley, J.M.; Descartes, S.; Irissou, E.; Legoux, J.G.; Chromik, R.R. Third body behavior during dry sliding of cold-sprayed Al-Al2O3 composites: In situ tribometry and microanalysis. Tribol. Lett. 2014, 54, 191. [Google Scholar] [CrossRef]
- Shockley, J.M.; Strauss, H.W.; Chromik, R.R.; Brodusch, N.; Gauvin, R.; Irissou, E.; Legoux, J.-G. In situ tribometry of cold-sprayed Al–Al2O3 composite coatings. Surf. Coat. Technol. 2013, 215, 350. [Google Scholar] [CrossRef]
- Sriraman, K.R.; Strauss, H.W.; Brahimi, S.; Chromik, R.R.; Szpunar, J.A.; Osborne, J.H.; Yue, S. Tribological behavior of electrodeposited Zn, Zn–Ni, Cd and Cd–Ti coatings on low carbon steel substrates. Tribol. Int. 2012, 56, 107. [Google Scholar] [CrossRef]
- Chromik, R.R.; Strauss, H.W.; Scharf, T.W. Materials Phenomena Revealed by In Situ Tribometry. JOM 2012, 64, 35–43. [Google Scholar] [CrossRef]
- Yahiaoui, M.; Rigaud, E.; Mazuyer, D.; Cayer-Barrioz, J. Forced oscillations dynamic tribometer with real-time insights of lubricated interfaces. Rev. Sci. Instrum. 2017, 88, 035101. [Google Scholar] [CrossRef] [PubMed]
- Denape, J.; Lamon, J. Sliding friction of ceramics: Mechanical action of the wear debris. J. Mat. Sci. 1990, 25, 3592–3604. [Google Scholar] [CrossRef]
- Denape, J.; Berthier, Y.; Vincent, L. Wear particle life in a sliding contact dry conditions: Third body approach. Fundamentals of Tribology and Bridging the Gap Between the Macro- and Micro/Nanoscales. In Proceedings of the NATO Advances Study Institute; Bhushan, B., Ed.; Kluwer Academic Publishers: Dordrecht, The Netherlands, 2001; pp. 393–411. [Google Scholar]
- Takeuchi, M.; Inoue, N.; Sato, J. Effect of seawater on fretting water. J. Shinmonoseki 1984, 1–9. [Google Scholar]
- Sato, J.; Shima, M.; Sugawara, T. A fundamental study of fretting damage to glass using an improved apparatus. Wear 1985, 106, 53–61. [Google Scholar] [CrossRef]
- Johnson, K.L.; O’Connor, J.J.; Woodward, A.C. The effect of indenter elasticity on the Hertzian fracture of brittle materials. Proc. R. Soc. 1973, 334, 95–117. [Google Scholar]


© 2020 by the authors. Licensee MDPI, Basel, Switzerland. This article is an open access article distributed under the terms and conditions of the Creative Commons Attribution (CC BY) license (http://creativecommons.org/licenses/by/4.0/).